
Bioimpedance Vector Analysis in Diagnosing Severe and Non-Severe Dengue Patients


Abstract
:1. Introduction
2. Materials and Methods
2.1. Subjects
2.2. Measurements
2.3. Statistical Analysis
3. Results
4. Discussion
5. Conclusions
Acknowledgments
Author Contributions
Conflicts of Interest
Abbreviations
| BIVA | Bioimpedance vector analysis |
| BMI | Body mass index |
| ECF | Extracellular fluid |
| ICF | Intracellular fluid |
References
- World Health Organization. Special Programme for Research; Training in Tropical Diseases. In Dengue: Guidelines for Diagnosis, Treatment, Prevention and Control; World Health Organization: Geneva, Switzerland, 2009. [Google Scholar]
- Ibrahim, F.; Taib, M.N.; Abas, W.A.B.W.; Guan, C.C.; Sulaiman, S. A novel approach to classify risk in dengue hemorrhagic fever (dhf) using bioelectrical impedance analysis (bia). IEEE Trans. Instrum. Meas. 2005, 54, 237–244. [Google Scholar] [CrossRef]
- Ibrahim, F.; Taib, M.N.; Abas, W.A.B.W.; Guan, C.C.; Sulaiman, S. A novel dengue fever (df) and dengue haemorrhagic fever (dhf) analysis using artificial neural network (ann). Comput. Methods Program. Biomed. 2005, 79, 273–281. [Google Scholar] [CrossRef] [PubMed]
- Khalil, S.F.; Mohd Dali, N.S.; Mohktar, M.S.; Ibrahim, F. Validation of Multiple Frequency Bioimpedance Analyzer Using Biological Phantom; IEEE: Miri, Malaysia, 2014. [Google Scholar]
- Lukaski, H.C.; Bolonchuk, W.W.; Hall, C.B.; Siders, W.A. Validation of tetrapolar bioelectrical impedance method to assess human body composition. J. Appl. Physiol. 1986, 60, 1327–1332. [Google Scholar] [PubMed]
- Sutcliffe, J. A review of in vivo experimental methods to determine the composition of the human body. Phys. Med. Biol. 1996, 41, 791–833. [Google Scholar] [CrossRef] [PubMed]
- Van Marken Lichtenbelt, W.D.; Westerterp, K.R.; Wouters, L.; Luijendijk, S. Validation of bioelectrical-impedance measurements as a method to estimate body-water compartments. Am. J. Clin. Nutr. 1994, 60, 159–166. [Google Scholar] [PubMed]
- Yanovski, S.Z.; Hubbard, V.S.; Heymsfield, S.B.; Lukaski, H.C. Bioelectrical impedance analysis in body composition measurement: National institutes of health technology assessment conference statement. Am. J. Clin. Nutr. 1996, 64, 524S–532S. [Google Scholar]
- Böhm, A.; Heitmann, B. The use of bioelectrical impedance analysis for body composition in epidemiological studies. Eur. J. Clin. Nutr. 2013, 67, S79–S85. [Google Scholar] [CrossRef] [PubMed]
- Kyle, U.G.; Bosaeus, I.; De Lorenzo, A.D.; Deurenberg, P.; Elia, M.; Gómez, J.M.; Heitmann, B.L.; Kent-Smith, L.; Melchior, J.-C.; Pirlich, M. Bioelectrical impedance analysis—Part I: Review of principles and methods. Clin. Nutr. 2004, 23, 1226–1243. [Google Scholar] [CrossRef] [PubMed]
- Khalil, S.F.; Mohktar, M.S.; Ibrahim, F. The theory and fundamentals of bioimpedance analysis in clinical status monitoring and diagnosis of diseases. Sensors 2014, 14, 10895–10928. [Google Scholar] [CrossRef] [PubMed]
- Buffa, R.; Floris, G.U.; Putzu, P.F.; Marini, E. Body composition variations in ageing. Coll. Antropol. 2011, 35, 259–265. [Google Scholar] [PubMed]
- Baumgartner, R.N.; Chumlea, W.C.; Roche, A.F. Bioelectric impedance phase angle and body composition. Am. J. Clin. Nutr. 1988, 48, 16–23. [Google Scholar] [PubMed]
- Piccoli, A.; Rossi, B.; Pillon, L.; Bucciante, G. A new method for monitoring body fluid variation by bioimpedance analysis: The rxc graph. Kidney Int. 1994, 46, 534–539. [Google Scholar] [CrossRef] [PubMed]
- Piccoli, A.; Piazza, P.; Noventa, D.; Pillon, L.; Zaccaria, M. A new method for monitoring hydration at high altitude by bioimpedance analysis. Med. Sci. Sports Exerc. 1996, 28, 1517–1522. [Google Scholar] [CrossRef] [PubMed]
- Piccoli, A.; Pillon, L.; Dumler, F. Impedance vector distribution by sex, race, body mass index, and age in the united states: Standard reference intervals as bivariate z scores. Nutrition 2002, 18, 153–167. [Google Scholar] [CrossRef]
- Piccoli, A.; Pastori, G. Biva Software; University of Padua: Padua, Italy, 2002. [Google Scholar]
- Buffa, R.; Mereu, E.; Comandini, O.; Ibanez, M.; Marini, E. Bioelectrical impedance vector analysis (biva) for the assessment of two-compartment body composition. Eur. J. Clin. Nutr. 2014, 68, 1234–1240. [Google Scholar] [CrossRef] [PubMed]
- Barbosa-Silva, M.C.G.; Barros, A.J. Bioelectrical impedance analysis in clinical practice: A new perspective on its use beyond body composition equations. Curr. Opin. Clin. Nutr. Metab. Care 2005, 8, 311–317. [Google Scholar] [CrossRef] [PubMed]
- Buffa, R.; Baali, A.; Lahmam, A.; Amor, H.; Zouini, M.; Floris, G.; Racugno, W.; Domínguez-Bello, M.G.; Marini, E. Assessment of nutritional status in the amazigh children of amizmiz (azgour valley, high atlas and morocco). J. Trop. Pediatr. 2009, 55, 406–408. [Google Scholar] [CrossRef] [PubMed]
- Buffa, R.; Mereu, R.; Putzu, P.; Floris, G.; Marini, E. Bioelectrical impedance vector analysis detects low body cell mass and dehydration in patients with Alzheimer’s disease. J. Nutr. Health Aging 2010, 14, 823–827. [Google Scholar] [CrossRef] [PubMed]
- Ibrahim, F.; Faisal, T.; Salim, M.M.; Taib, M.N. Non-invasive diagnosis of risk in dengue patients using bioelectrical impedance analysis and artificial neural network. Med. Biol. Eng. Comput. 2010, 48, 1141–1148. [Google Scholar] [CrossRef] [PubMed]
- Ibrahim, F.; Taib, M.N.; Sulaiman, S.; Abas, W.W. Dengue fever (DF) and dengue haemorrhagic fever (DHF) symptoms analysis from an expert system perspective. In Proceedings of the IEEE International Multi Topic Conference 2001: Technology for the 21st Century, Lahore, Pakistan, 30–30 December 2001; pp. 212–215.
- Biodynamics Corporation. BIA450 bioimpedance analyzer user’s guide. In Basic Principles of Bioimpedance Testing, 1st ed.; Biodynamics Corporation: Shoreline, WA, USA, 2014; pp. 1–25. [Google Scholar]
- Kyle, U.G.; Genton, L.; Karsegard, L.; Slosman, D.O.; Pichard, C. Single prediction equation for bioelectrical impedance analysis in adults aged 20–94 years. Nutrition 2001, 17, 248–253. [Google Scholar] [CrossRef]
- Buchholz, A.C.; Bartok, C.; Schoeller, D.A. The validity of bioelectrical impedance models in clinical populations. Nutr. Clin. Pract. 2004, 19, 433–446. [Google Scholar] [CrossRef] [PubMed]
- Kyle, U.G.; Bosaeus, I.; De Lorenzo, A.D.; Deurenberg, P.; Elia, M.; Manuel Gómez, J.; Lilienthal Heitmann, B.; Kent-Smith, L.; Melchior, J.-C.; Pirlich, M. Bioelectrical impedance analysis—Part II: Utilization in clinical practice. Clin. Nutr. 2004, 23, 1430–1453. [Google Scholar] [CrossRef] [PubMed]
- Mahalanobis, P.C. On the generalized distance in statistics. Proc. Natl. Inst. Sci. (Calcutta) 1936, 2, 49–55. [Google Scholar]
- Rigau-Pérez, J.G.; Clark, G.G.; Gubler, D.J.; Reiter, P.; Sanders, E.J.; Vorndam, A.V. Dengue and dengue haemorrhagic fever. Lancet 1998, 352, 971–977. [Google Scholar] [CrossRef]
- Srikiatkhachorn, A.; Krautrachue, A.; Ratanaprakarn, W.; Wongtapradit, L.; Nithipanya, N.; Kalayanarooj, S.; Nisalak, A.; Thomas, S.J.; Gibbons, R.V.; Mammen, M.P., Jr.; et al. Natural history of plasma leakage in dengue hemorrhagic fever: A serial ultrasonographic study. Pediatr. Infect. Dis. J. 2007, 26, 283–290. [Google Scholar] [CrossRef] [PubMed]
- Nimmannitya, S.; Halstead, S.B.; Cohen, S.N.; Margiotta, M.R. Dengue and chikungunya virus infection in man in thailand, 1962–1964. I. Observations on hospitalized patients with hemorrhagic fever. Am. J. Trop. Med. Hyg. 1969, 18, 954–971. [Google Scholar] [PubMed]
- Norman, K.; Stobäus, N.; Pirlich, M.; Bosy-Westphal, A. Bioelectrical phase angle and impedance vector analysis-clinical relevance and applicability of impedance parameters. Clin. Nutr. 2012, 31, 854–861. [Google Scholar] [CrossRef] [PubMed]
- Schwenk, A.; Beisenherz, A.; Römer, K.; Kremer, G.; Salzberger, B.; Elia, M. Phase angle from bioelectrical impedance analysis remains an independent predictive marker in hiv-infected patients in the era of highly active antiretroviral treatment. Am. J. Clin. Nutr. 2000, 72, 496–501. [Google Scholar] [PubMed]
- Selberg, O.; Selberg, D. Norms and correlates of bioimpedance phase angle in healthy human subjects, hospitalized patients, and patients with liver cirrhosis. Eur. J. Appl. Physiol. 2002, 86, 509–516. [Google Scholar] [CrossRef] [PubMed]
- Piccoli, A.; Nigrelli, S.; Caberlotto, A.; Bottazzo, S.; Rossi, B.; Pillon, L.; Maggiore, Q. Bivariate normal values of the bioelectrical impedance vector in adult and elderly populations. Am. J. Clin. Nutr. 1995, 61, 269–270. [Google Scholar] [PubMed]
- Saragat, B.; Buffa, R.; Mereu, E.; Succa, V.; Cabras, S.; Mereu, R.; Viale, D.; Putzu, P.; Marini, E. Nutritional and psycho-functional status in elderly patients with alzheimer’s disease. J. Nutr. Health Aging 2012, 16, 231–236. [Google Scholar] [CrossRef] [PubMed]
- Nescolarde, L.; Yanguas, J.; Medina, D.; Rodas, G.; Rosell-Ferrer, J. Assessment and follow-up of muscle injuries in athletes by bioimpedance: Preliminary results. In Proceedings of the 2011 Annual International Conference of the IEEE Engineering in Medicine and Biology Society, EMBC, Boston, MA, USA, 30 August–3 September 2011; pp. 1137–1140.
- Baldwin, C.E.; Paratz, J.D.; Bersten, A.D. Body composition analysis in critically ill survivors a comparison of bioelectrical impedance spectroscopy devices. J. Parenter. Enter. Nutr. 2012, 36, 306–315. [Google Scholar] [CrossRef] [PubMed]
- Bosy-Westphal, A.; Danielzik, S.; Dörhöfer, R.-P.; Piccoli, A.; Müller, M.J. Patterns of bioelectrical impedance vector distribution by body mass index and age: Implications for body-composition analysis. Am. J. Clin. Nutr. 2005, 82, 60–68. [Google Scholar] [PubMed]
- Siváková, D.; Vondrová, D.; Valkovič, P.; Cvíčelová, M.; Danková, Z.; Luptáková, L. Bioelectrical impedance vector analysis (biva) in slovak population: Application in a clinical sample. Cent. Eur. J. Biol. 2013, 8, 1094–1101. [Google Scholar] [CrossRef]
- Libraty, D.H.; Endy, T.P.; Kalayanarooj, S.; Chansiriwongs, W.; Nisalak, A.; Green, S.; Ennis, F.A.; Rothman, A.L. Assessment of body fluid compartment volumes by multifrequency bioelectrical impedance spectroscopy in children with dengue. Trans. R. Soc. Trop. Med. Hyg. 2002, 96, 295–299. [Google Scholar] [CrossRef]
- Faisal, T.; Ibrahim, F.; Taib, M.N. Analysis of significant factors for dengue infection prognosis using the self organizing map. In Proceedings of the 30th Annual International Conference of the IEEE Engineering in Medicine and Biology Society, EMBS 2008, Vancouver, BC, Canada, 20–25 August 2008; pp. 5140–5143.
- Ibrahim, F.; Ooi, K.; Ismail, N.; Taib, M.; Abas, W. Analysis of water compartment in dengue patients. In Proceedings of the 27th Annual International Conference of the Engineering in Medicine and Biology Society, IEEE-EMBS 2005, Shanghai, China, 17–18 January 2006; pp. 4130–4133.
- Norman, K.; Pirlich, M.; Sorensen, J.; Christensen, P.; Kemps, M.; Schütz, T.; Lochs, H.; Kondrup, J. Bioimpedance vector analysis as a measure of muscle function. Clin. Nutr. 2009, 28, 78–82. [Google Scholar] [CrossRef] [PubMed]
- Barbosa-Silva, M.C.G.; Barros, A.J.; Wang, J.; Heymsfield, S.B.; Pierson, R.N. Bioelectrical impedance analysis: Population reference values for phase angle by age and sex. Am. J. Clin. Nutr. 2005, 82, 49–52. [Google Scholar] [PubMed]
- Ribeiro, S.M.L.; Miyamoto, M.V.; Melo, C.M.D.; Kehayias, J. Bioelectrical impedance vectorial analysis and nutritional status of older women according to body mass index. Rev. Bras. Cineantropometria Desempenho Hum. 2011, 13, 415–421. [Google Scholar]
- Neto, J.V.; De Melo, C.M.; Ribeiro, S.M.L. Effects of three-month intake of synbiotic on inflammation and body composition in the elderly: A pilot study. Nutrients 2013, 5, 1276–1286. [Google Scholar] [CrossRef] [PubMed]


| Study Groups | Group 1 | Group 2 | ANOVA Test | Student t-Test | |||
|---|---|---|---|---|---|---|---|
| F | p-Value | T | p-Value | ||||
| Males | |||||||
| N | 124 | 123 | - | - | - | - | |
| Mean ± SD | Age | 32.5 ± 9.2 | 31.3 ± 9.8 | 1.0 | 0.3 | 1.0 | 0.3 |
| Weight | 70.4 ± 9.4 | 67.9 ± 16.8 | 4.3 | <0.05 | 2.1 | <0.05 | |
| Height | 169.1 ± 6.1 | 169.6 ± 7.0 | 0.5 | 0.5 | −0.7 | 0.5 | |
| BMI | 24.7 ± 3.5 | 23.6 ± 5.5 | 0.4 | 0.5 | 2.4 | <0.05 | |
| PhA | 7.1 ± 0.5 | 6.2 ± 0.9 | 97.6 | <0.05 | 2.0 | <0.05 | |
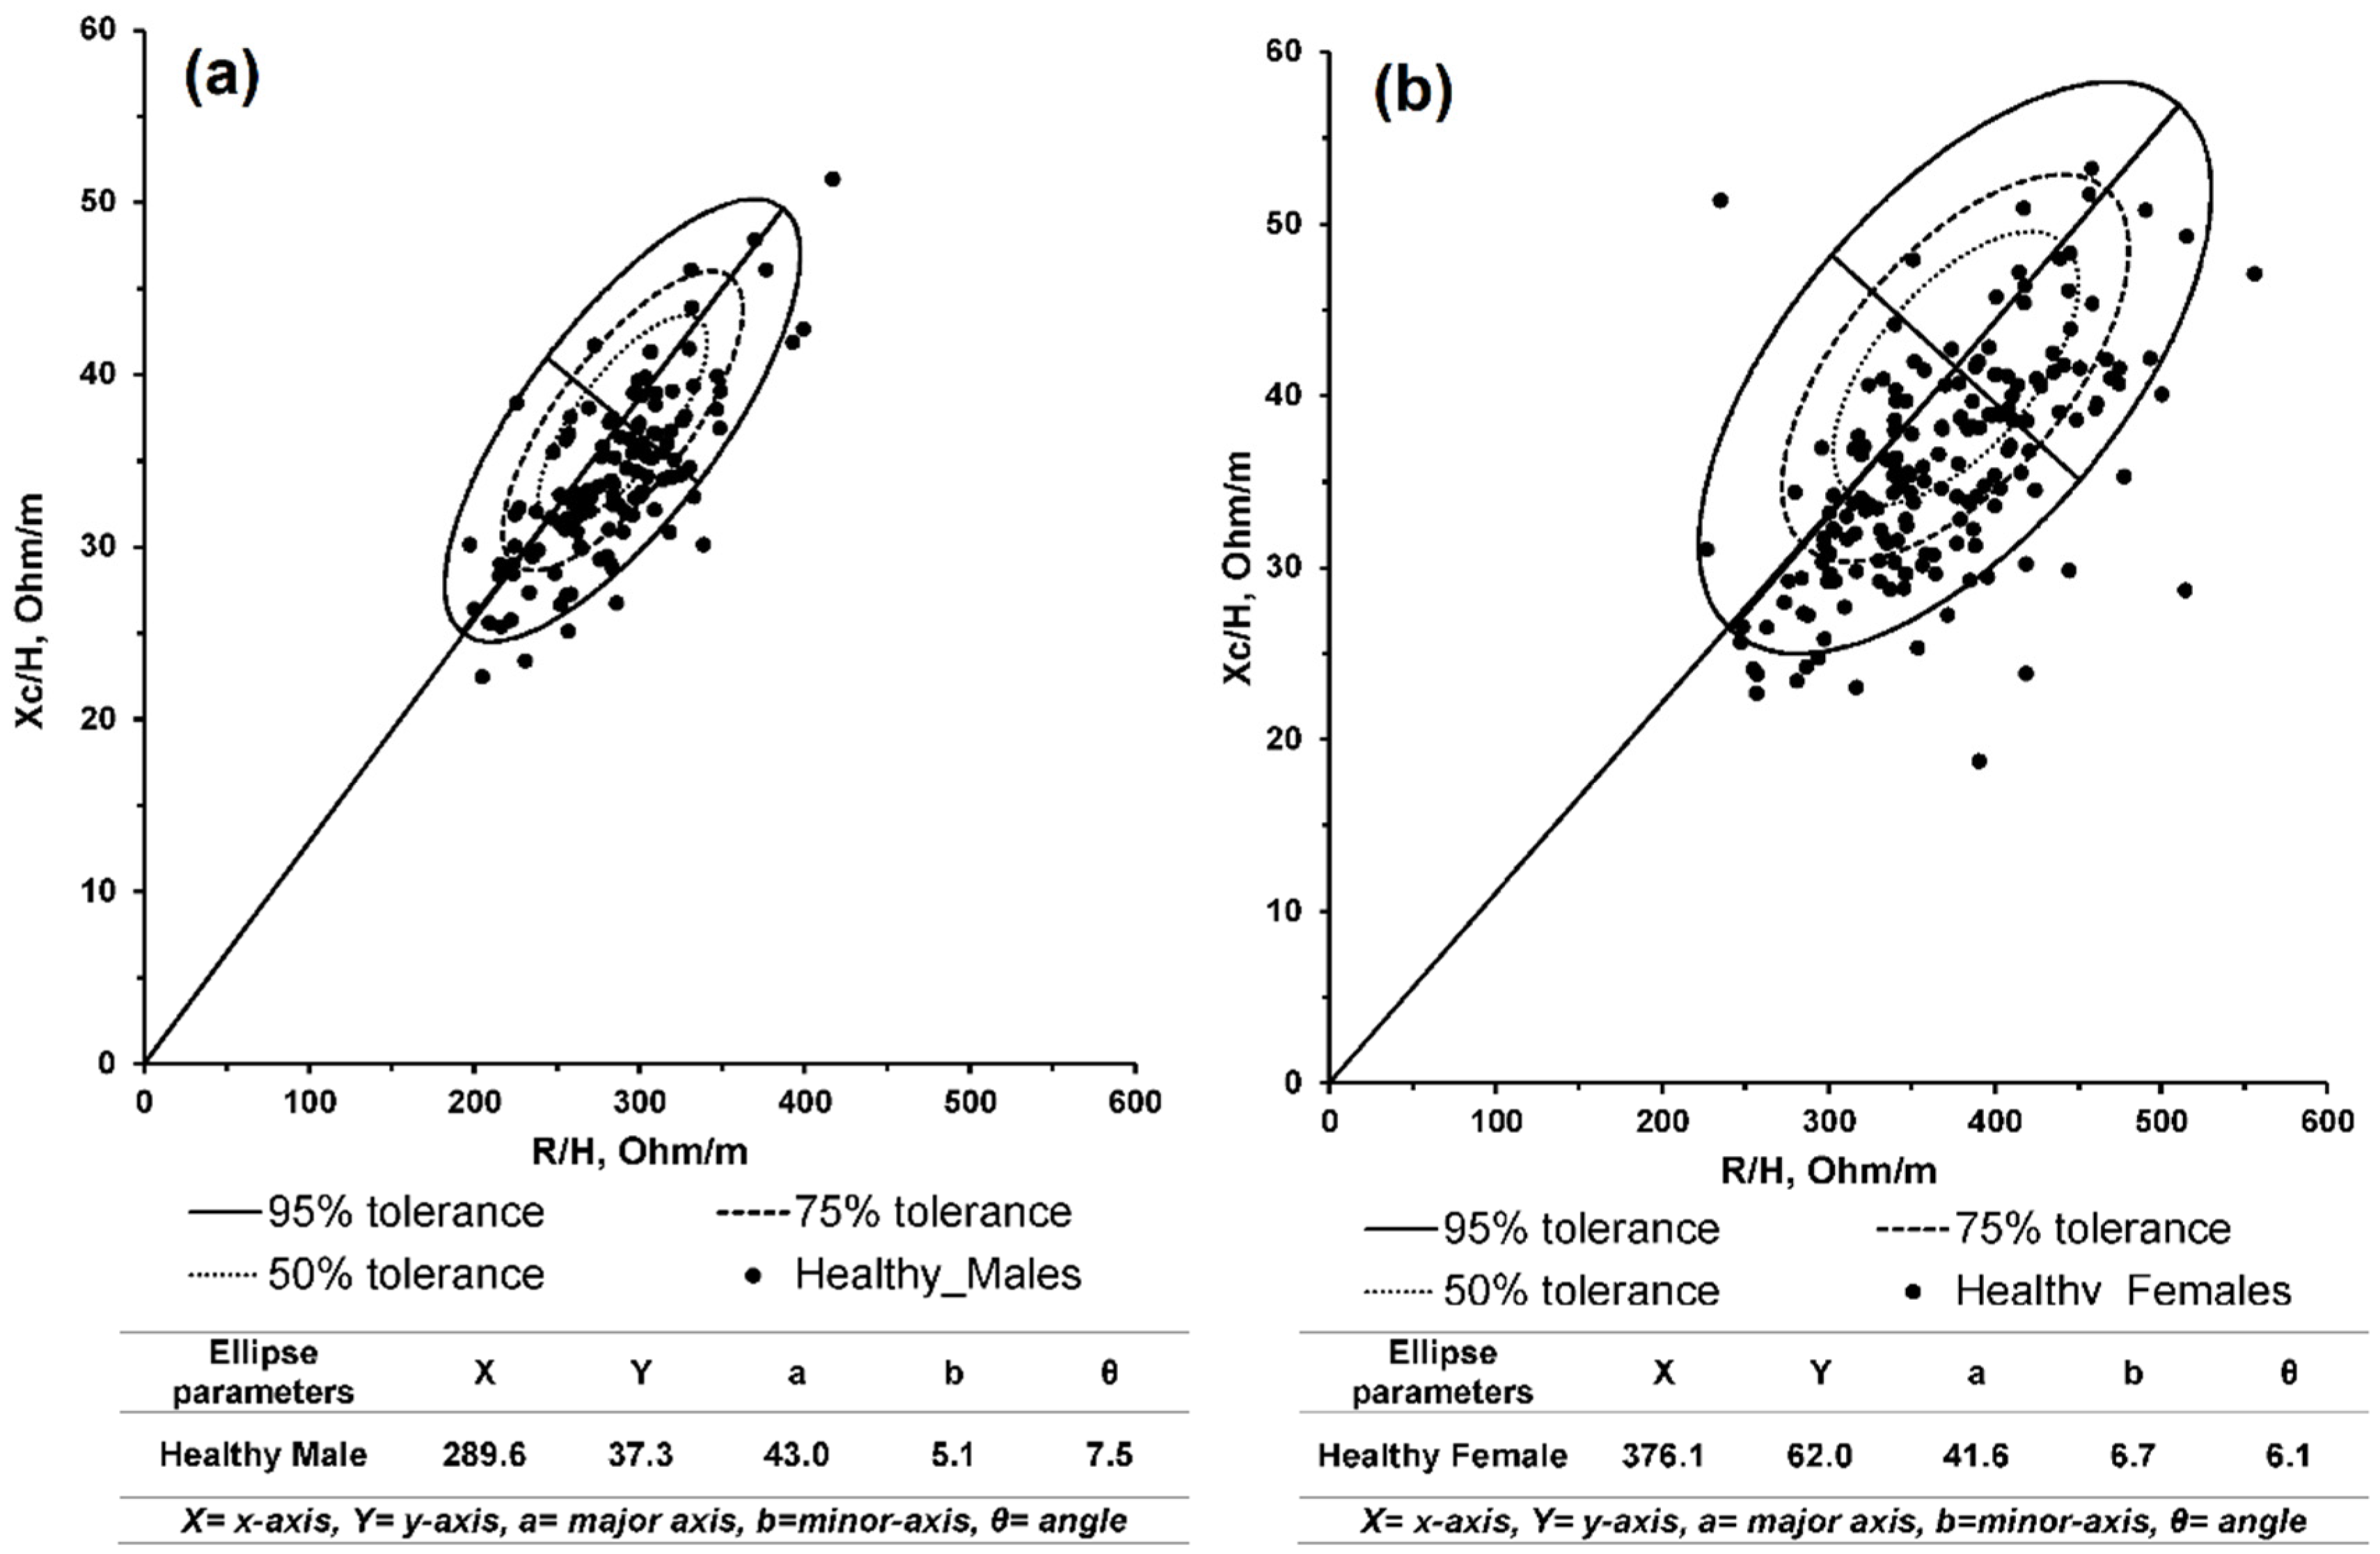
| R/H | 289.6 ± 43.0 | 276.2 ± 55.7 | <0.05 | 0.9 | -0.2 | 0.9 | |
| Xc/H | 37.3 ± 5.1 | 32.7 ± 6.9 | 3.9 | 0.1 | 9.9 | <0.05 | |
| Females | |||||||
| N | 175 | 82 | - | - | - | - | |
| Mean ± SD | Age | 35.4 ± 10.6 | 34.8 ± 11.9 | 4.7 | 0.4 | 2.8 | 0.4 |
| Weight | 65.8 ± 12.5 | 60.2 ± 14.2 | 0.7 | <0.05 | 0.8 | <0.05 | |
| Height | 157.3 ± 5.4 | 158.6 ± 6.1 | 2.6 | 0.1 | −1.6 | 0.1 | |
| BMI | 24.9 ± 4.9 | 24.0 ± 5.9 | 1.3 | 0.2 | 1.1 | 0.2 | |
| PhA | 5.9 ± 0.6 | 5.2 ± 0.6 | 67.4 | <0.05 | 8.2 | <0.05 | |
| R/H | 376.1 ± 62.5 | 332.3 ± 61.0 | 0.4 | 0.5 | 0.6 | 0.5 | |
| Xc/H | 41.6 ± 6.7 | 35.4 ± 8.9 | 3.7 | <0.05 | 9.8 | <0.05 | |
| Dengue Groups | Non-Severe | Severe | ANOVA Test | Student t Test | |||
|---|---|---|---|---|---|---|---|
| F | p-Value | T | p-Value | ||||
| Males | |||||||
| N | 73 | 50 | - | - | - | - | |
| Mean ± SD | Age | 30.2 ± 9.8 | 32.9 ± 9.7 | 2.3 | 0.1 | 1.0 | 0.3 |
| Weight | 65.0 ± 14.8 | 60.0 ± 15.0 | 3.5 | 0.1 | 2.1 | <0.05 | |
| Height | 169.4 ± 6.7 | 169.9 ± 7.3 | 0.2 | 0.7 | −0.7 | 0.5 | |
| BMI | 22.7 ± 5.2 | 21.2 ± 4.9 | 2.7 | 0.1 | 2.4 | <0.05 | |
| PhA | 6.8 ± 0.4 | 5.2 ± 0.7 | 259.4 | <0.05 | 2.0 | 0.05 | |
| R/H | 288.6 ± 57.4 | 258.1 ± 48.1 | 9.5 | <0.05 | -0.2 | 0.9 | |
| Xc/H | 33.1 ± 6.7 | 32.0 ± 7.2 | 0.8 | 0.4 | 9.9 | <0.05 | |
| Females | |||||||
| N | 37 | 31 | - | - | - | - | |
| Mean ± SD | Age | 34.3 ± 12.2 | 33.9 ± 11.1 | <0.05 | 0.9 | −0.1 | 0.9 |
| Weight | 57.7 ± 14.2 | 63.1 ± 12.0 | 2.8 | 0.1 | 1.7 | 0.1 | |
| Height | 158.6 ± 6.9 | 158.7 ± 5.2 | <0.05 | 0.9 | 0.1 | 0.9 | |
| BMI | 23.2 ± 6.4 | 25.2 ± 5.2 | 2.0 | 0.2 | 1.4 | 0.2 | |
| PhA | 5.7 ± 0.2 | 4.9 ± 0.5 | 73.7 | <0.05 | 8.6 | <0.05 | |
| R/H | 335.9 ± 41.1 | 329.2 ± 74.6 | 12.6 | <0.05 | −3.5 | <0.05 | |
| Xc/H | 36.2 ± 8.5 | 34.6 ± 9.2 | 2.5 | 0.1 | −1.6 | 0.1 | |
| Study Groups | Helathy | Non-Severe | Severe | ANOVA Test | Student t Test | |||
|---|---|---|---|---|---|---|---|---|
| F | p-Value | T | p-Value | |||||
| Males | ||||||||
| Mean ± SD | Weight | 70.4 ± 9.9 | 64.9 ± 14.7 | 60.0 ± 14.9 | 4.6 | <0.05 | 3.9 | <0.05 |
| ECF/ICF | 0.7 ± 0.1 | 0.8 ± .03 | 0.9 ± 0.1 | 0.1 | 121.2 | <0.05 | 81.6 | |
| PhA | 7.1 ± 0.5 | 6.7 ± 0.3 | 5.2 ± 0.7 | 223.5 | <0.05 | 151.6 | <0.05 | |
| R/H | 289.9 ± 43.3 | 288.5 ± 57.4 | 258.1 ± 48.1 | 6.8 | <0.05 | 6.8 | <0.05 | |
| Xc/H | 34.2 ± 5.0 | 33.1 ± 6.7 | 31.9 ± 7.2 | 2.5 | 0.1 | 2.244 | 0.1 | |
| Females | ||||||||
| Mean ± SD | Weight | 65.7 ± 12.5 | 63.1 ± 11.9 | 57.7 ± 14.2 | 1.9 | 0.2 | 1.6 | 0.2 |
| ECF/ICF | 0.8 ± 0.03 | 0.9 ± 0.03 | 1.0 ± 0.08 | 235.8 | <0.05 | 85.9 | <0.05 | |
| PhA | 5.8 ± 0.5 | 5.6 ± 0.2 | 4.8 ± 0.5 | 58.9 | <0.05 | 61.5 | <0.05 | |
| R/H | 376.7 ± 62.4 | 335.9 ± 41.0 | 329.1 ± 74.6 | 9.5 | <0.05 | 10.8 | <0.05 | |
| Xc/H | 41.1 ± 6.6 | 36.2 ± 8.4 | 34.6 ± 9.2 | 0.7 | 0.5 | 0.5 | 0.6 | |
© 2016 by the authors; licensee MDPI, Basel, Switzerland. This article is an open access article distributed under the terms and conditions of the Creative Commons Attribution (CC-BY) license (http://creativecommons.org/licenses/by/4.0/).
Share and Cite
Khalil, S.F.; Mohktar, M.S.; Ibrahim, F. Bioimpedance Vector Analysis in Diagnosing Severe and Non-Severe Dengue Patients. Sensors 2016, 16, 911. https://doi.org/10.3390/s16060911
Khalil SF, Mohktar MS, Ibrahim F. Bioimpedance Vector Analysis in Diagnosing Severe and Non-Severe Dengue Patients. Sensors. 2016; 16(6):911. https://doi.org/10.3390/s16060911
Chicago/Turabian StyleKhalil, Sami F., Mas S. Mohktar, and Fatimah Ibrahim. 2016. "Bioimpedance Vector Analysis in Diagnosing Severe and Non-Severe Dengue Patients" Sensors 16, no. 6: 911. https://doi.org/10.3390/s16060911