A Direct Bicarbonate Detection Method Based on a Near-Concentric Cavity-Enhanced Raman Spectroscopy System

College of Information Science & Engineering, Ocean University of China, Qingdao 266000, China
*
Author to whom correspondence should be addressed.
Sensors 2017, 17(12), 2784; https://doi.org/10.3390/s17122784
Submission received: 18 October 2017
/
Revised: 25 November 2017
/
Accepted: 29 November 2017
/
Published: 1 December 2017
(This article belongs to the Special Issue Smart Sensing System for Real-Time Monitoring)
Abstract
:Raman spectroscopy has great potential as a tool in a variety of hydrothermal science applications. However, its low sensitivity has limited its use in common sea areas. In this paper, we develop a near-concentric cavity-enhanced Raman spectroscopy system to directly detect bicarbonate in seawater for the first time. With the aid of this near-concentric cavity-enhanced Raman spectroscopy system, a significant enhancement in HCO3− detection has been achieved. The obtained limit of detection (LOD) is determined to be 0.37 mmol/L—much lower than the typical concentration of HCO3− in seawater. By introducing a specially developed data processing scheme, the weak HCO3− signal is extracted from the strong sulfate signal background, hence a quantitative analysis with R2 of 0.951 is made possible. Based on the spectra taken from deep sea seawater sampling, the concentration of HCO3− has been determined to be 1.91 mmol/L, with a relative error of 2.1% from the reported value (1.95 mmol/L) of seawater in the ocean. It is expected that the near-concentric cavity-enhanced Raman spectroscopy system could be developed and used for in-situ ocean observation in the near future.
1. Introduction
The carbon cycle in the ocean is a dynamic component of the global carbon budget, but the diverse sources and carbon sinks as well as their complex interactions in the ocean remain poorly understood [1,2]. The dissolved inorganic carbon (DIC) in the ocean is the sum of HCO3−, CO32−, H2CO3 and CO2 [3]. The concentration of DIC is about 2.30 mmol/L, with (about 1.95 mmol/L) making up the majority of it [4]. Therefore, bicarbonate is a key factor in carbon cycle research. The modern methods for oceanic carbonate system measurement are mainly involved in total carbon and CO2 partial pressure (pCO2) investigations [5,6]. However, the direct detection of HCO3− and CO32− in seawater it is still a huge challenge due to their low concentrations. Raman spectroscopy is potentially capable of overcoming this challenge on the condition of a significant ensitivity enhancement [7].
In 2004, scientists reported the first attempt to detect HCO3− in water solutions directly by using Raman spectroscopy [8], with a limit of detection (LOD) of 7.5 mmol/L after an integration time of 20 min. They had also tried to enhance the HCO3− signal with an introduced liquid core waveguide [9], eventually obtaining an amplification ratio of 7.8× in the peak intensity. All those efforts still do not make the direct Raman detection of HCO3− in seawater practical due to the fact its concentration is as low as 2 mmol/L. The strong background signal resulting from SO42−, which has a concentration of ~28 mmol/L in seawater [10], makes direct detection of HCO3− even more difficult. With a similar waveguide-based enhancement mechanism, the multi-pass cavity concept has been presented as an effective approach in gas Raman detection with desirable enhancement [11,12,13,14]. Taking such an approach in direct seawater Raman detection is the motivation for the work presented in this article. A near-concentric cavity-enhanced Raman spectroscopy system was specially built for liquid sample detection. With the aid of this system, direct HCO3− Raman detection in seawater becomes readily feasible as expected.
2. Experiment Setup
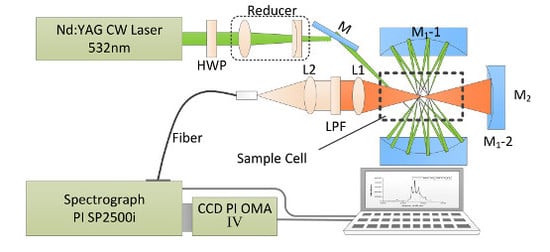
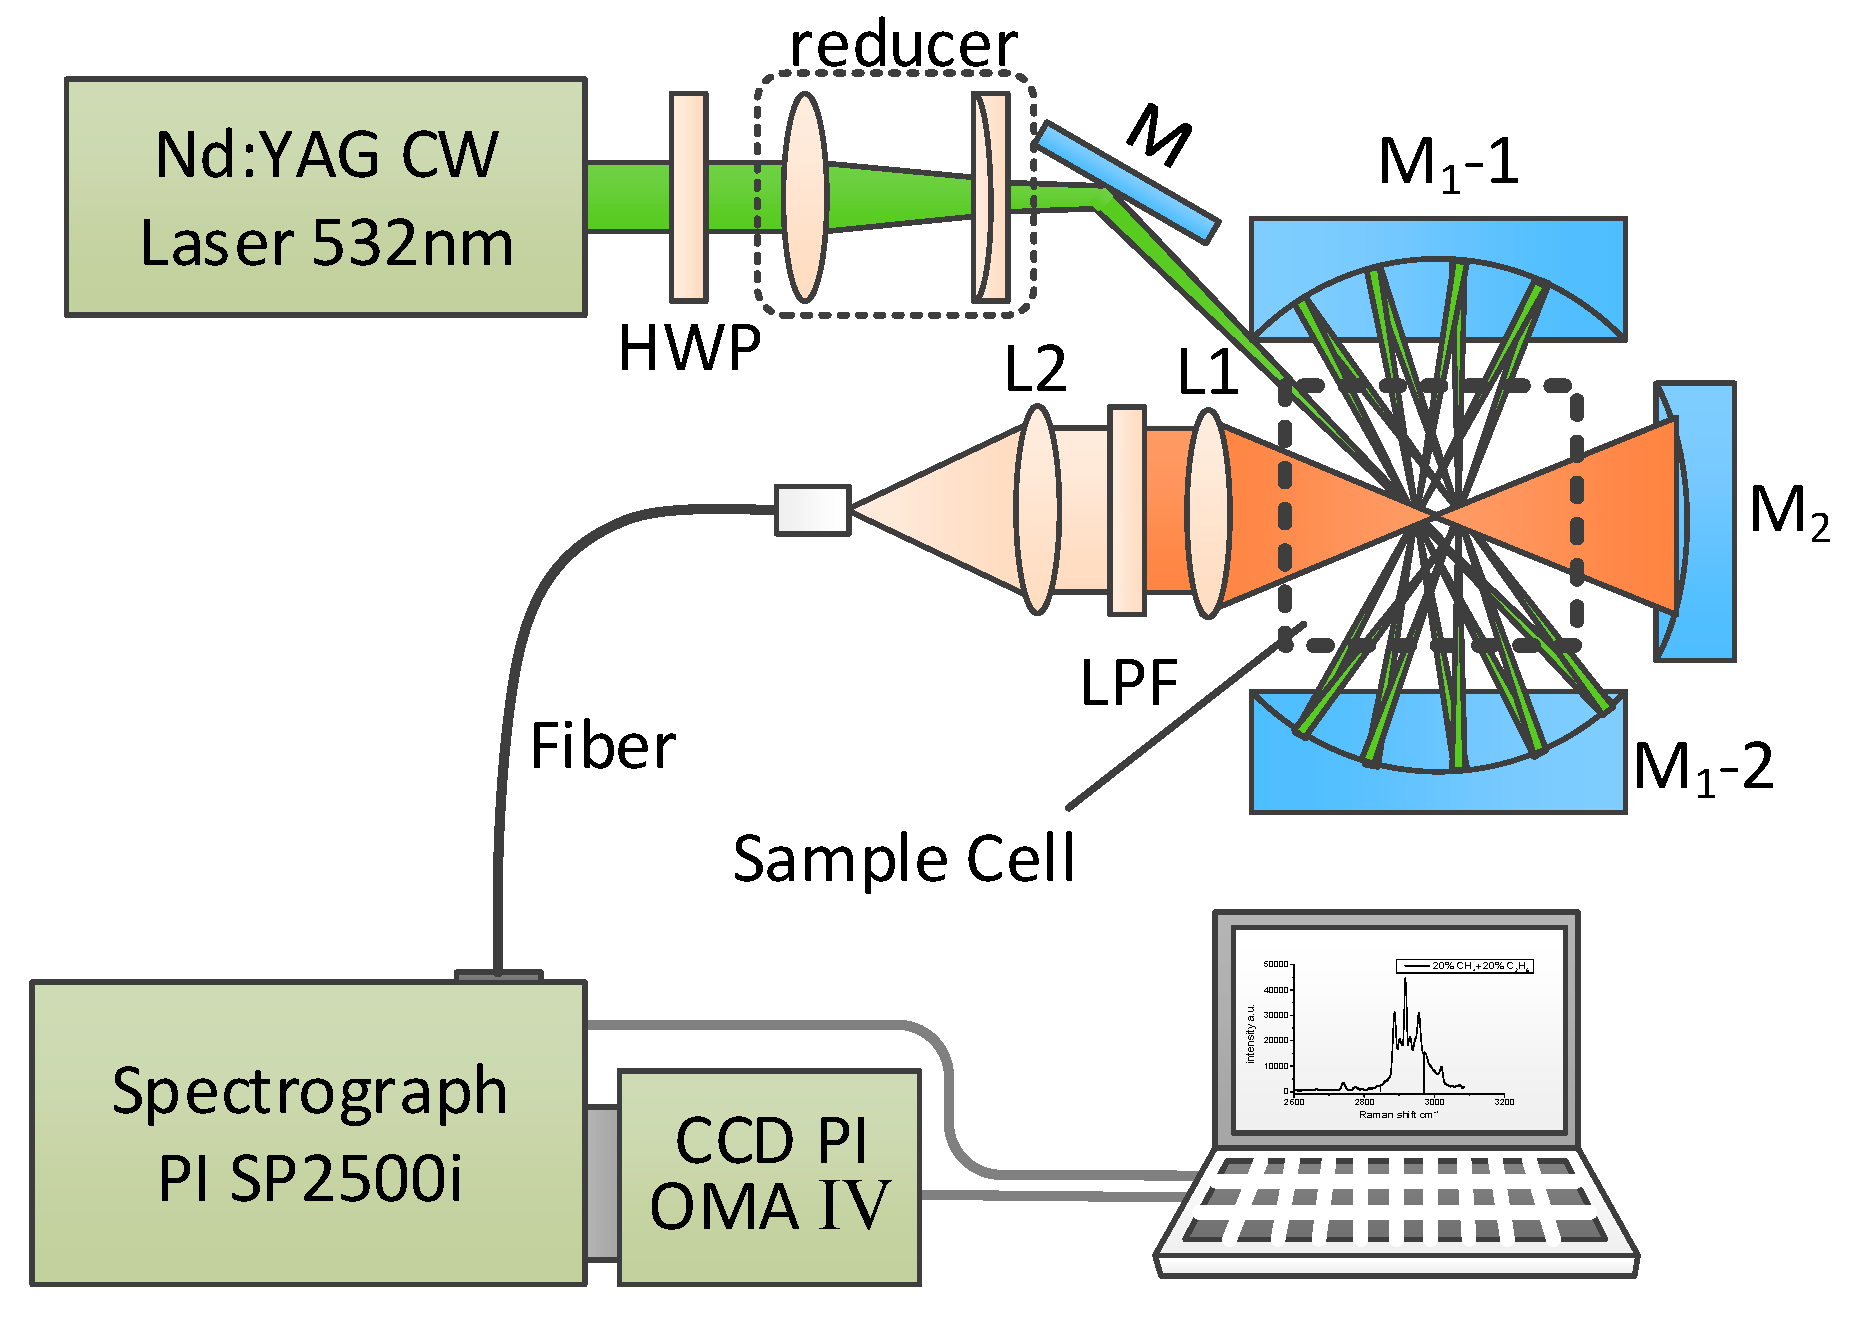
As shown in Figure 1, the near-concentric cavity-enhanced Raman spectroscopy system is adapted on the basis of a formerly reported design [14]. In order to detect liquid samples, a sample cell of fused silica with 10 mm × 10 mm × 40 mm inner size and 1 mm wall thickness is used and placed at the center of the cavity. In this system, a diode-pumped, frequency-doubled Nd:YAG CW laser (532 nm) with a power of 300 mW is used as the Raman excitation laser source. The polarization of the laser beam is rotated by 90° through passing a half wave plate (HWP), and then the laser beam is compressed and focused into the chamber by a couple of lens (a planoconvex lens with a focal length of 100 mm and a planoconcave lens with a focal length of −75 mm). The near concentric cavity is composed of two identical spherical mirrors M1 with 25.4 mm diameter and 25 mm focal length. The reflectivity of these two mirrors is over 99% from 500 to 700 nm. These two mirrors are spaced face to face at a distance of 104.2 mm, and the mirror M1-2 is clockwise rotated about 0.04° to create the near concentric cavity reflection mode. Because of the strong absorption of water, the laser beam number in the cavity is 18, which is less than the number in the cavity of a gas sample cell. The scattering signal from the center of cavity is collected by an achromatic doublet lens L1 (f = 30 mm) with a diameter of 25.4 mm. A mirror M2 (f = 12.5 mm), placed on the opposite side beyond the sample chamber, is used to enhance the collection efficiency of the signal. Another lens L2 (f = 30 mm) is used to couple the Raman signal into the delivery optical fiber bundle (19 μm × 100 μm, NA = 0.22), with a long pass filter placed on its front to get rid of Rayleigh scattering from the collected signal. From the other end of the fiber, the signal is then coupled into a spectrometer (Acton SP2500i, Princeton Instruments, Trenton, NJ, USA), with 1200 g/mm grating and 10 μm entrance slit width. The Raman spectra are recorded by a CCD detector (SPEC-10: 400B, Princeton Instruments, Trenton, NJ, USA) with a 1340 × 400 imaging array and 20 μm × 20 μm pixel size operating at −40 °C. The resulted spectral range is 800~2000 cm−1 with a resolution of 2 cm−1. To get a relative desirable Raman signal and prevent the CCD from overexposure, each spectrum is accumulated five times with an integration time of 10 s, so the total acquisition time is 50 s for one sample. Five measurements are taken for each sample to evaluate the repeatability.
3. Results
The reported LOD for SO42− by using a liquid core optical fiber Raman system is about 1.5 mmol/L [15]. As a comparison, we prepared 15 Na2SO4 solutions (0.10 mmol/L–2.00 mmol/L) to evaluate the LOD of the NC-CERS system. The LOD is defined as the ratio of three times the noise intensity (σ) to the slope of calculation curve. The spectra of four solutions are shown in Figure 2a, and the Raman signal of SO42− can be observed clearly in the spectrum of the 0.10 mmol/L solution. Given this, the NC-CERS system has a LOD less than 0.10 mmol/L for SO42− which is 15 times lower than that reported before. The linear relationships between concentrations and peak intensity of the SO42− are shown in Figure 2b and the response of the NC-CERS system for liquid detection has good linearity with R2 = 0.996 over the whole range.
To evaluate its performance for HCO3−, we prepared nine NaHCO3 solutions with concentrations ranging from 0.40 mmol/L to 4.00 mmol/L. The corresponding concentrations of HCO3− are from 0.37 mmol/L to 3.79 mmol/L calculated by using the carbon balance mode. All of the concentrations of HCO3− are corrected by using the equilibrium mode of carbon components in water. Figure 3a shows the spectra of five of these concentrations. The peak intensity of the HCO3− Raman signal increases as a function of the concentration, and the Raman signal of HCO3− can be distinguished in the solution with 0.37 mmol/L NaHCO3. It is proved that the LOD of the NC-CERS system for HCO3− is less than 0.37 mmol/L, which is much lower than its concentration in seawater. The linear relationship between concentrations and peak intensities of the HCO3− is shown in Figure 3b and it shows good linearity with R2 = 0.978.
Furthermore, we prepared simulated seawater with fixed a NaSO4 concentration (28.00 mmol/L) and different NaHCO3 concentrations (0.00, 2.00, 4.00 mmol/L) to evaluate its ability to quantify HCO3− in seawater. The corresponding concentrations of HCO3− are 0.00, 1.93 and 3.79 mmol/L. The corresponding spectra are shown in Figure 3c, and the detailed spectra are shown in Figure 3d. Compared with the intensity of SO42−, the intensity of the HCO3− signal is much weaker. Even so, the Raman signal of HCO3− can be detected in the spectrum of the mixed solution with 1.93 mmol/L NaHCO3. This shows the ability of the NC-CERS system for direct HCO3− detection in seawater, but the strong and adjacent SO42− signal of seawater has an impact on the quantitative analysis of HCO3−.
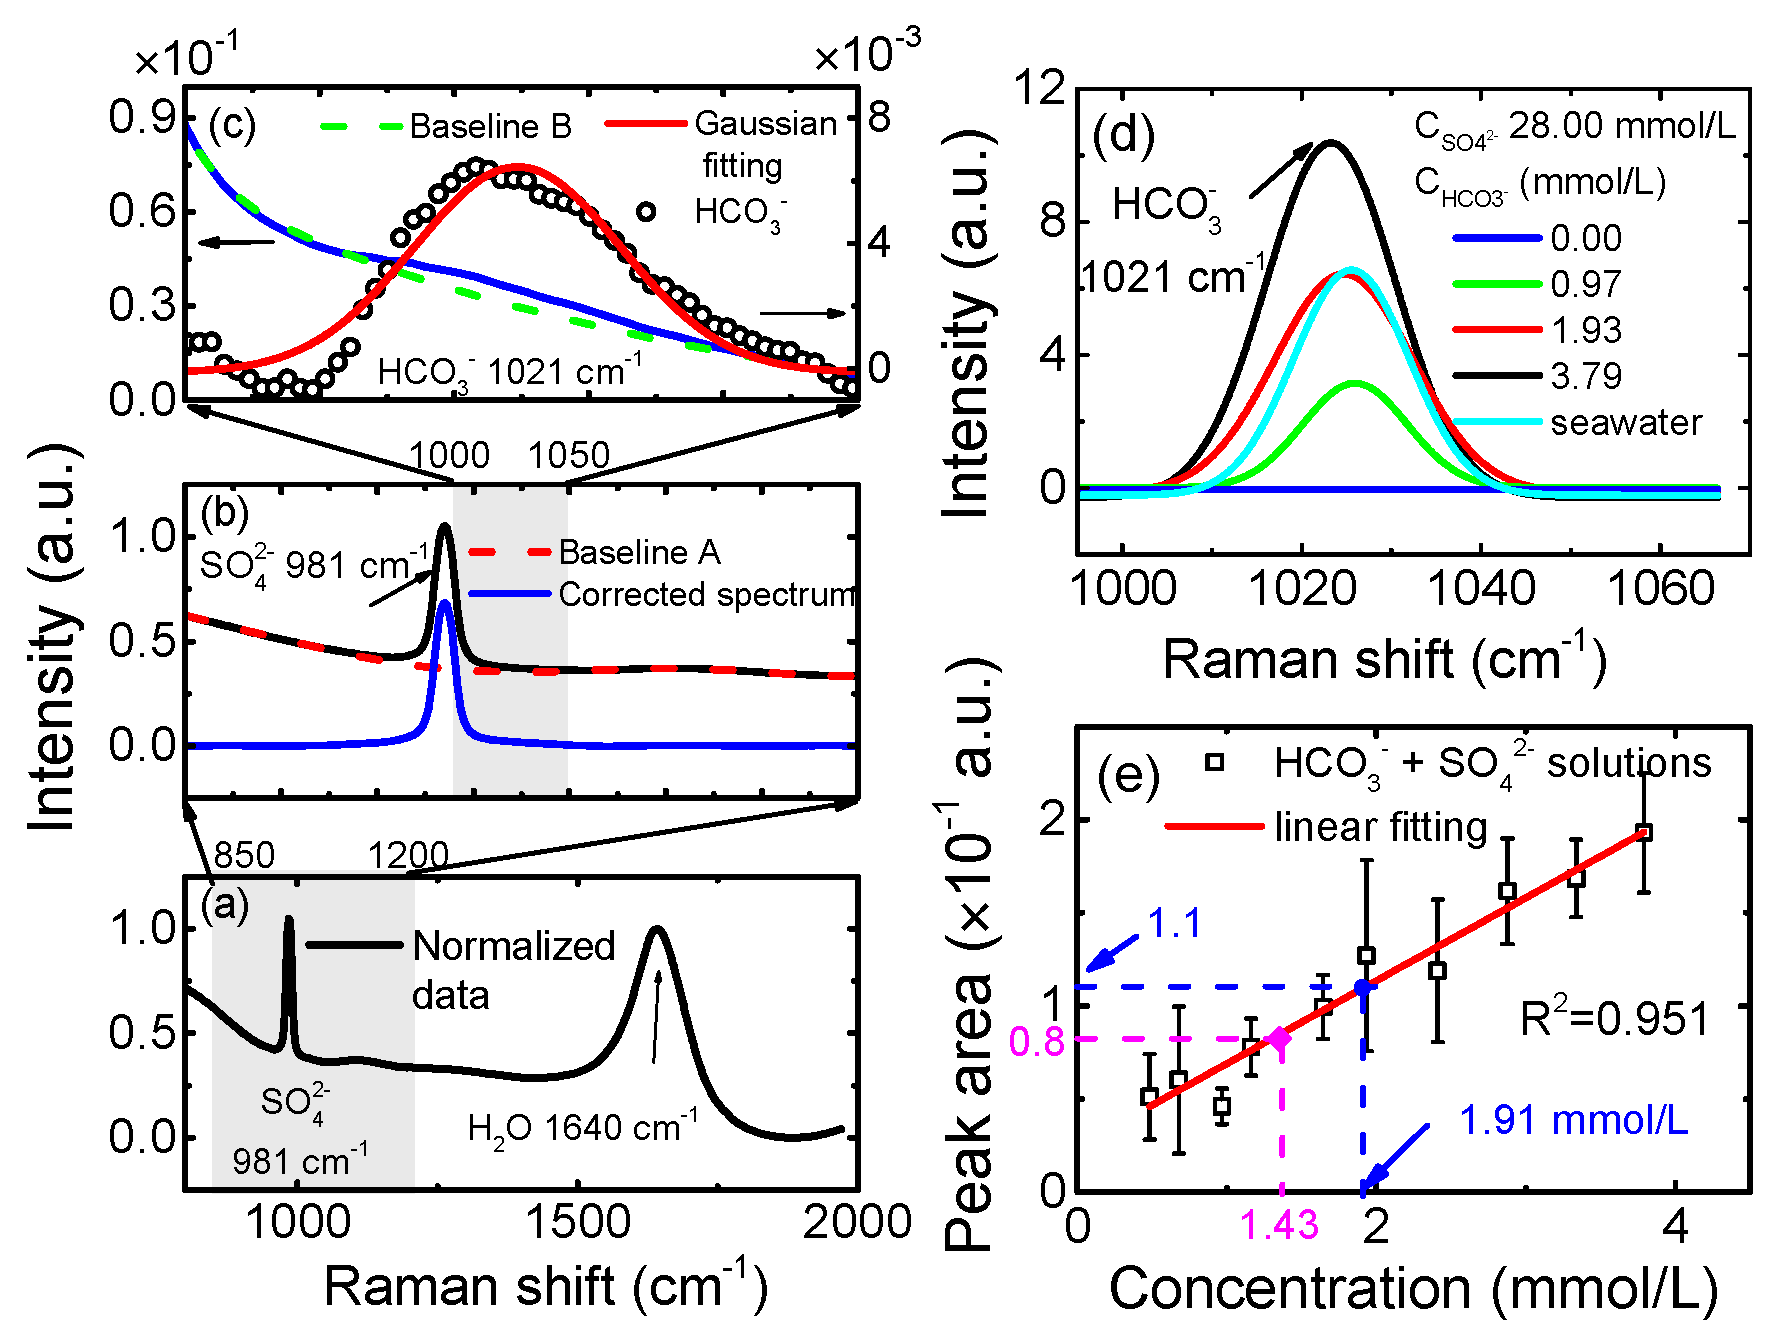
In order to reduce this impact, we developed an adaptive signal extraction method for HCO3− and the process is shown in Figure 4a–c. The spectrum is obtained from a mixed solution with 28.00 mmol/L Na2SO4 and 1.93 mmol/L NaHCO3. In this spectrum, the Raman peaks of SO42− (981 cm−1) and H2O (1640 cm−1) can be clearly recognized, while the peak of HCO3− (1021 cm−1) is almost submerged in the background. Given this, the original spectrum is normalized according to the peak intensity of H2O to reduce the impact of laser power fluctuation as shown in Figure 4a. The next step is baseline correction. We have compared four baseline fitting results with four methods (Voigt, Gaussian, Lorentzian and bi-exponential fitting methods), and the polynomial function shows the best performance among them. The baseline corrected result is shown as a blue line in Figure 4b. The last step is the weak HCO3− signal extraction from the neighboring strong SO42− signal. The right wing of the SO42− signal is regarded as the baseline of the HCO3− signal and is fitted by using a bi-exponential function in the region of 1000–1050 cm−1. We again tried four baseline fitting methods (Voigt, Gaussian, Lorentzian and bi-exponential fitting methods), and the polynomial function showed the best performance among them. The fitted baseline is shown as the green dotted line, and the corrected spectrum is shown as the black circle dots in Figure 4c. The Raman peak of HCO3− is extracted and fitted by using a Gaussian function which is shown as the red line in Figure 4c.
Based on this data processing method, the Raman signals of HCO3− in simulated seawater solutions are extracted and shown in Figure 4d. The signal of a deep seawater sample is also shown as the cyan line in Figure 4d. The linear relationship between concentrations and peak intensities of fitted HCO3− is shown in Figure 4e and it shows high linearity with R2 = 0.951 over the range. We chose a mixed solution with 28.00 mmol/L NaSO4 and 1.50 mmol/L NaHCO3 as a blind sample. The test result is 1.35 mmol/L with 5.0% relative error, which is shown as the pink point in Figure 4e. Furthermore, we tested deep seawater, knowing the concentration of HCO3− is 1.91 mmol/L which is shown as a blue point in Figure 4e. Compared with the reported HCO3− concentration value of 1.95 mmol/L in seawater [4], the relative error was about 2.1%.
4. Conclusions
In this paper, we developed a near-concentric cavity-enhanced Raman spectroscopy system for liquid sample detection based on a near-concentric cavity and directly detected bicarbonate in seawater for the first time. Systematic experiments have been carried out for system evaluation. As shown by the NC-CERS system tests, the LOD for SO42− is less than 0.10 mmol/L, which is 15 times lower than the result reported before. The LOD for is less than 0.37 mmol/L, which is much lower than its concentration in seawater (1.95 mmol/L). The detection performance of the NC-CERS system for HCO3− in seawater is evaluated by analyzing mixed solutions of fixed 28.00 mmol/L NaSO4 and different NaHCO3 concentrations. The Raman signal of 1.93 mmol/L HCO3− in mixed solution can be clearly detected, which shows the ability of direct HCO3− detection in seawater. To further realize the quantitative analysis for HCO3−, a specially developed data processing scheme is introduced. With this data processing method, the weak HCO3− signal is extracted from the neighboring strong SO42− signal, hence a quantitative analysis with R2 = 0.951 is made possible. Based on this calibration curve, the HCO3− concentrations of a blind sample and a seawater sample are calculated. The calculated values are 1.43 mmol/L and 1.91 mmol/L with 4.9% and 2.1% relative error, respectively. It is hoped that this NC-CERS system could be fully developed for field ocean observations in the near future. CO32− with a concentration down to 1/10 of the HCO3− in seawater will be the next detection object.
Acknowledgments
This work was supported by National Natural Science Foundation of China (61575181), Fundamental Research Funds for the Central Universities (201562008), National Key Research and Development Program of China (2016YFC0302101), the Strategic Priority Research Program, CAS (XDA11040301). The author (DewangYang) would like to appreciate Zhao Luo and Tengyue Wang’s language revision.
Author Contributions
Jinjia Guo and Ronger Zheng initiated and supervised the research project. Dewang Yang and Jinjia Guo proposed the idea, conceived and designed the experiments. Dewang Yang, Jinjia Guo, Chunhao Liu and Qingsheng Liu performed the experiments. Dewang Yang processed the data and wrote the initial draft. Ronger Zheng revised the manuscript and figures. The final revisions and writing were done by Jinjia Guo.
Conflicts of Interest
The authors declare no conflict of interest.
References
- Bauer, J.E.; Cai, W.J.; Raymond, P.A.; Bianchi, T.S.; Hopkinson, C.S.; Regnier, P.A. The changing carbon cycle of the coastal ocean. Nature 2013, 504, 61–70. [Google Scholar] [CrossRef] [PubMed]
- Pilson, M.E. An Introduction to the Chemistry of the Sea; Cambridge University Press: Cambridge, UK, 2012; pp. 114–117. [Google Scholar]
- Doney, S.C.; Fabry, V.J.; Feely, R.A.; Kleypasl, J.A. Ocean acidification: The other CO2 problem. Annu. Rev. Mar. Sci. 2009, 1, 169–192. [Google Scholar] [CrossRef] [PubMed]
- Dunk, R.M.; Peltzer, E.T.; Walz, P.M.; Brewer, P.G. Seeing a deep ocean CO2 enrichment experiment in a new light: Laser Raman detection of dissolved CO2 in seawater. Environ. Sci. Technol. 2005, 39, 9630–9636. [Google Scholar] [CrossRef] [PubMed]
- Bates, N.R.; Best, M.H.P.; Neely, K.; Garley, R.; Dickson, A.G.; Johnson, R.J. Detecting anthropogenic carbon dioxide uptake and ocean acidification in the North Atlantic Ocean. Biogeosci. Discuss. 2012, 9, 2509–2522. [Google Scholar] [CrossRef]
- Millero, F.J. The Marine Inorganic Carbon Cycle. Chem. Rev. 2007, 107, 308–341. [Google Scholar] [CrossRef] [PubMed]
- Pasteris, J.D.; Wopenka, B.; Freeman, J.J.; Brewer, P.G.; White, S.N.; Peltzer, E.T.; Malby, G.E. Raman spectroscopy in the deep ocean: Successes and challenges. Appl. Spectrosc. 2004, 58, 195A–208A. [Google Scholar] [CrossRef] [PubMed]
- Brewer, P.G.; Dunk, R.M.; White, S.N.; Peltzer, E.T.; Bowie, B.; Walz, P.M. First Attempts at Direct Raman Detection of the Oceanic Carbonate System; American Geophysical Union: Washington, DC, USA, 2004. [Google Scholar]
- Scholl, J.; Brewer, P.; Peltzer, E.; Walz, P. Liquid-Core Waveguide for Enhanced Laser Raman Spectroscopy in Oceanic Applications. Available online: http://citeseerx.ist.psu.edu/viewdoc/download?doi=10.1.1.598.451&rep=rep1&type=pdf (accessed on 1 December 2017).
- Brewer, P.G.; Malby, G.; Pasteris, J.D.; White, S.N.; Peltzer, E.T.; Wopenka, B.; Freeman, J.; Brown, M.O. Development of a laser Raman spectrometer for deep-ocean science. Deep-Sea Res. Part I 2004, 51, 739–753. [Google Scholar] [CrossRef]
- Hippler, M. Cavity-enhanced Raman spectroscopy of natural gas with optical feedback cw-diode lasers. Anal. Chem. 2015, 87, 7803–7809. [Google Scholar] [CrossRef] [PubMed]
- Li, X.; Xia, Y.; Zhan, L.; Huang, J. Near-confocal cavity-enhanced Raman spectroscopy for multitrace-gas detection. Opt. Lett. 2008, 33, 2143–2145. [Google Scholar] [CrossRef] [PubMed]
- Taylor, D.J.; Glugla, M.; Penzhorn, R.D. Enhanced Raman sensitivity using an actively stabilized external resonator. Rev. Sci. Instrum. 2001, 72, 1970–1976. [Google Scholar] [CrossRef]
- Yang, D.; Guo, J.; Liu, Q.; Luo, Z.; Yan, J.; Zheng, R. Highly sensitive Raman system for dissolved gas analysis in water. Appl. Opt. 2016, 55, 7744–7748. [Google Scholar] [CrossRef] [PubMed]
- Du, Z.; Chen, J.; Ye, W.; Guo, J.; Zhang, X.; Zheng, R. Investigation of two novel approaches for detection of sulfate ion and methane dissolved in sediment pore water using Raman spectroscopy. Sensors 2015, 15, 12377–12388. [Google Scholar] [CrossRef] [PubMed]
Figure 1.
Schematic of the near-concentric cavity-enhanced Raman spectroscopy system for liquid sample detection.
Figure 1.
Schematic of the near-concentric cavity-enhanced Raman spectroscopy system for liquid sample detection.

Figure 2.
Raman spectra of a range of Na2SO4 solution (0.10 mmol/L to 2.00 mmol/L). (a) Four spectra of typical concentration. (b) The linear relationship between concentrations and peak intensities of the SO42− signal.
Figure 2.
Raman spectra of a range of Na2SO4 solution (0.10 mmol/L to 2.00 mmol/L). (a) Four spectra of typical concentration. (b) The linear relationship between concentrations and peak intensities of the SO42− signal.

Figure 3.
The detection ability of the NC-CERS system for HCO3−. (a) The spectra of 5 NaHCO3 aqueous solutions with different concentrations. (b) The linear relationship between concentrations and peak intensities of the HCO3− signal. (c) The Raman spectra of three mixed solutions which contains fixed NaSO4 concentration (28.00 mmol/L) and different NaHCO3 concentrations. (d) The detailed spectra (1000–1050 cm−1) of mixed solutions.

Figure 4.
The signal extraction method for quantitative analysis of HCO3−. (a) The normalized spectrum of mixed solution with 28.00 mmol/L Na2SO4 and 1.93 mmol/L NaHCO3. (b) Baseline correction. The red dotted line represents the baseline curve fitted by a polynomial function, and the blue line is the baseline corrected curve. (c) The signal extraction method for HCO3−. The green dotted line represents the baseline B fitted by a double exponential function. The extracted signal is shown as black circle dots and fitted by using a Gaussian function (red line). (d) Fitted HCO3− Raman signals of 1000 m depth seawater and four mixed solutions with fixed 28.00 mmol/L Na2SO4 and different concentrations of NaHCO3. (e) The calibration curve of HCO3−. The pink point is the result of a blind sample, and the blue point is the result of a seawater sample.

© 2017 by the authors. Licensee MDPI, Basel, Switzerland. This article is an open access article distributed under the terms and conditions of the Creative Commons Attribution (CC BY) license (http://creativecommons.org/licenses/by/4.0/).
Share and Cite
MDPI and ACS Style
Yang, D.; Guo, J.; Liu, C.; Liu, Q.; Zheng, R. A Direct Bicarbonate Detection Method Based on a Near-Concentric Cavity-Enhanced Raman Spectroscopy System. Sensors 2017, 17, 2784. https://doi.org/10.3390/s17122784
AMA Style
Yang D, Guo J, Liu C, Liu Q, Zheng R. A Direct Bicarbonate Detection Method Based on a Near-Concentric Cavity-Enhanced Raman Spectroscopy System. Sensors. 2017; 17(12):2784. https://doi.org/10.3390/s17122784
Chicago/Turabian StyleYang, Dewang, Jinjia Guo, Chunhao Liu, Qingsheng Liu, and Ronger Zheng. 2017. "A Direct Bicarbonate Detection Method Based on a Near-Concentric Cavity-Enhanced Raman Spectroscopy System" Sensors 17, no. 12: 2784. https://doi.org/10.3390/s17122784
Note that from the first issue of 2016, this journal uses article numbers instead of page numbers. See further details here.