Parameter Search Algorithms for Microwave Radar-Based Breast Imaging: Focal Quality Metrics as Fitness Functions

 , , , ,
Abstract
:1. Introduction
- that sufficient contrast exists between cancerous and healthy tissues [5];
- estimating from signals that have propagated through the imaging domain;
- and via parameter search based on properties of the reconstructed images.
2. Methods
- the exact propagation path, , is not known as the tissue composition of the imaging volume is unknown in a screening context;
- human breast tissues are dispersive, but the frequency-dependent propagation speed for each tissue is not known exactly, ;
- the propagation speed, , along the propagation path is also unknown as this depends on the exact tissue composition of the imaging volume.
- the propagation path is assumed as the straight-line path from the antenna, , to the point of interest, . This has been found to have a minimal impact on accuracy, at worst 3 mm [35];
- the propagation speed is generally assumed to be defined at the centre frequency of the illumination pulse, ;
- the propagation speed is assumed to not vary spatially in the entire imaging domain. Although a preliminary numerical study indicated that localisation accuracy could be improved by adapting the propagation delay depending on paths within the breast, this is not practical in realistic scenarios [11].
- A set of backscattered signals, , is beamformed into the set of images, using a range of assumed average dielectric properties ;
- Given a measure of image quality, , apply the measure to the the set of images to determine the relative quality of the images where ;
- Determine the optimal average dielectric properties, and hence the optimal image, by optimising the relative quality curve, , such that the estimated best-case average dielectric properties, , are determined as, .
2.1. Effect of Incorrect Estimation
2.2. Evaluating Suitable Metrics
- the accuracy (): the difference between the best-case effective average dielectric properties, , and the true average dielectric properties, ;
- the localisation error, : the difference between the apparent location of the scatterer when reconstructing images with the effective average dielectric properties and the location when reconstructing images with the true average dielectric properties;
- the signal-to-clutter ratio (SCR) of the reconstructed image, ;
- the signal-to-mean ratio (SMR) of the reconstructed image, .
3. Focal Quality Metrics
- the Discrete Cosine Transform ();
- image gradient ();
- Laplacian approximation ();
- image statistics ();
- and the Discrete Wavelet Transform ().
- variance;
- contrast;
- entropy;
- and the central moment.
4. Experimental Evaluation
5. Results
- the effect of incorrectly estimating the effective average dielectric properties is analysed using simplified theoretical PSFs and then experimental PSFs;
- next, promising FQMs from each family are selected by evaluating all FQMs described using a variety of targets in a homogeneous breast phantom;
- finally, the best performing metrics in the homogeneous phantoms are analysed in increasingly complex and dielectrically heterogeneous scenarios using an experimental prototype imaging system.
5.1. Effect of Incorrect Parameter Estimation
- in general, the maximum amplitude of the PSF is when the effective average dielectric properties, , is equal to the true average dielectric properties, ;
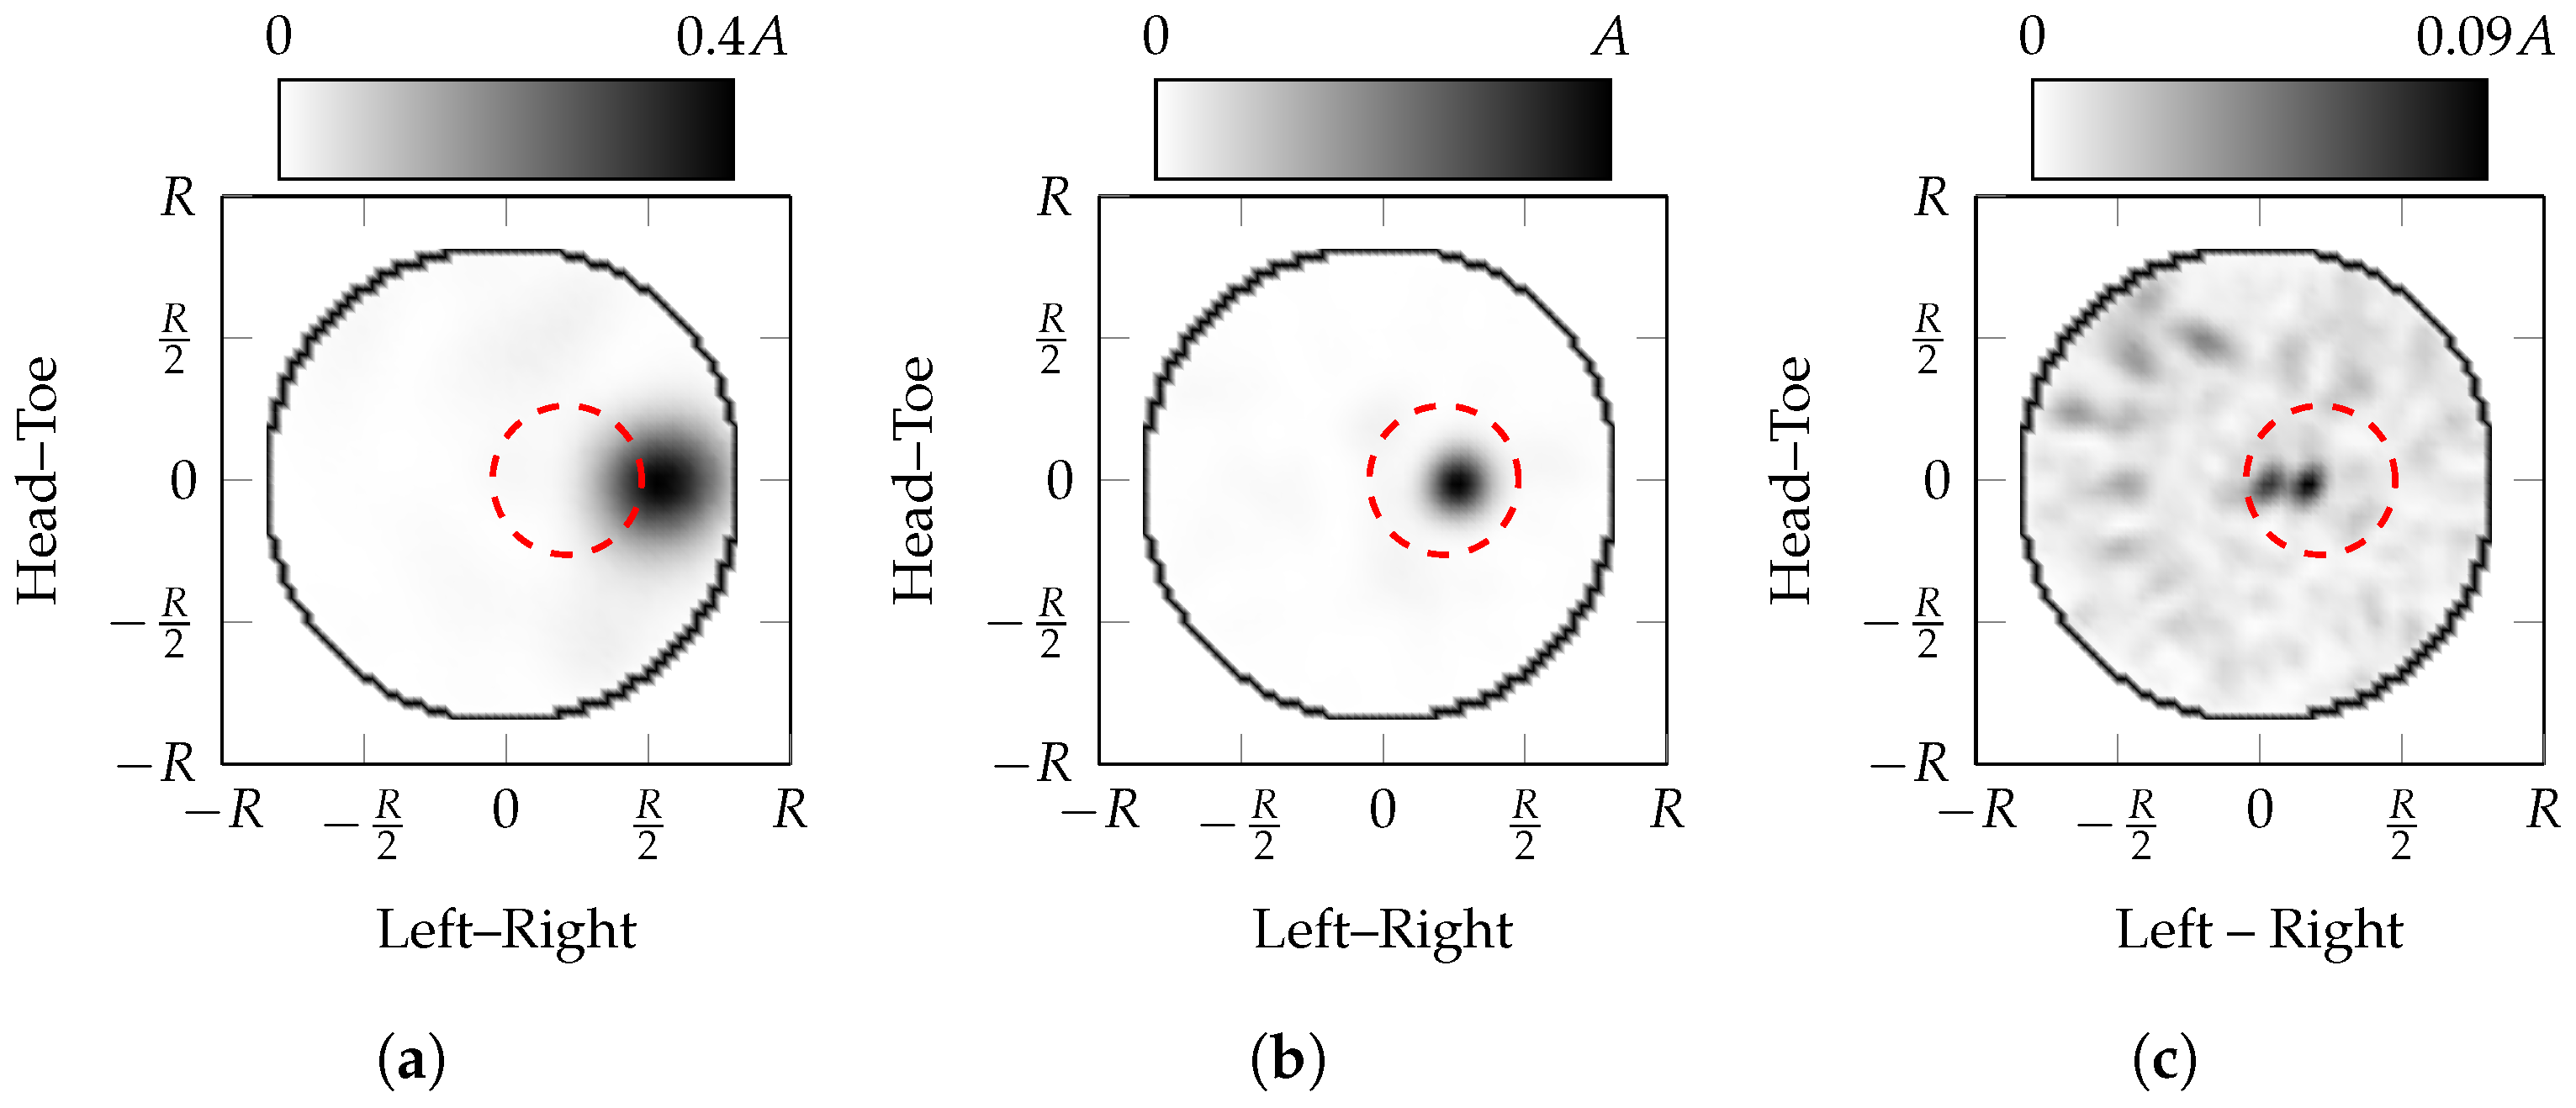
- if the effective average dielectric properties are underestimated (i.e., ), the apparent location of the scatterer moves towards the edge of the imaging domain (closer to R). This localisation error is due to reflections appearing to come from closer than their true origin and the channels closest to the scatterer are dominant in the coherent summation;
- conversely, if the effective average dielectric properties are overestimated, the apparent location of the scatterer moves towards the centre of the imaging domain (closer to 0). This localisation error is due to reflections appearing to come from further away than their true origin;
- the number of sidelobes increases as the estimate of the effective average dielectric properties increases; in other words, there is higher spatial frequency content in PSFs with over-estimated effective average dielectric properties, ;
- it can be seen that as the effective average dielectric properties are overestimated, the width of the peak decreases.
- the localisation error is greater when underestimating the effective average dielectric properties compared to overestimation.
- the maximum amplitude of the images with incorrectly estimated effective average dielectric properties is much lower than the ideal image, 40% when underestimated and 9% when overestimated;
- the apparent location of the scatterer moves towards the edge of the imaging domain when the effective average dielectric properties are underestimated, i.e., ;
- the apparent location of the scatterer moves towards the centre of the imaging domain when the effective average dielectric properties are overestimated, i.e., ;
- the area of the response decreases as the estimated effective average dielectric properties increase.
- The localisation error when overestimating the properties is less than when underestimating the properties.
5.2. Initial Evaluation
5.3. Detailed Analysis
- can be calculated easily from the image using simple and well-known kernels in two and three dimensions;
- have a well-understood method of action as differentiation is analogous to high-pass filtering;
- and identify the optimal image in heterogeneous phantoms with different tumour sizes.
6. Conclusions and Future Work
Acknowledgments
Author Contributions
Conflicts of Interest
References
- Preece, A.W.; Craddock, I.J.; Shere, M.; Jones, L.; Winton, H.L. MARIA M4: Clinical evaluation of a prototype ultrawideband radar scanner for breast cancer detection. J. Med. Imaging 2016, 3, 033502. [Google Scholar] [CrossRef] [PubMed]
- Bannister, P. A Novel Microwave Radar Breast Imaging System in a Symptomatic Breast Clinic. In Proceedings of the BSBR Breast Imaging Research Network Workshop, Manchester, UK, 6 November 2016. [Google Scholar]
- Porter, E.; Coates, M.; Popović, M. An Early Clinical Study of Time-Domain Microwave Radar for Breast Health Monitoring. IEEE Trans. Biomed. Eng. 2016, 63, 530–539. [Google Scholar] [CrossRef] [PubMed]
- Fear, E.C.; Bourqui, J.; Curtis, C.F.; Mew, D.; Docktor, B.; Romano, C. Microwave Breast Imaging with a Monostatic Radar-Based System: A Study of Application to Patients. IEEE Trans. Microw. Theory Tech. 2013, 61, 2119–2128. [Google Scholar] [CrossRef]
- Fear, E.C.; Stuchly, M.A. Confocal microwave imaging for breast tumor detection: Comparison of immersion liquids. In Proceedings of the Antennas and Propagation Society International Symposium, Boston, MA, USA, 8–13 July 2001; Volume 1, pp. 250–253. [Google Scholar]
- Elahi, M.A.; Glavin, M.; Jones, E.; O’Halloran, M. Artifact removal algorithms for microwave imaging of the breast. Prog. Electromagn. Res. 2013, 141, 185–200. [Google Scholar] [CrossRef]
- Elahi, M.A.; Curtis, C.F.; Jones, E.; Glavin, M.; Fear, E.C.; O’Halloran, M. Detailed evaluation of artifact removal algorithms for radar-based microwave imaging of the breast. In Proceedings of the USNC-URSI Radio Science Meeting (Joint with AP-S Symposium), Vancouver, BC, Canada, 19–24 July 2015; p. 307. [Google Scholar]
- Elahi, M.A.; Shahzad, A.; Glavin, M.; Jones, E.; O’Halloran, M. Hybrid Artifact Removal for Confocal Microwave Breast Imaging. IEEE Antennas Wirel. Propag. Lett. 2014, 13, 149–152. [Google Scholar] [CrossRef]
- Byrne, D.; Sarafianou, M.; Craddock, I.J. Compound Radar Approach for Breast Imaging. IEEE Trans. Biomed. Eng. 2017, 64, 40–51. [Google Scholar] [CrossRef] [PubMed]
- Sarafianou, M.; Craddock, I.J.; Henriksson, T.; Klemm, M.; Gibbins, D.; Preece, A.W.; Leendertz, J.A.; Benjamin, R. MUSIC processing for permittivity estimation in a Delay-and-Sum imaging system. In Proceedings of the 7th European Conference on Antennas and Propagation (EuCAP), Gothenburg, Sweden, 8–12 April 2013; pp. 839–842. [Google Scholar]
- Moll, J.; Kelly, T.N.; Byrne, D.; Sarafianou, M.; Krozer, V.; Craddock, I.J. Microwave Radar Imaging of Heterogeneous Breast Tissue Integrating A Priori Information. Int. J. Biomed. Imaging 2014, 2014, 1–10. [Google Scholar] [CrossRef] [PubMed]
- Winters, D.W.; Bond, E.J.; Van Veen, B.D.; Hagness, S.C. Estimation of the Frequency-Dependent Average Dielectric Properties of Breast Tissue Using a Time-Domain Inverse Scattering Technique. IEEE Trans. Antennas Propag. 2006, 54, 3517–3528. [Google Scholar] [CrossRef]
- Garrett, J.D.; Fear, E.C. Average property estimation validation with realistic breast models. In Proceedings of the 8th European Conference on Antennas and Propagation (EuCAP), The Hague, The Netherlands, 6–11 April 2014; pp. 1279–1280. [Google Scholar]
- Lavoie, B.R.; Okoniewski, M.; Fear, E.C. Estimating the Effective Permittivity for Reconstructing Accurate Microwave-Radar Images. PLoS ONE 2016, 11, e0160849. [Google Scholar] [CrossRef] [PubMed]
- Campbell, A.M. Measurements and Analysis of the Microwave Dielectric Properties of Tissues. Ph.D. Thesis, University of Glasgow, Glasgow, UK, 1990. [Google Scholar]
- Gabriel, C.; Gabriel, S.; Corthout, E. The dielectric properties of biological tissues: I. Literature survey. Phys. Med. Biol. 1996, 41, 2231. [Google Scholar] [CrossRef] [PubMed]
- Hurt, W.D.; Ziriax, J.M.; Mason, P.A. Variability in EMF permittivity values: Implications for SAR calculations. IEEE Trans. Biomed. Eng. 2000, 47, 396–401. [Google Scholar] [CrossRef] [PubMed]
- Sha, L.; Ward, E.R.; Stroy, B. A review of dielectric properties of normal and malignant breast tissue. In Proceedings of the IEEE SoutheastCon, Columbia, SC, USA, 5–7 April 2002; pp. 457–462. [Google Scholar]
- O’Halloran, M.; Cruz Conceição, R.; Byrne, D.; Glavin, M.; Jones, E. FDTD modeling of the breast: A review. Prog. Electromagn. Res. B 2009, 18, 1–24. [Google Scholar] [CrossRef]
- Lazebnik, M.; McCartney, L.; Popović, D.; Watkins, C.B.; Lindstrom, M.J.; Harter, J.; Sewall, S.; Magliocco, A.; Booske, J.H.; Okoniewski, M.; et al. A large-scale study of the ultrawideband microwave dielectric properties of normal breast tissue obtained from reduction surgeries. Phys. Med. Biol. 2007, 52, 2637–2656. [Google Scholar] [CrossRef] [PubMed]
- Lazebnik, M.; Popović, D.; McCartney, L.; Watkins, C.B.; Lindstrom, M.J.; Harter, J.; Sewall, S.; Ogilvie, T.; Magliocco, A.; Breslin, T.M.; et al. A large-scale study of the ultrawideband microwave dielectric properties of normal, benign and malignant breast tissues obtained from cancer surgeries. Phys. Med. Biol. 2007, 52, 6093–6115. [Google Scholar] [CrossRef] [PubMed]
- Shea, J.D.; Kosmas, P.; Van Veen, B.D.; Hagness, S.C. Contrast-enhanced microwave imaging of breast tumors: A computational study using 3D realistic numerical phantoms. Inverse Probl. 2010, 26, 074009. [Google Scholar] [CrossRef] [PubMed]
- Mashal, A.; Sitharaman, B.; Li, X.; Avti, P.K.; Sahakian, A.V.; Booske, J.H.; Hagness, S.C. Toward Carbon-Nanotube-Based Theranostic Agents for Microwave Detection and Treatment of Breast Cancer: Enhanced Dielectric and Heating Response of Tissue-Mimicking Materials. IEEE Trans. Biomed. Eng. 2010, 57, 1831–1834. [Google Scholar] [CrossRef] [PubMed]
- Chen, Y.; Craddock, I.J.; Kosmas, P. Feasibility Study of Lesion Classification via Contrast-Agent-Aided UWB Breast Imaging. IEEE Trans. Biomed. Eng. 2010, 57, 1003–1007. [Google Scholar] [CrossRef] [PubMed]
- Bellizzi, G.; Bucci, O.M.; Catapano, I. Microwave Cancer Imaging Exploiting Magnetic Nanoparticles as Contrast Agent. IEEE Trans. Biomed. Eng. 2011, 58, 2528–2536. [Google Scholar] [CrossRef] [PubMed]
- Bellizzi, G.; Bellizzi, G.G.; Bucci, O.M.; Crocco, L.; Helbig, M.; Ley, S.; Sachs, J. Optimization of the Working Conditions for Magnetic Nanoparticle-Enhanced Microwave Diagnostics of Breast Cancer. IEEE Trans. Biomed. Eng. 2017, PP. [Google Scholar] [CrossRef] [PubMed]
- Bevacqua, M.T.; Scapaticci, R. A Compressive Sensing Approach for 3D Breast Cancer Microwave Imaging With Magnetic Nanoparticles as Contrast Agent. IEEE Trans. Med. Imaging 2016, 35, 665–673. [Google Scholar] [CrossRef] [PubMed]
- Casas, O.; Bragós, R.; Riu, P.J.; Rosell, J.; Tresànchez, M.; Warren, M.; Rodrigues-Sinovas, A.; Carreño, A.; Cinca, J. In Vivo and In Situ Ischemic Tissue Characterization Using Electrical Impedance Spectroscopy. Ann. N. Y. Acad. Sci. 1999, 873, 51–58. [Google Scholar] [CrossRef] [PubMed]
- Haemmerich, D.; Ozkan, O.R.; Tsai, J.Z.; Staelin, S.T.; Tungjitkusolmun, S.; Mahvi, D.M.; Webster, J.G. Changes in electrical resistivity of swine liver after occlusion and postmortem. Med. Biol. Eng. Comput. 2002, 40, 29–33. [Google Scholar] [CrossRef] [PubMed]
- Halter, R.J.; Zhou, T.; Meaney, P.M.; Hartov, A.; Barth, R.J.; Rosenkranz, K.M.; Wells, W.A.; Kogel, C.A.; Borsic, A.; Rizzo, E.J.; et al. The correlation of in vivo and ex vivo tissue dielectric properties to validate electromagnetic breast imaging: Initial clinical experience. Physiol. Meas. 2009, 30, 121–136. [Google Scholar] [CrossRef] [PubMed]
- Shahzad, A.; Khan, S.; Jones, M.; Dwyer, R.M.; O’Halloran, M. Investigation of the effect of dehydration on tissue dielectric properties in ex vivo measurements. Biomed. Phys. Eng. Express 2017, 3, 045001. [Google Scholar] [CrossRef]
- Sugitani, T.; Kubota, S.I.; Kuroki, S.I.; Sogo, K.; Arihiro, K.; Okada, M.; Kadoya, T.; Hide, M.; Oda, M.; Kikkawa, T. Complex permittivities of breast tumor tissues obtained from cancer surgeries. Appl. Phys. Lett. 2014, 104, 253702. [Google Scholar] [CrossRef]
- Meaney, P.M.; Gregory, A.P.; Epstein, N.R.; Paulsen, K.D. Microwave open-ended coaxial dielectric probe: Interpretation of the sensing volume re-visited. BMC Med. Phys. 2014, 14, 3. [Google Scholar] [CrossRef] [PubMed]
- Porter, E.; O’Halloran, M. Investigation of Histology Region in Dielectric Measurements of Heterogeneous Tissues. IEEE Trans. Antennas Propag. 2017, 65, 5541–5552. [Google Scholar] [CrossRef]
- Curtis, C.F. Factors Affecting Image Quality in Near-Field Ultra-Wideband Radar Imaging for Biomedical Applications. Ph.D. Thesis, University of Calgary, Calgary, AB, Canada, 2015. [Google Scholar]
- Bourqui, J.; Fear, E.C. Average breast permittivity measurements: Preliminary results from current patient study. In Proceedings of the 10th European Conference on Antennas and Propagation (EuCAP), Davos, Switzerland, 10–15 April 2016; pp. 1–4. [Google Scholar]
- Mobashsher, A.T.; Mahmoud, A.; Abbosh, A.M. Portable Wideband Microwave Imaging System for Intracranial Hemorrhage Detection Using Improved Back-projection Algorithm with Model of Effective Head Permittivity. Sci. Rep. 2016, 6, 20459. [Google Scholar] [CrossRef] [PubMed]
- Guo, L.; Abbosh, A.M. Optimization-Based Confocal Microwave Imaging in Medical Applications. IEEE Trans. Antennas Propag. 2015, 63, 3531–3539. [Google Scholar] [CrossRef]
- Mohammed, B.J.; Bialkowski, K.S.; Abbosh, A.M. Radar-based time-domain head imaging using database of effective dielectric constant. IET Electron. Lett. 2015, 51, 1574–1576. [Google Scholar] [CrossRef]
- Lavoie, B.R.; Okoniewski, M.; Fear, E.C. Optimizing Microwave-Radar Imaging Parameters. In Proceedings of the 17th International Symposium on Antenna Technology and Applied Electromagnetics (ANTEM), Montreal, QC, Canada, 10–13 July 2016. [Google Scholar]
- Pertuz, S.; Puig, D.; Garcia, M.A. Analysis of focus measure operators for shape-from-focus. Pattern Recognit. 2013, 46, 1415–1432. [Google Scholar] [CrossRef]
- O’Loughlin, D.; Glavin, M.; Jones, E.; O’Halloran, M. Optimisation of Confocal Microwave Breast Images using Image Focal Metrics. In Proceedings of the Bioengineering in Ireland, Galway, Ireland, 22–23 January 2016. [Google Scholar]
- O’Loughlin, D.; Krewer, F.; Glavin, M.; Jones, E.; O’Halloran, M. Estimating average dielectric properties for microwave breast imaging using focal quality metrics. In Proceedings of the 10th European Conference on Antennas and Propagation (EuCAP), Davos, Switzerland, 10–15 April 2016; pp. 1–5. [Google Scholar]
- O’Loughlin, D.; Krewer, F.; Glavin, M.; Jones, E.; O’Halloran, M. Focal quality metrics for the objective evaluation of confocal microwave images. Int. J. Microw. Wirel. Technol. 2017, 9, 1365–1372. [Google Scholar] [CrossRef]
- Hagness, S.C.; Taflove, A.; Bridges, J.E. Three-dimensional FDTD analysis of an ultrawideband antenna-array element for confocal microwave imaging of nonpalpable breast tumors. In Proceedings of the International Symposium of the IEEE Antennas and Propagation Society (APS), Orlando, FL, USA, 11–16 July 1999; Volume 3, pp. 1886–1889. [Google Scholar]
- Curtis, C.F.; Fear, E.C. Beamforming in the frequency domain with applications to microwave breast imaging. In Proceedings of the 8th European Conference on Antennas and Propagation (EuCAP), The Hague, The Netherlands, 6–11 April 2014; pp. 72–76. [Google Scholar]
- Fear, E.C.; Stuchly, M.A. Confocal microwave imaging for breast tumor detection: A study of resolution and detection ability. In Proceedings of the 23rd Annual International Conference of the IEEE Engineering in Medicine and Biology Society (EMBS), Istanbul, Turkey, 25–28 October 2001; Volume 3, pp. 2355–2358. [Google Scholar]
- Li, X.; Hagness, S.C. A confocal microwave imaging algorithm for breast cancer detection. Microw. Wirel. Compon. Lett. 2001, 11, 130–132. [Google Scholar]
- Bond, E.J.; Li, X.; Hagness, S.C.; Van Veen, B.D. Microwave imaging via space-time beamforming for early detection of breast cancer. IEEE Trans. Antennas Propag. 2003, 51, 1690–1705. [Google Scholar] [CrossRef]
- Nilavalan, R.; Gbedemah, A.; Craddock, I.J.; Li, X.; Hagness, S.C. Numerical investigation of breast tumour detection using multi-static radar. Electron. Lett. 2003, 39, 1787–1789. [Google Scholar] [CrossRef]
- Klemm, M.; Leendertz, J.A.; Gibbins, D.; Craddock, I.J.; Preece, A.W.; Benjamin, R. Microwave Radar-Based Breast Cancer Detection: Imaging in Inhomogeneous Breast Phantoms. IEEE Antennas Wirel. Propag. Lett. 2009, 8, 1349–1352. [Google Scholar] [CrossRef] [Green Version]
- Byrne, D.; O’Halloran, M.; Glavin, M.; Jones, E. Data independent radar beamforming algorithms for breast cancer detection. Prog. Electromagn. Res. 2010, 107, 331–348. [Google Scholar] [CrossRef]
- O’Halloran, M.; Jones, E.; Glavin, M. Quasi-Multistatic MIST Beamforming for the Early Detection of Breast Cancer. IEEE Trans. Biomed. Eng. 2010, 57, 830–840. [Google Scholar] [CrossRef] [PubMed]
- Shahzad, A.; O’Halloran, M.; Jones, E.; Glavin, M. A preprocessing filter for multistatic microwave breast imaging for enhanced tumour detection. Prog. Electromagn. Res. B 2014, 57, 115–126. [Google Scholar] [CrossRef]
- Byrne, D.; Craddock, I.J. Time-Domain Wideband Adaptive Beamforming for Radar Breast Imaging. IEEE Trans. Antennas Propag. 2015, 63, 1725–1735. [Google Scholar] [CrossRef]
- Klemm, M.; Craddock, I.J.; Leendertz, J.A.; Preece, A.W.; Benjamin, R. Improved Delay-and-Sum Beamforming Algorithm for Breast Cancer Detection. Int. J. Antennas Propag. 2008, 2008, 1–9. [Google Scholar] [CrossRef]
- Lim, H.B.; Nhung, N.T.T.; Li, E.P.; Thang, N.D. Confocal Microwave Imaging for Breast Cancer Detection: Delay-Multiply-and-Sum Image Reconstruction Algorithm. IEEE Trans. Biomed. Eng. 2008, 55, 1697–1704. [Google Scholar] [PubMed]
- Elahi, M.; Glavin, M.; Jones, E.; O’Halloran, M. Adaptive artifact removal for selective multistatic microwave breast imaging signals. Biomed. Signal Process. Control 2017, 34, 93–100. [Google Scholar] [CrossRef]
- Solimene, R.; Cuccaro, A.; Ruvio, G.; Flores Tapia, D.; O’Halloran, M. Beamforming and holography image formation methods: An analytic study. Opt. Express 2016, 24, 9077. [Google Scholar] [CrossRef] [PubMed]
- Brenner, J.F.; Dew, B.S.; Horton, J.B.; King, T.; Neurath, P.W.; Selles, W.D. An automated microscope for cytologic research a preliminary evaluation. J. Histochem. Cytochem. 1976, 24, 100–111. [Google Scholar] [CrossRef] [PubMed]
- Jarvis, R.A. Focus optimization criteria for computer image-processing. Microscope 1976, 24, 163–180. [Google Scholar]
- Linge, H.; Zimmer, H.G.; Neuhoff, V. Focus Adjustments in Linear Systems. In SPIE Proceedings; SPIE: Berlin, Germany, 1982; Volume 0375, pp. 40–46. [Google Scholar]
- Muller, R.A.; Buffington, A. Real-time correction of atmospherically degraded telescope images through image sharpening. JOSA 1974, 64, 1200–1210. [Google Scholar] [CrossRef]
- Buffington, A.; Crawford, F.S.; Pollaine, S.M.; Orth, C.D.; Muller, R.A. Sharpening Stellar Images. Science 1978, 200, 489–494. [Google Scholar] [CrossRef] [PubMed]
- Chern, N.N.K.; Neow, P.A.; Ang, M.H., Jr. Practical issues in pixel-based autofocusing for machine vision. In Proceedings of the IEEE International Conference on Robotics and Automation, Seoul, Korea, 21–26 May 2001; Volume 3, pp. 2791–2796. [Google Scholar]
- Subbarao, M.; Choi, T.S.; Nikzad, A. Focusing techniques. Opt. Eng. 1993, 32, 2824–2836. [Google Scholar] [CrossRef]
- Lee, J.H.; Kim, K.S.; Nam, B.D.; Lee, J.C.; Kwon, Y.M.; Kim, H.G. Implementation of a passive automatic focusing algorithm for digital still camera. IEEE Trans. Consum. Electron. 1995, 41, 449–454. [Google Scholar] [CrossRef]
- Baïna, J.; Dublet, J. Automatic focus and iris control for video cameras. In Proceedings of the Fifth International Conference on Image Processing and its Applications, Edinburgh, UK, 4–6 July 1995; IET: Edinburgh, UK, 1995; pp. 232–235. [Google Scholar]
- Schlag, J.F.; Sanderson, A.C.; Neuman, C.P.; Wimberly, F.C. Implementation of Automatic Focusing Algorithms for a Computer Vision System with Camera Control; Technical Report; Carnegie-Mellon University: Pittsburgh, PA, USA, 1983. [Google Scholar]
- Groen, F.C.; Young, I.T.; Ligthart, G. A Comparison of Different Focus Functions for Use in Autofocus Algorithms. Cytometry 1985, 6, 81–91. [Google Scholar] [CrossRef] [PubMed]
- Shen, C.; Chen, H.H. Robust focus measure for low-contrast images. In Proceedings of the 2006 Digest of Technical Papers. International Conference on Consumer Electronics (ICCE’06), Las Vegas, NV, USA, 7–11 January 2006; pp. 69–70. [Google Scholar]
- Lee, S.Y.; Yoo, J.T.; Kumar, Y.; Kim, S.W. Reduced Energy-Ratio Measure for Robust Autofocusing in Digital Camera. IEEE Signal Process. Lett. 2009, 16, 133–136. [Google Scholar] [CrossRef]
- Santos, A.; Ortiz de Solórzano, C.; Vaquero, J.J.; Peña, J.M.; Malpica, N.; del Pozo, F. Evaluation of autofocus functions in molecular cytogenetic analysis. J. Microsc. 1997, 188, 264–272. [Google Scholar] [CrossRef] [PubMed] [Green Version]
- Sun, Y.; Duthaler, S.; Nelson, B.J. Autofocusing in computer microscopy: Selecting the optimal focus algorithm. Microsc. Res. Tech. 2004, 65, 139–149. [Google Scholar] [CrossRef] [PubMed]
- Firestone, L.; Cook, K.; Culp, K.; Talsania, N.; Preston, K. Comparison of Autofocus Methods for Automated Microscopy. Cytometry 1990, 12, 195–206. [Google Scholar] [CrossRef] [PubMed]
- Malik, A.S.; Choi, T.S. A novel algorithm for estimation of depth map using image focus for 3D shape recovery in the presence of noise. Pattern Recognit. 2008, 41, 2200–2225. [Google Scholar] [CrossRef]
- Huang, W.; Jing, Z. Evaluation of focus measures in multi-focus image fusion. Pattern Recognit. Lett. 2007, 28, 493–500. [Google Scholar] [CrossRef]
- Russell, M.J.; Douglas, T.S. Evaluation of autofocus algorithms for tuberculosis microscopy. In Proceedings of the 29th Annual International Conference of the IEEE Engineering in Medicine and Biology Society (EMBS), Lyons, France, 22–26 August 2007; pp. 3489–3492. [Google Scholar]
- Geusebroek, J.M.; Cornelissen, F.; Smeulders, A.W.; Geerts, H. Robust autofocusing in microscopy. Cytometry 2000, 39, 1–9. [Google Scholar] [CrossRef]
- Pech-Pacheco, J.L.; Cristóbal, G.; Chamorro-Martinez, J.; Fernández-Valdivia, J. Diatom autofocusing in brightfield microscopy: A comparative study. In Proceedings of the 15th International Conference on Pattern Recognition, Barcelona, Spain, 3–7 September 2000; Volume 3, pp. 314–317. [Google Scholar]
- Helmli, F.S.; Scherer, S. Adaptive shape from focus with an error estimation in light microscopy. In Proceedings of the 2nd International Symposium on Image and Signal Processing and Analysis (ISPA), Pula, Croatia, 19–21 June 2001; pp. 188–193. [Google Scholar]
- Erteza, A. Sharpness index and its application to focus control. Appl. Opt. 1976, 15, 877–881. [Google Scholar] [CrossRef] [PubMed]
- Nayar, S.K.; Nakagawa, Y. Shape from focus. IEEE Trans. Pattern Anal. Mach. Intell. 1994, 16, 824–831. [Google Scholar] [CrossRef]
- Thelen, A.; Frey, S.; Hirsch, S.; Hering, P. Improvements in Shape-From-Focus for Holographic Reconstructions With Regard to Focus Operators, Neighborhood-Size, and Height Value Interpolation. IEEE Trans. Image Process. 2009, 18, 151–157. [Google Scholar] [CrossRef] [PubMed]
- Krotkov, E.; Martin, J.P. Range from focus. In Proceedings of the IEEE International Conference on Robotics and Automation, San Francisco, CA, USA, 7–10 April 1986; Volume 3, pp. 1093–1098. [Google Scholar]
- Nanda, H.; Cutler, R. Practical calibrations for a real-time digital omnidirectional camera. In Proceedings of the Computer Vision and Pattern Recognition: Technical Sketch, Kauai, HI, USA, 8–14 December 2001; Volume 20. [Google Scholar]
- Xie, H.; Rong, W.; Sun, L. Wavelet-based focus measure and 3-d surface reconstruction method for microscopy images. In Proceedings of the IEEE/RSJ International Conference on Intelligent Robots and Systems, Beijing, China, 9–15 October 2006; pp. 229–234. [Google Scholar]
- Shirvaikar, M.V. An optimal measure for camera focus and exposure. In Proceedings of the Thirty-Sixth Southeastern Symposium on System Theory, Atlanta, GA, USA, 16 March 2004; pp. 472–475. [Google Scholar]
- Yang, G.; Nelson, B.J. Wavelet-based autofocusing and unsupervised segmentation of microscopic images. In Proceedings of the IEEE/RSJ International Conference on Intelligent Robots and Systems, Las Vegas, NV, USA, 27–31 October 2003; Volume 3, pp. 2143–2148. [Google Scholar]
- Tenenbaum, J.M. Accommodation in Computer Vision. Ph.D. Thesis, Stanford University, Stanford, CA, USA, 1970. [Google Scholar]
- Bahramiabarghouei, H.; Porter, E.; Santorelli, A.; Gosselin, B.; Popović, M.; Rusch, L.A. Flexible 16 Antenna Array for Microwave Breast Cancer Detection. IEEE Trans. Biomed. Eng. 2015, 62, 2516–2525. [Google Scholar] [CrossRef] [PubMed]
- Garrett, J.; Fear, E. A New Breast Phantom With a Durable Skin Layer for Microwave Breast Imaging. IEEE Trans. Antennas Propag. 2015, 63, 1693–1700. [Google Scholar] [CrossRef]
- Santorelli, A.; Laforest, O.; Porter, E.; Popović, M. Image classification for a time-domain microwave radar system: Experiments with stable modular breast phantoms. In Proceedings of the 9th European Conference on Antennas and Propagation (EuCAP), Lisbon, Portugal, 13–17 April 2015; pp. 1–5. [Google Scholar]
- Oliveira, B.L.; O’Halloran, M.; Cruz Conceição, R.; Glavin, M.; Jones, E. Development of Clinically-Informed 3D Tumor Models for Microwave Imaging Applications. IEEE Antennas Wirel. Propag. Lett. 2015, 15, 520–523. [Google Scholar] [CrossRef]
- Klemm, M.; Craddock, I.J.; Preece, A.W.; Leendertz, J.A.; Benjamin, R. Evaluation of a hemi-spherical wideband antenna array for breast cancer imaging. Radio Sci. 2008, 43. [Google Scholar] [CrossRef]


| Name | Equation |
|---|---|
| AC–DC Ratio [71] | |
| AC–DC Reduced Ratio [72] | |
| Absolute Gradient [73] | |
| Squared Gradient [73] | |
| Brenner Gradient [60,73,74,75] | |
| Gradient Energy [66,76,77] | |
| Gaussian Energy [78,79] | |
| Tenengrad Mean [69,74,77,80,81] | |
| Tenengrad Variance [80] | |
| Laplacian Energy [63,69,70,82] | |
| Modified Laplacian [83] | |
| Diagonal Laplacian [84] | |
| Laplacian Variance [80] | |
| Variance [65,66,67,68,73,74,75,77,81,85] | |
| Normalised Variance [72,73,74] | |
| Localised Variance [80] | |
| Contrast [86] | |
| Mean Ratio [81] | |
| Entropy [65,73,74,75,85,87] | |
| Central Moment [41,88] | |
| Absolute Detail Sum [41,87,89] | |
| Detail Variance [87,89] | |
| Detail–Coarse Ratio [41,87] |
| Metric | SMR | SCR | Ranks | ||
|---|---|---|---|---|---|
| 2.5 (1) | 10.9 (1) | 7.6 (1) | 3.8 (1) | (1/21) | |
| 3.0 (2) | 13.3 (2) | 5.0 (2) | 2.5 (2) | (2/22) | |
| 1.4 (2) | 4.6 (1) | 18.3 (1) | 8.5 (1) | (1/2) | |
| 1.3 (1) | 6.6 (2) | 16.7 (2) | 8.0 (2) | (2/7) | |
| 1.4 (3) | 7.4 (3) | 14.5 (3) | 7.1 (3) | (3/8) | |
| 1.5 (4) | 7.4 (4) | 14.5 (4) | 7.1 (4) | (4/10) | |
| 1.5 (4) | 7.4 (4) | 14.5 (4) | 7.1 (4) | (4/10) | |
| 1.5 (6) | 7.6 (6) | 14.5 (6) | 7.1 (6) | (6/15) | |
| 1.9 (7) | 8.9 (7) | 11.8 (7) | 5.7 (7) | (7/18) | |
| 1.5 (1) | 7.3 (1) | 14.5 (1) | 7.0 (4) | (1/9) | |
| 1.5 (3) | 7.3 (2) | 14.5 (2) | 7.0 (3) | (2/12) | |
| 1.5 (3) | 7.6 (4) | 14.4 (4) | 7.0 (2) | (4/16) | |
| 1.5 (3) | 7.6 (4) | 14.4 (4) | 7.0 (2) | (4/16) | |
| 0.7 (1) | 5.2 (1) | 17.1 (2) | 8.3 (1) | (1/1) | |
| 0.8 (2) | 5.5 (3) | 17.1 (3) | 8.3 (2) | (2/3) | |
| 1.3 (5) | 5.9 (4) | 17.5 (1) | 8.2 (3) | (3/4) | |
| 1.3 (4) | 5.2 (2) | 16.4 (5) | 7.9 (5) | (4/6) | |
| 1.3 (3) | 6.6 (5) | 16.7 (4) | 8.1 (4) | (4/5) | |
| 2.3 (6) | 9.8 (6) | 7.5 (7) | 3.6 (7) | (6/20) | |
| 2.4 (7) | 11.0 (7) | 7.8 (6) | 3.9 (6) | (6/19) | |
| 1.5 (2) | 7.3 (1) | 14.5 (1) | 7.0 (1) | (1/12) | |
| 1.5 (2) | 7.3 (2) | 14.5 (2) | 7.0 (2) | (2/14) | |
| 5.0 (3) | 31.0 (3) | 0.0 (3) | 0.0 (3) | (3/23) |
| (mm) | SMR (dB) | SCR (dB) | |||||||
|---|---|---|---|---|---|---|---|---|---|
| 10% het. | |||||||||
| d = 5.3 | 12 | 11 | 12 | 1.9 | 1.7 | 1.9 | 15.6 | 15.7 | 15.6 |
| d = 7.8 | 14 | 14 | 14 | 3.9 | 3.6 | 3.9 | 17.8 | 17.8 | 17.8 |
| d = 10.9 | 1 | 1 | 1 | 1.5 | 1.9 | 1.9 | 16.6 | 16.6 | 16.6 |
| d = 13.1 | 2 | 63 | 2 | 0.5 | 2.9 | 0.5 | 14.3 | 14 | 14.3 |
| d = 20.2 | 8 | 8 | 8 | 2.3 | 1.9 | 2.3 | 13.7 | 13.7 | 13.7 |
| 20% het. | |||||||||
| d = 5.3 | 83 | 83 | 83 | 3.5 | 3.5 | 3.5 | 14.9 | 14.9 | 14.9 |
| d = 7.8 | 21 | 76 | 21 | 1.1 | 0.7 | 1.1 | 14.6 | 14 | 14.6 |
| d = 10.9 | 45 | 52 | 45 | 0.9 | 0.8 | 0.9 | 12.8 | 12.8 | 12.8 |
| d = 13.1 | 3 | 4 | 3 | 3.8 | 3.6 | 3.8 | 17.9 | 17.9 | 17.9 |
| d = 20.2 | 7 | 8 | 7 | 2.4 | 2.5 | 2.4 | 15.5 | 15.6 | 15.5 |
| 30% het. | |||||||||
| d = 5.3 | 36 | 16 | 36 | 0.1 | 0.6 | 0.1 | 11.8 | 10.4 | 11.8 |
| d = 7.8 | 21 | 21 | 21 | 0.2 | 0.2 | 0.2 | 12.1 | 12.1 | 12.1 |
| d = 10.9 | 29 | 29 | 29 | 0.5 | 0.9 | 0.5 | 11.9 | 12.1 | 11.9 |
| d = 13.1 | 39 | 28 | 39 | 0.6 | 1 | 0.6 | 13 | 11.1 | 13 |
| d = 20.2 | 13 | 9 | 13 | 1.2 | 1.3 | 1.2 | 16.5 | 15.6 | 16.5 |
© 2017 by the authors. Licensee MDPI, Basel, Switzerland. This article is an open access article distributed under the terms and conditions of the Creative Commons Attribution (CC BY) license (http://creativecommons.org/licenses/by/4.0/).
Share and Cite
O’Loughlin, D.; Oliveira, B.L.; Elahi, M.A.; Glavin, M.; Jones, E.; Popović, M.; O’Halloran, M. Parameter Search Algorithms for Microwave Radar-Based Breast Imaging: Focal Quality Metrics as Fitness Functions. Sensors 2017, 17, 2823. https://doi.org/10.3390/s17122823
O’Loughlin D, Oliveira BL, Elahi MA, Glavin M, Jones E, Popović M, O’Halloran M. Parameter Search Algorithms for Microwave Radar-Based Breast Imaging: Focal Quality Metrics as Fitness Functions. Sensors. 2017; 17(12):2823. https://doi.org/10.3390/s17122823
Chicago/Turabian StyleO’Loughlin, Declan, Bárbara L. Oliveira, Muhammad Adnan Elahi, Martin Glavin, Edward Jones, Milica Popović, and Martin O’Halloran. 2017. "Parameter Search Algorithms for Microwave Radar-Based Breast Imaging: Focal Quality Metrics as Fitness Functions" Sensors 17, no. 12: 2823. https://doi.org/10.3390/s17122823