
Non-Destructive Sensor-Based Prediction of Maturity and Optimum Harvest Date of Sweet Cherry Fruit


Abstract
:1. Introduction
2. Materials and Methods
2.1. Plant Material
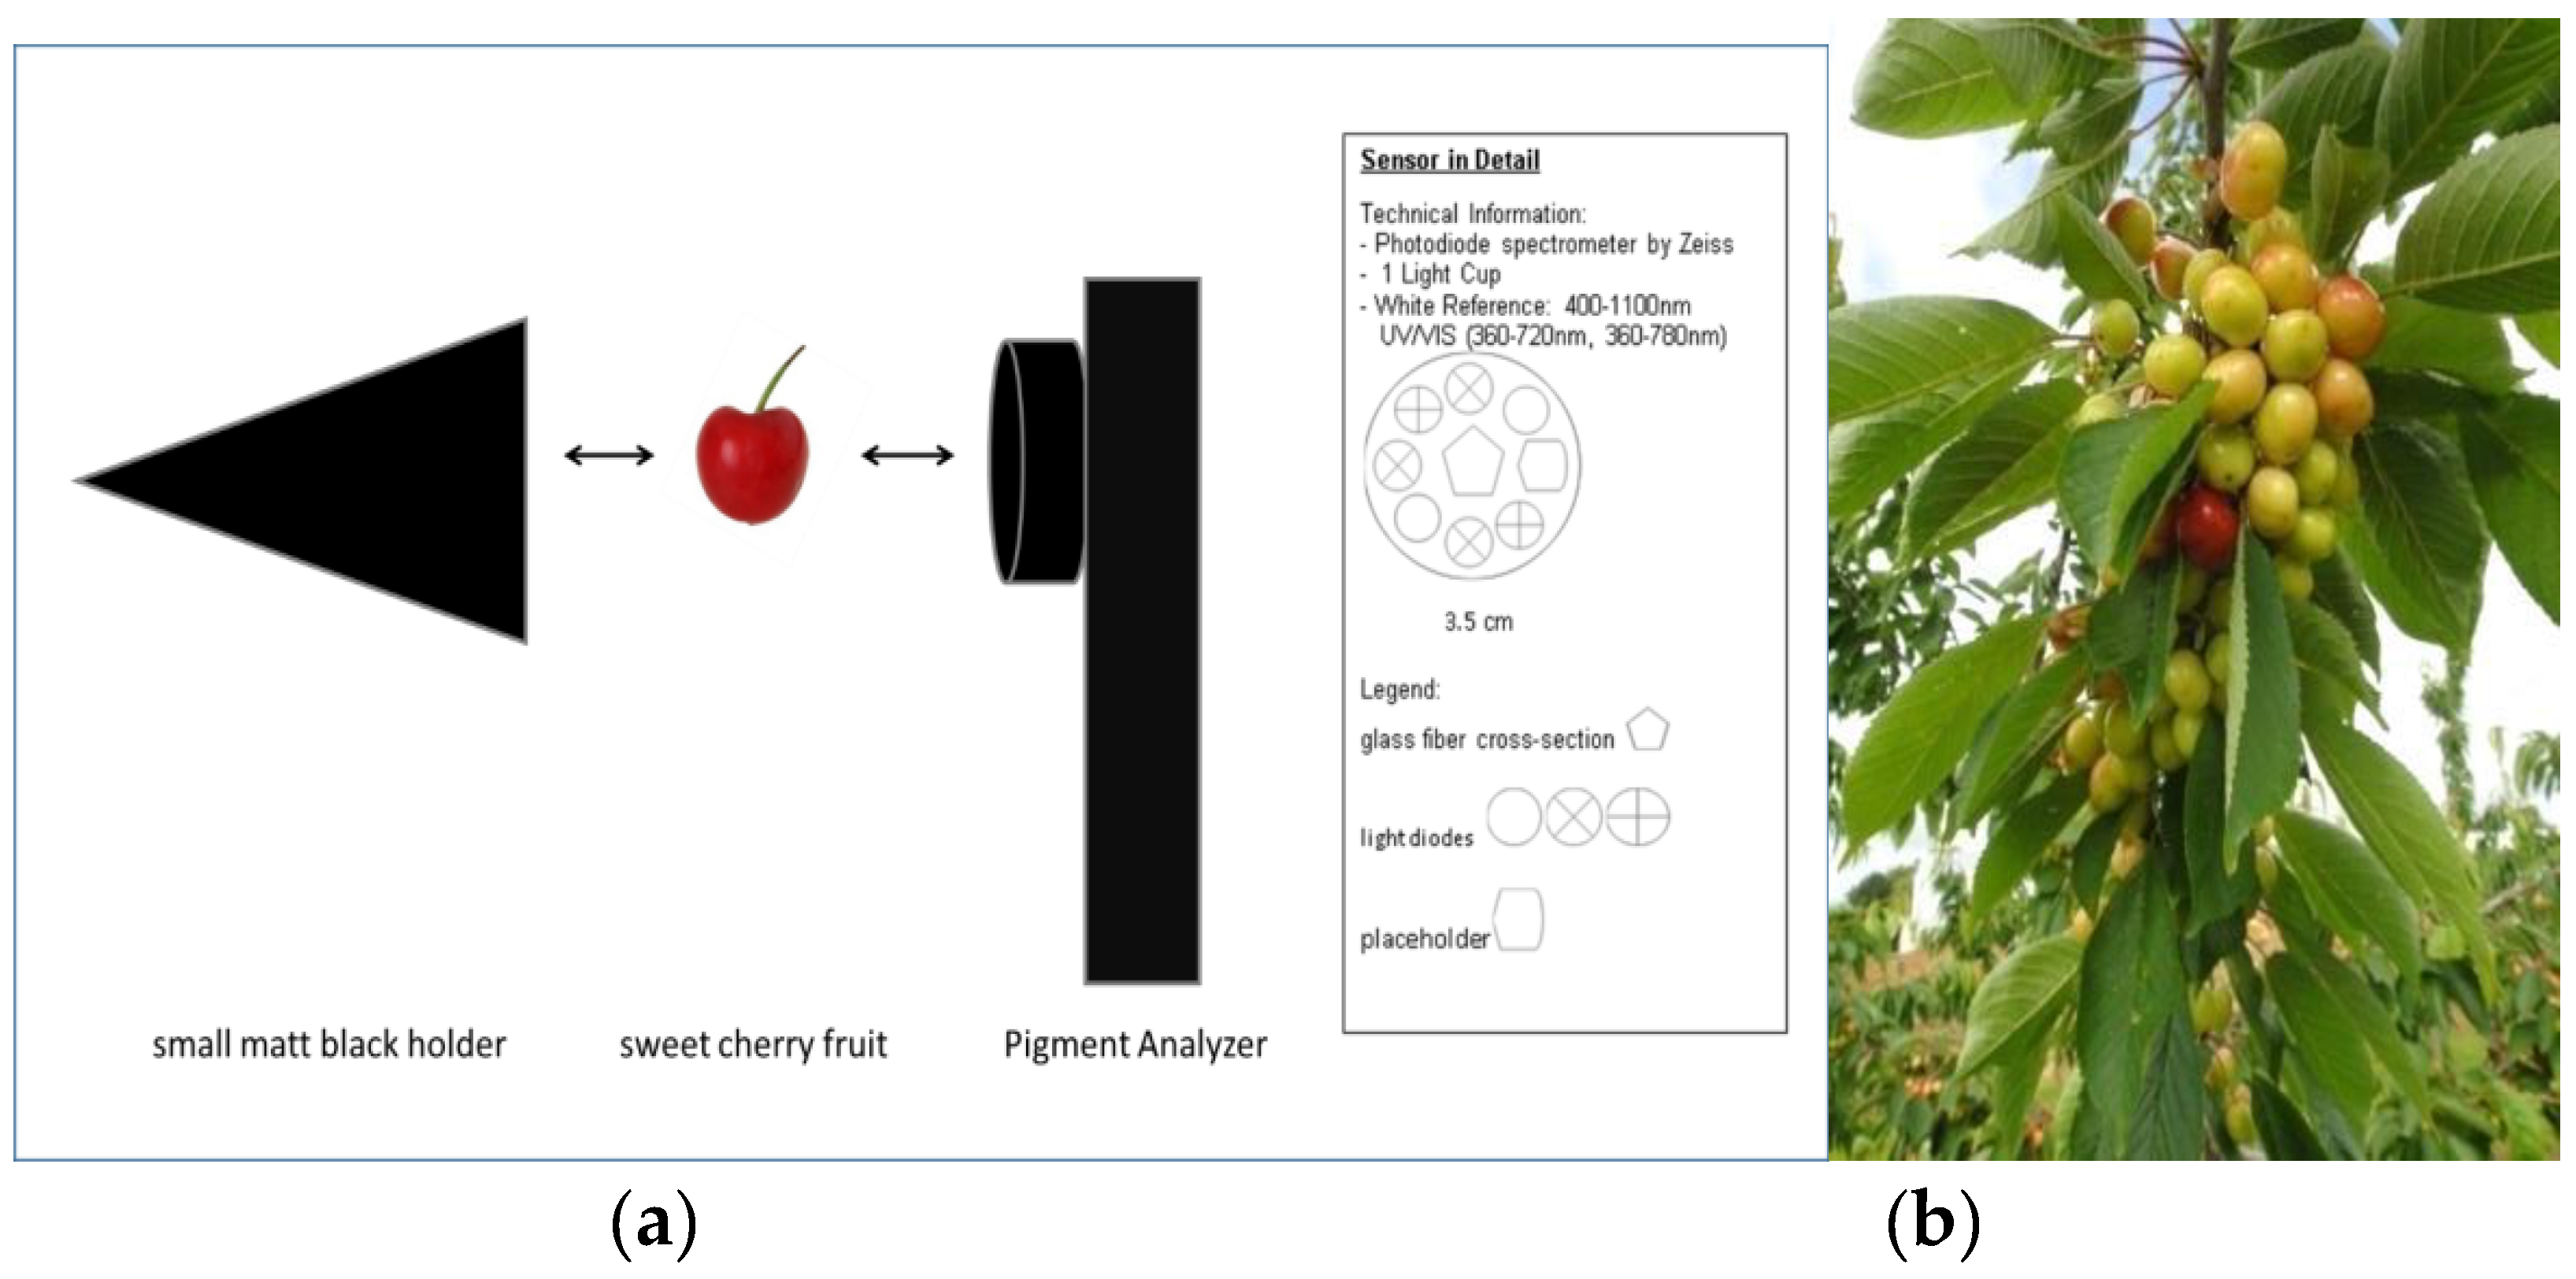
2.2. Instrumentation and Sampling
2.3. Fruit Quality Assessment
2.4. Determination of Secondary Compounds
2.4.1. Preparation of Cherry Fruits for Measurements
2.4.2. Pigment Analysis
2.5. Statistics
3. Results
3.1. Mircroclimate
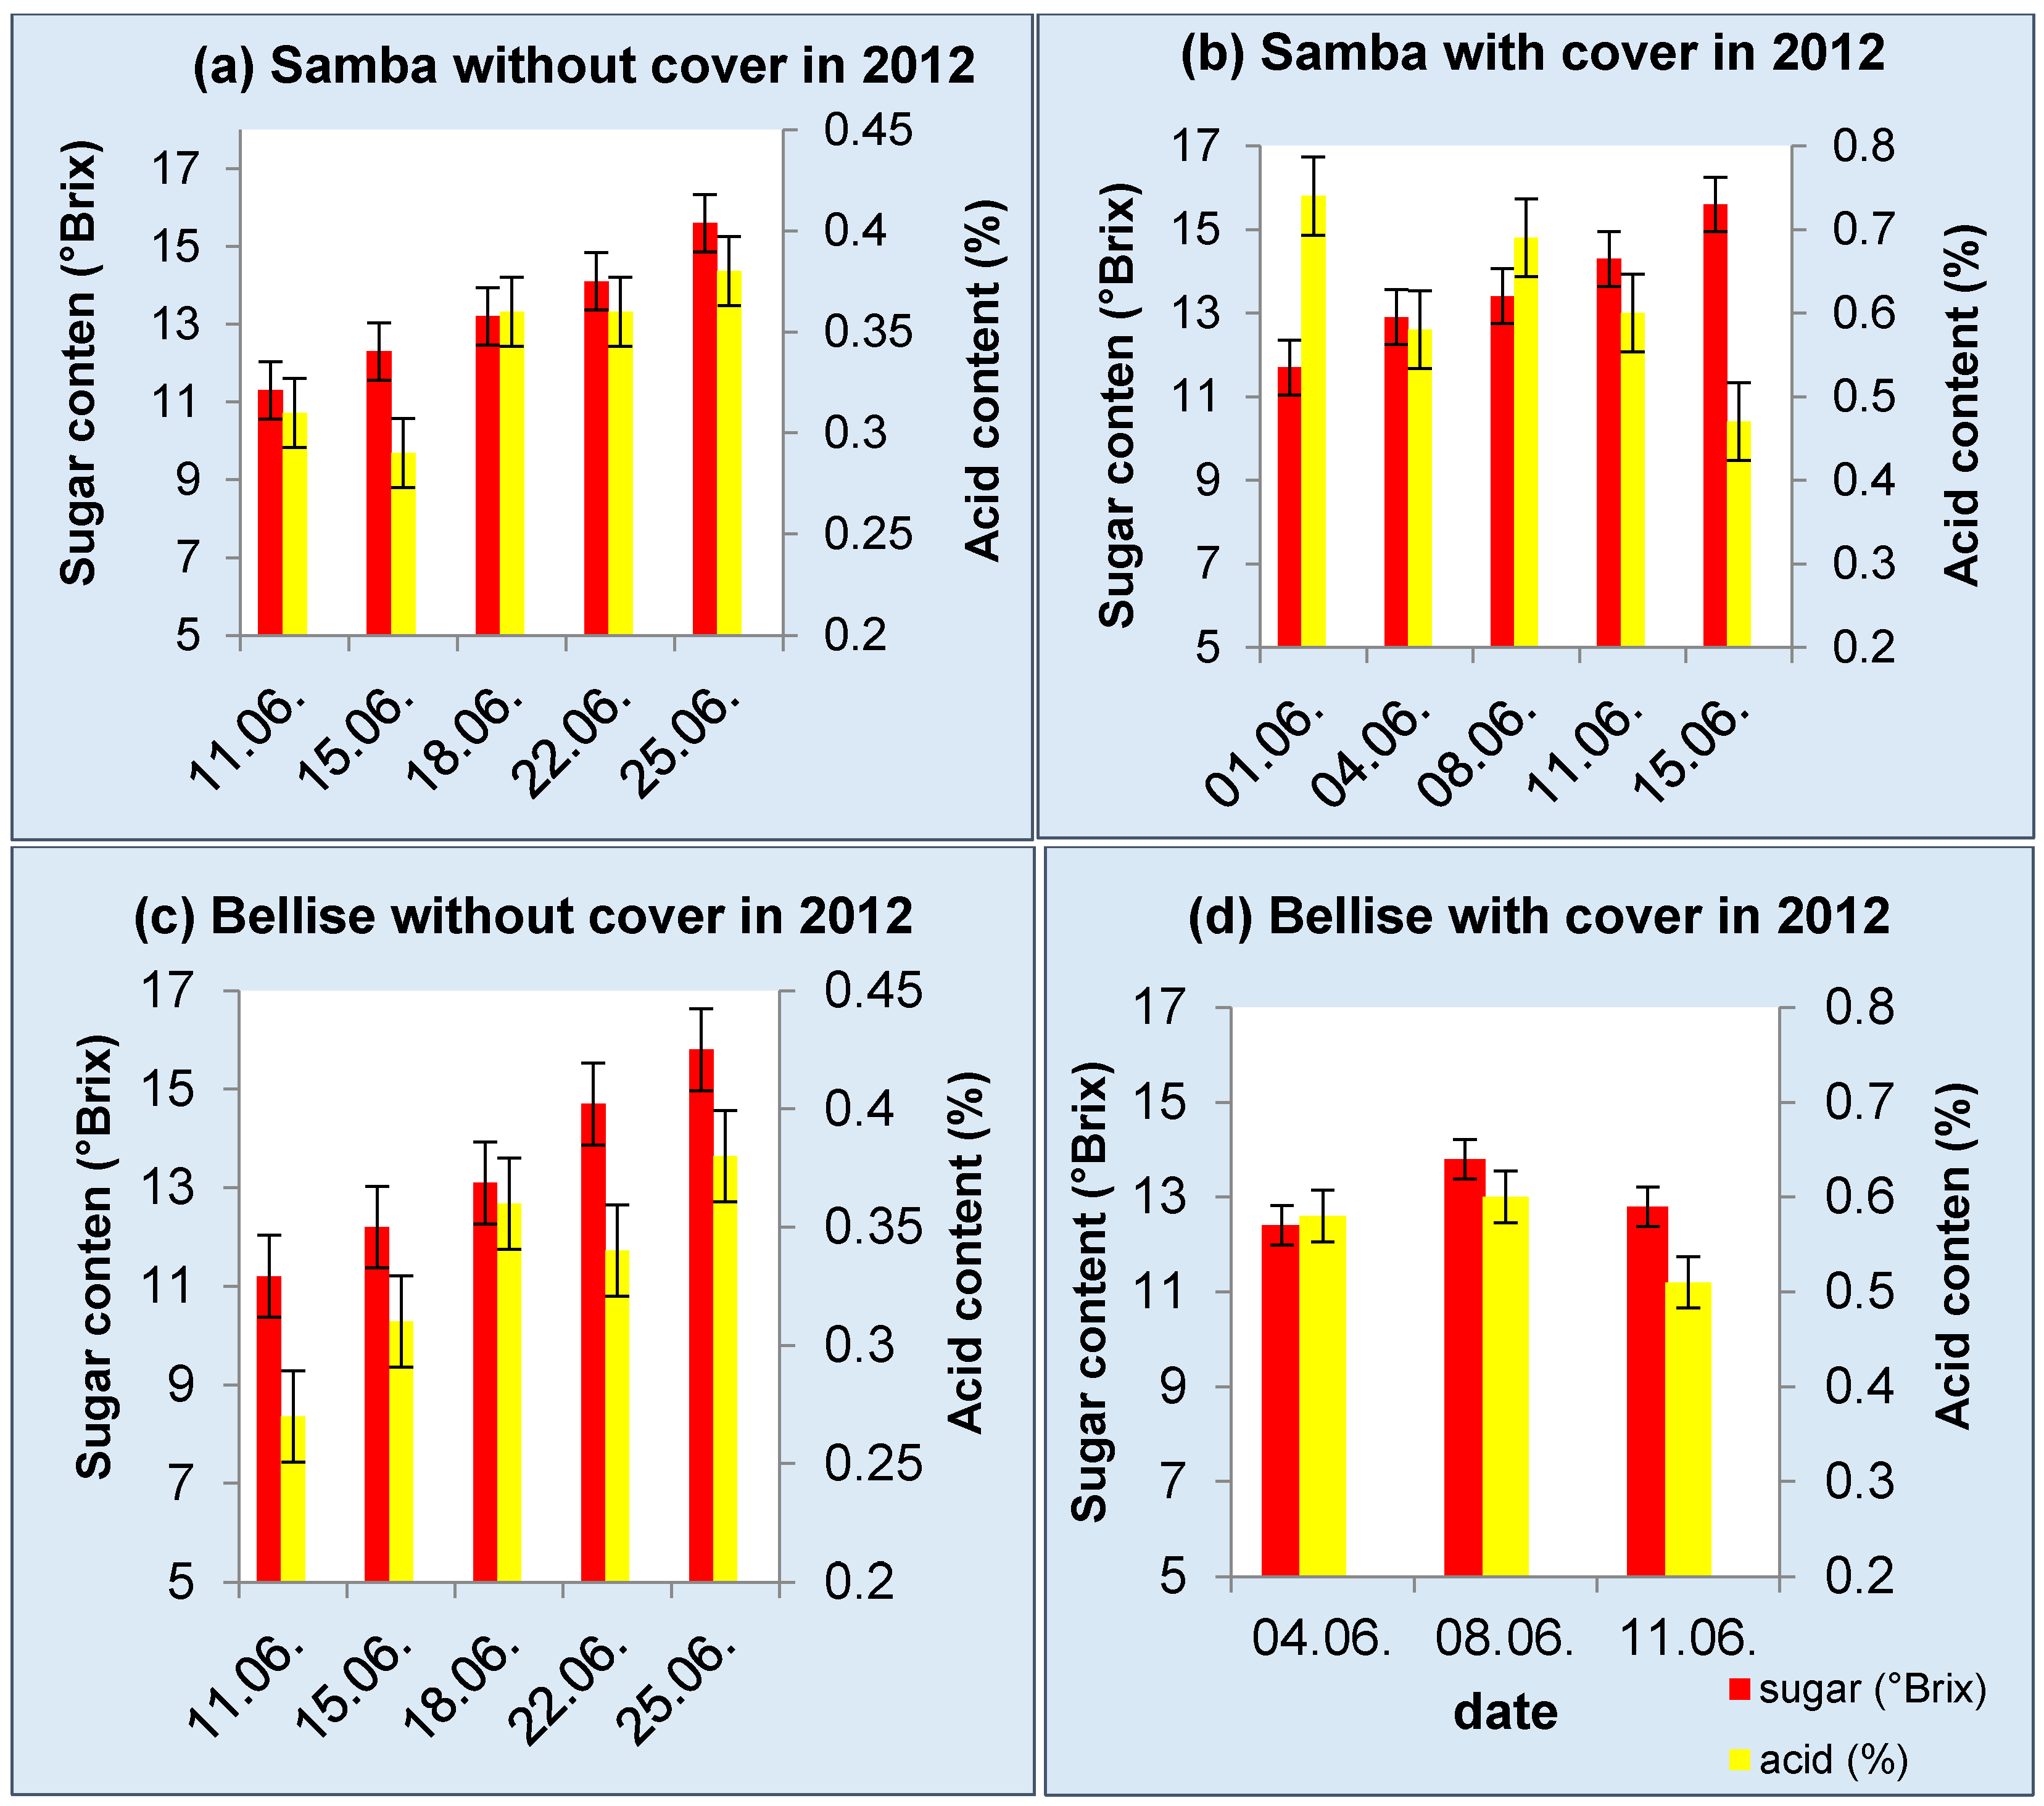
3.2. Fruit Quality
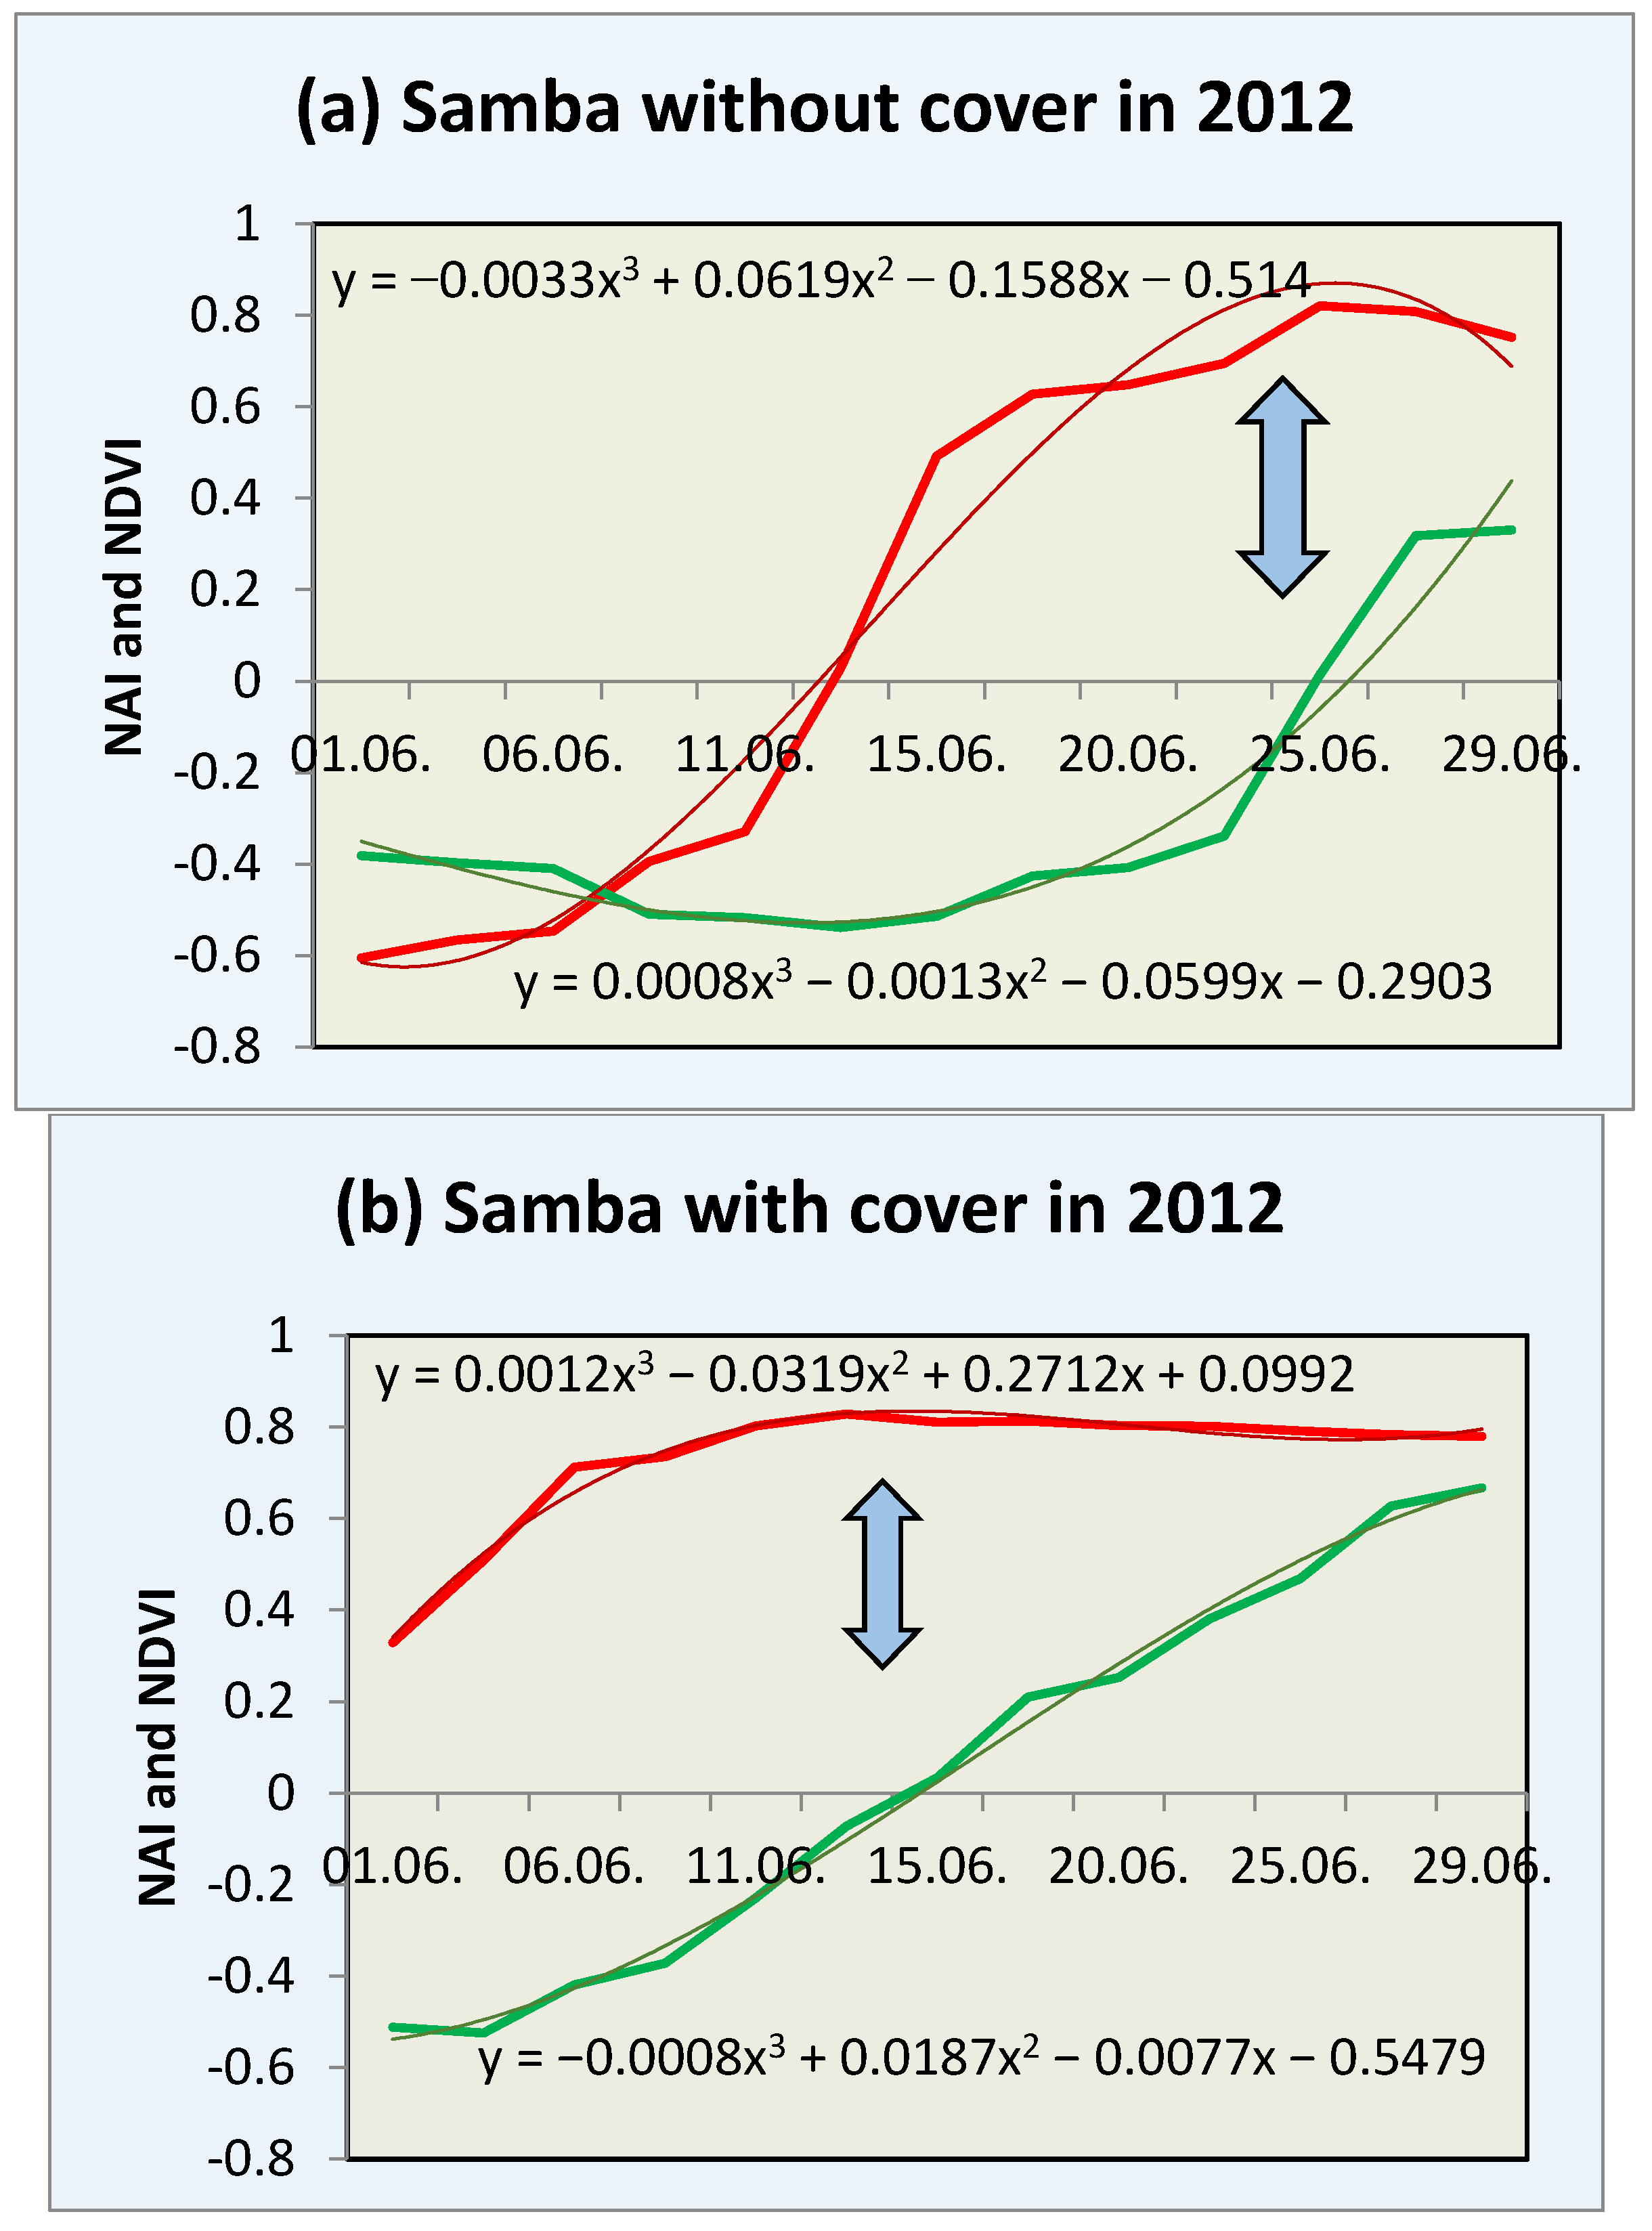
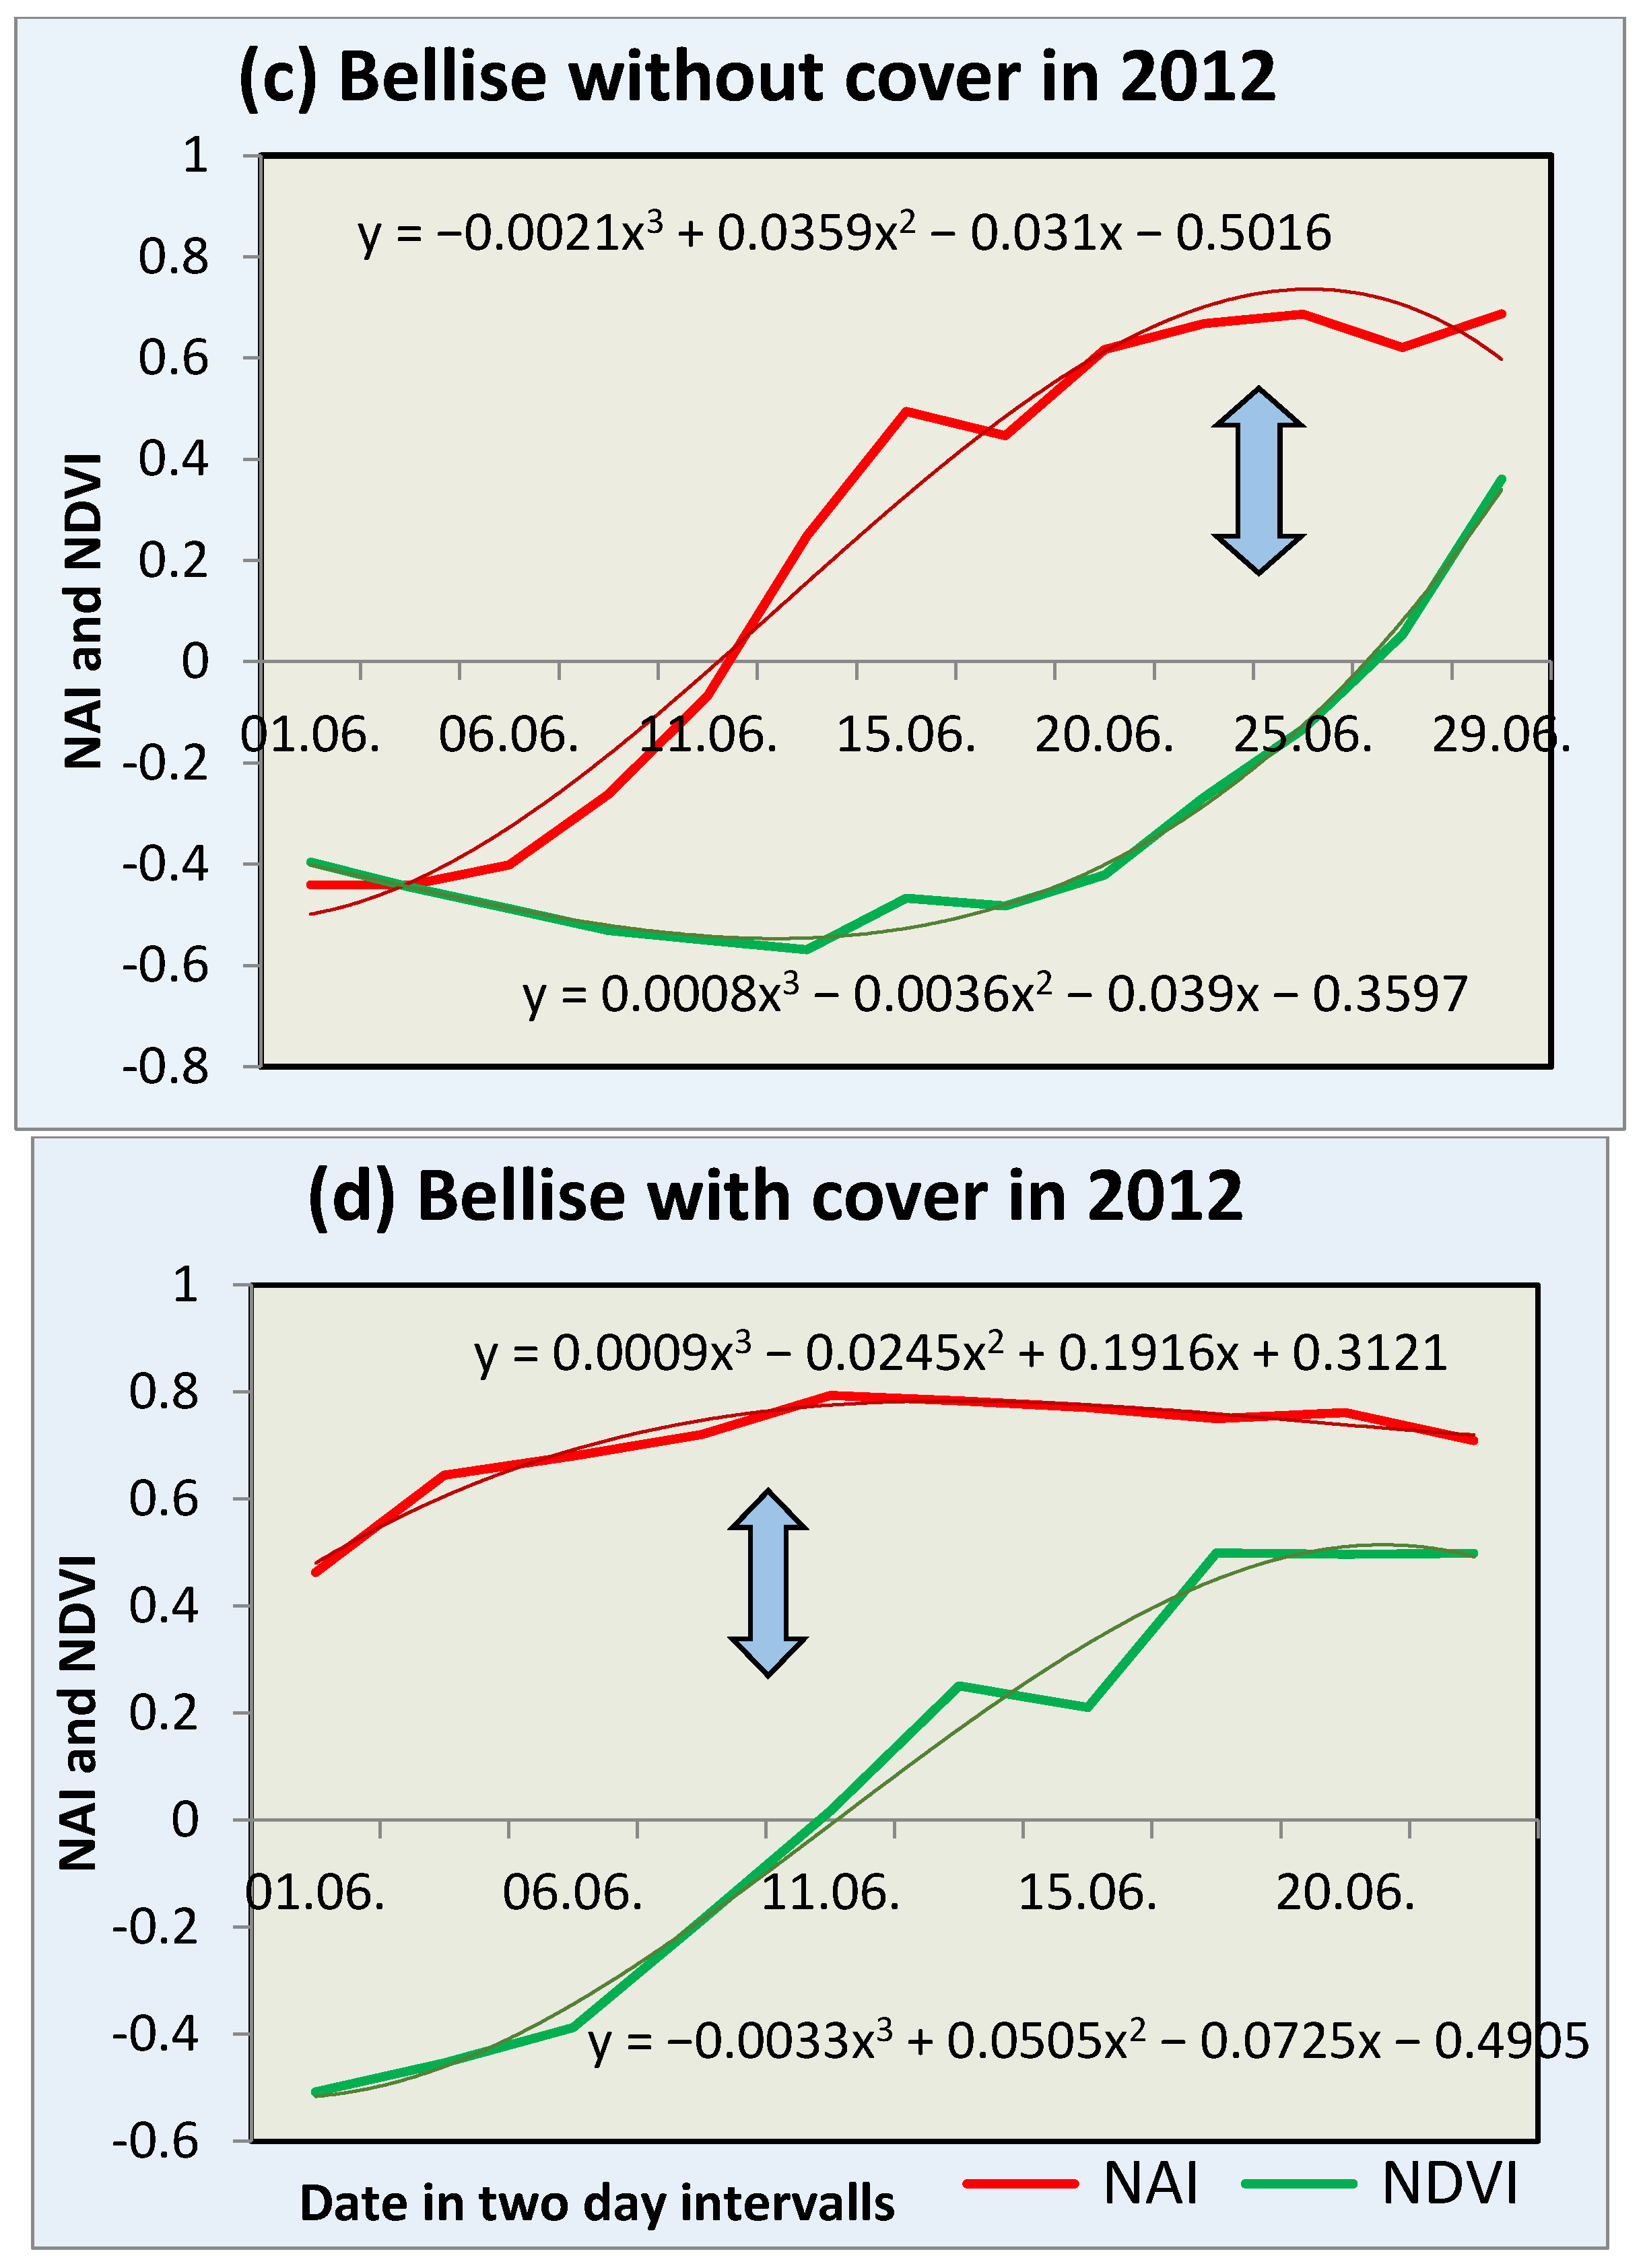
3.3. Proposed Maturity Model
3.4. Harvest Prediction
4. Discussion
5. Conclusions
Acknowledgments
Author Contributions
Conflicts of Interest
Abbreviations
| NAI | Normalised anthocyanins index |
| NDVI | Normalised differential vegetation index |
| OHD | Optimum harvest date |
References
- Harker, F.R.; Marsh, K.B.; Young, H.; Murray, S.H.; Gunson, F.A.; Walker, S.B. Sensory interpretation of instrumental measurements 2: Sweet and acid tasteof apple fruit. Postharvest Biol. Technol. 2002, 24, 241–250. [Google Scholar] [CrossRef]
- De Jager, A.; Roelofs, F.P.M.M. Prediction of optimum harvest date of Jonagold. In Determination and Prediction of Optimum Harvest Date of Apples and Pears. COST 94: The Postharvest Treatment of Fruit and Vegetables; DeJager, A., Johnson, D., Höhn, E., Eds.; European Commission: Luxembourg, 1996; pp. 21–31. [Google Scholar]
- De Jager, A.; Johnson, D.; Höhn, E. Determination and prediction of optimum harvest date of apples and pears. In COST 94: The Postharvest Treatment of Fruit and Vegetables; European Commission: Luxembourg, 1996; p. 171. [Google Scholar]
- Zerbini, E.P.; Pianezzola, A.; Grassi, M. Poststorage sensory profiles of fruit of five apple cultivars harvested at different maturity stages. J. Food Qual. 1999, 22, 1–17. [Google Scholar] [CrossRef]
- Wills, R.B.H.; Scriven, F.M.; Greenfield, H. Nutrient Composition of Stone Fruit (Prunus spp.) Cultivars: Apricot, Cherry, Nectarine, Peach and Plum. J. Sci. Food Agric. 1983, 34, 1383–1389. [Google Scholar] [CrossRef] [PubMed]
- Hodgson, J.M.; Croft, K.D. Dietary flavonoids: Effects on endothelial function and blood pressure. J. Sci. Food Agric. 2006, 86, 2492–2498. [Google Scholar] [CrossRef]
- Crisoto, C.H. Stone fruit maturity indices: A descriptive review. Postharvest News Inf. 1994, 5, 65N–68N. [Google Scholar]
- Olsen, K.L.; Schomer, H.A.; Bartram, R.D. Segretation of ‘Golden Delicius’ apples for quality by light transmission. J. Am. Soc. Hortic. Sci. 1969, 91, 821–828. [Google Scholar]
- Merzlyak, M.N.; Gitelson, A.A.; Chivkunova, O.B.; Rakitin, V.Y. Non-destructive optical detection of pigment changes during leaf senescence and fruit ripening. Physiol. Plant. 1999, 106, 135–141. [Google Scholar] [CrossRef]
- Slaughter, D.C. Nondestructive determination of internal quality in peaches and nectarines. Trans. ASAE 1995, 38, 617–623. [Google Scholar] [CrossRef]
- Merés, P.; Lovász, T.; Sass, P. Postharvest physiological changes of apple in respect of picking date. In The Post-Harvest Treatment of Fruit and Vegetables—Current Status and Future Prospects, Proceedings of the 6th International Symposium of the European Concerted Action Program COST 94, Oosterbeek, The Netherlands, 19–22 October 1994; European Commission: Brussels, Belgium, 1994; pp. 251–257. [Google Scholar]
- Zude-Sasse, M.; Truppel, I.; Herold, B. An approach to non-destructive apple fruit chlorophyll determination. Postharvest Biol. Technol. 2002, 25, 123–133. [Google Scholar] [CrossRef]
- Blanke, M.M.; Notton, B.A. Light transmission into apple fruit and leaves. Sci. Hortic. 1992, 51, 43–53. [Google Scholar] [CrossRef]
- Solomakhin, A.; Blanke, M.M. Overcoming adverse effects of hailnets on fruit quality and microclimate in an apple orchard. J. Sci. Food Agric. 2007, 87, 2625–2637. [Google Scholar] [CrossRef] [PubMed]
- Schmitz-Eiberger, M.; Blanke, M.M. Bioactive components in forced sweet cherry fruit (Prunus avium L.), antioxidative capacity and allergenic potential as dependent on cultivation under cover. LWT Food Sci. Technol. 2012, 46, 388–392. [Google Scholar] [CrossRef]
- Solovchenko, A.; Schmitz-Eiberger, M. Significance of skin flavonoids for UV-B-protection in apple fruits. J. Exp. Bot. 2003, 54, 1977–1984. [Google Scholar] [CrossRef] [PubMed]
- Wellburn, A.R. The spectral determination of chlorophyll a and chlorophyll b, as well as total carotenoids, using various solvents with spectrophotometers of different resolution. J. Plant Physiol. 1994, 144, 307–313. [Google Scholar] [CrossRef]
- Grossmann, Y.L.; DeJong, T.M. PEACH: A simulation model of reproductive and vegetative growth in peach trees. Tree Phys. 1994, 14, 329–345. [Google Scholar] [CrossRef]
- Ben Mimoun, M.; DeJong, T.M. Using the relation between growing degree hours and harvest date to estimate run-times for peach: A tree growth and yield simulation model. Acta Hortic. 1999, 499, 107–114. [Google Scholar] [CrossRef]
- Lopez, G.; DeJong, T. Using growing degree hours accumulated thirty days after bloom to help growers predict difficult fruit sizing years. Acta Hortic. 2008, 803, 175–180. [Google Scholar] [CrossRef]
- Kuckenberg, J.; Tartachnyk, I.; Noga, G. Evaluation of fluorescence and remission techniques for monitoring changes in peel chlorophyll and internal fruit characteristics in sunlit and shaded sides of apple fruit during shelf-life. Postharvest Biol. Technol. 2008, 48, 231–241. [Google Scholar] [CrossRef]
- Blanke, M.M.; Olzem, S.; Köhler, H. Roter Glanz der Kirschen - Shiny red cherries. J. Appl. Bot. 2001, 75, 39–42. [Google Scholar]
- Overbeck, V.; Schmitz-Eiberger, M.; Blanke, M.M. Influence of Extenday® under hail nets on fruit quality, coloration and secondary ingredients in apple fruits. J. Sci. Food Agric. 2013, 93, 2575–2579. [Google Scholar] [CrossRef] [PubMed]
- Nijveldt, R.J.; van Noord, E.; van Hoorn, D.E.C.; Boelens, P.G.B.; van Nooren, K.; van Leuwen, P.A.M. Flavonoids: A review of probable mechanisms of action and potential applications. Am. J. Clin. Nutr. 2001, 74, 418–426. [Google Scholar] [PubMed]
- Erlejmann, A.G.; Fraga, C.G.; Oteiza, P.I. Procyanidins protect Caco-2 cells from bile acid- and oxidant-induced damage. Free Radic. Biol. Med. 2006, 41, 1247–1256. [Google Scholar] [CrossRef] [PubMed]
- Zude, M. Comparison of indices and multivariate models to non-destructively predict the fruit chlorophyll by means of visible spectrometry in apple fruit. Anal. Chim. Acta 2003, 481, 119–126. [Google Scholar] [CrossRef]


| Date | 29.05 | 01.06 | 04.06 | 08.06 | 11.06 | 15.06 |
|---|---|---|---|---|---|---|
| Bellise with cover | ||||||
| Fruit size (mm); SD | 22.0 ± 1.0 | 23.5 ± 1.8 | 22.9 ± 2.3 | 24.7 ± 2.0 | 25.6 ± 1.7 | |
| Fruit weight (g); SD | 5.6 ± 0.6 | 6.1 ± 1.2 | 6.3 ± 1.7 | 7.5 ± 1.6 | 8.4 ± 1.5 | |
| Firmness (Shore A); SD | 64.8 ± 14.8 | 65.9 ± 24.2 | 66.0 ± 25.7 | 52.7 ± 14.9 | 54.9 ± 21.3 | |
| Samba with cover | ||||||
| Fruit size (mm); SD | 19.7 ± 0.7 | 21.6 ± 1.2 | 23.0 ± 1.6 | 23.8 ± 1.6 | 24.8 ± 1.6 | 25.8 ± 1.3 |
| Fruit weight (g); SD | 4.8 ± 0.4 | 5.6 ± 0.8 | 6.6 ± 1.2 | 7.6 ± 1.2 | 8.2 ± 1.3 | 9.6 ± 1.2 |
| Firmness (Shore A); SD | 86.7 ± 11.7 | 53.1 ± 28.8 | 77.9 ± 15.7 | 62.5 ± 18.6 | 69.3 ± 12.9 | 75.8 ± 11.5 |
| Date | 29.05 | 01.06 | 04.06 | 08.06 | 11.06 | 15.06 | 18.06 | 22.06 | 25.06 |
|---|---|---|---|---|---|---|---|---|---|
| Bellise without cover | |||||||||
| Fruit size (mm); SD | 16.5 ± 1.1 | 18.5 ± 1.1 | 20.1 ± 1.3 | 20.3 ± 1.1 | 21.1 ± 1.2 | 22.6 ± 1.1 | 22.8 ± 1.4 | 23.9 ± 1.5 | 24.3 ± 1.4 |
| Fruit weight (g); SD | 2.6 ± 0.5 | 3.2 ± 0.5 | 4.0 ± 0.6 | 4.2 ± 0.6 | 4.8 ± 0.7 | 5.9 ± 0.8 | 6.2 ± 0.9 | 7.7 ± 1.3 | 7.9 ± 1.1 |
| Firmness (Shore A); SD | 100 | 100 | 100 | 100 | 100 | 100 | 100 | 75.8 ± 11.8 | 70.9 ± 12.4 |
| Samba without cover | |||||||||
| Fruit size (mm); SD | 17.2 ± 0.6 | 18.2 ± 1.1 | 19.1 ± 1.6 | 20.5 ± 1.5 | 20.9 ± 1.0 | 21.4 ± 1.4 | 21.9 ± 1.3 | 23.1 ± 1.2 | 24.5 ± 1.1 |
| Fruit weight (g); SD | 3.2 ± 0.2 | 3.6 ± 0.2 | 4.1 ± 0.7 | 4.9 ± 0.8 | 5.3 ± 0.7 | 6.0 ± 1.1 | 6.4 ± 1.0 | 7.5 ± 1.1 | 8.7 ± 1.1 |
| Firmness (Shore A); SD | 100 | 100 | 100 | 100 | 100 | 100 | 100 | 74.9 ± 7.5 | 70.5 ± 8.7 |
| Date | 29.05 | 01.06 | 04.06 | 08.06 | 11.06 | 15.06 | 18.06 |
|---|---|---|---|---|---|---|---|
| Bellise with cover | |||||||
| Chl a (nmol·g−1) | 0.07 | 0.06 | 0.06 | 0.01 | 0.01 | ||
| Chl b (nmol·g−1) | 0.03 | 0.02 | n.d. | 0.02 | n.d. | ||
| Carotenoids (nmol·g−1) | 1.39 | 1.93 | 0.71 | 0.02 | 1.35 | ||
| Flavonoids (nmol·g−1) | 34.5 | 45.2 | 41.3 | 78.8 | 85.9 | ||
| Anthocyanins (nmol·g−1) | 1.38 | 5.79 | 27.2 | 106.5 | 190.7 | ||
| Samba with cover | |||||||
| Chl a (nmol·g−1) | 0.26 | 0.33 | 1.14 | 0.06 | 0.15 | 0.03 | 0.00 |
| Chl b (nmol·g−1) | 0.03 | 0.10 | 1.7 | 0.03 | 0.33 | 0.11 | n.d. |
| Carotenoids (nmol·g−1) | 2.08 | 2.27 | 5.42 | 1.42 | 0.72 | 0.16 | 1.35 |
| Flavonoids (nmol·g−1) | 153 | 162 | 208 | 154 | 193 | 198 | 234 |
| Anthocyanins (nmol·g−1) | 7.43 | 11.96 | 7.97 | 11.1 | 45.3 | 69.6 | 106.6 |
| Date | 29.05 | 01.06 | 04.06 | 08.06 | 11.06 | 15.06 | 18.06 | 22.06 | 25.06 |
|---|---|---|---|---|---|---|---|---|---|
| Bellise without cover | |||||||||
| Chl a (nmol·g−1) | 3.53 | 0.02 | 0.00 | 0.20 | 0.07 | n.d. | n.d. | n.d. | n.d. |
| Chl b (nmol·g−) | 2.16 | 0.07 | n.d. | 0.03 | 0.02 | n.d. | n.d. | n.d. | n.d. |
| Carotenoids (nmol·g−1) | 5.08 | 0.06 | 0.00 | 3.10 | 1.67 | 0.56 | n.d. | n.d. | 1.14 |
| Flavonoids (nmol·g−1) | 92.2 | 94.4 | 33.7 | 70.6 | 51.5 | 45.8 | 53.49 | 86.4 | 84.7 |
| Anthocyanins (nmol·g−1) | 5.58 | 7.27 | 3.65 | 14.33 | 4.46 | 13.07 | 11.28 | 30.3 | 114.3 |
| Samba without cover | |||||||||
| Chl a (nmol·g−1) | 0.01 | 0.00 | 0.05 | 0.25 | n.d. | 0.12 | 0.02 | 0.05 | n.d. |
| Chl b (nmol·g−1) | 0.01 | n.d. | n.d. | 0.05 | n.d. | 0.25 | n.d. | 0.07 | n.d. |
| Carotenoids (nmol·g−1) | 0.01 | 0.00 | 0.07 | 1.99 | 0.05 | 1.18 | 1.45 | 1.43 | n.d. |
| Flavonoids (nmol·g−1) | 188 | 242 | 255 | 175 | 171 | 178 | 176 | 169 | 215 |
| Anthocyanins (nmol·g−1) | 9.47 | 6.16 | 5.50 | 5.18 | 4.78 | 15.6 | 36.9 | 31.3 | 172.8 |
© 2017 by the authors. Licensee MDPI, Basel, Switzerland. This article is an open access article distributed under the terms and conditions of the Creative Commons Attribution (CC BY) license ( http://creativecommons.org/licenses/by/4.0/).
Share and Cite
Overbeck, V.; Schmitz, M.; Blanke, M. Non-Destructive Sensor-Based Prediction of Maturity and Optimum Harvest Date of Sweet Cherry Fruit. Sensors 2017, 17, 277. https://doi.org/10.3390/s17020277
Overbeck V, Schmitz M, Blanke M. Non-Destructive Sensor-Based Prediction of Maturity and Optimum Harvest Date of Sweet Cherry Fruit. Sensors. 2017; 17(2):277. https://doi.org/10.3390/s17020277
Chicago/Turabian StyleOverbeck, Verena, Michaela Schmitz, and Michael Blanke. 2017. "Non-Destructive Sensor-Based Prediction of Maturity and Optimum Harvest Date of Sweet Cherry Fruit" Sensors 17, no. 2: 277. https://doi.org/10.3390/s17020277