
Design and Elementary Evaluation of a Highly-Automated Fluorescence-Based Instrument System for On-Site Detection of Food-Borne Pathogens

 ,
,
Abstract
:1. Introduction
2. Materials and Methods
2.1. Quantum Dot Sample Preparation
2.2. Bacteria Sample Preparation
2.3. Apparatus and Software
3. Instrument System Description
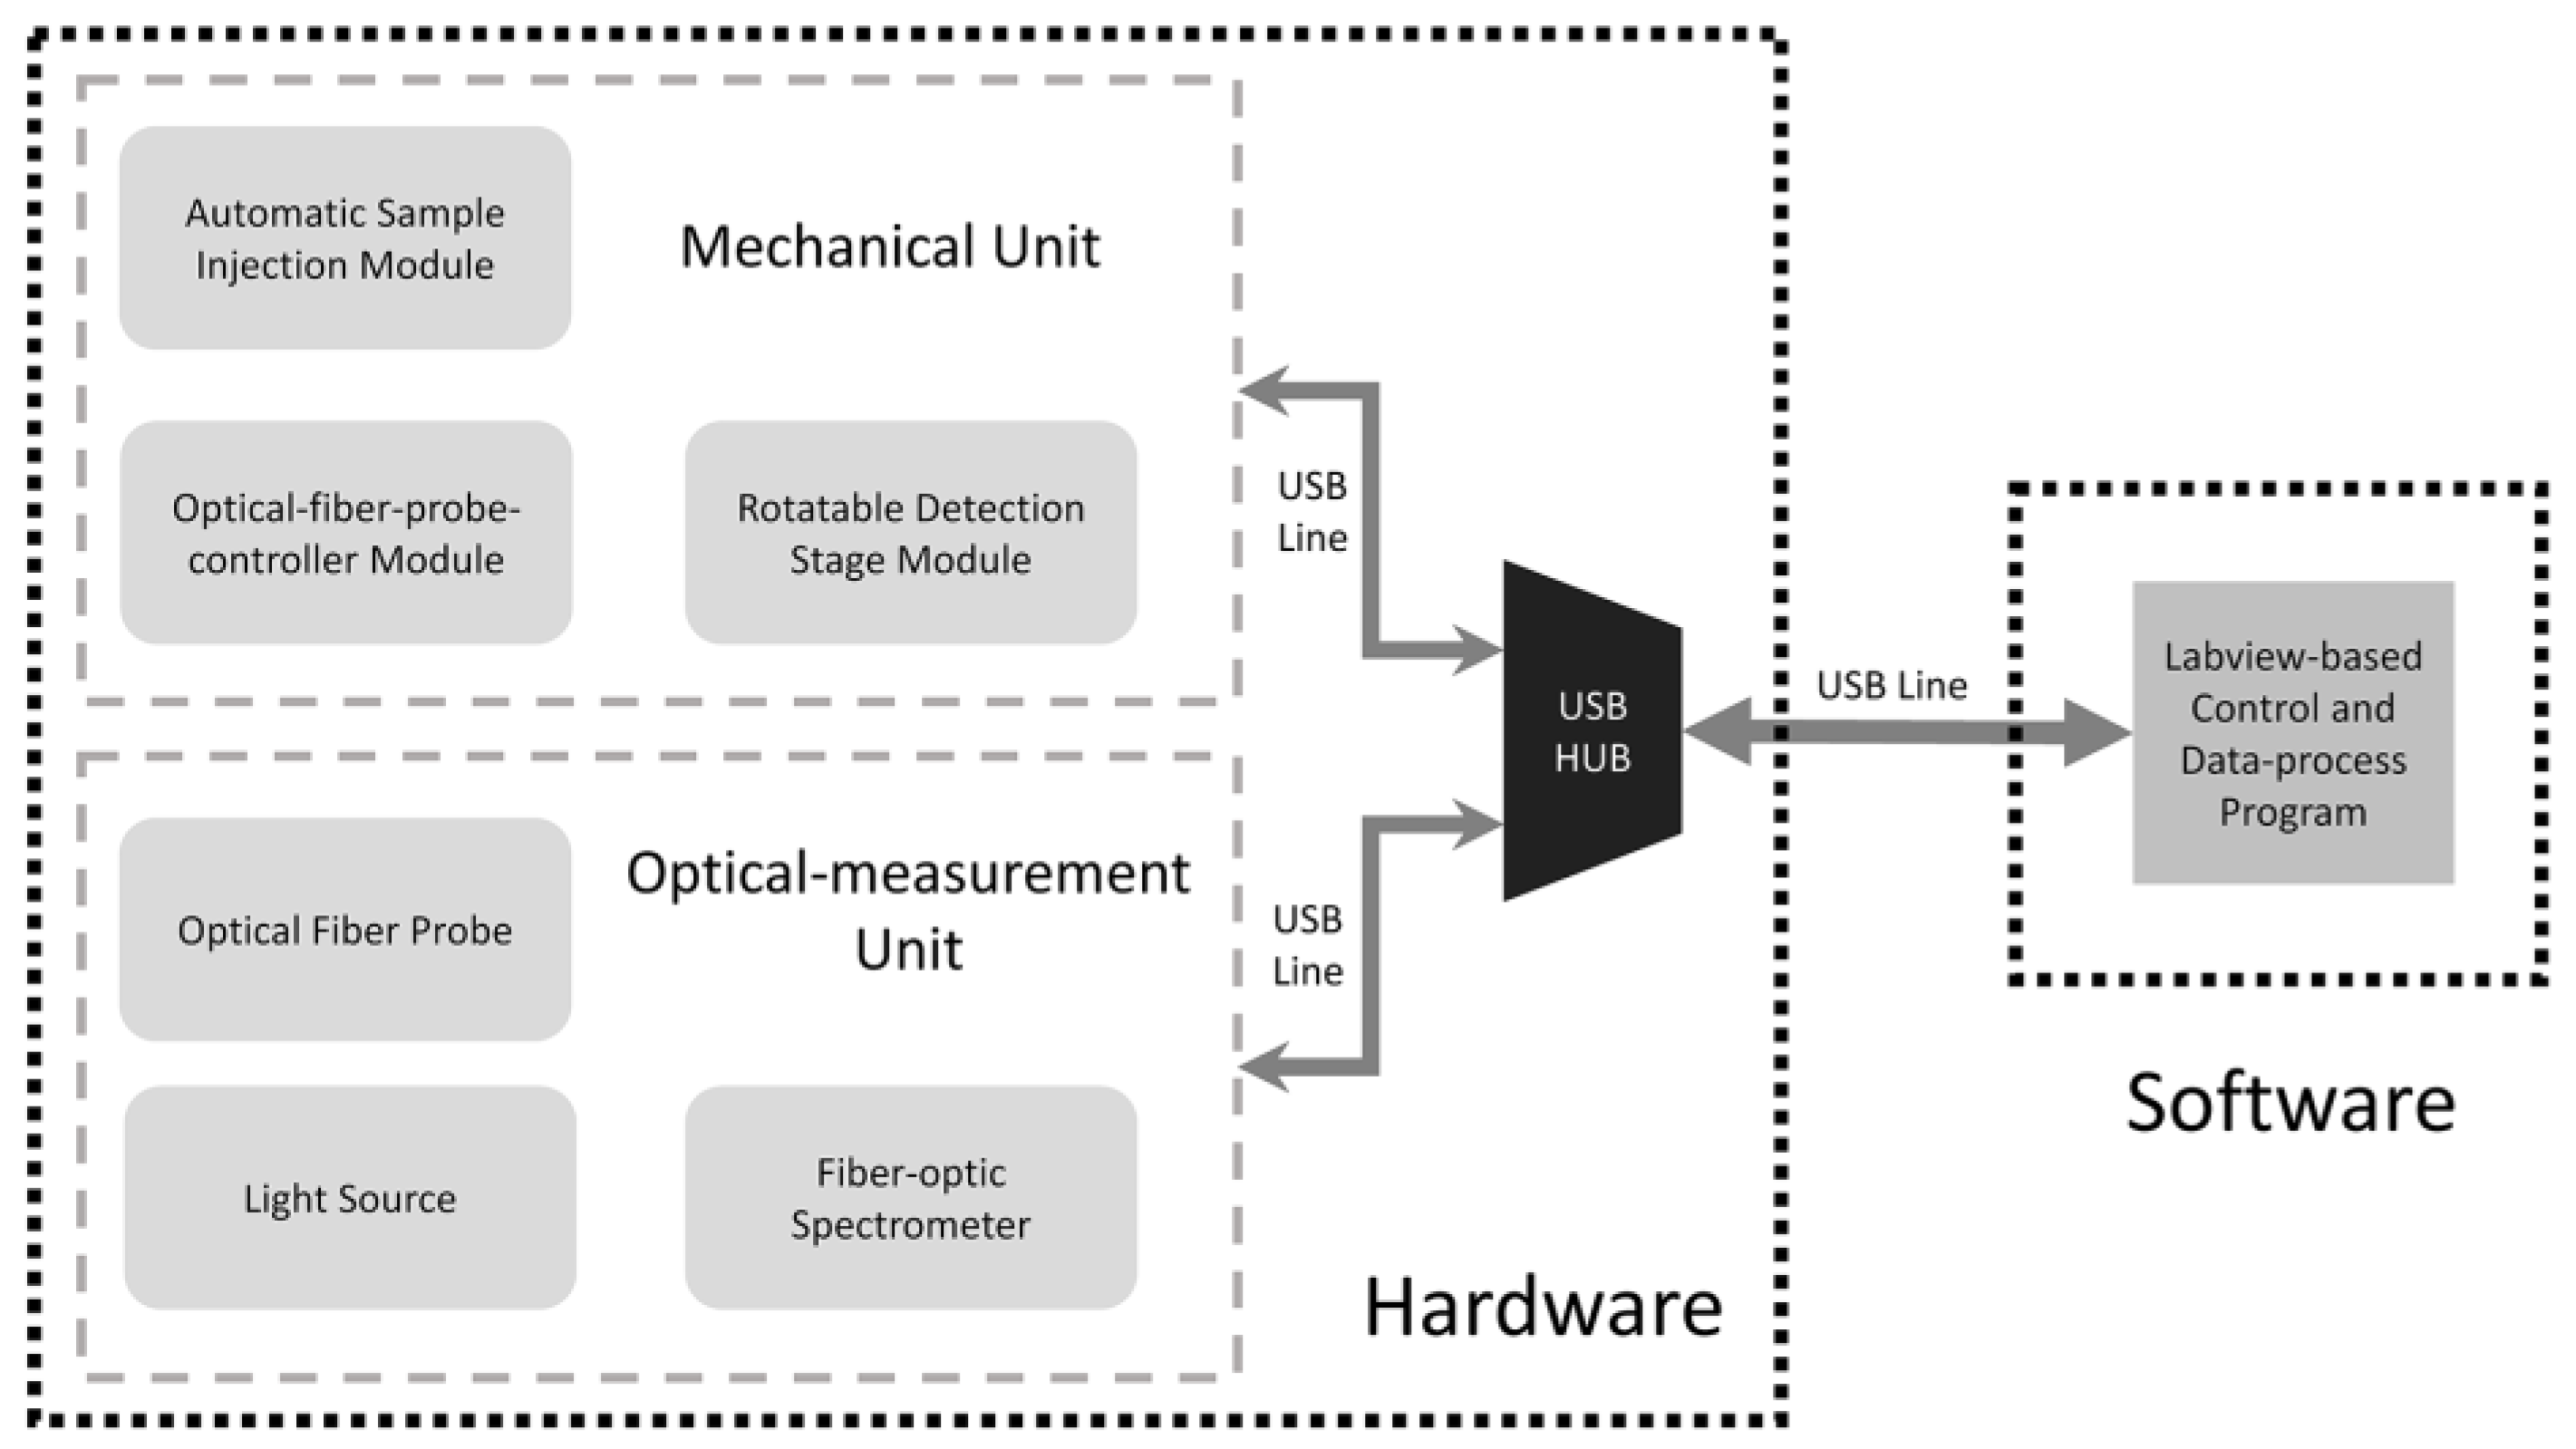
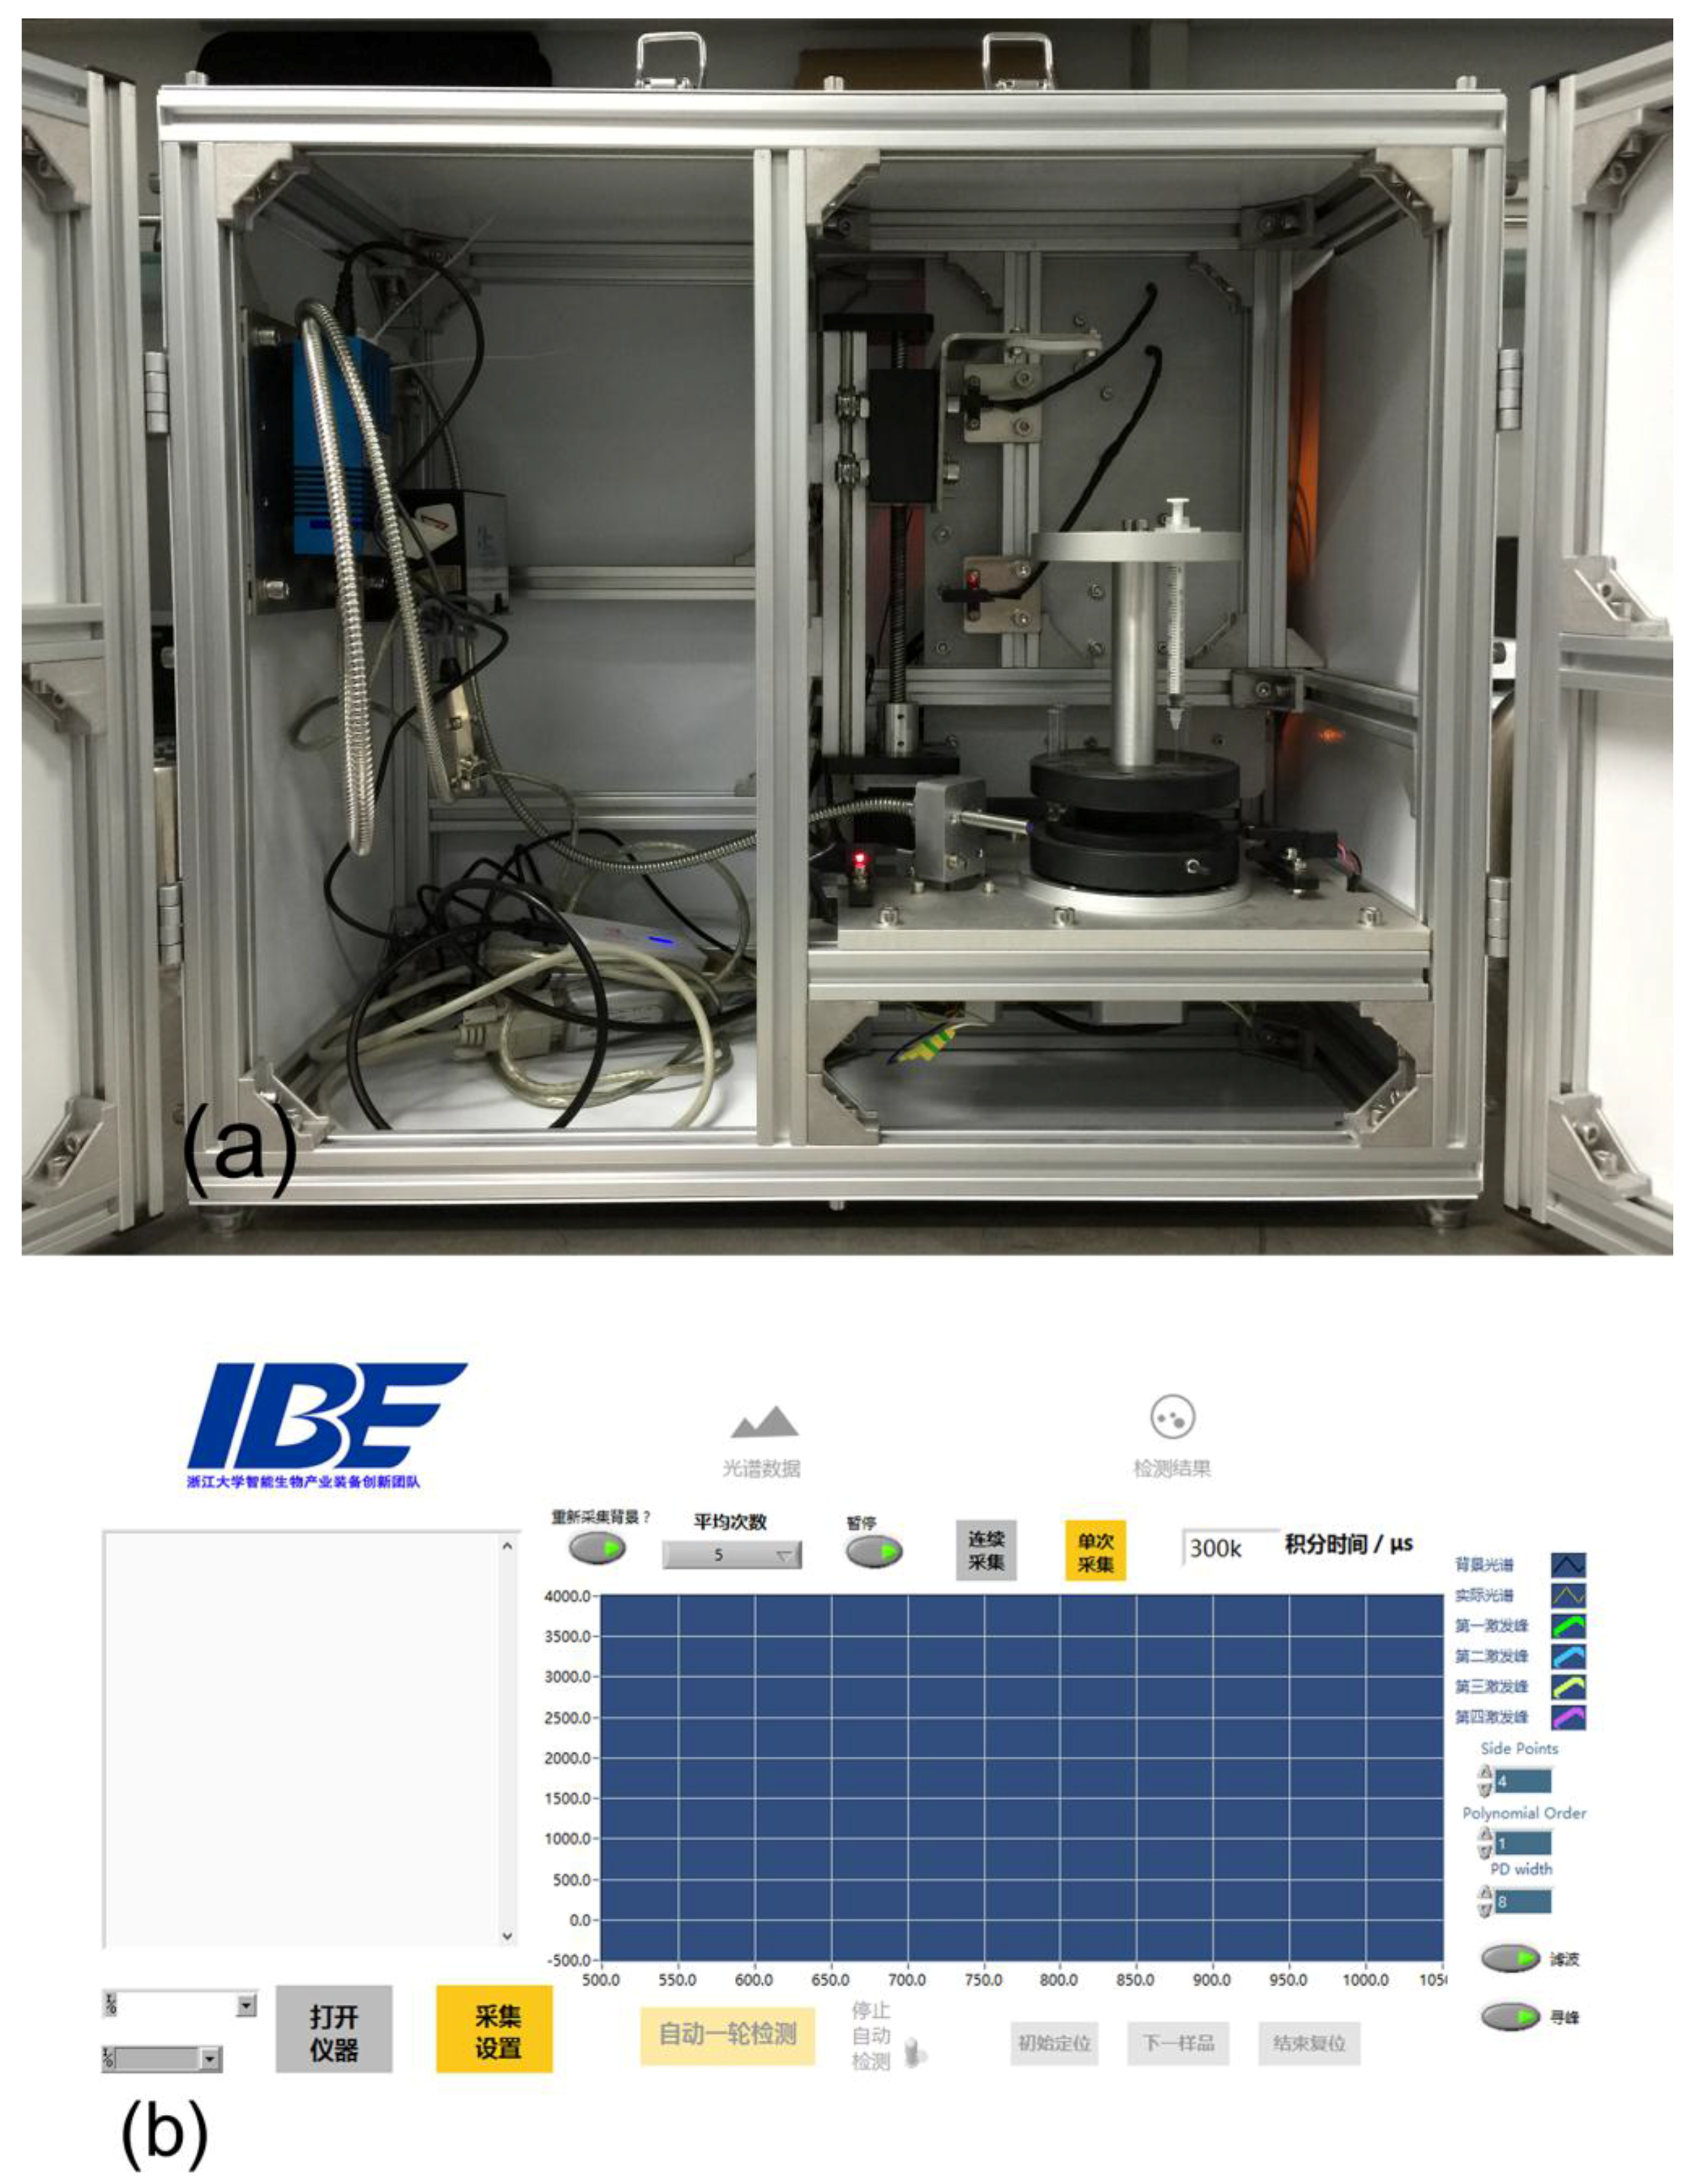
3.1. Hardware
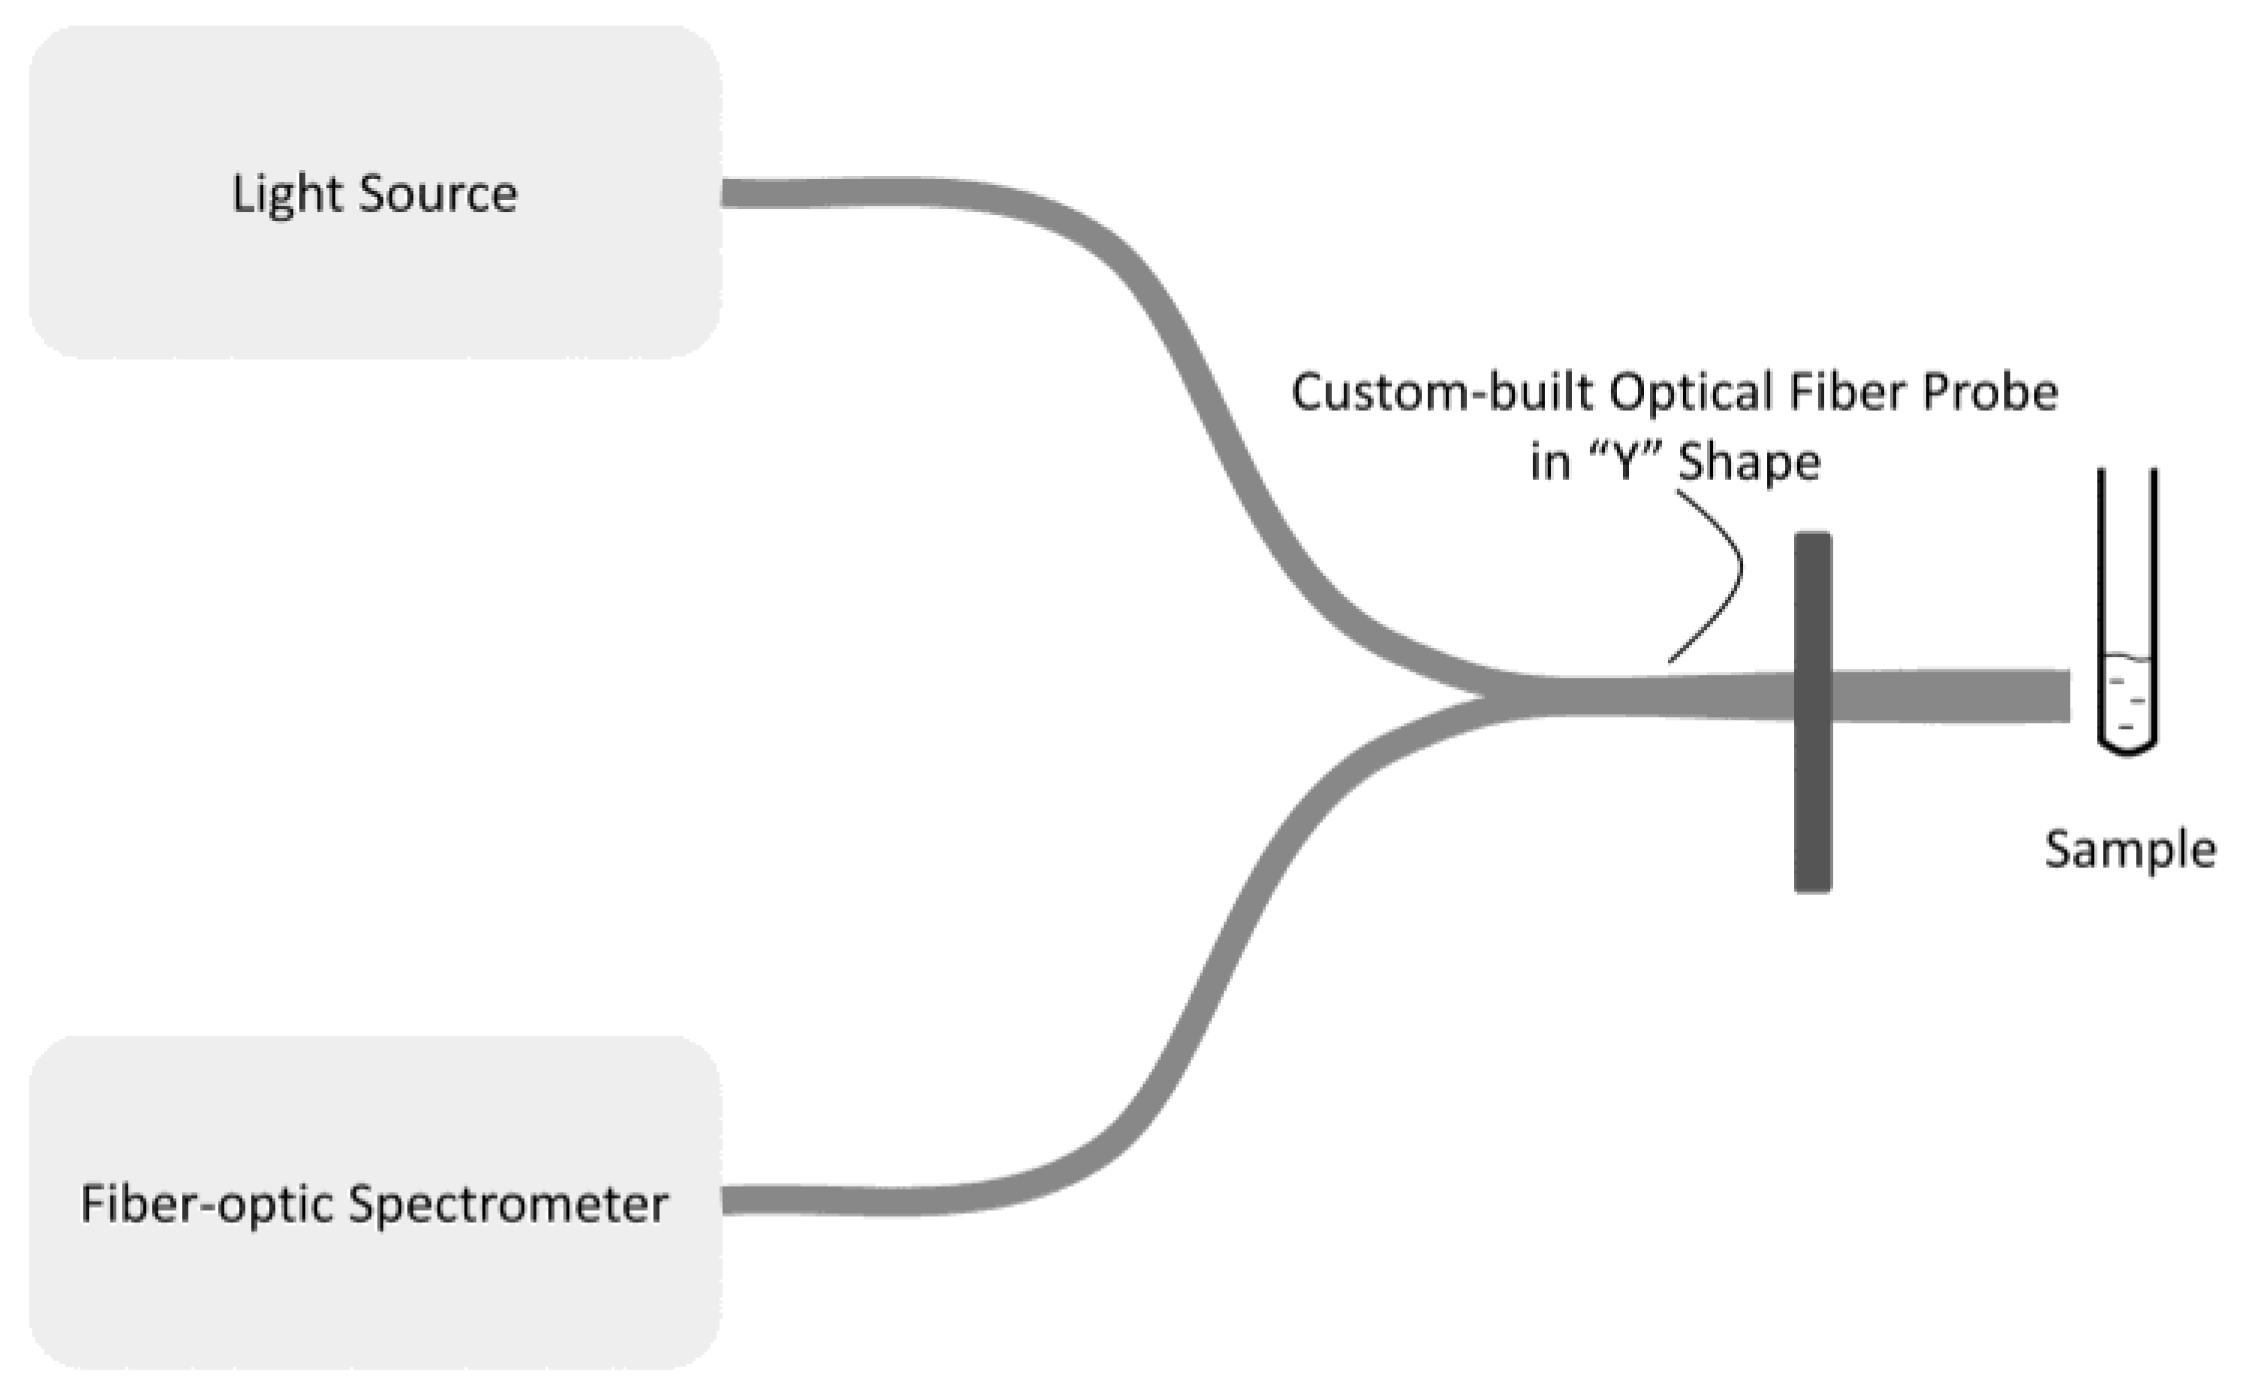
3.1.1. Optical Measurement Unit
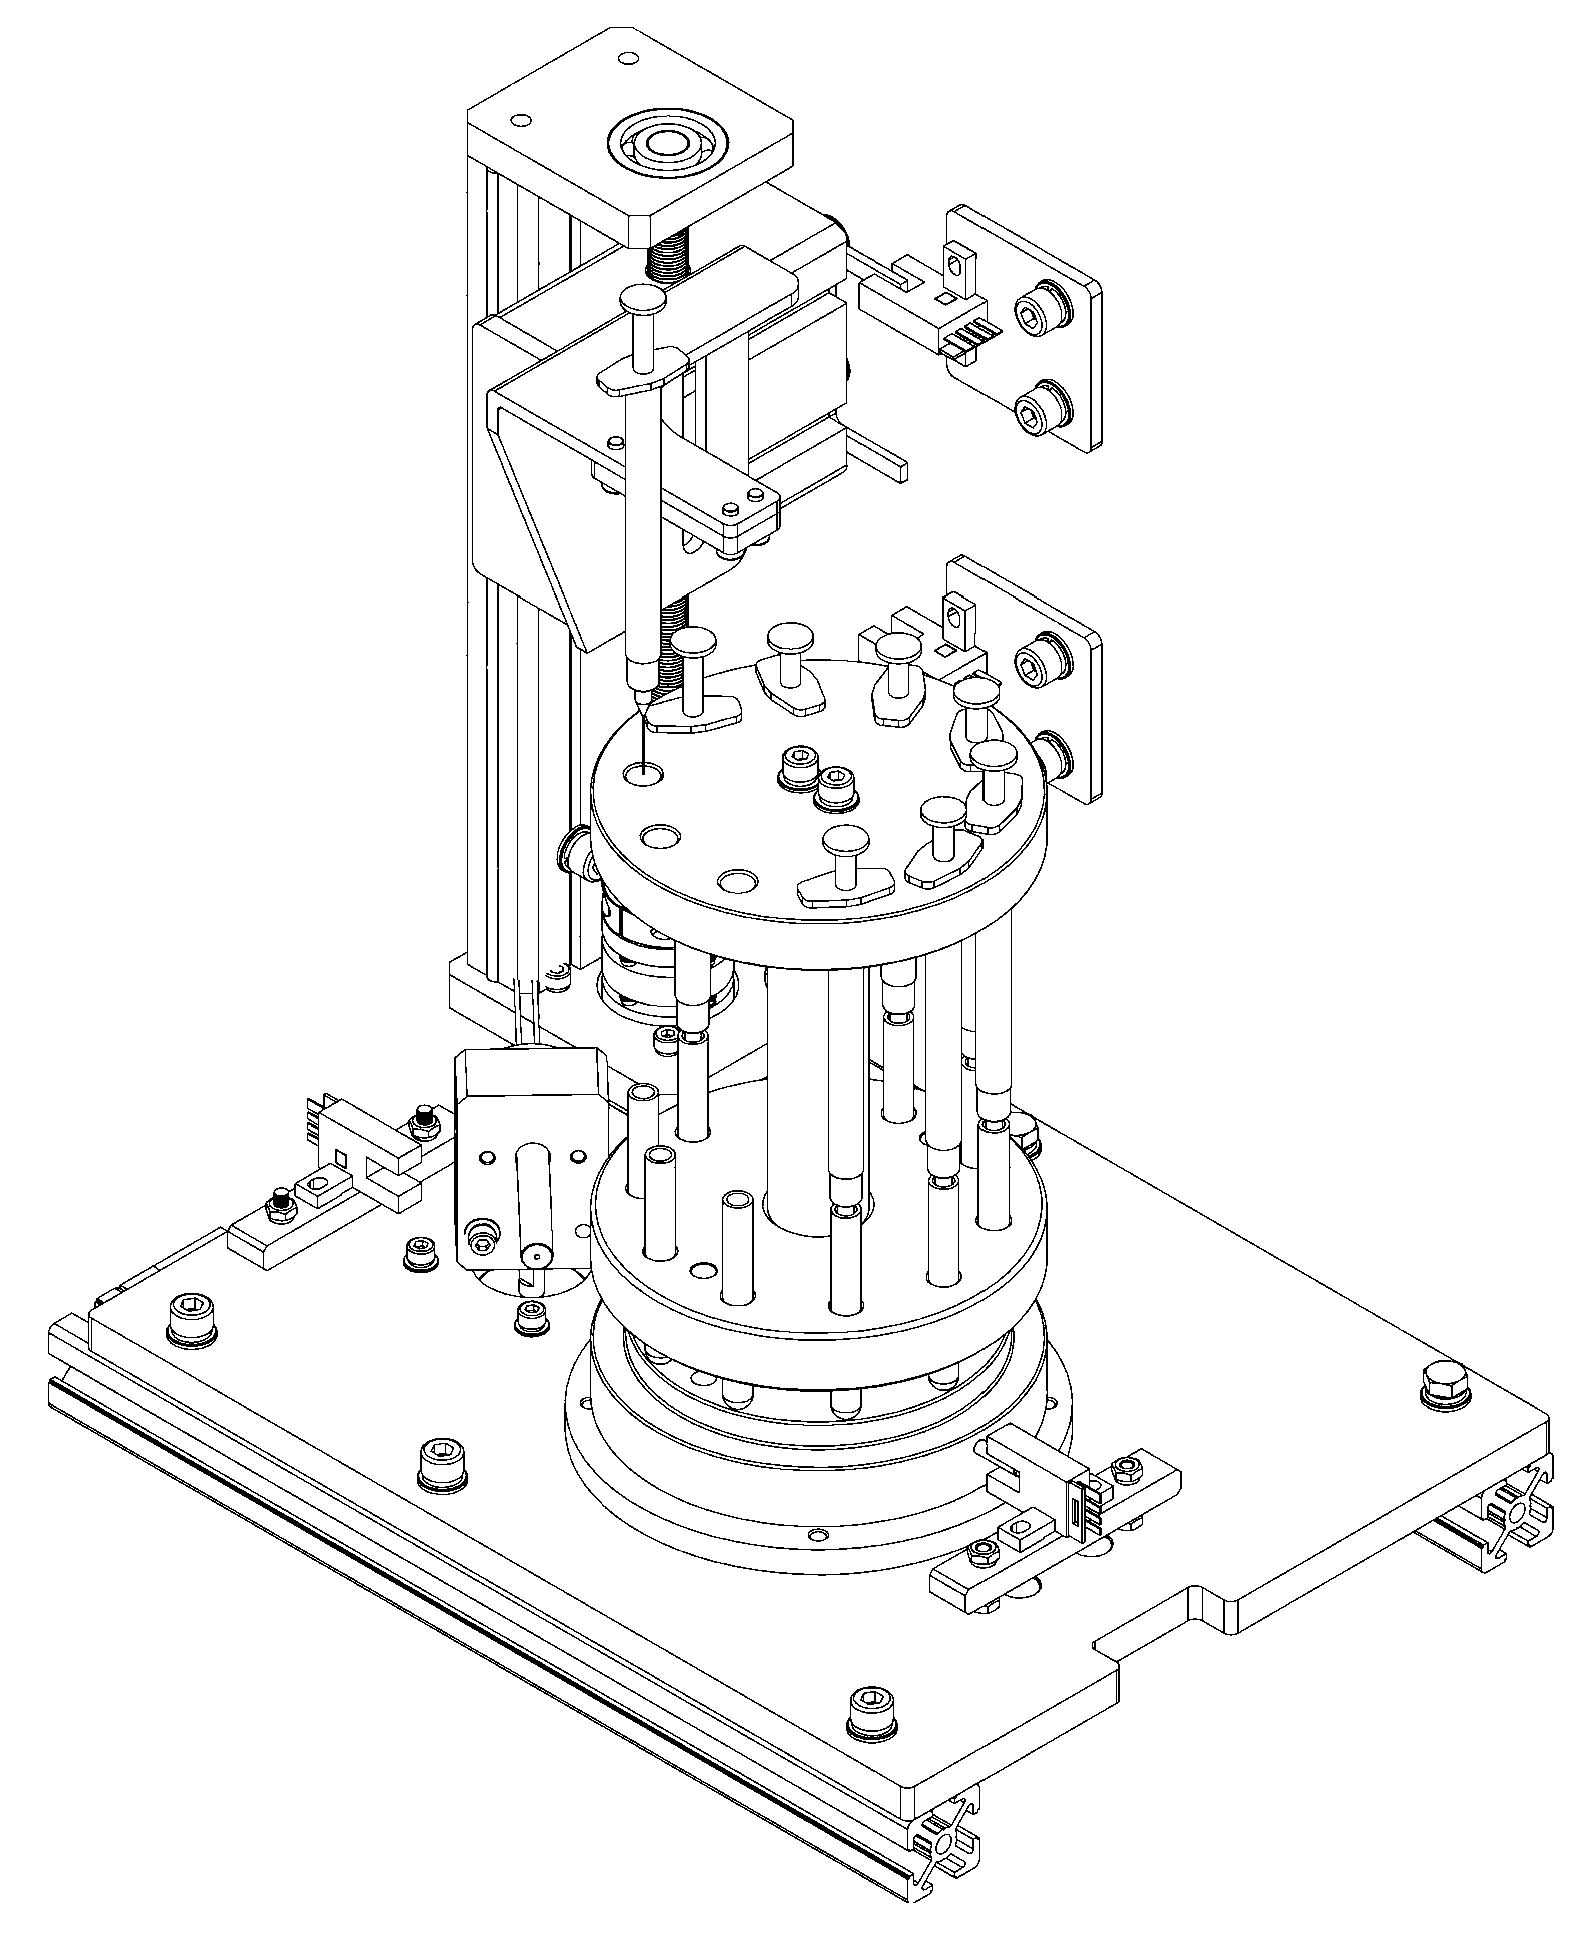
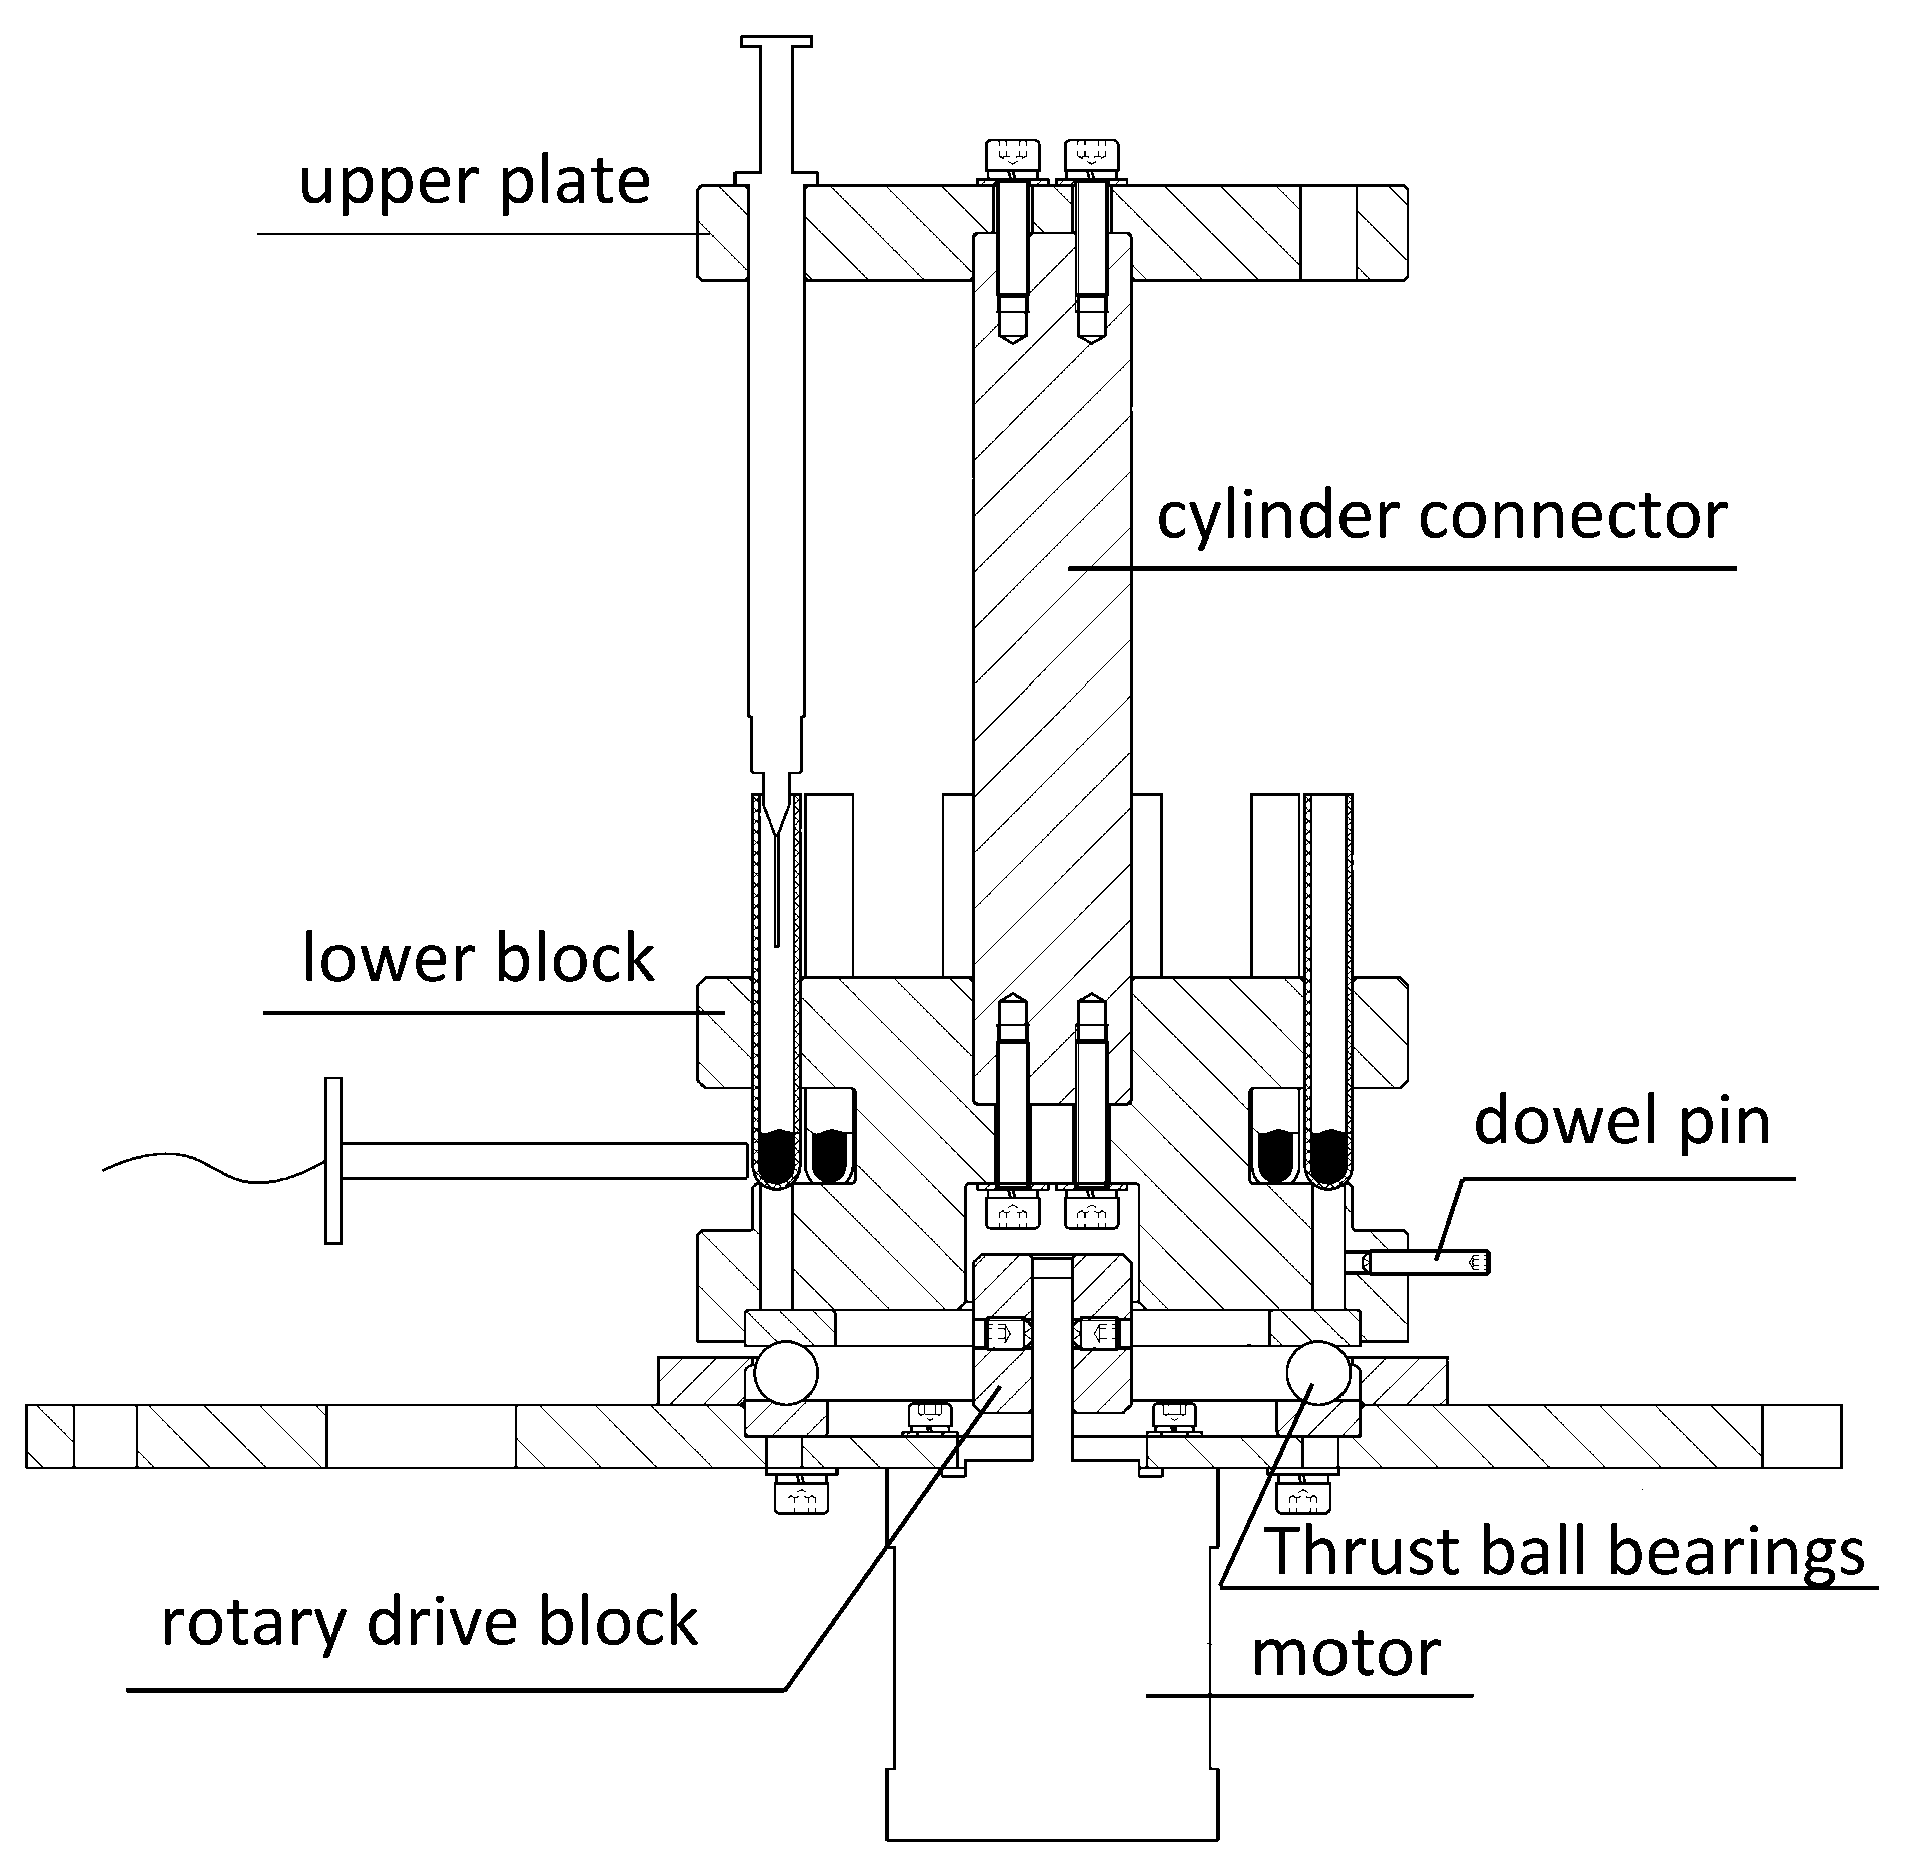
3.1.2. Mechanical Unit
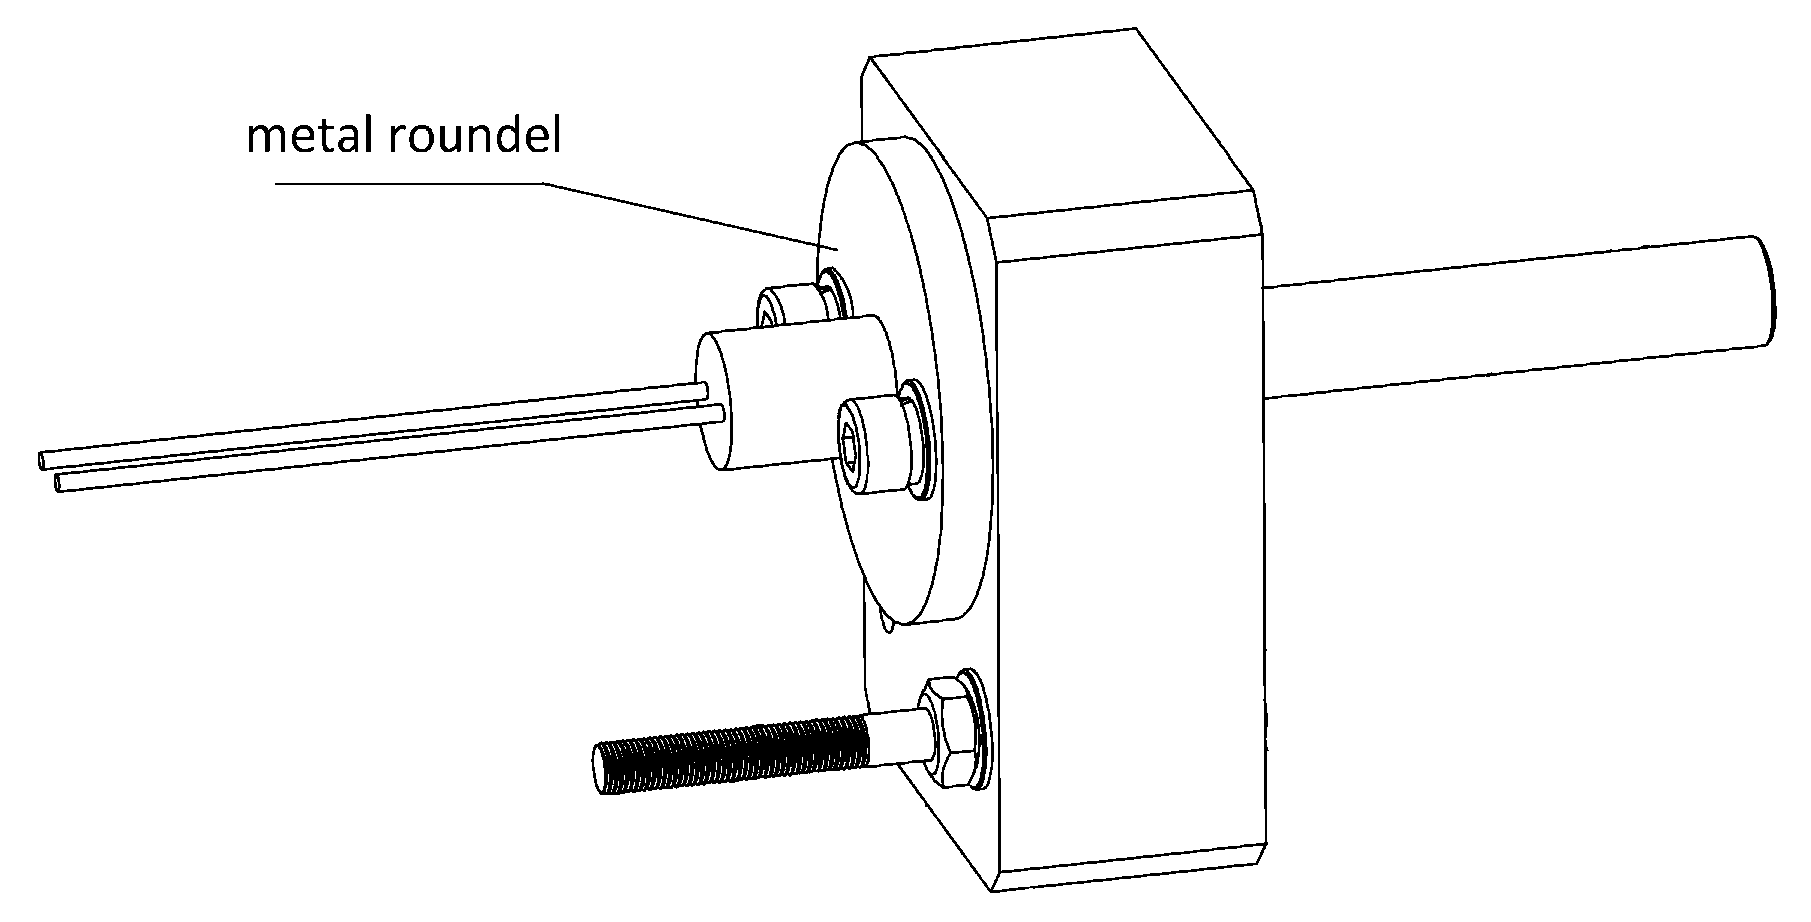
Rotatable Detection Stage Module
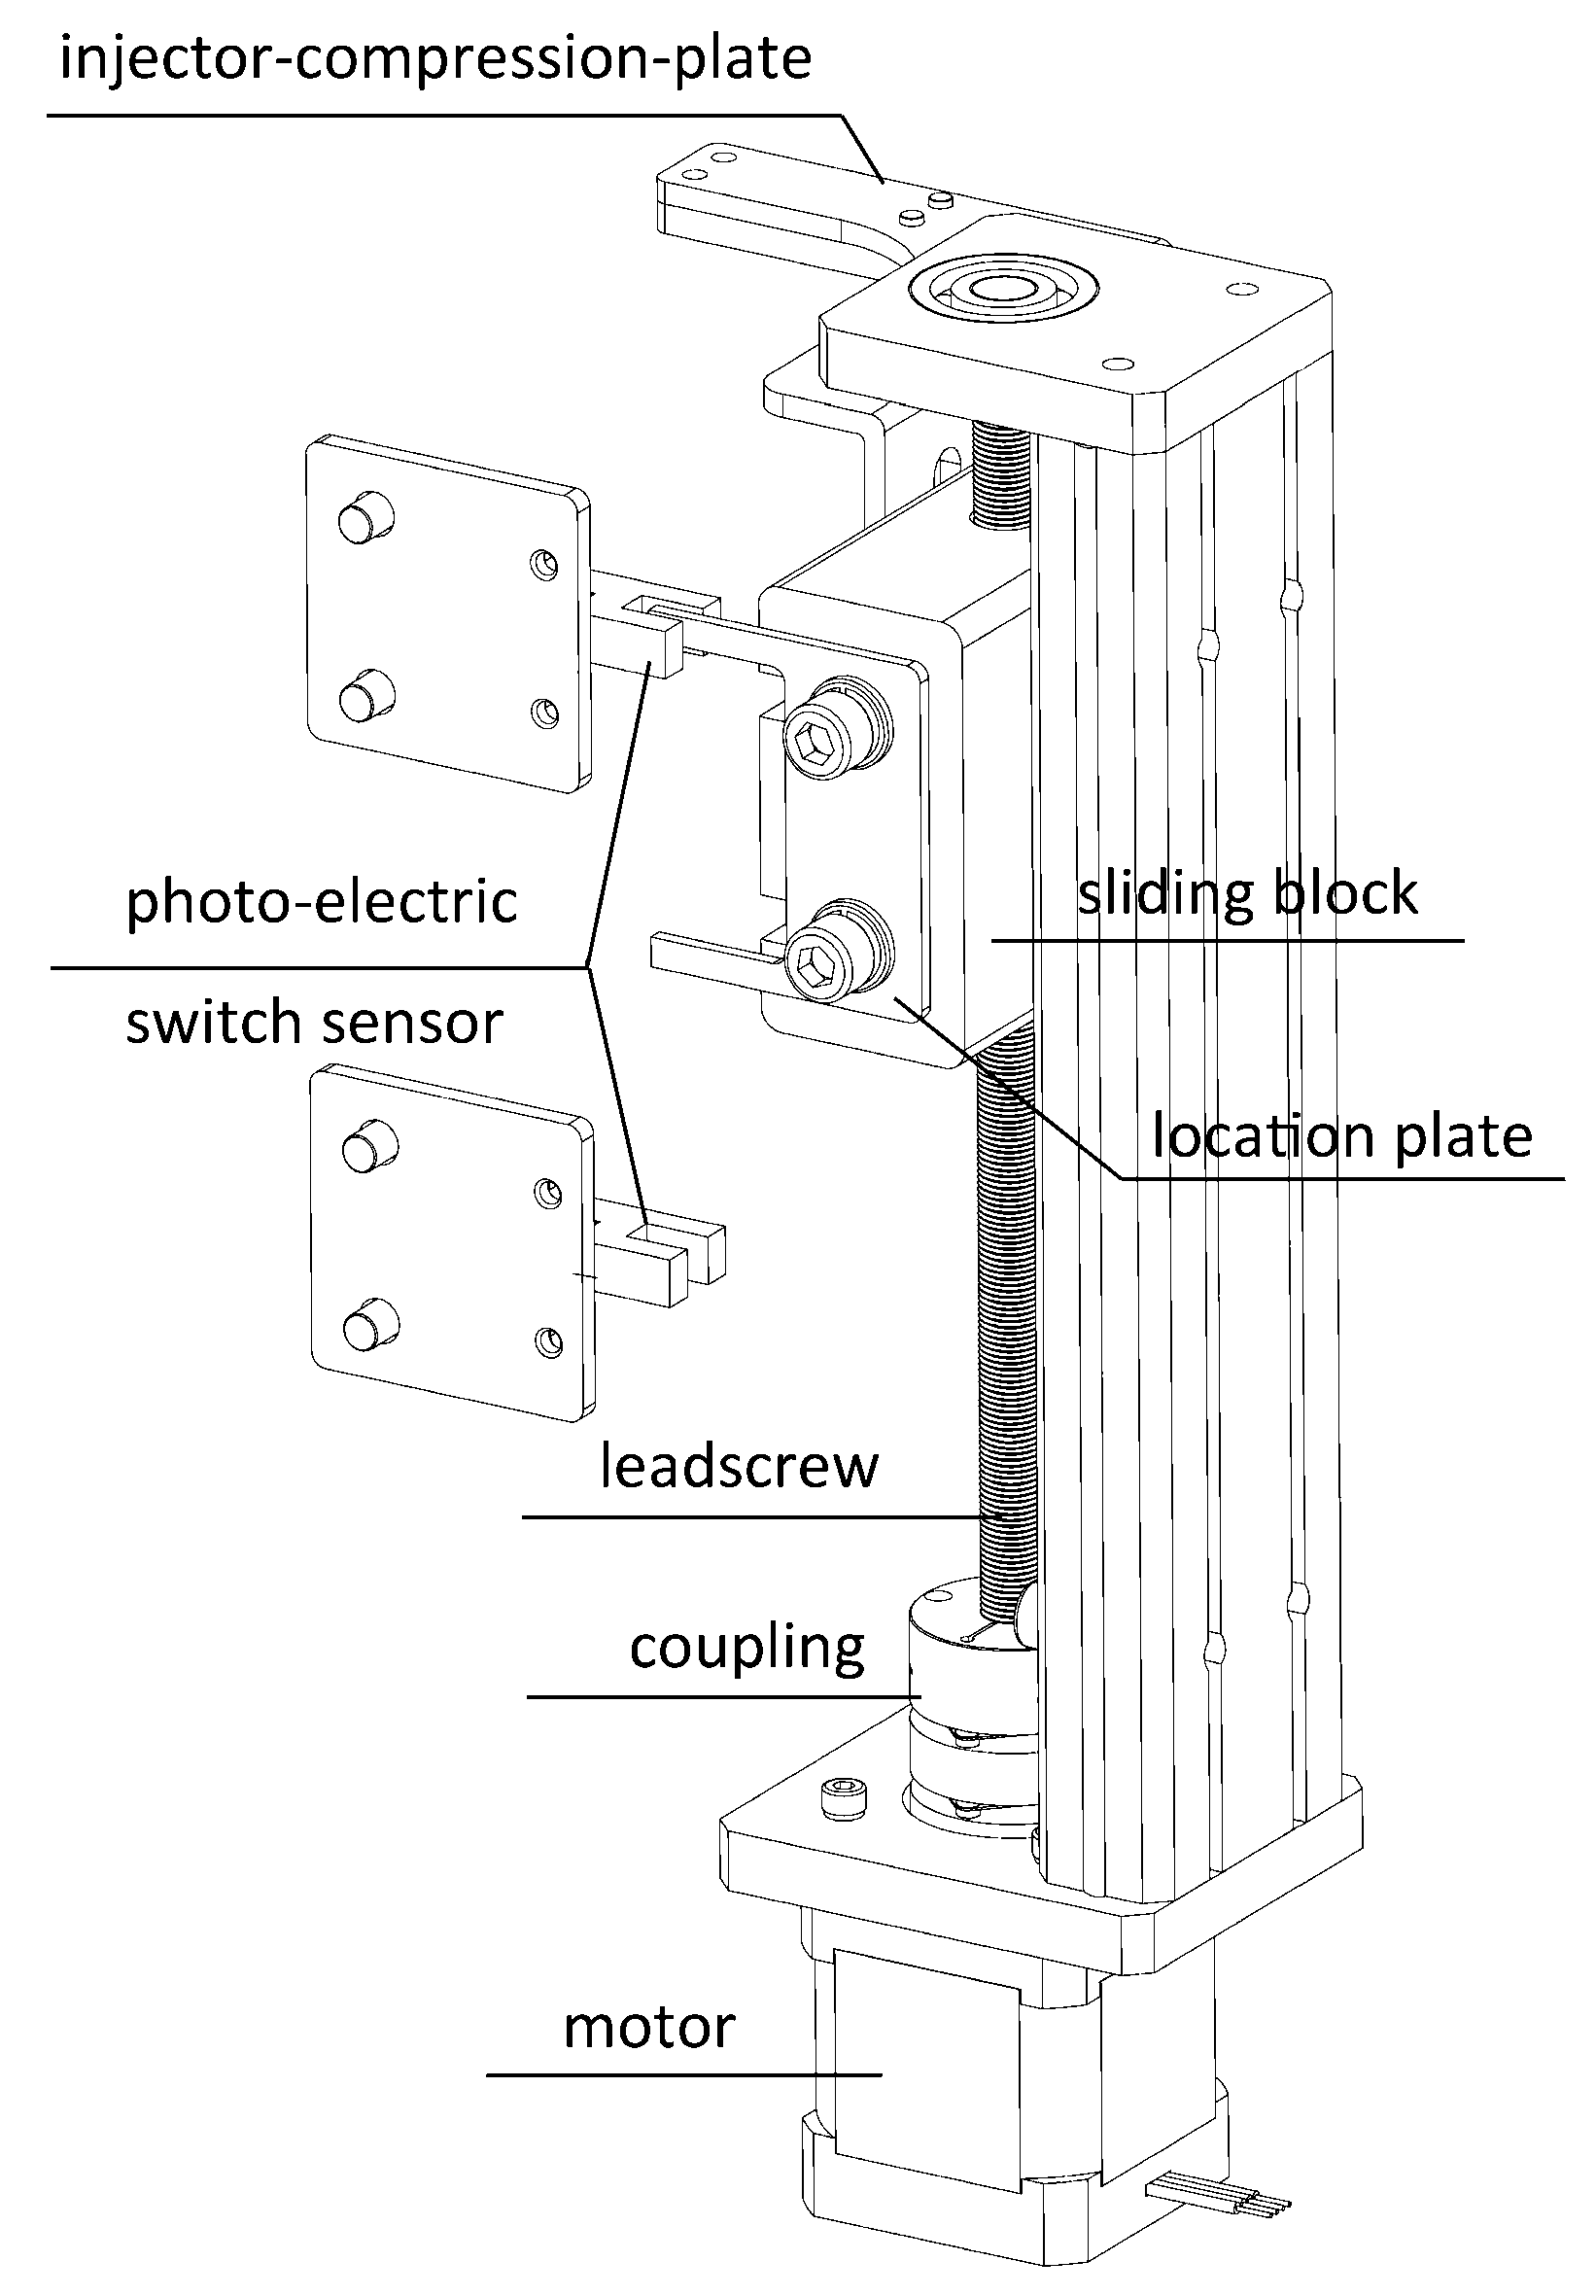
Automatic Sample Injection Module
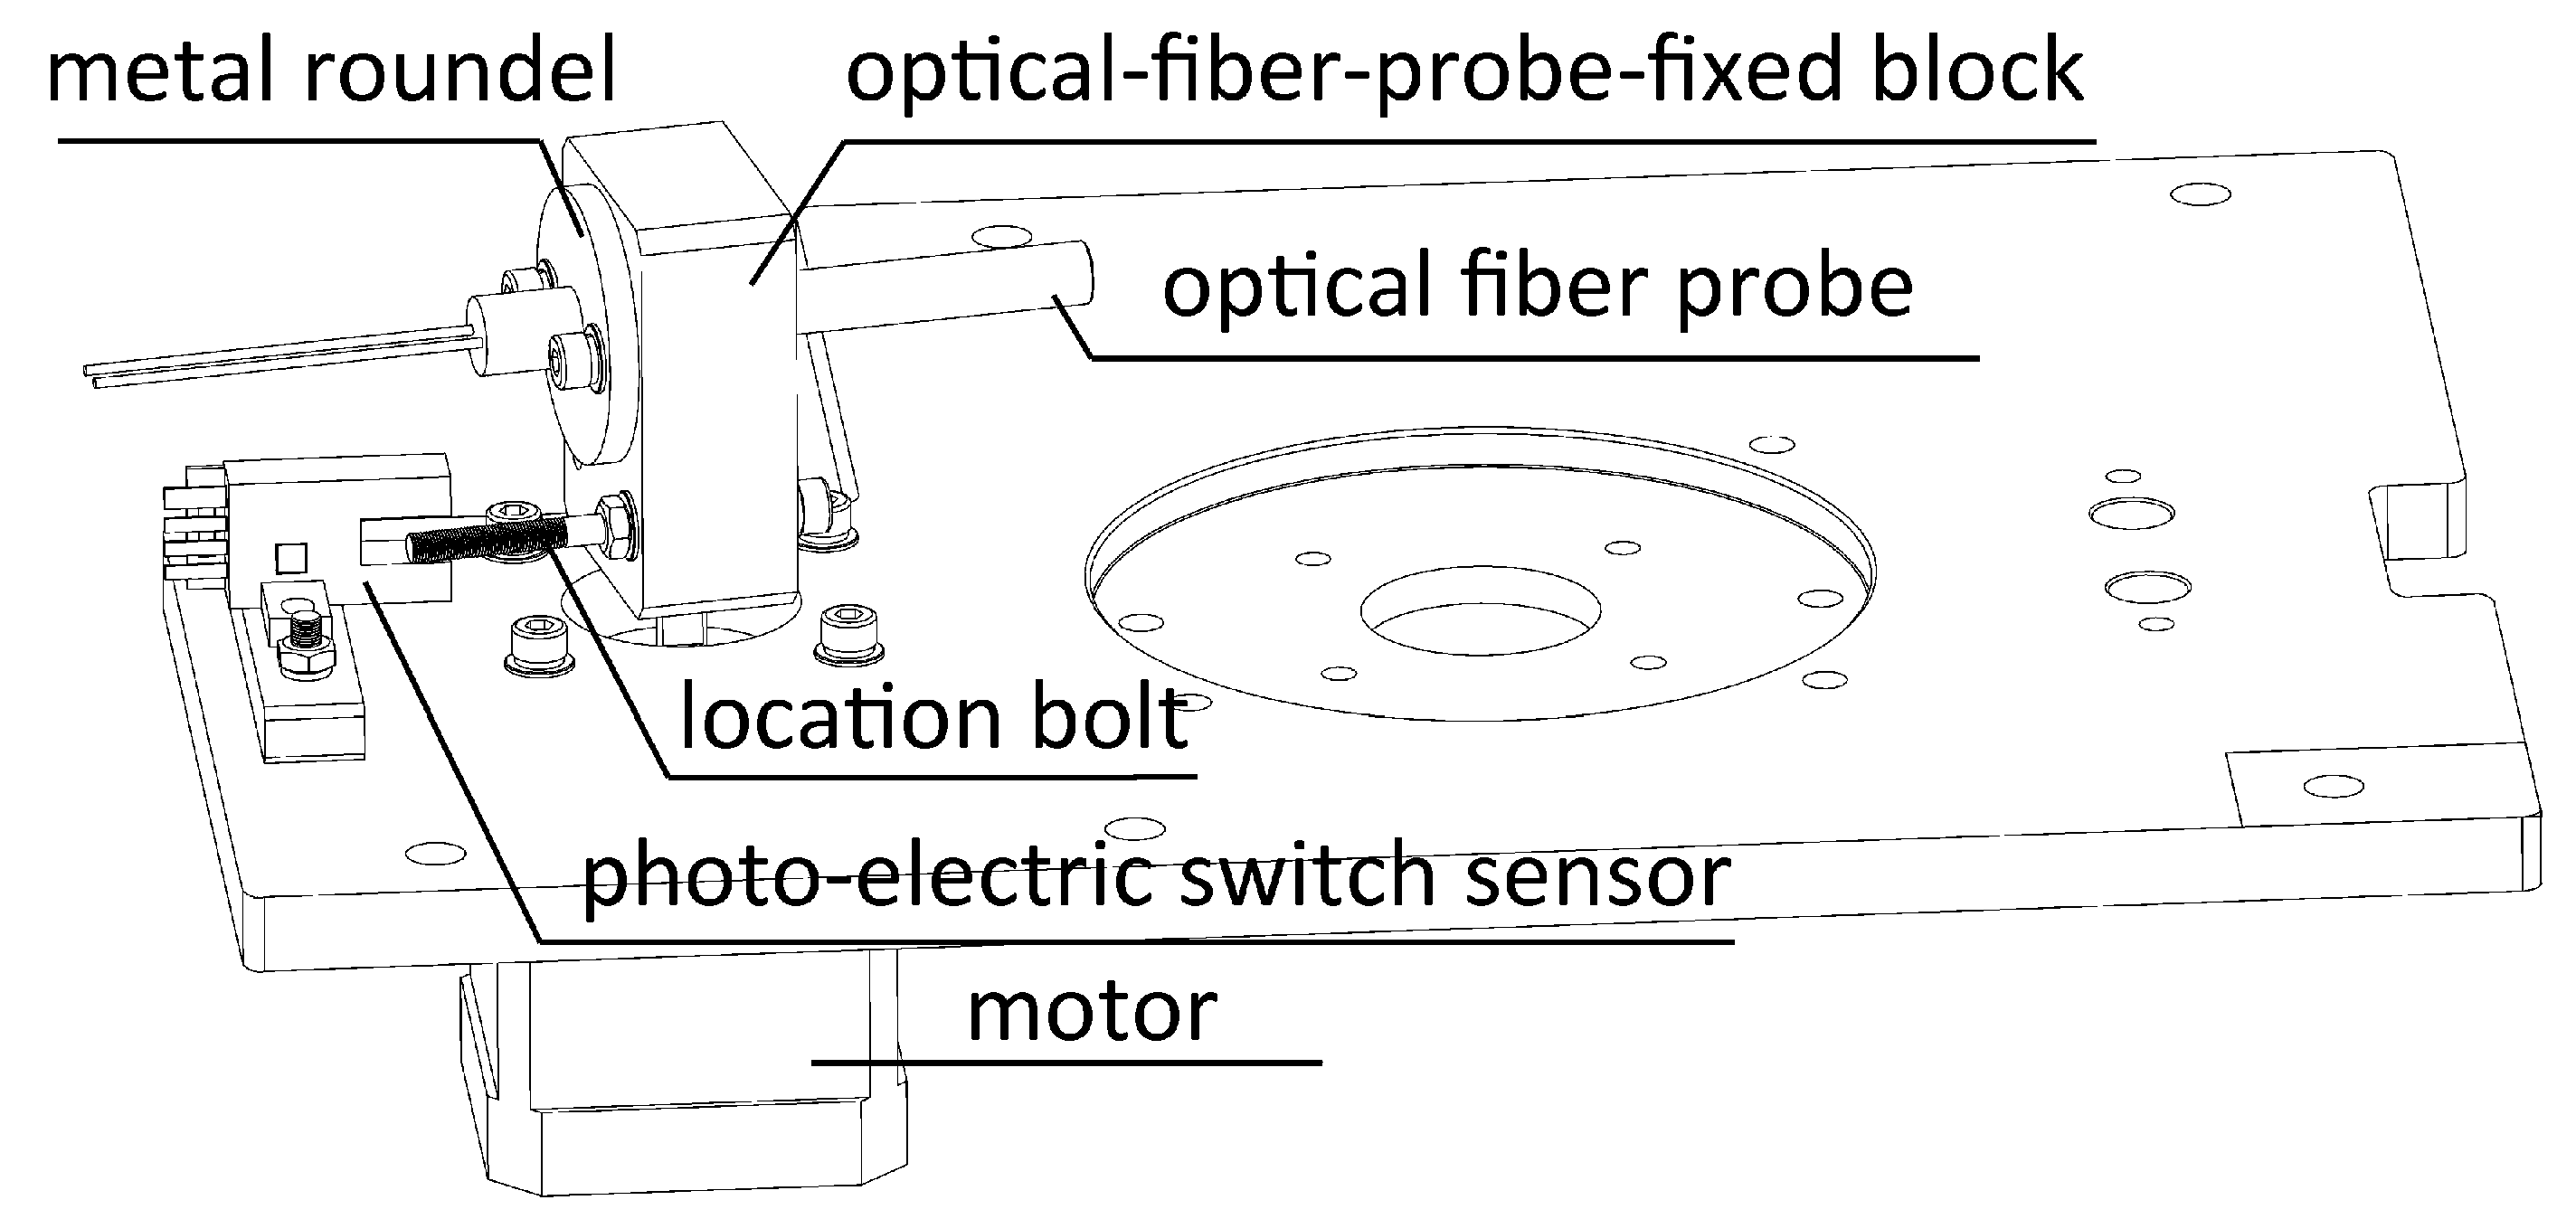
Optical Fiber Probe Controller Module
3.2. LabVIEW-Based Software
3.2.1. Programming Language Selection
3.2.2. Design Criteria
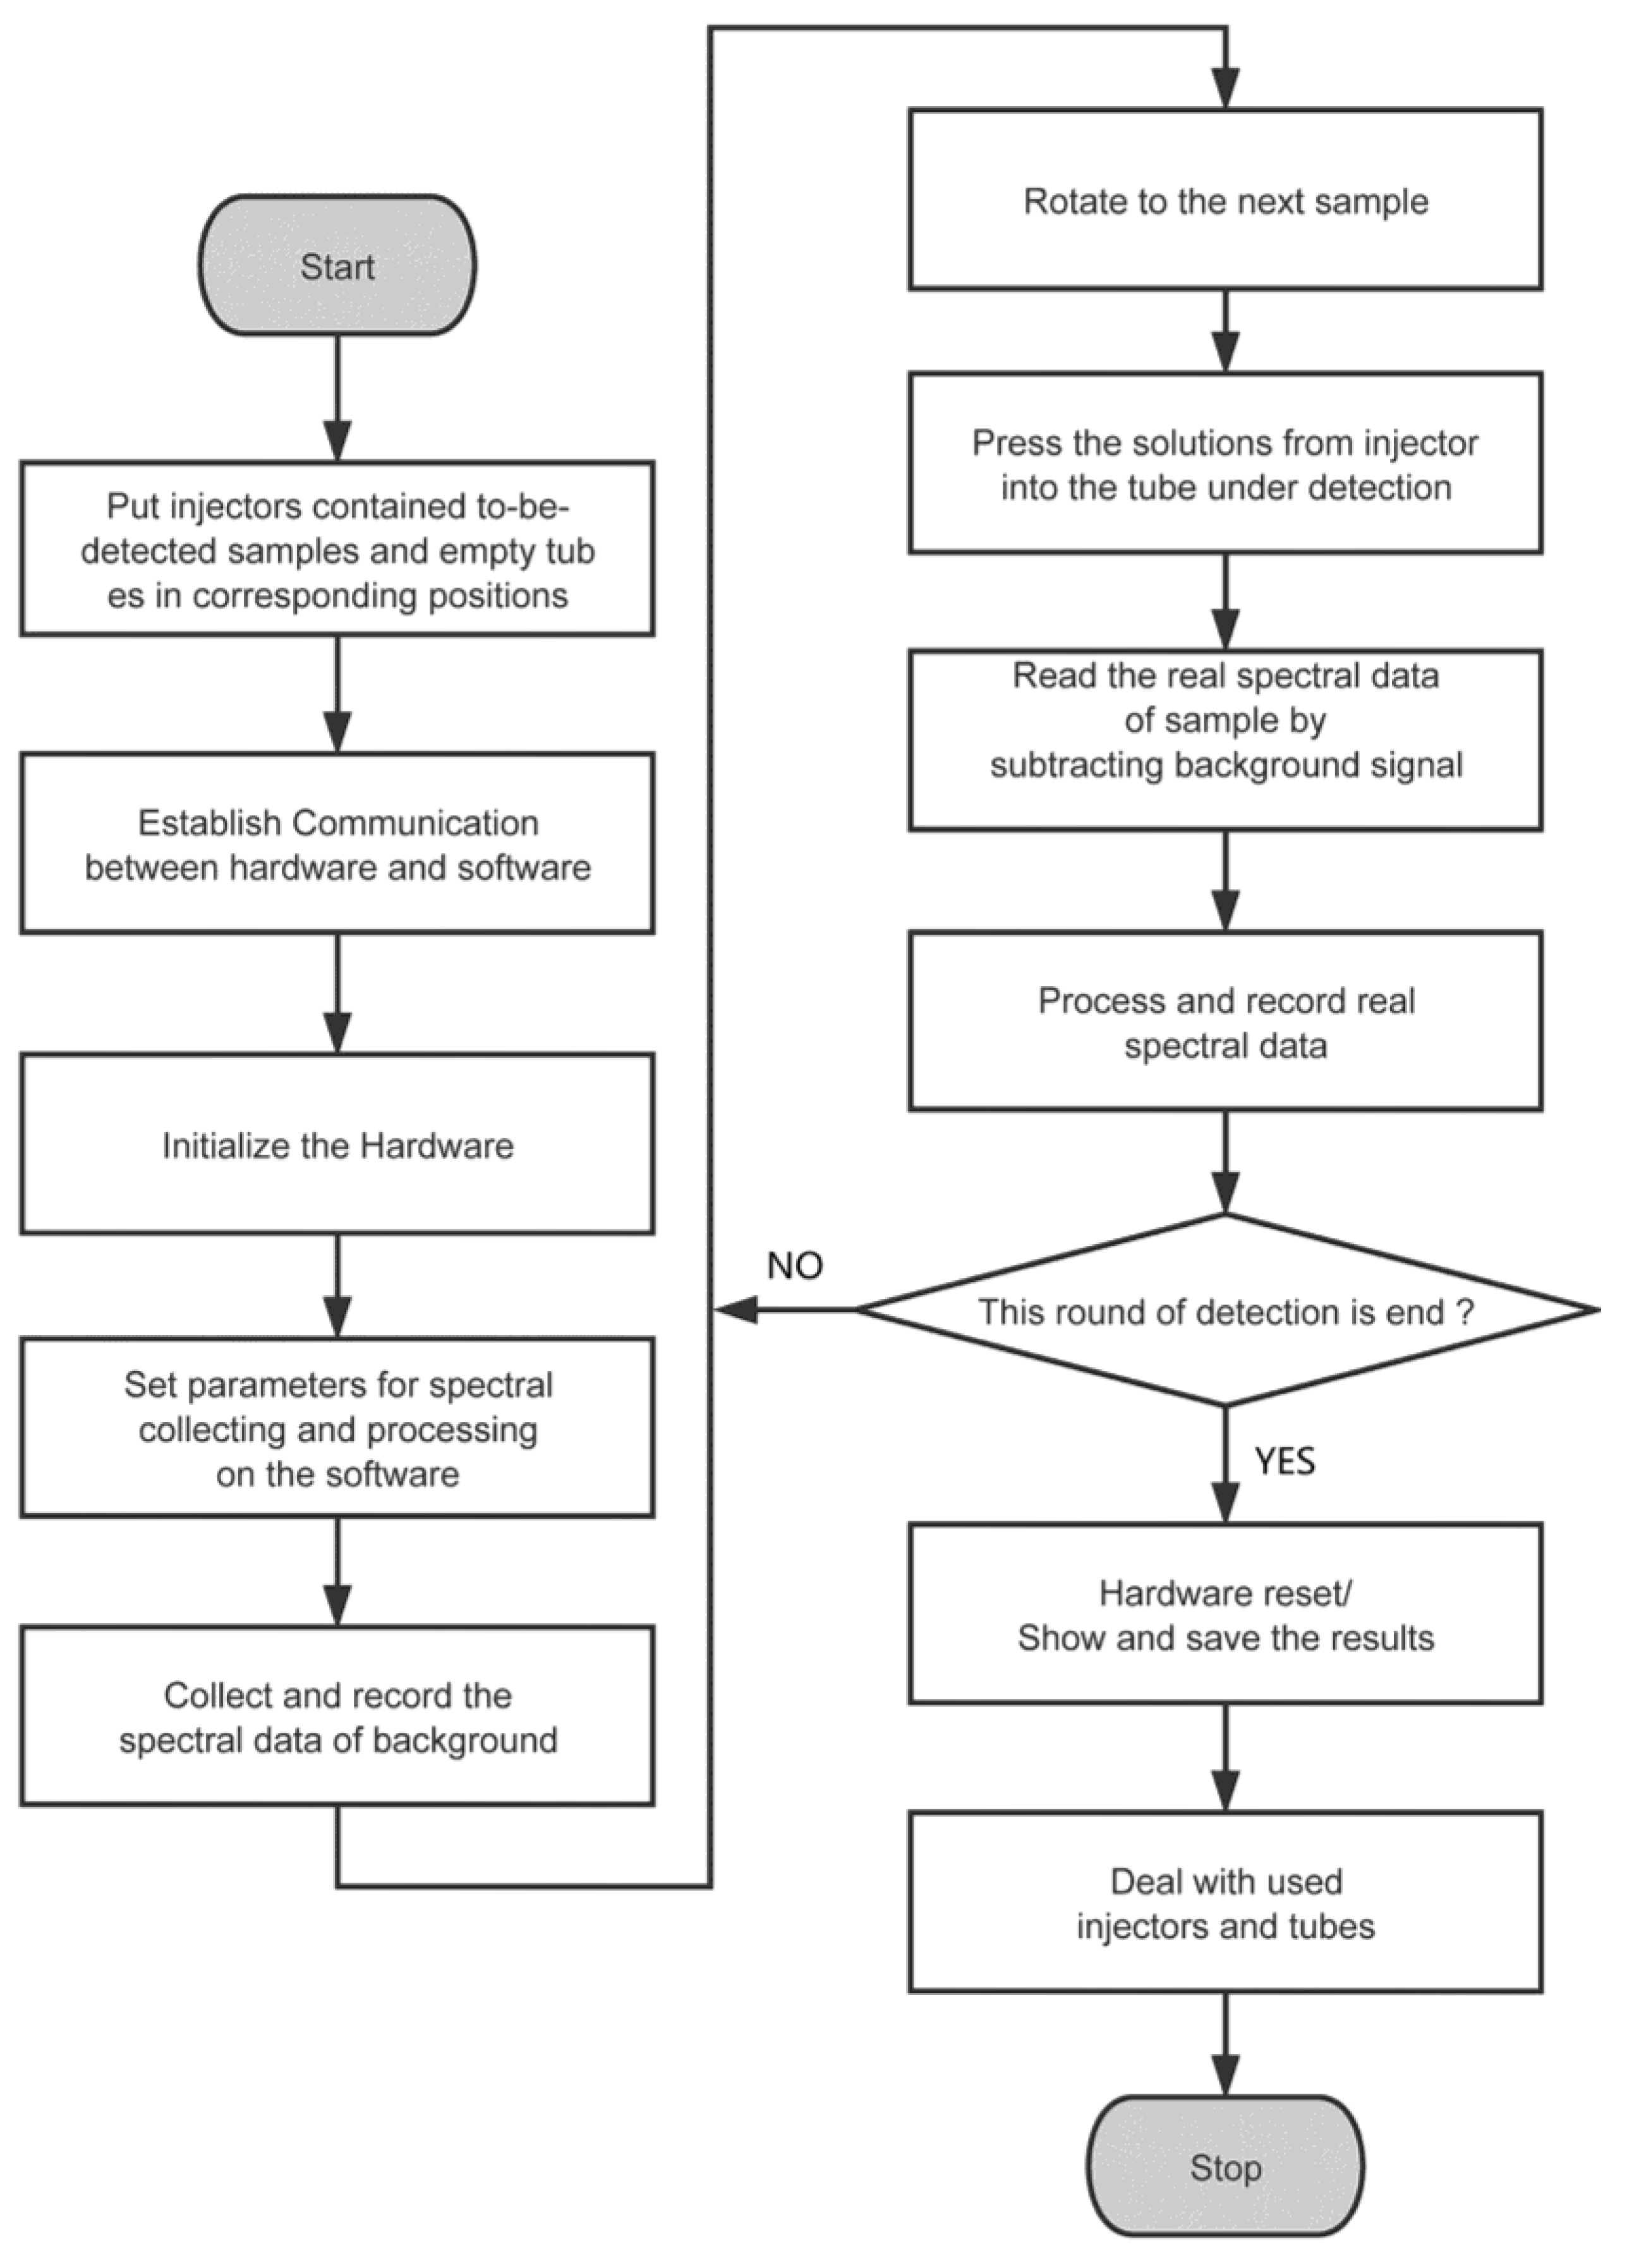
3.2.3. Work Mode Selection
4. Results and Discussion
4.1. System Installation
4.2. Spectrum Acquisition Parameters
4.3. System Test
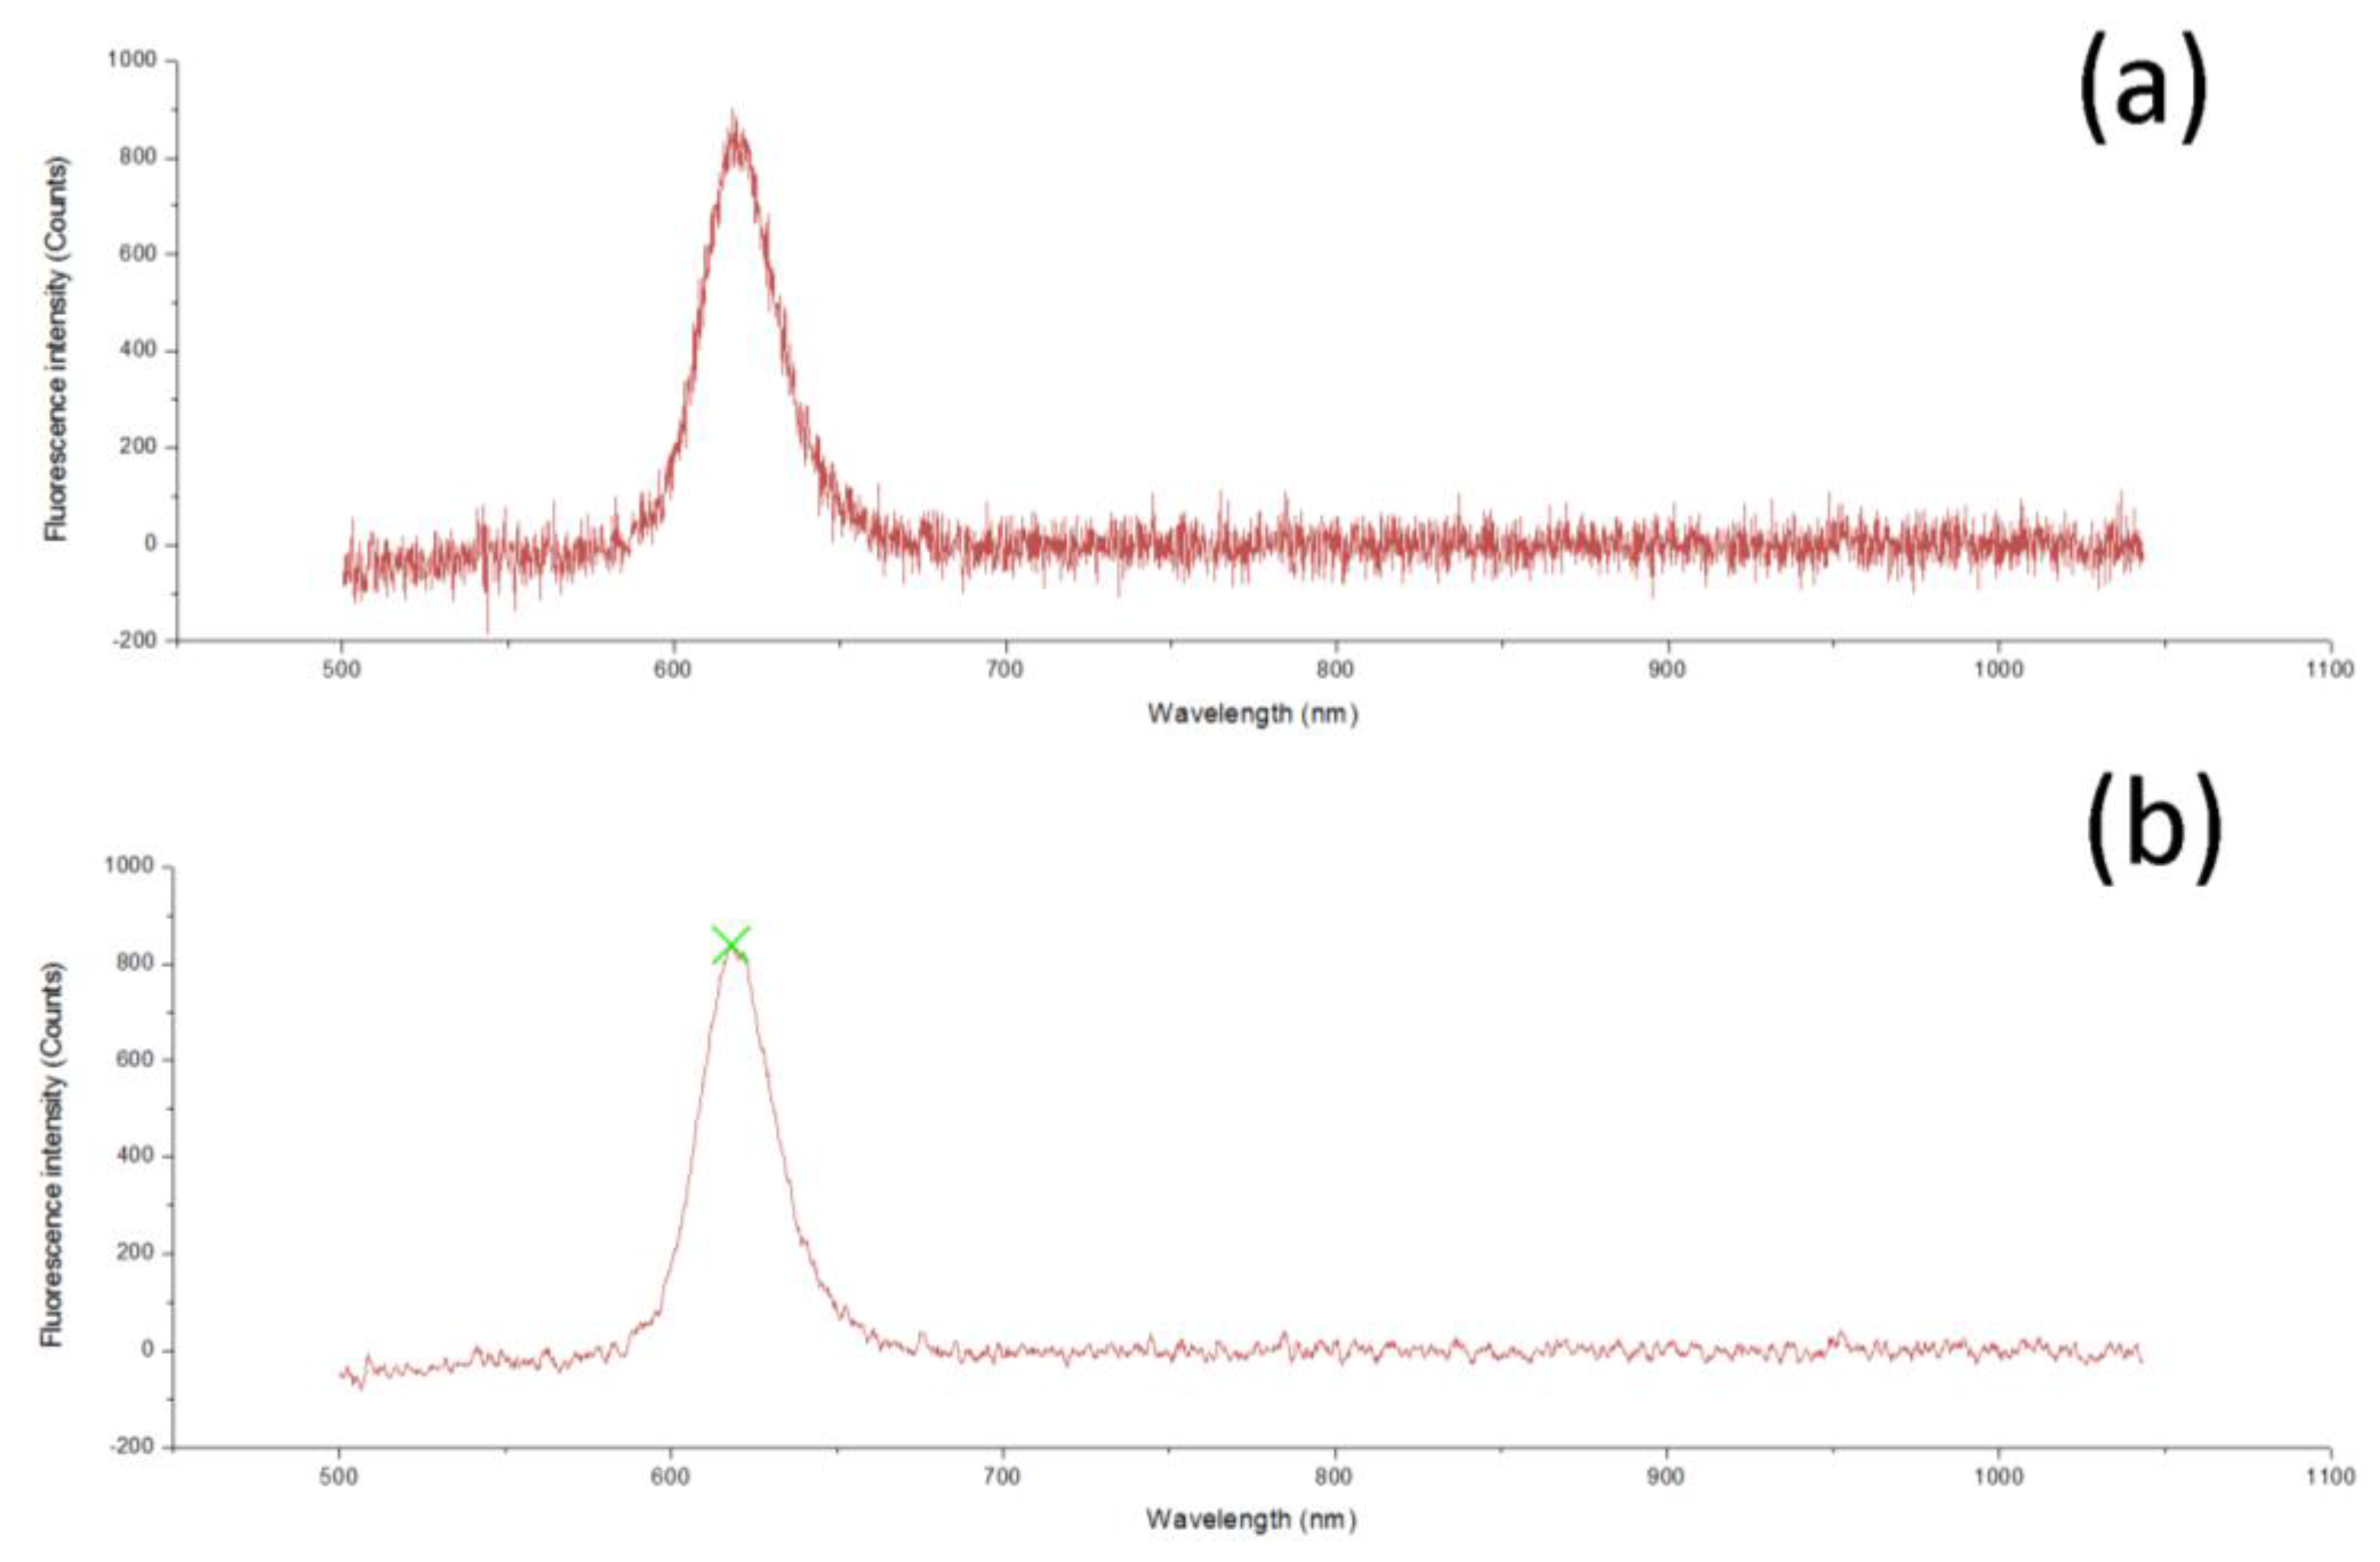
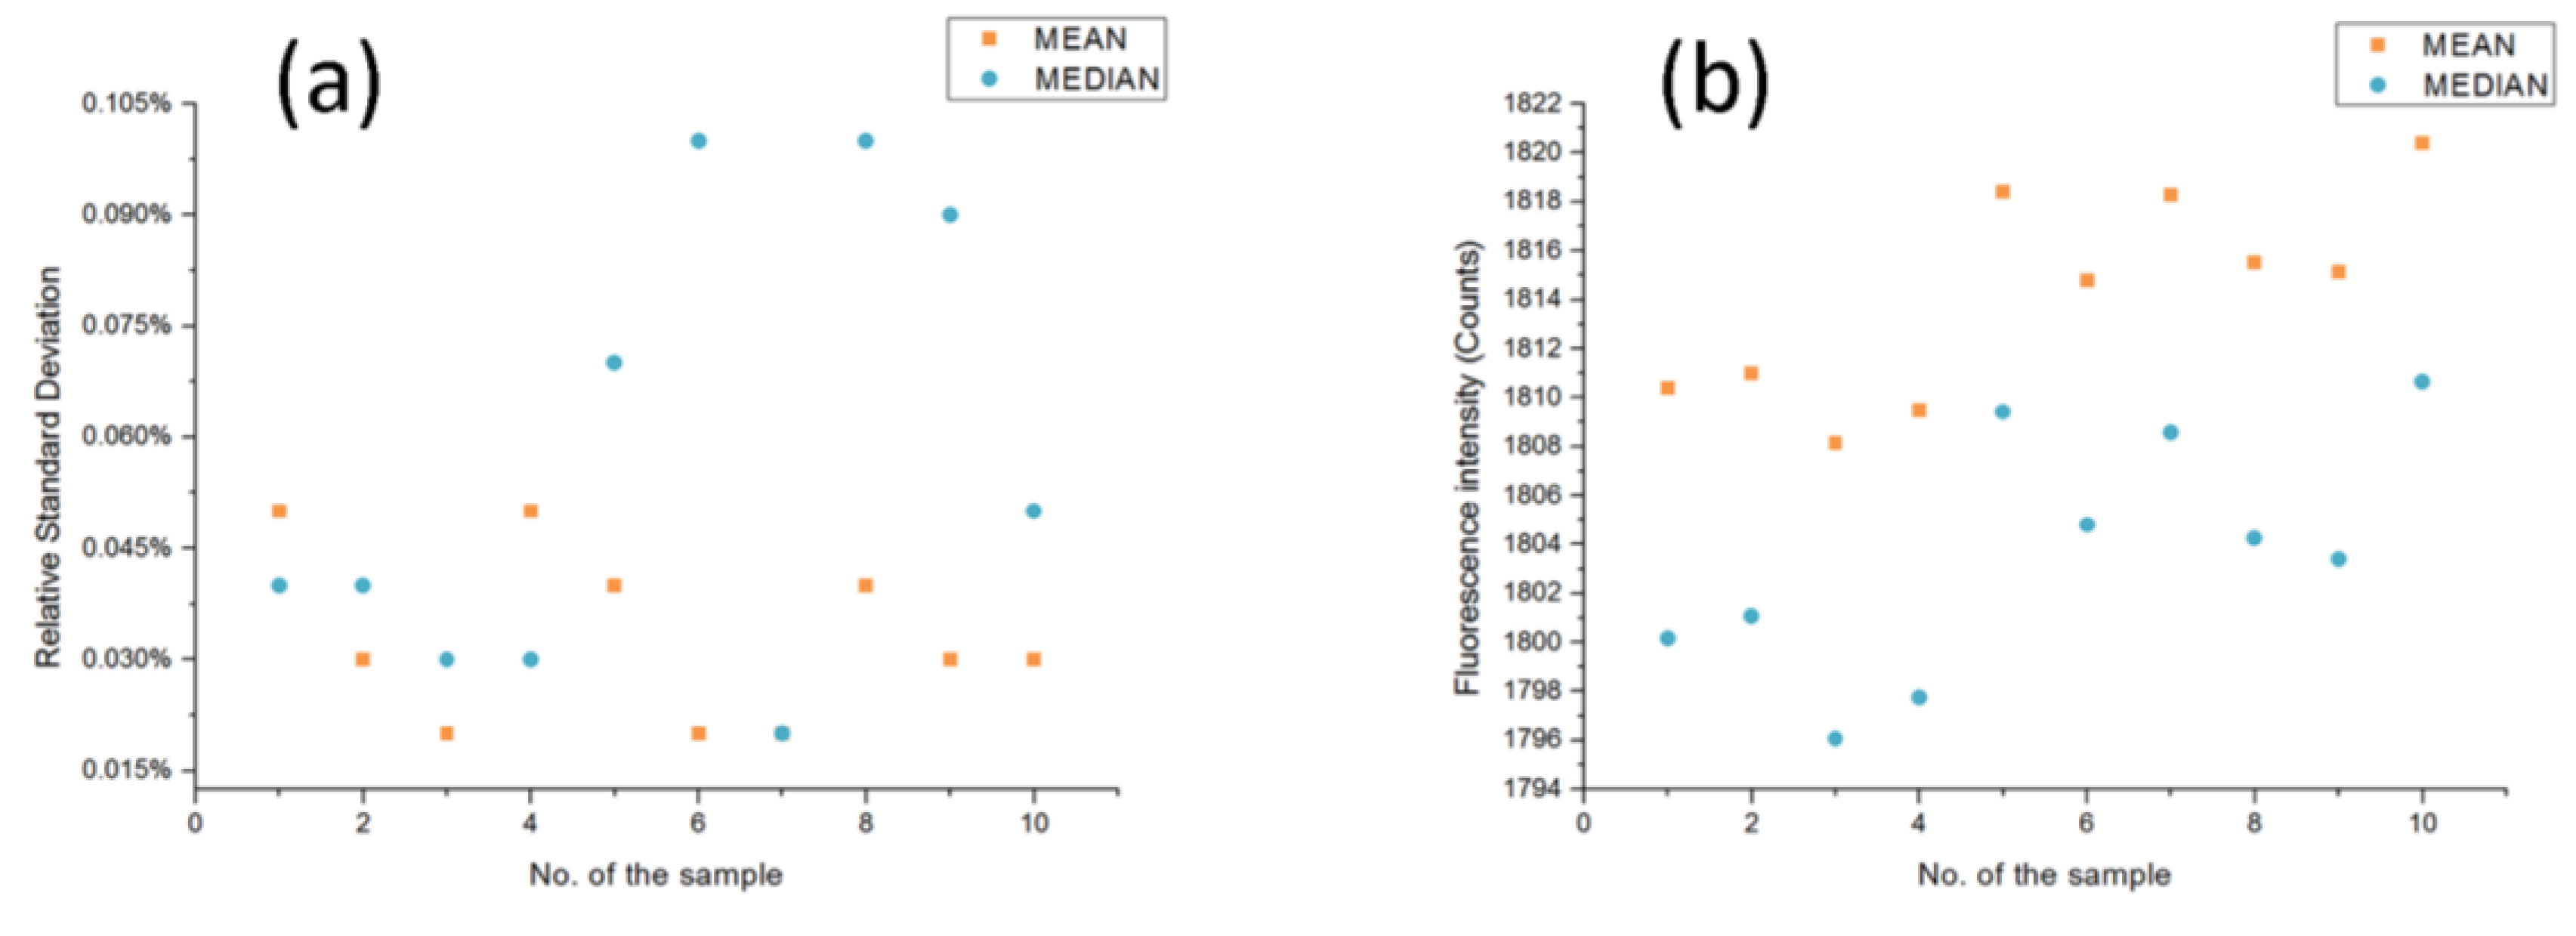
4.3.1. Blank Test
4.3.2. QD Test
Measurement Conditions
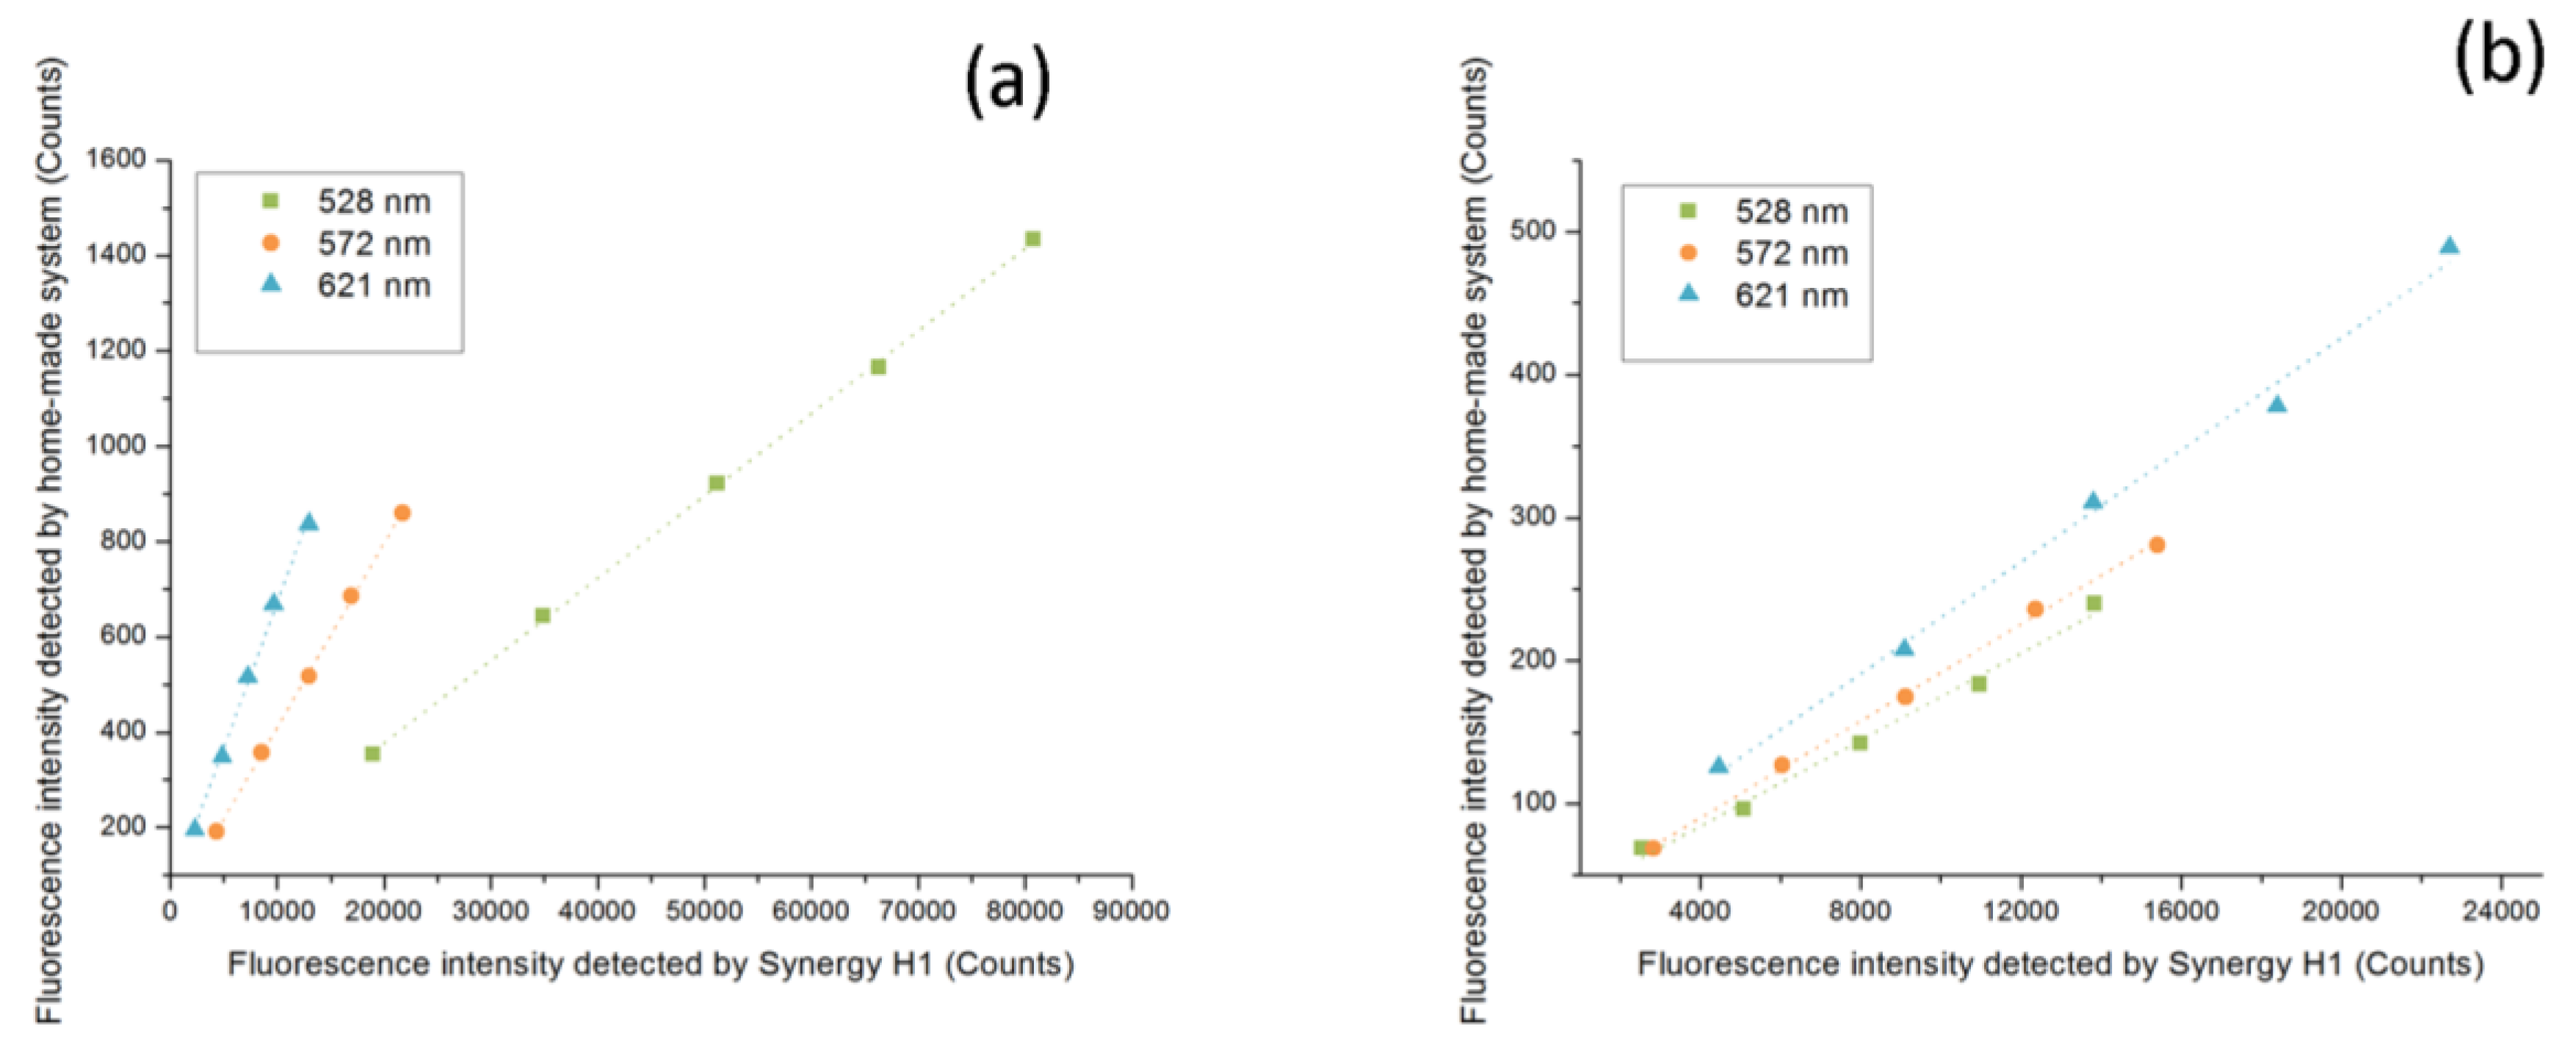
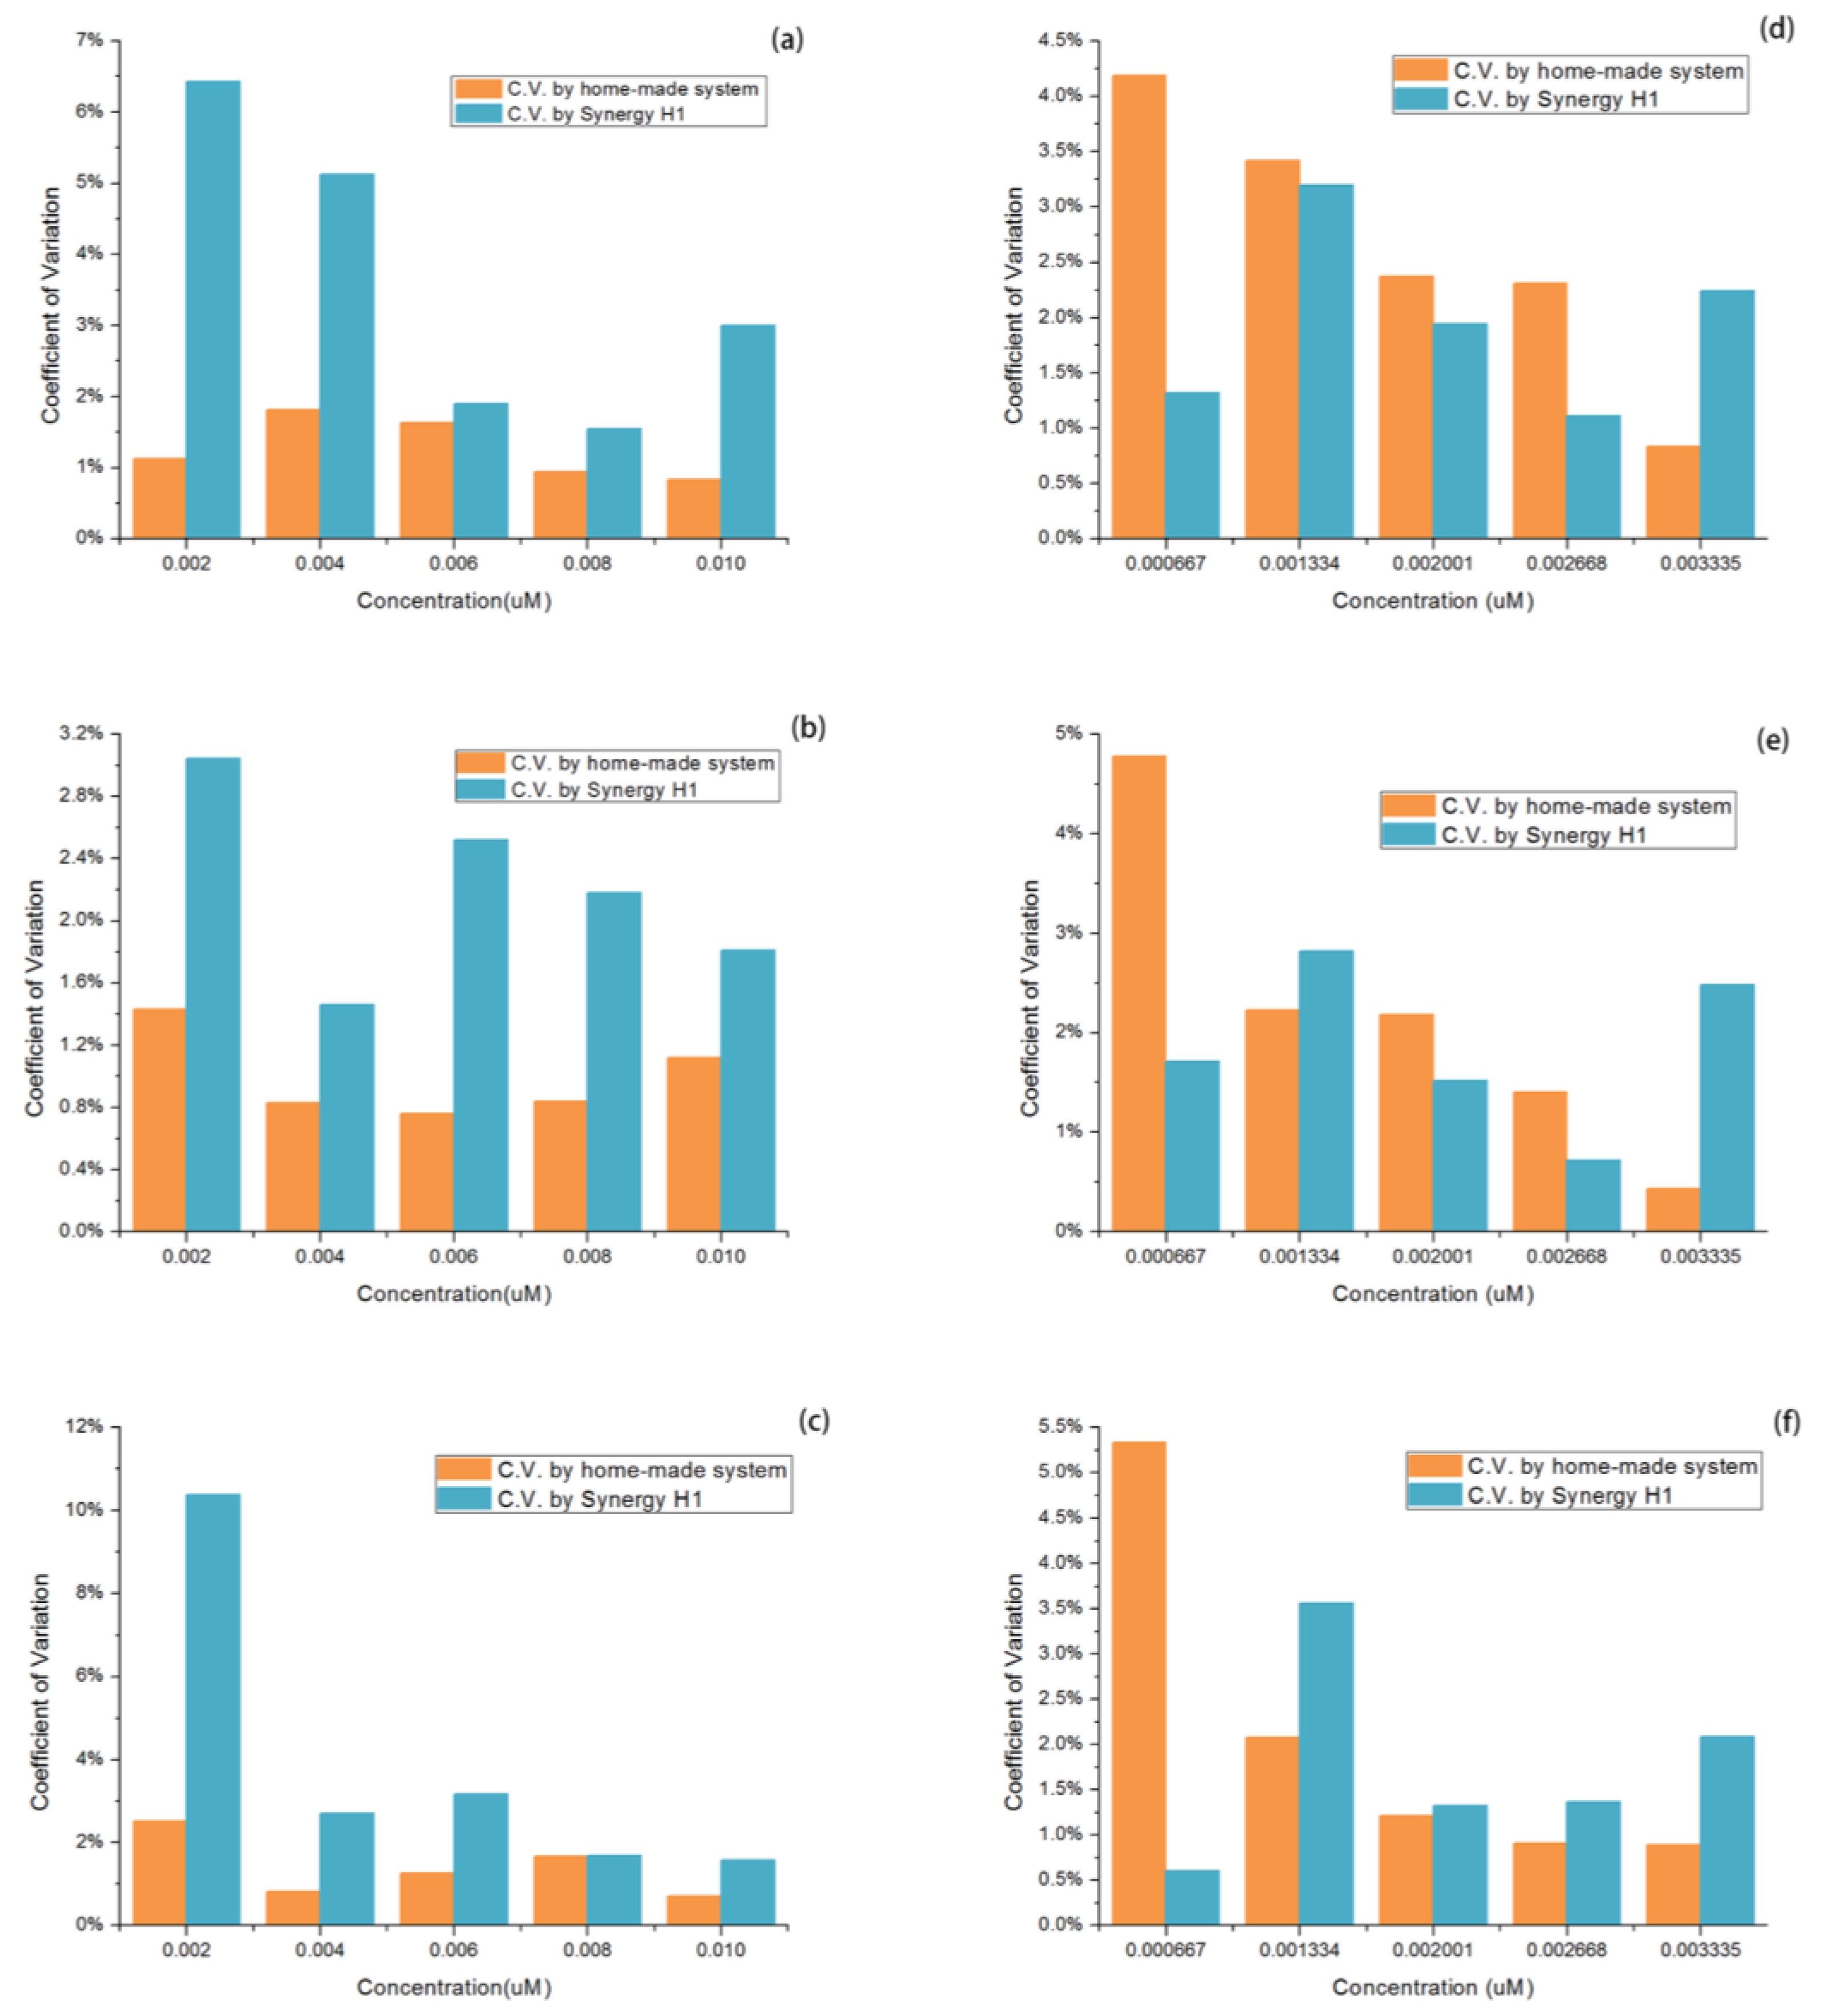
Comparison Study Result
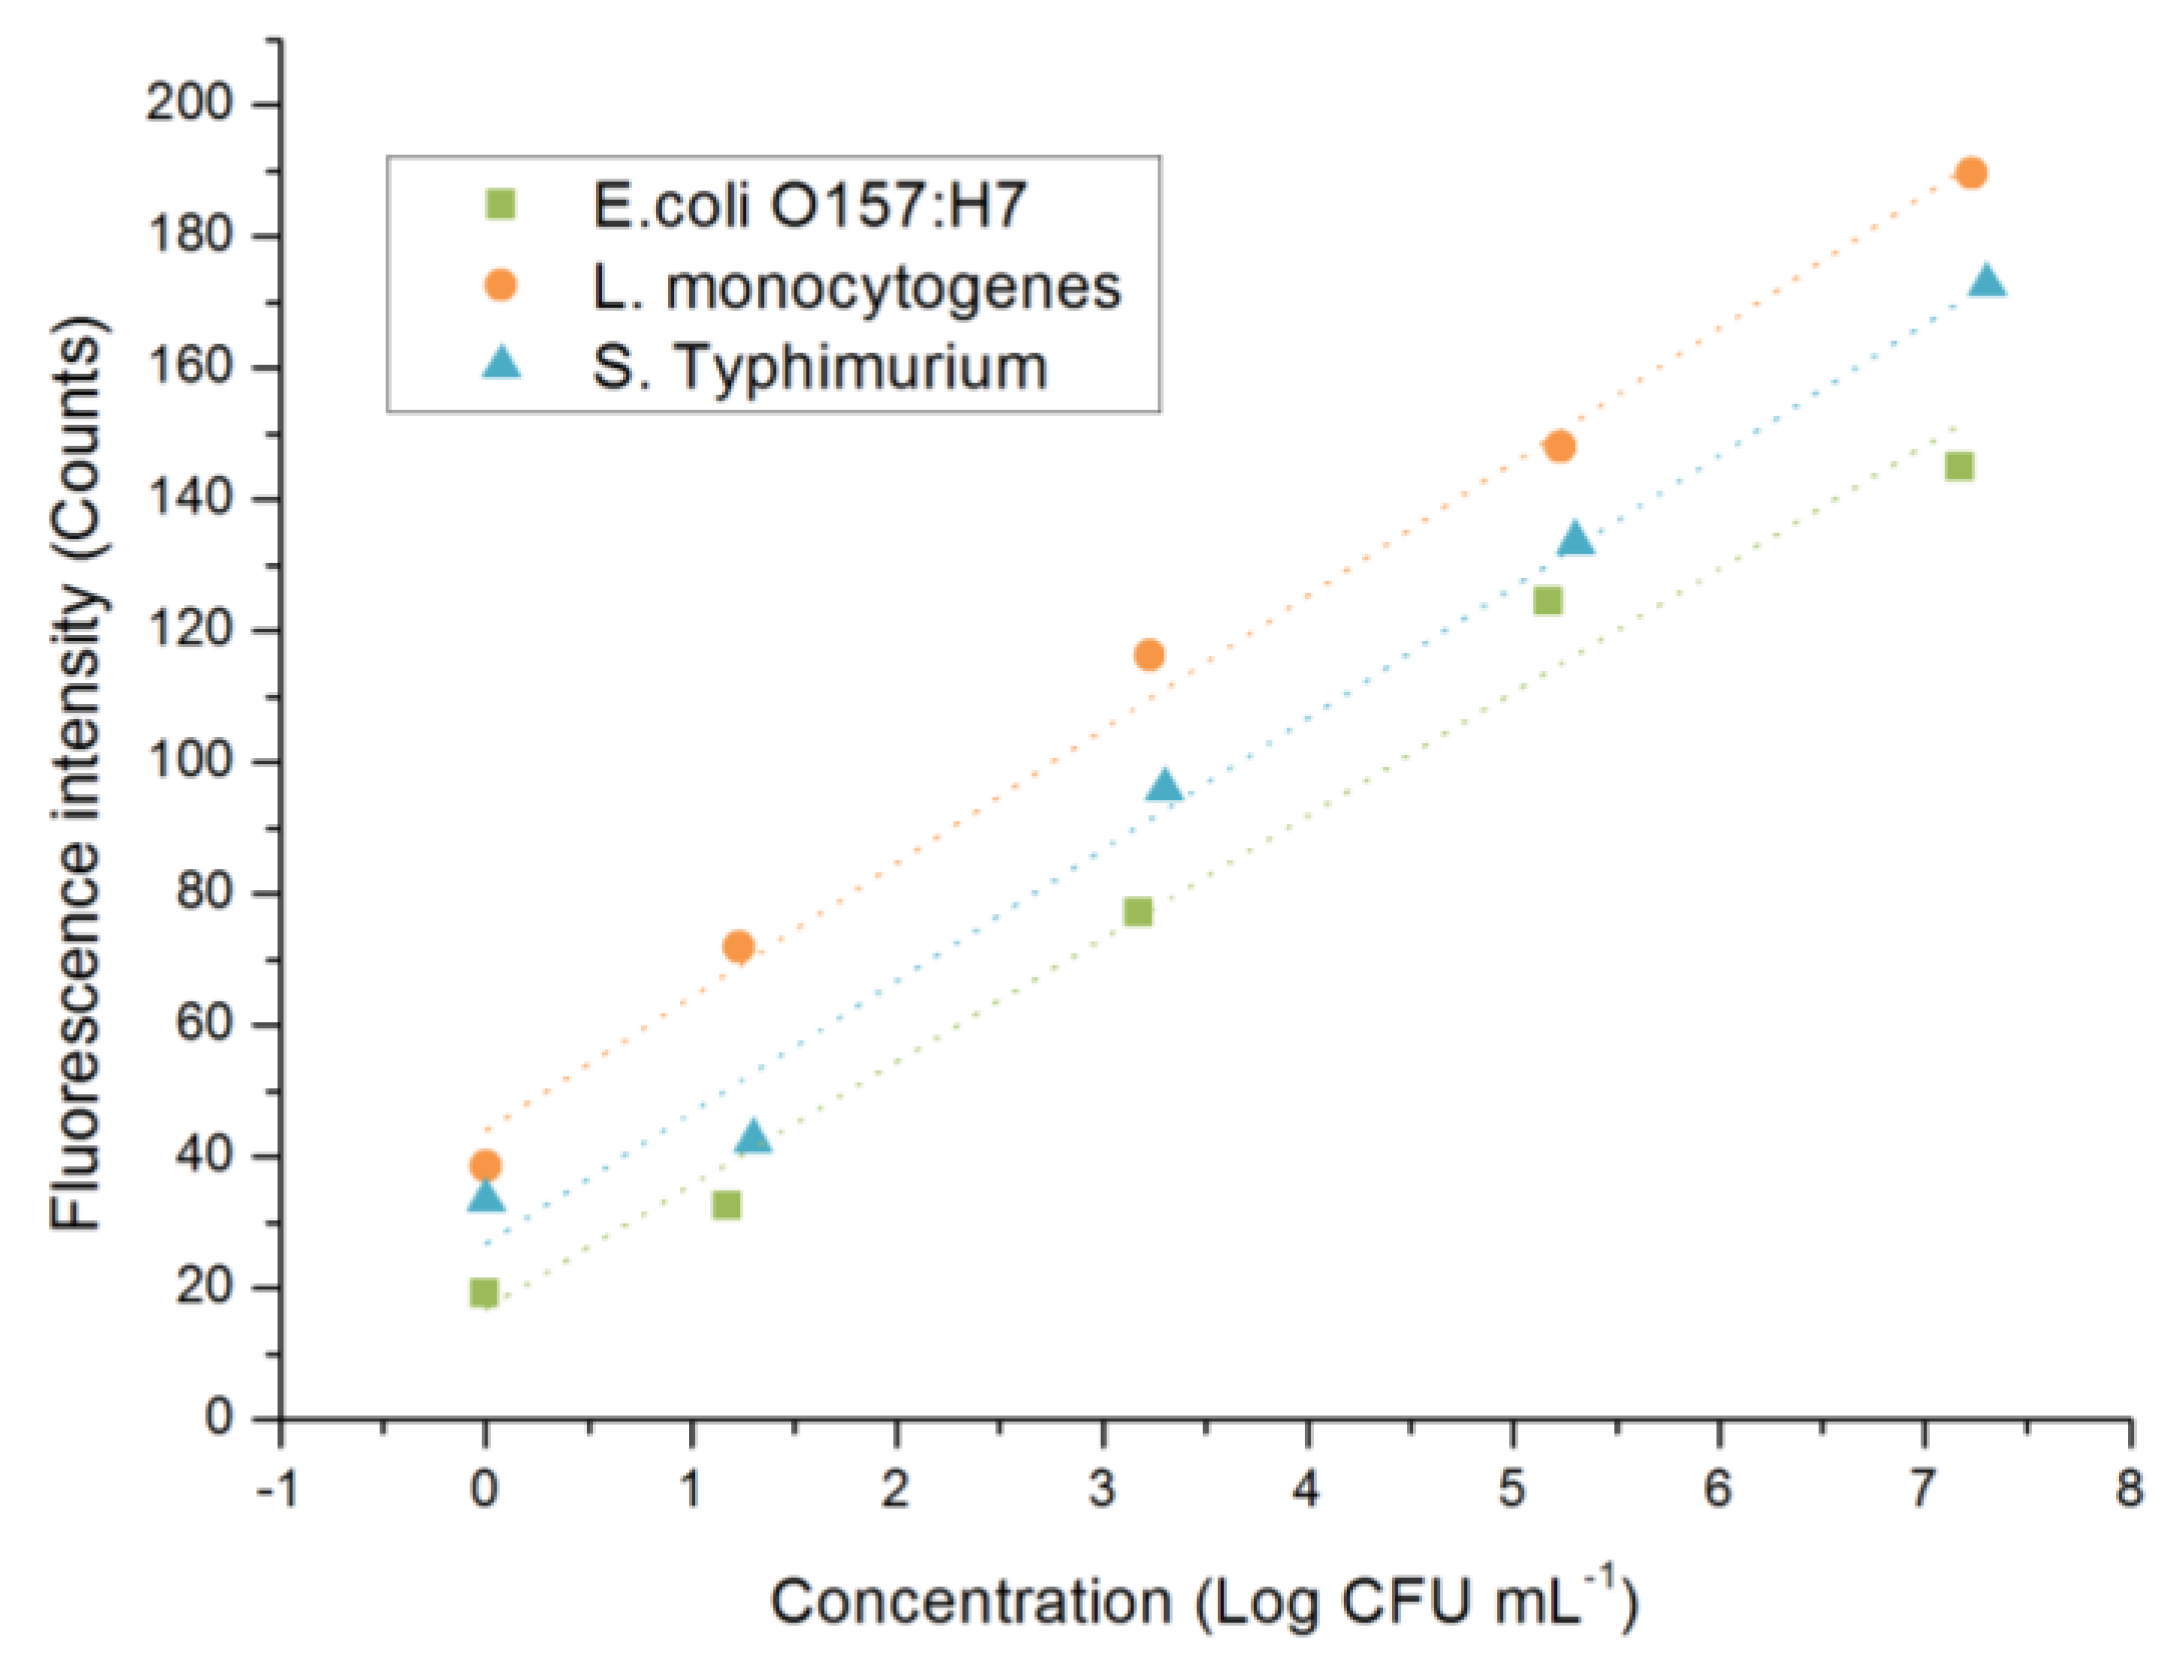
4.3.3. Typical Food-Borne Bacteria Test
4.4. Discussion
5. Conclusions
Acknowledgments
Author Contributions
Conflicts of Interest
References
- Sharma, H.; Mutharasan, R. Review of biosensors for foodborne pathogens and toxins. Sens. Actuators B Chem. 2013, 183, 535–549. [Google Scholar] [CrossRef]
- Sarhan, W.A.; Azzazy, H.M. Phage approved in food, why not as a therapeutic? Expert Rev. Anti-Infect. Ther. 2015, 13, 91–101. [Google Scholar] [CrossRef] [PubMed]
- Ahmed, A.; Rushworth, J.V.; Hirst, N.A.; Millner, P.A. Biosensors for whole-cell bacterial detection. Clin. Microbiol. Rev. 2014, 27, 631–646. [Google Scholar] [CrossRef] [PubMed]
- Klumpp, J.; Loessner, M.J. Detection of bacteria with bioluminescent reporter bacteriophage. Adv. Biochem. Eng. Biotechnol. 2014, 144, 155–171. [Google Scholar] [PubMed]
- The european union summary report on trends and sources of zoonoses, zoonotic agents and food-borne outbreaks in 2012. EFSA J. 2014, 12, 3547.
- Yeni, F.; Acar, S.; Polat, Ö.G.; Soyer, Y.; Alpas, H. Rapid and standardized methods for detection of foodborne pathogens and mycotoxins on fresh produce. Food Control 2014, 40, 359–367. [Google Scholar] [CrossRef]
- Zhao, X.; Lin, C.W.; Wang, J.; Oh, D.H. Advances in rapid detection methods for foodborne pathogens. J. Microbiol. Biotechnol. 2014, 24, 297–312. [Google Scholar] [CrossRef] [PubMed]
- Singh, A.; Poshtiban, S.; Evoy, S. Recent advances in bacteriophage based biosensors for food-borne pathogen detection. Sensors 2013, 13, 1763–1786. [Google Scholar] [CrossRef] [PubMed]
- Law, J.W.; Ab Mutalib, N.S.; Chan, K.G.; Lee, L.H. Rapid methods for the detection of foodborne bacterial pathogens: Principles, applications, advantages and limitations. Front. Microbiol. 2014, 5, 770. [Google Scholar] [CrossRef] [PubMed]
- Chen, J.; Zhang, L.; Paoli, G.C.; Shi, C.; Tu, S.I.; Shi, X. A real-time pcr method for the detection of salmonella enterica from food using a target sequence identified by comparative genomic analysis. Int. J. Food Microbiol. 2010, 137, 168–174. [Google Scholar] [CrossRef] [PubMed]
- Elizaquível, P.; Sánchez, G.; Aznar, R. Quantitative detection of viable foodborne E. coli o157:H7, listeria monocytogenes and salmonella in fresh-cut vegetables combining propidium monoazide and real-time pcr. Food Control 2012, 25, 704–708. [Google Scholar] [CrossRef]
- Kumar, B.K.; Raghunath, P.; Devegowda, D.; Deekshit, V.K.; Venugopal, M.N.; Karunasagar, I.; Karunasagar, I. Development of monoclonal antibody based sandwich elisa for the rapid detection of pathogenic vibrio parahaemolyticus in seafood. Int. J. Food Microbiol. 2011, 145, 244–249. [Google Scholar] [CrossRef] [PubMed]
- Homola, J.; Dostálek, J.; Chen, S.; Rasooly, A.; Jiang, S.; Yee, S.S. Spectral surface plasmon resonance biosensor for detection of staphylococcal enterotoxin B in milk. Int. J. Food Microbiol. 2002, 75, 61–69. [Google Scholar] [CrossRef]
- Munoz-Berbel, X.; Vigues, N.; Jenkins, A.T.; Mas, J.; Munoz, F.J. Impedimetric approach for quantifying low bacteria concentrations based on the changes produced in the electrode-solution interface during the pre-attachment stage. Biosens. Bioelectron. 2008, 23, 1540–1546. [Google Scholar] [CrossRef] [PubMed]
- Hsing, I.M.; Xu, Y.; Zhao, W. Micro- and nano- magnetic particles for applications in biosensing. Electroanalysis 2007, 19, 755–768. [Google Scholar] [CrossRef]
- Shi, J.; Chan, C.; Pang, Y.; Ye, W.; Tian, F.; Lyu, J.; Zhang, Y.; Yang, M. A fluorescence resonance energy transfer (FRET) biosensor based on graphene quantum dots (GQDS) and gold nanoparticles (AuNPS) for the detection of meca gene sequence of staphylococcus aureus. Biosens. Bioelectron. 2015, 67, 595–600. [Google Scholar] [CrossRef] [PubMed]
- Wang, H.; Li, Y.B.; Slavik, M. Rapid detection of listeria monocytogenes using quantum dots and nanobeads-based optical biosensor. J. Rapid Methods Autom. Microbiol. 2007, 15, 67–76. [Google Scholar] [CrossRef]
- Dudak, F.C.; Boyaci, I.H. Multiplex detection of escherichia coli and salmonella enteritidis by using quantum dot-labeled antibodies. J. Rapid Methods Autom. Microbiol. 2009, 17, 315–327. [Google Scholar] [CrossRef]
- Li, M.; Li, Z.; Li, J.; Fu, X.; Zhang, H.; Li, J. Application of quantum dots on detection of food borne pathogen. Food Mach. 2013, 29, 241–244. [Google Scholar]
- Xu, L.; Callaway, Z.T.; Wang, R.; Wang, H.; Slavik, M.F.; Wang, A.; Li, Y. A fluorescent aptasensor coupled with nanobead-based immunomagnetic separation for simultaneous detection of four foodborne pathogenic bacteria. Trans. ASABE 2015, 58, 891–906. [Google Scholar]
- Wang, H.; Li, Y.; Wang, A.; Slavik, M. Rapid, sensitive, and simultaneous detection of three foodborne pathogens using magnetic nanobead-based immunoseparation and quantum dot-based multiplex immunoassay. J. Food Prot. 2011, 74, 2039–2047. [Google Scholar] [CrossRef] [PubMed]
- Zhao, Y.; Ye, M.Q.; Chao, Q.G.; Jia, N.Q.; Ge, Y.; Shen, H.B. Simultaneous detection of multifood-borne pathogenic bacteria based on functionalized quantum dots coupled with immunomagnetic separation in food samples. J. Agric. Food Chem. 2009, 57, 517–524. [Google Scholar] [CrossRef] [PubMed]
- He, X.; Zhou, L.; He, D.; Wang, K.; Cao, J. Rapid and ultrasensitive E. Coli o157:H7 quantitation by combination of ligandmagnetic nanoparticles enrichment with fluorescent nanoparticles based two-color flow cytometry. Analyst 2011, 136, 4183–4191. [Google Scholar] [CrossRef] [PubMed]
- Bai, B.; Hu, Y.; Li, M.; Ronghui, W.; Yanbin, L. Simultaneous detection of two foodborne pathogens using quantum dots as fluorescence labels. J. Chin. Inst. Food Sci. Technol. 2016, 16, 219–225. [Google Scholar]
- Wang, B.; Wang, Q.; Cai, Z.; Ma, M. Simultaneous, rapid and sensitive detection of three food-borne pathogenic bacteria using multicolor quantum dot probes based on multiplex fluoroimmunoassay in food samples. Food Sci. Technol. 2015, 61, 368–376. [Google Scholar] [CrossRef]
- Wang, L.; Wu, C.S.; Fan, X.; Mustapha, A. Detection of escherichia coli o157:H7 and salmonella in ground beef by a bead-free quantum dot-facilitated isolation method. Int. J. Food Microbiol. 2012, 156, 83–87. [Google Scholar] [CrossRef] [PubMed]
- Nazarewicz, R.R.; Bikineyeva, A.; Dikalov, S.I. Rapid and specific measurements of superoxide using fluorescence spectroscopy. J. Biomol. Screen. 2013, 18, 498–503. [Google Scholar] [CrossRef] [PubMed]
- Wu, Y.S.; Huang, F.F.; Lin, Y.W. Fluorescent detection of lead in environmental water and urine samples using enzyme mimics of catechin-synthesized au nanoparticles. ACS Appl. Mater. Interfaces 2013, 5, 1503–1509. [Google Scholar] [CrossRef] [PubMed]
- Tsai, C.Y.; Lin, Y.W. A highly selective and sensitive fluorescence assay for determination of copper(ii) and cobalt(ii) ions in environmental water and toner samples. Analyst 2013, 138, 1232–1238. [Google Scholar] [CrossRef] [PubMed]
- Wang, W.; Li, C.; Tollner, E.W.; Rains, G.C. Development of software for spectral imaging data acquisition using labview. Comput. Electron. Agric. 2012, 84, 68–75. [Google Scholar] [CrossRef]
- Wang, Z.; Shang, Y.; Liu, J.; Wu, X. A labview based automatic test system for sieving chips. Measurement 2013, 46, 402–410. [Google Scholar] [CrossRef]
- Xu, L.; Lu, Z.; Cao, L.; Pang, H.; Zhang, Q.; Fu, Y.; Xiong, Y.; Li, Y.; Wang, X.; Wang, J.; et al. In-field detection of multiple pathogenic bacteria in food products using a portable fluorescent biosensing system. Food Control 2017, 75, 21–28. [Google Scholar] [CrossRef]


| Parameter 1 | Home-Made | Commercial | ||||
|---|---|---|---|---|---|---|
| Wavelength (nm) | 528 | 572 | 621 | 528 | 572 | 621 |
| Intercept | 99.14 | 22.87 | 32.75 | 3937.8 | –54.34 | –451.18 |
| Slope | 1.34 × 10⁵ | 8.33 × 10⁵ | 8.01 × 10⁵ | 8.00 × 10⁶ | 2.00 × 10⁶ | 1.00 × 10⁶ |
| R2 | 0.9989 | 0.9998 | 0.9997 | 0.9993 | 0.9992 | 0.9962 |
| Parameter 1 | Home-made | Commercial | ||||
|---|---|---|---|---|---|---|
| Wavelength (nm) | 528 | 572 | 621 | 528 | 572 | 621 |
| Intercept | 33.29 | 17.52 | 17.34 | –43.93 | –289.61 | –456.13 |
| Slope | 4.49 × 10⁵ | 2.66 × 10⁵ | 2.15 × 10⁵ | 2.00 × 10⁶ | 2.00 × 10⁶ | 1.00 × 10⁶ |
| R2 | 0.9956 | 0.9981 | 0.988 | 0.9997 | 0.9999 | 0.9993 |
© 2017 by the authors. Licensee MDPI, Basel, Switzerland. This article is an open access article distributed under the terms and conditions of the Creative Commons Attribution (CC BY) license ( http://creativecommons.org/licenses/by/4.0/).
Share and Cite
Lu, Z.; Zhang, J.; Xu, L.; Li, Y.; Chen, S.; Ye, Z.; Wang, J. Design and Elementary Evaluation of a Highly-Automated Fluorescence-Based Instrument System for On-Site Detection of Food-Borne Pathogens. Sensors 2017, 17, 442. https://doi.org/10.3390/s17030442
Lu Z, Zhang J, Xu L, Li Y, Chen S, Ye Z, Wang J. Design and Elementary Evaluation of a Highly-Automated Fluorescence-Based Instrument System for On-Site Detection of Food-Borne Pathogens. Sensors. 2017; 17(3):442. https://doi.org/10.3390/s17030442
Chicago/Turabian StyleLu, Zhan, Jianyi Zhang, Lizhou Xu, Yanbin Li, Siyu Chen, Zunzhong Ye, and Jianping Wang. 2017. "Design and Elementary Evaluation of a Highly-Automated Fluorescence-Based Instrument System for On-Site Detection of Food-Borne Pathogens" Sensors 17, no. 3: 442. https://doi.org/10.3390/s17030442