2.1. Limit-State Function Formulations for Fatigue Failure
In a structural reliability problem, the failure probability calculation requires constructing the so-called limit-state function, which represents the failure event of interest as an analytical function of random variables and deterministic parameters [
10,
15]. As mentioned in
Section 1, many methods for the fatigue reliability analysis of bridges have been developed based on the S–N or LEFM approach. A widely used LEFM-based numerical model for crack propagation is the Paris equation [
16]. Based on this equation, Lee and Cho [
10] and Lee and Song [
15] derived a series of formulations for estimating the structural risk of fatigue-induced failure. However, the formulations are based on constant-amplitude loads, and they cannot be applied to a railway bridge because they cannot consider cyclic loads with varying amplitudes, which is a realistic pattern generated by train traffic. Therefore, in this study, the limit-state functions proposed by Lee and Cho [
10] and Lee and Song [
15] are further developed for evaluating the fatigue life of a railway bridge with varying-amplitude loads.
First, consider the following Paris equation [
16], which is a widely-known model of crack propagation:
where
a denotes the crack length,
N denotes the number of loading cycles,
C and
m represent the material properties, and Δ
K is the range of the stress intensity factor. This range can be evaluated by using Newman’s approximation [
17]:
where Δ
S denotes the stress amplitude and
Y(
a) is the geometry function, which is a dimensionless parameter that depends on the geometry around the crack. The following equation can be obtained by substituting Equation (2) into Equation (1):
If the load amplitude is a constant, Equation (3) can be developed to an equation for the fatigue life evaluation of a structure, as described by Lee and Song [
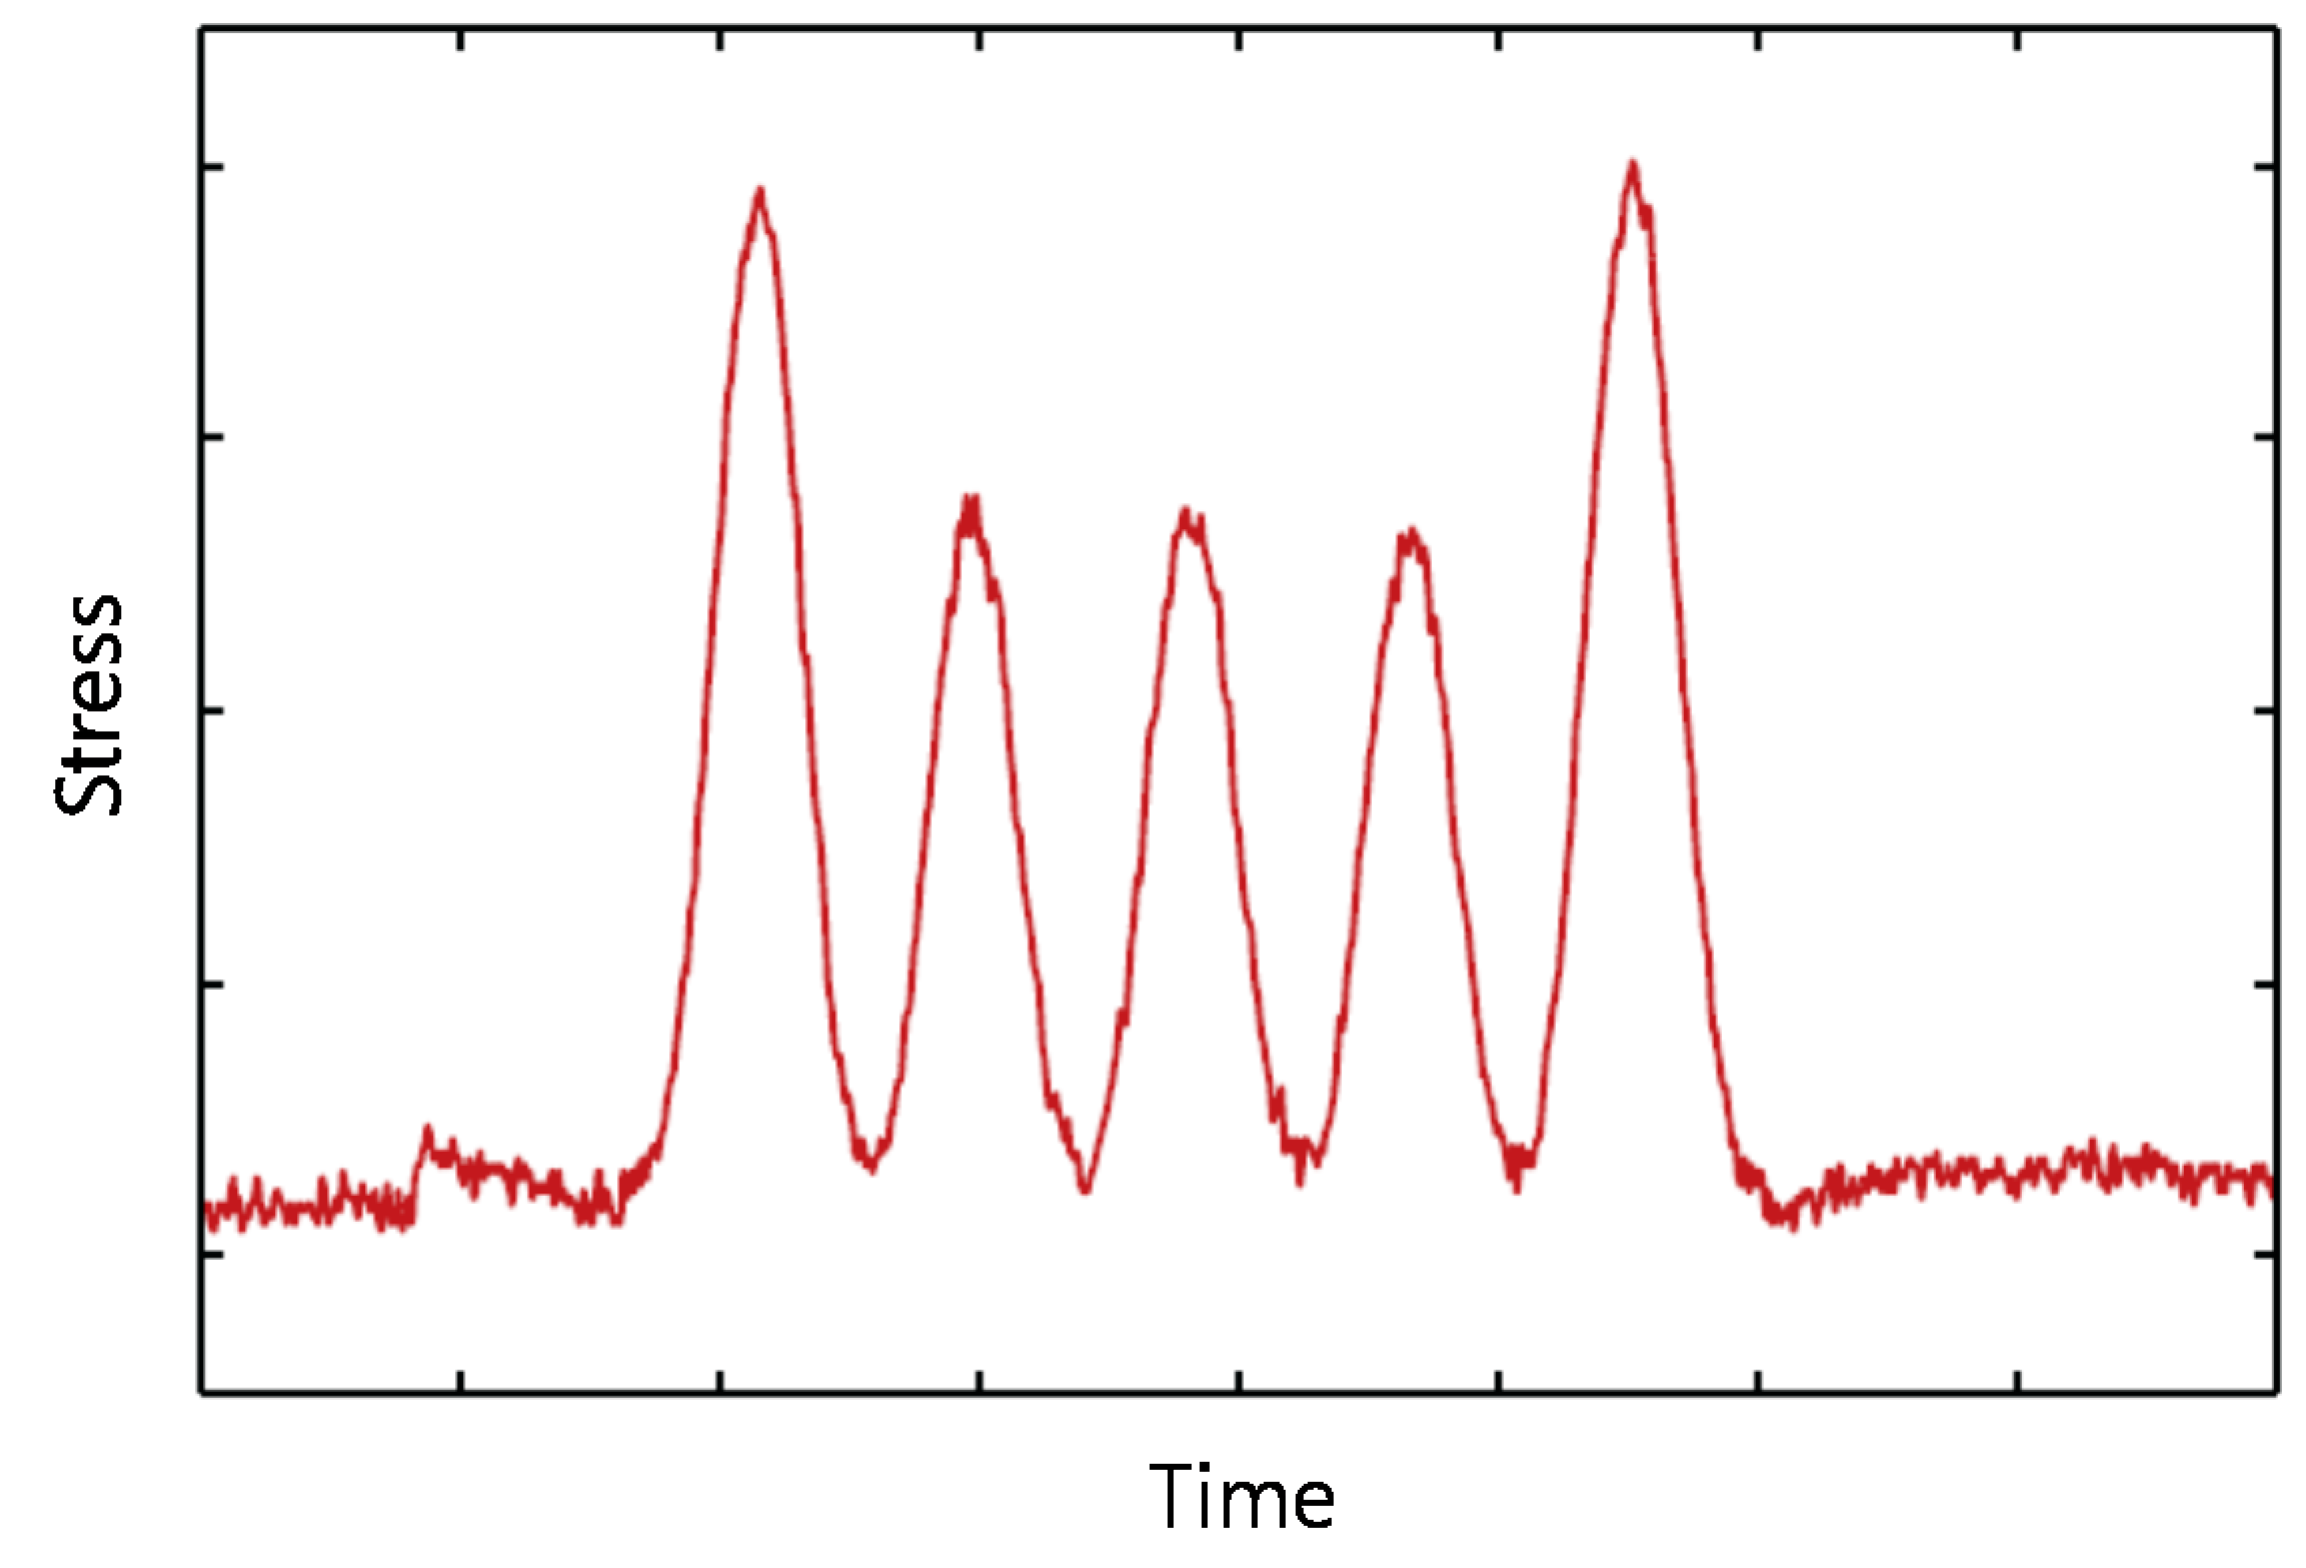
15]. However, when a train passes over a bridge, the stress experienced by a structural member is found to be fluctuating, as shown in
Figure 1, and this makes it impossible to use the formulations devised for a constant amplitude.
The rainflow cycle counting algorithm [
18] is widely used to handle such a varying-amplitude load and assess the fatigue life of structures, especially in mechanical engineering. Usually, the algorithm extracts cycles from the load, stress, or strain history obtained from measurement or simulation results. From the cycle counting, several cycles and half-cycles with different amplitude and mean values are obtained. This counting algorithm can be used with the Paris equation, which enables it to compute the expected fatigue life under random loading conditions in a theoretical manner [
18].
The stress amplitude Δ
Si and the corresponding number of cycles
ni are used for the integration of Equation (3) from the initial condition to the current time point, thereby providing the following relationship between the current crack length and the time duration as follows:
where
a0 is the initial crack length, ν
0 is the frequency of train loading,
T is the time duration, and
Namp is the total number of stress amplitude values. If a crack failure is assumed to occur when the crack length exceeds the critical crack length
ac, the time required for crack growth from
a0 to
ac,
T, is expressed by:
The limit-state function for the failure of the
j-th structural member or location (“member” is used hereafter) within a given time interval [0,
Ts] is expressed by:
where
X denotes the vector of random variables and
Tj0 is the time required for the fatigue failure of the
j-th structural member. In structural reliability problems,
g(
X) ≤ 0 typically indicates the occurrence of a failure event.
Although several studies [
10,
15,
19,
20] for the probability estimation of fatigue failure events were conducted with the Paris equation in Equation (1), other crack propagation models such as the Walker equation [
21] and the Forman equation [
22] can also be introduced to model crack growth more accurately. Various crack growth models have been suggested to improve the Paris equation, and any model can replace the Paris equation in the proposed method, if it satisfies the following conditions: (1) the time duration of the crack growth can be analytically expressed in terms of random variables and deterministic variables, as done in Equations (1)–(5); and (2) the statistical properties (e.g., distribution type, mean, standard deviation, and correlation) of the random variables are available. The first condition can be met by several crack growth models. In this research, however, the Paris equation is selected because the statistical characteristics of the equation parameters were investigated sufficiently as discussed in the previous studies [
10,
15].
If a railway bridge is considered to be a structural system consisting of multiple structural members, the failure of the bridge system should be expressed by a Boolean function of the failure events of individual members; to obtain such a function, system reliability analysis is required. In this research, a bridge is considered to fail if any of its members fails because of fatigue, and the probability of this system event,
Psys, is described as:
where
Nmem is the total number of members in consideration.
2.2. Reliability Updating through Inspection and Repair Events
A new approach to update the probability of fatigue failure based on inspection results was recently proposed [
15]. However, the formulations provided in the research were developed for aircraft and cannot be used to update the prior risk information after repairing events. In the present research, the previously proposed formulations are introduced and then further developed so that it can be applied to railway bridges after both of inspection and repairing events.
For an event of interest
Ei, (e.g., a member failure in Equation (6) or a system failure in Equation (7)), its probability
Pi can be updated through an inspection event as follows:
where
IEj denotes the inspection event for the
j-th member. This formulation can be extended to utilize multiple available inspection results to update the probability
Pi, i.e.,:
Inspection results are classified into two types of events—
equality and
inequality events—depending on whether a crack is detected (and measured) or not. Considering that inspections are generally made at multiple locations, three possible combinations of inspection results exist:
inequality,
equality, and
mixed cases [
15,
23].
First, an inequality event indicates that no crack is detected through inspection at a certain single location. There are two possible explanations as to why no crack is detected. First, a crack is too small to be detected. Second, although a relatively large crack actually exists on the inspected member, it may be missed because of human error or the limitations of the detecting device. In either case, this event can be formulated as:
where
Tjd denotes the time required for the crack to grow to a detectable crack size in the
j-th member,
ad is the detectable crack size during the inspection process, and
TI denotes the time at which the member is inspected. The detectable crack size
ad is related to a specific inspection method and is modeled as a random variable reflecting the actual probability of detection.
For a single inequality event, the conditional probability in Equation (8) can be calculated as:
Likewise, the conditional probability for multiple inequality events can be calculated as:
The updated probabilities can be obtained from Equations (11) and (12) by computing the probabilities in the numerator and the denominator by component and system reliability analysis.
Second, an equality event indicates that a crack is detected and measured. The event is formulated as:
where
Tjm denotes the time required for the crack to grow to the measured crack size in the
j-th member,
am is the measured crack size, and ε
m is the measuring error. In the equation, it should be noted that
Tjm is equal to the inspection time
TI, which makes the formulation different from the limit-state formulations in Equation (10). The conditional probability for the equality event is calculated as:
Compared to the terms in Equation (11), the probability terms in Equation (14) are more challenging to compute using structural reliability methods because the probabilities of both the numerator and the denominator are zero [
24]. Through an analytical derivation presented in a previous study [
15], Equation (14) is transformed to:
The updated probability in the equation can be calculated via numerical differentiation. Likewise, the conditional probability for multiple equality events is formulated as follows [
25]:
where
n is the number of observed equality events. The updated probability
Pi,up in Equation (16) can also be calculated using the
n-th-order numerical differentiation. However, the equation needs to be used with caution because such a high-order numerical differentiation can produce significant error unless the probability calculations in the numerator and the denominator are extremely accurate. Therefore, the equality case including multiple equality events is not discussed in this research.
Lastly, with regard to mixed cases, the simplest case involves a single inequality event and a single equality event. The updated probability is formulated as:
This equation can be transformed to:
Finally, this formulation can be generalized for a mixed case involving multiple inequality and equality inspection events as:
It should be noted that Equation (19) is the combination of Equations (12) and (16). Because of the aforementioned difficulty in carrying out high-order numerical differentiation, the mixed case involving multiple equality events is not handled in this research.
Overall, system reliability updating after repair is similar to that through inspection. However, when a crack is detected, measured, and repaired, the crack size in the repaired member changes; therefore, structural analysis needs to be performed with a new initial crack length for the repaired member. When the repair is made at
Tr, according to Equation (6), the limit-state function for the failure of the repaired member
j within an inspection cycle [0, Ts] is described as:
where
ajr is the initial crack length in the repaired member.
ajr depends on the quality of the repair methods, e.g., grinding and welding.
In summary, the fatigue failure events of a structural member and structural system are expressed by analytical functions of random variables and deterministic parameters shown in Equations (6) and (7), respectively. These equations are derived through the analytical derivation from Equation (1). Likewise, the events of no-crack detection, crack detection and size measurement, and repair are expressed by Equations (10), (13) and (20), respectively. With these equations, the original probability of a fatigue failure event which can be estimated from Equations (6) and (7) can be updated based on the conditional probability, as shown in Equations (9), (16) and (19).
A reliability analysis needs to be performed to calculate the probability of a fatigue failure event with these formulations, and numerous reliability analysis methods have been developed so far [
26]. Among them, the first-order reliability method (FORM) [
27] and the second-order reliability method (SORM) [
28] are used to perform component reliability analysis. In this research, FERUM (Finite Element Reliability Using MATLAB) [
29], which is a reliability software package developed at the University of California, Berkeley, was modified and then introduced to perform reliability analysis. In addition, for a structural system consisting of multiple structural members, a failure event needs to be expressed by a system event which requires system reliability analysis (SRA) [
30,
31]. In this study, it is assumed that the railway bridge system fails if any of its structural members fail, and the Matrix-based System Reliability (MSR) method [
31] is employed to calculate the system probability.


