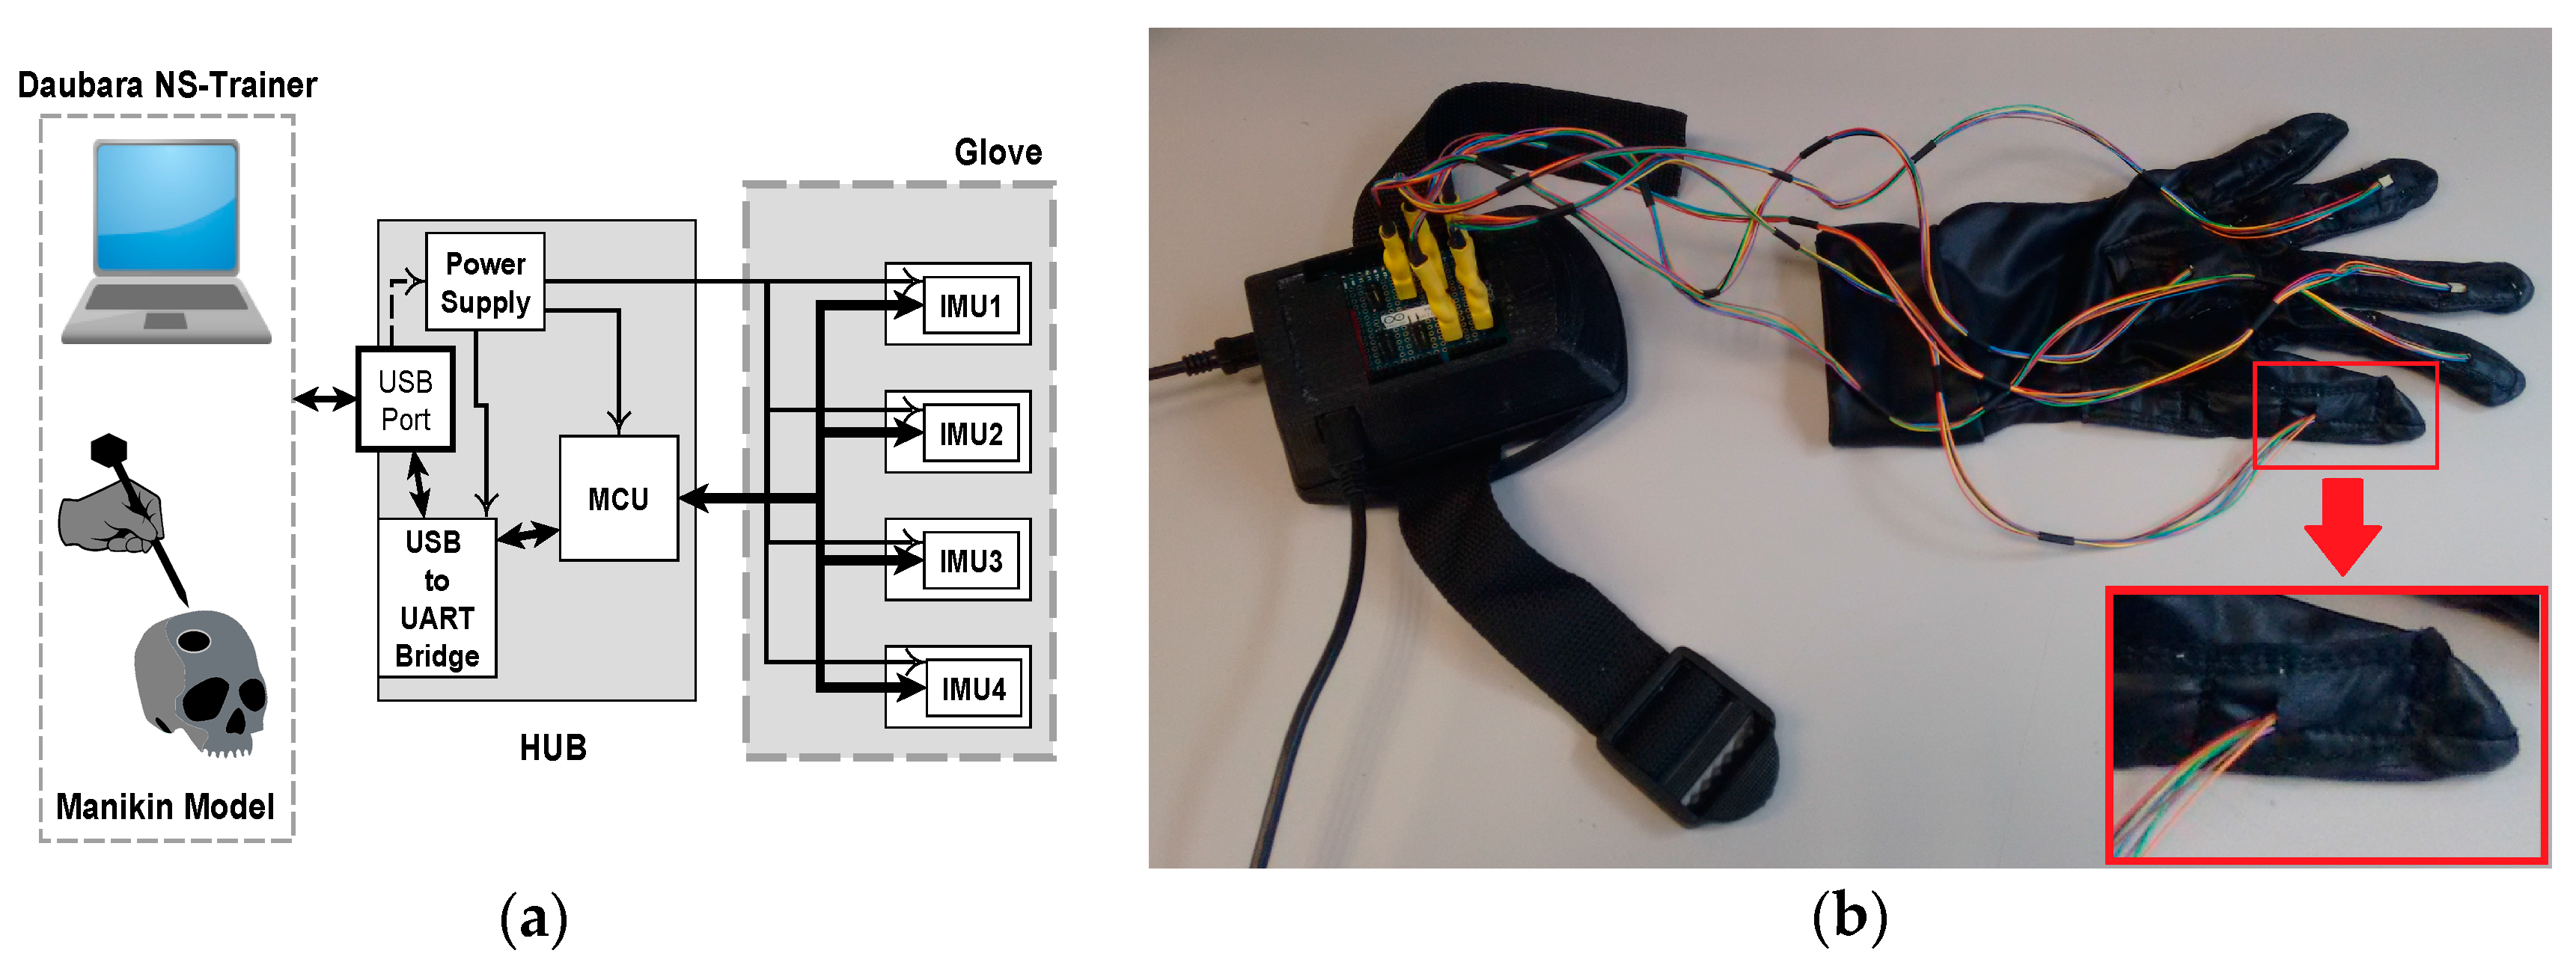
Figure 1.
Hardware of IGlove system: (a) Block diagram of main parts of Hub and Glove and their interconnection. Microcontroller and sensors communicate in a single-master, multiple-slave configuration using SPI on a multidrop bus. IMU sensors were configured to sample internal signals from accelerometers and gyroscopes at 8 KHz, and the user-programmable digital low-pass filters were setting up to a cut-off frequency of 125 Hz, using the preconfigured low-pass filters of the sensor. Measurement data is sent via a high-speed USB link to the Daubara NS Trainer; sensors are sampled 100 times per second; (b) Picture of the system showing the connection between Glove and Hub. In this case, sensors were worn on thumb, index, middle, ring fingers, and in the back of the hand. A communication system that transfers data and power between Hub and each sensor has been implemented using a set of thin and flexible cables. A zoom of the thumb is presented in the lower right corner; it can be observed how power and data cables enter to one sensor compartment.
![Sensors 17 00988 g001]()
Figure 2.
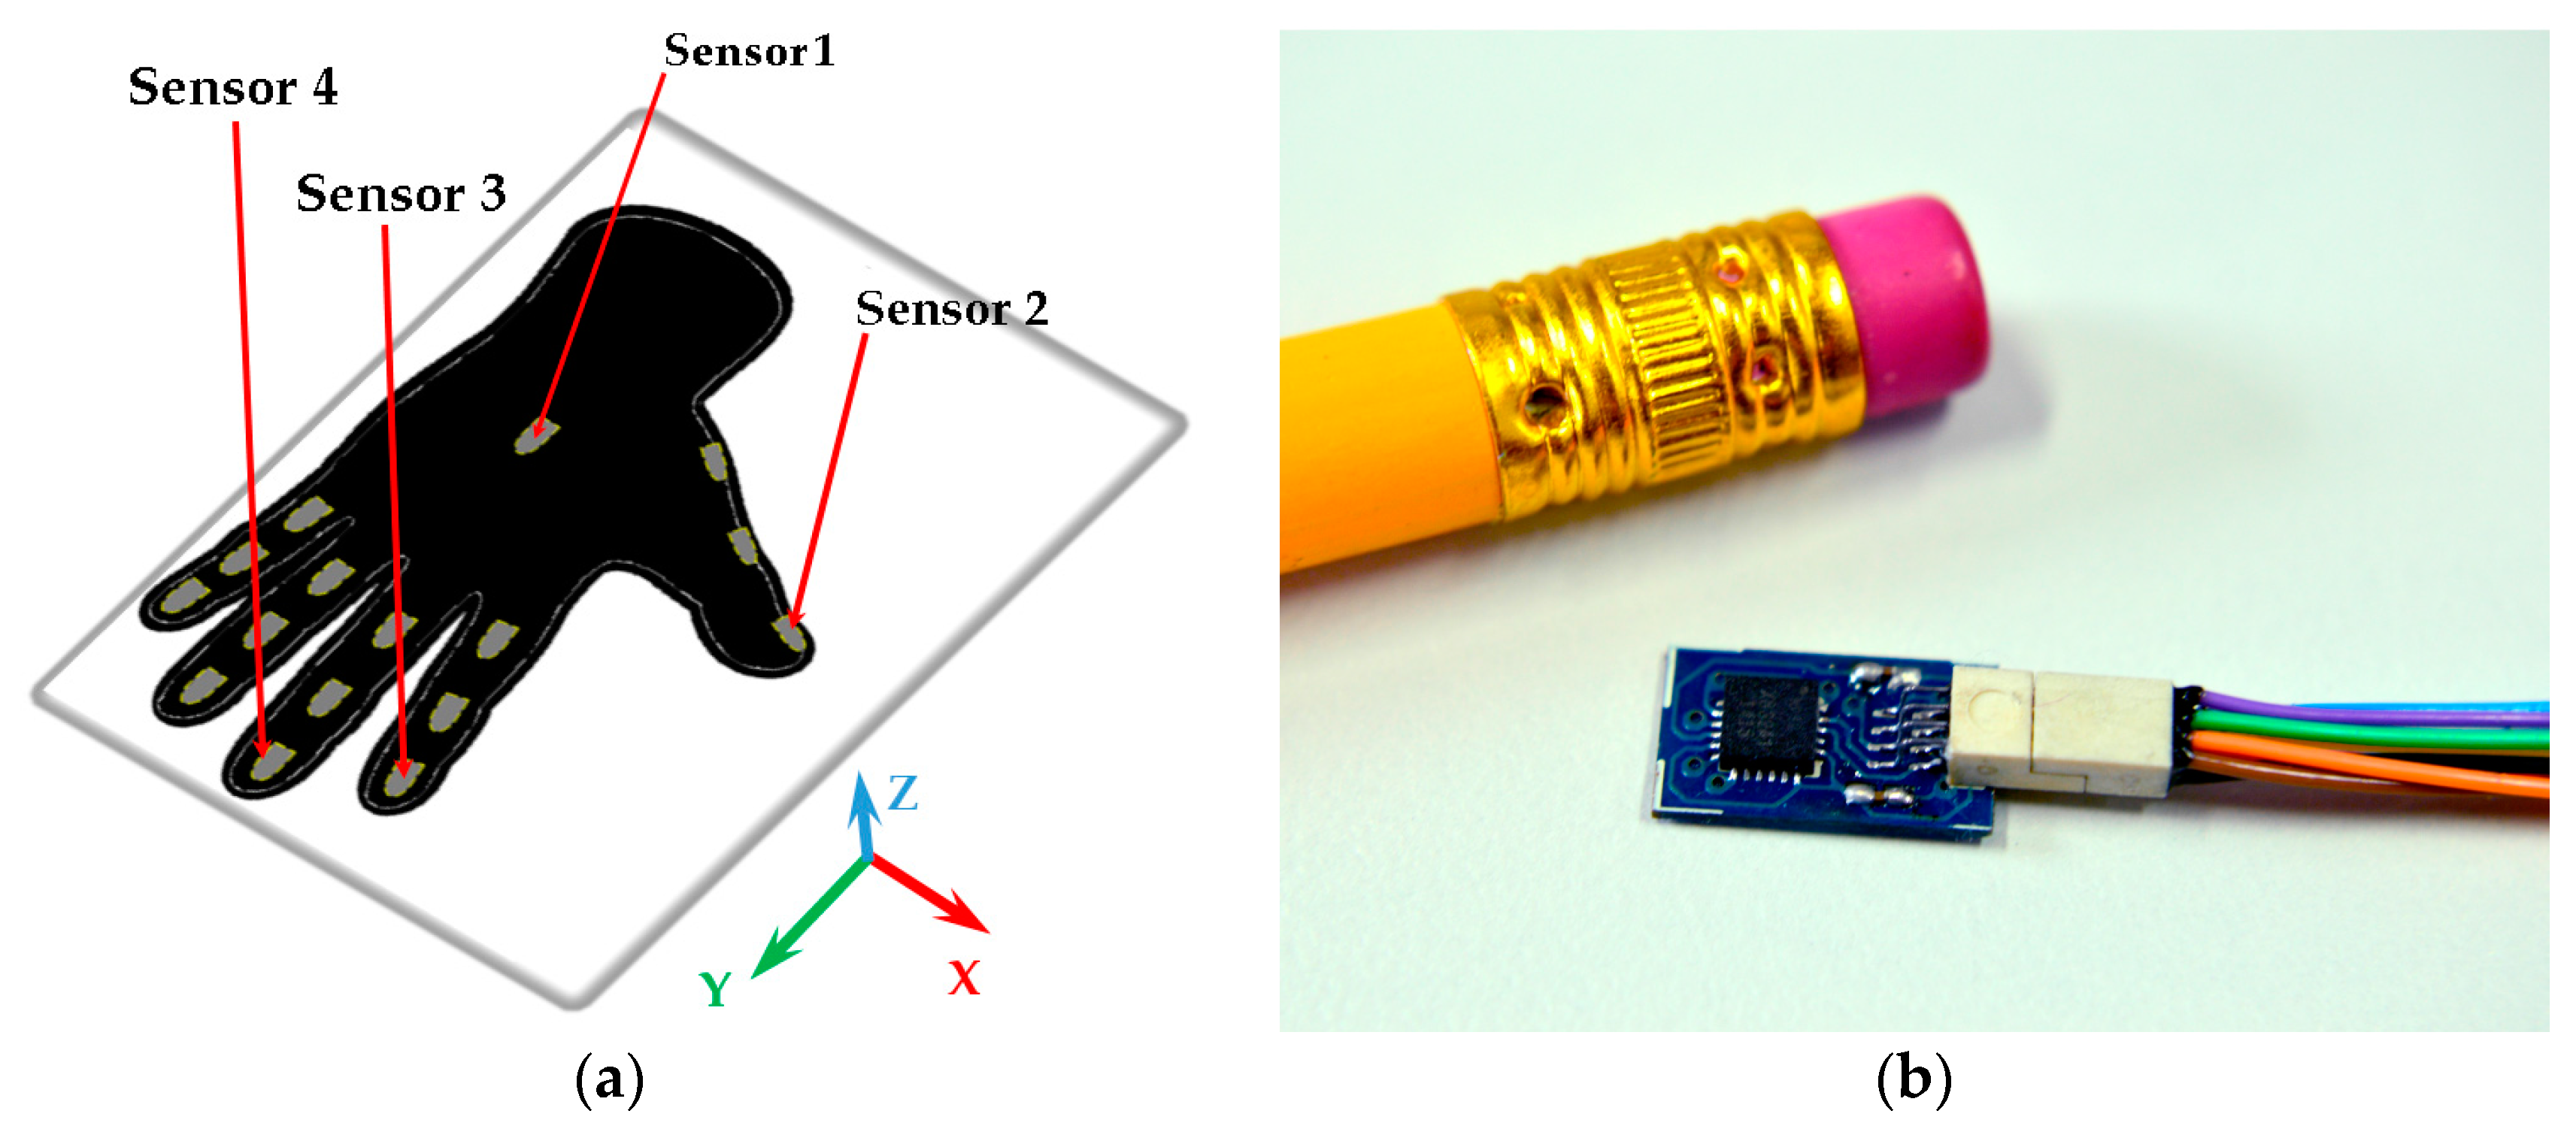
Sensor compartments and a motion sensor: (a) Distribution of sensor compartments on IGlove. Red arrows point to compartments used to accommodate the four sensors employed in this study; Sensor 1 is in the back of the hand, Sensor 2 on the thumb, Sensor 3 on the index, and Sensor 4 on the middle finger. 16 gray marks on glove indicate available places to put motion sensors (The glove has 16 compartments to put sensors, three for each finger on each phalange, and one in the back of the hand); (b) A sensor beside a 6 mm pencil to illustrate size. This sensor finely fits on any of the compartments on the Glove.
Figure 2.
Sensor compartments and a motion sensor: (a) Distribution of sensor compartments on IGlove. Red arrows point to compartments used to accommodate the four sensors employed in this study; Sensor 1 is in the back of the hand, Sensor 2 on the thumb, Sensor 3 on the index, and Sensor 4 on the middle finger. 16 gray marks on glove indicate available places to put motion sensors (The glove has 16 compartments to put sensors, three for each finger on each phalange, and one in the back of the hand); (b) A sensor beside a 6 mm pencil to illustrate size. This sensor finely fits on any of the compartments on the Glove.
Figure 3.
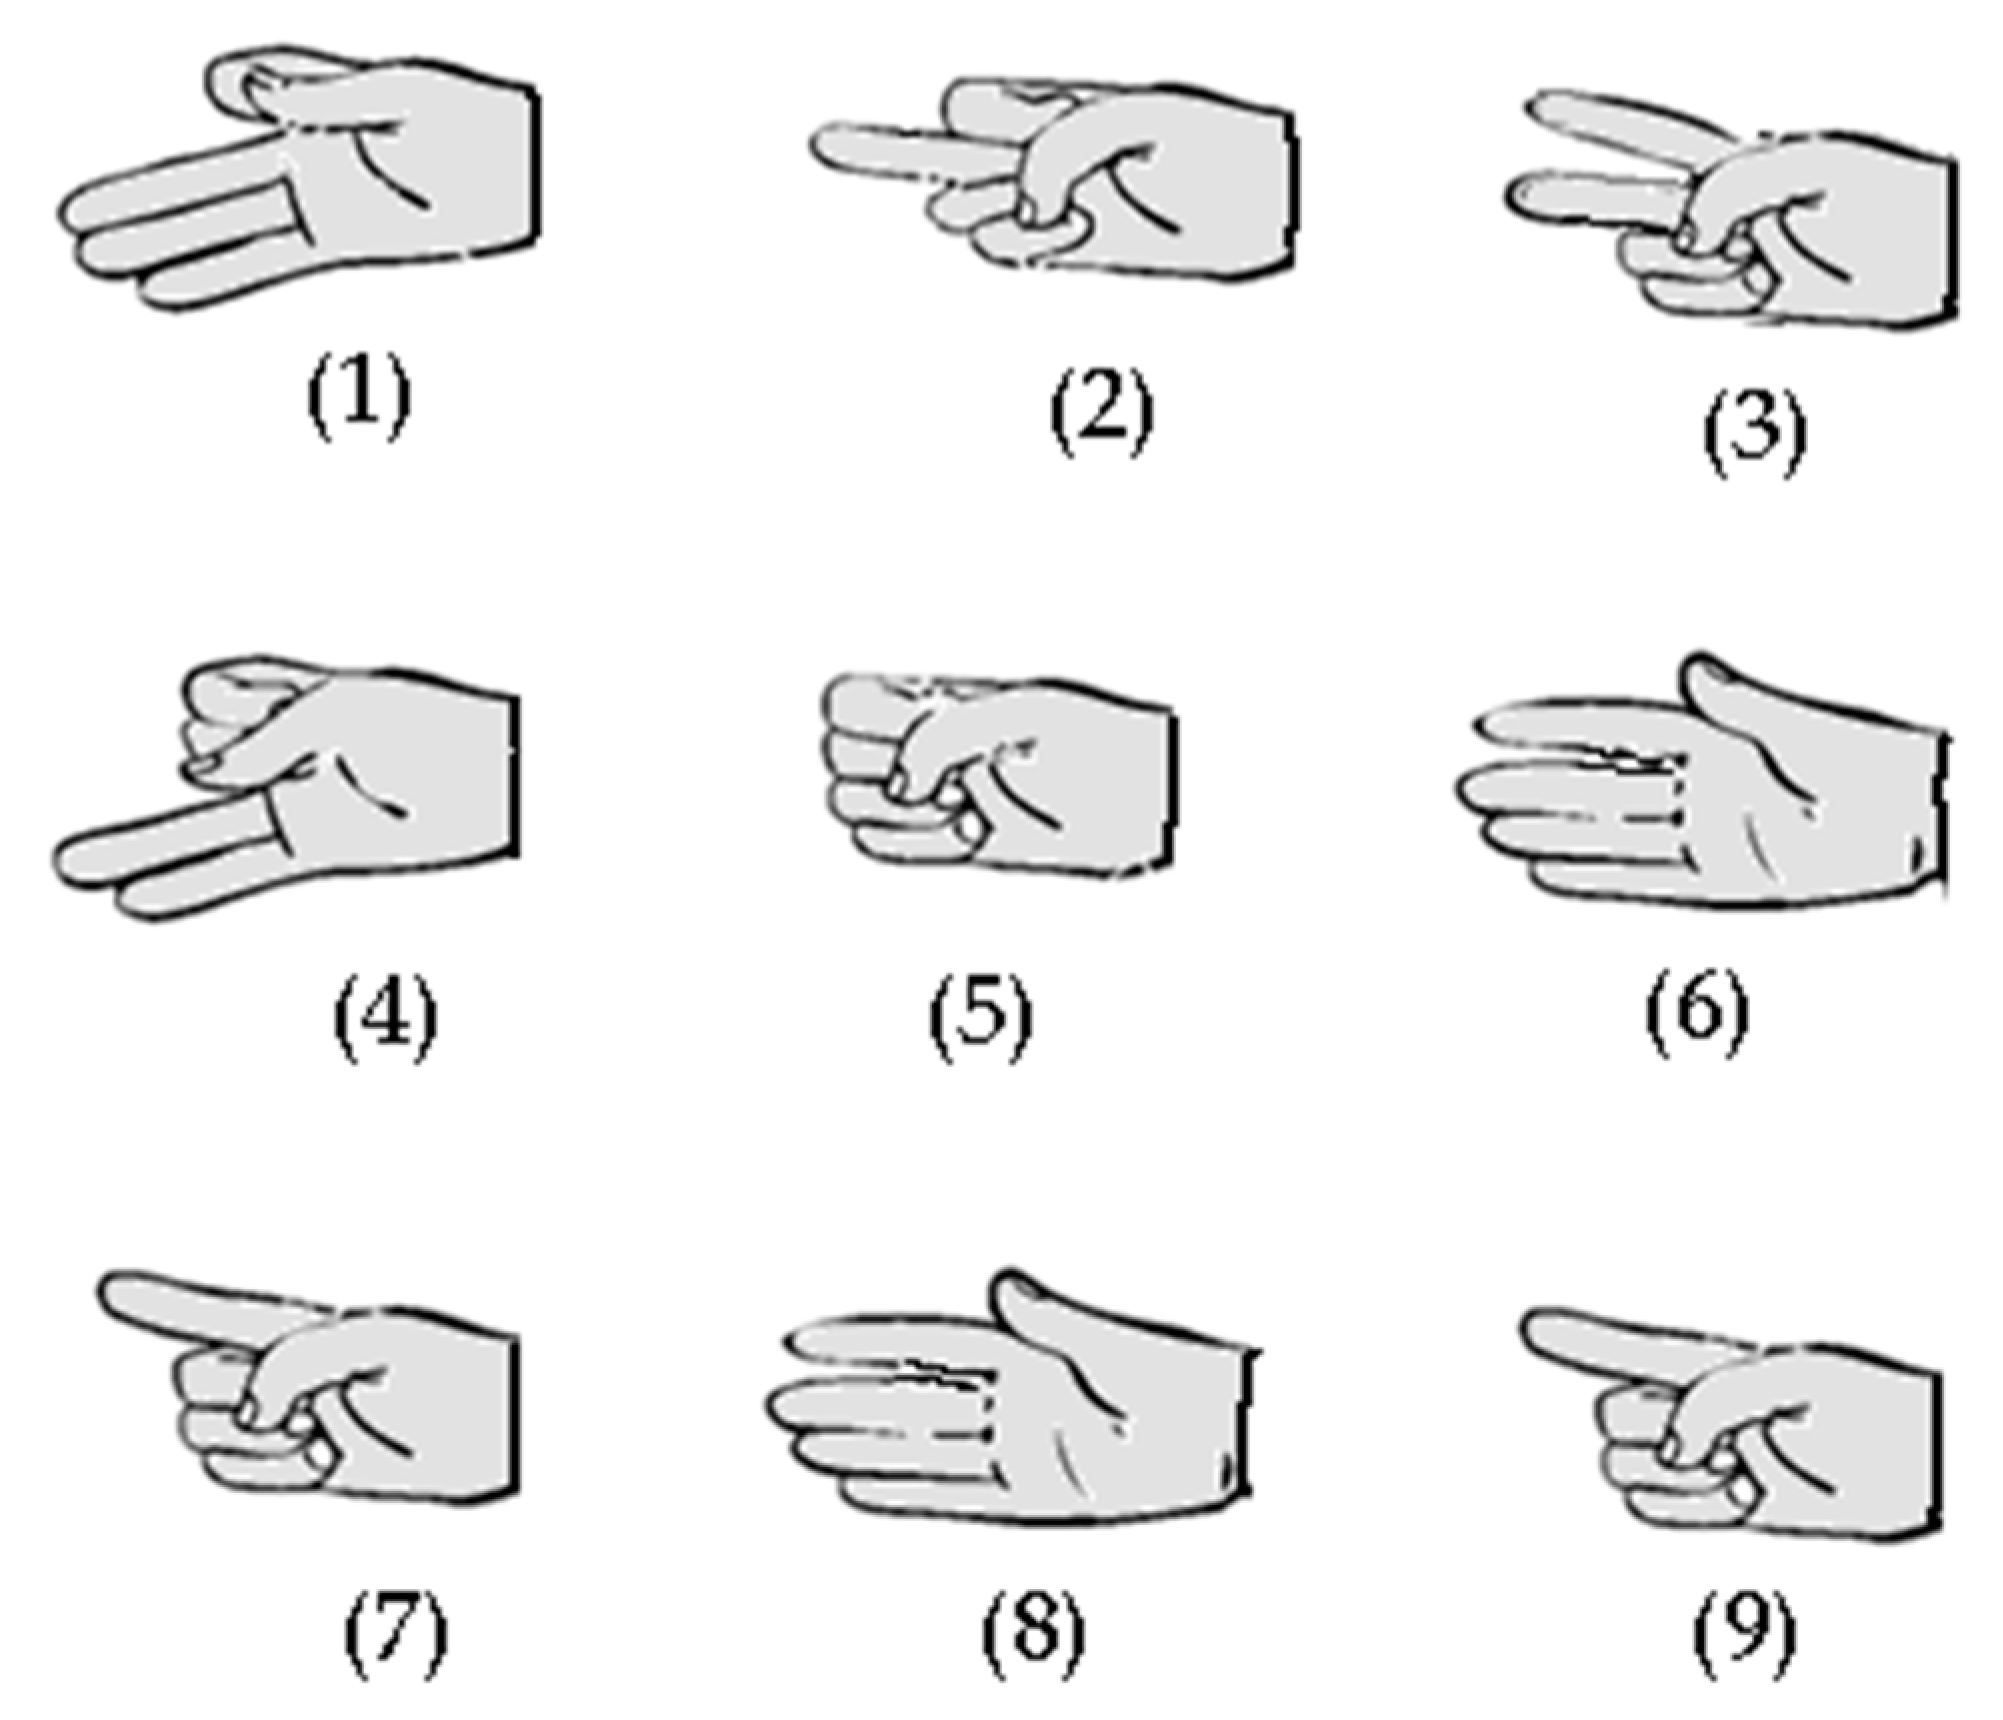
Hand gestures (1 to 9) used in exercises one and two. Those gestures were designed to test the capability of IGlove system for recognizing finger movements, using sensors on the thumb, index, and middle fingers.
Figure 3.
Hand gestures (1 to 9) used in exercises one and two. Those gestures were designed to test the capability of IGlove system for recognizing finger movements, using sensors on the thumb, index, and middle fingers.
Figure 4.
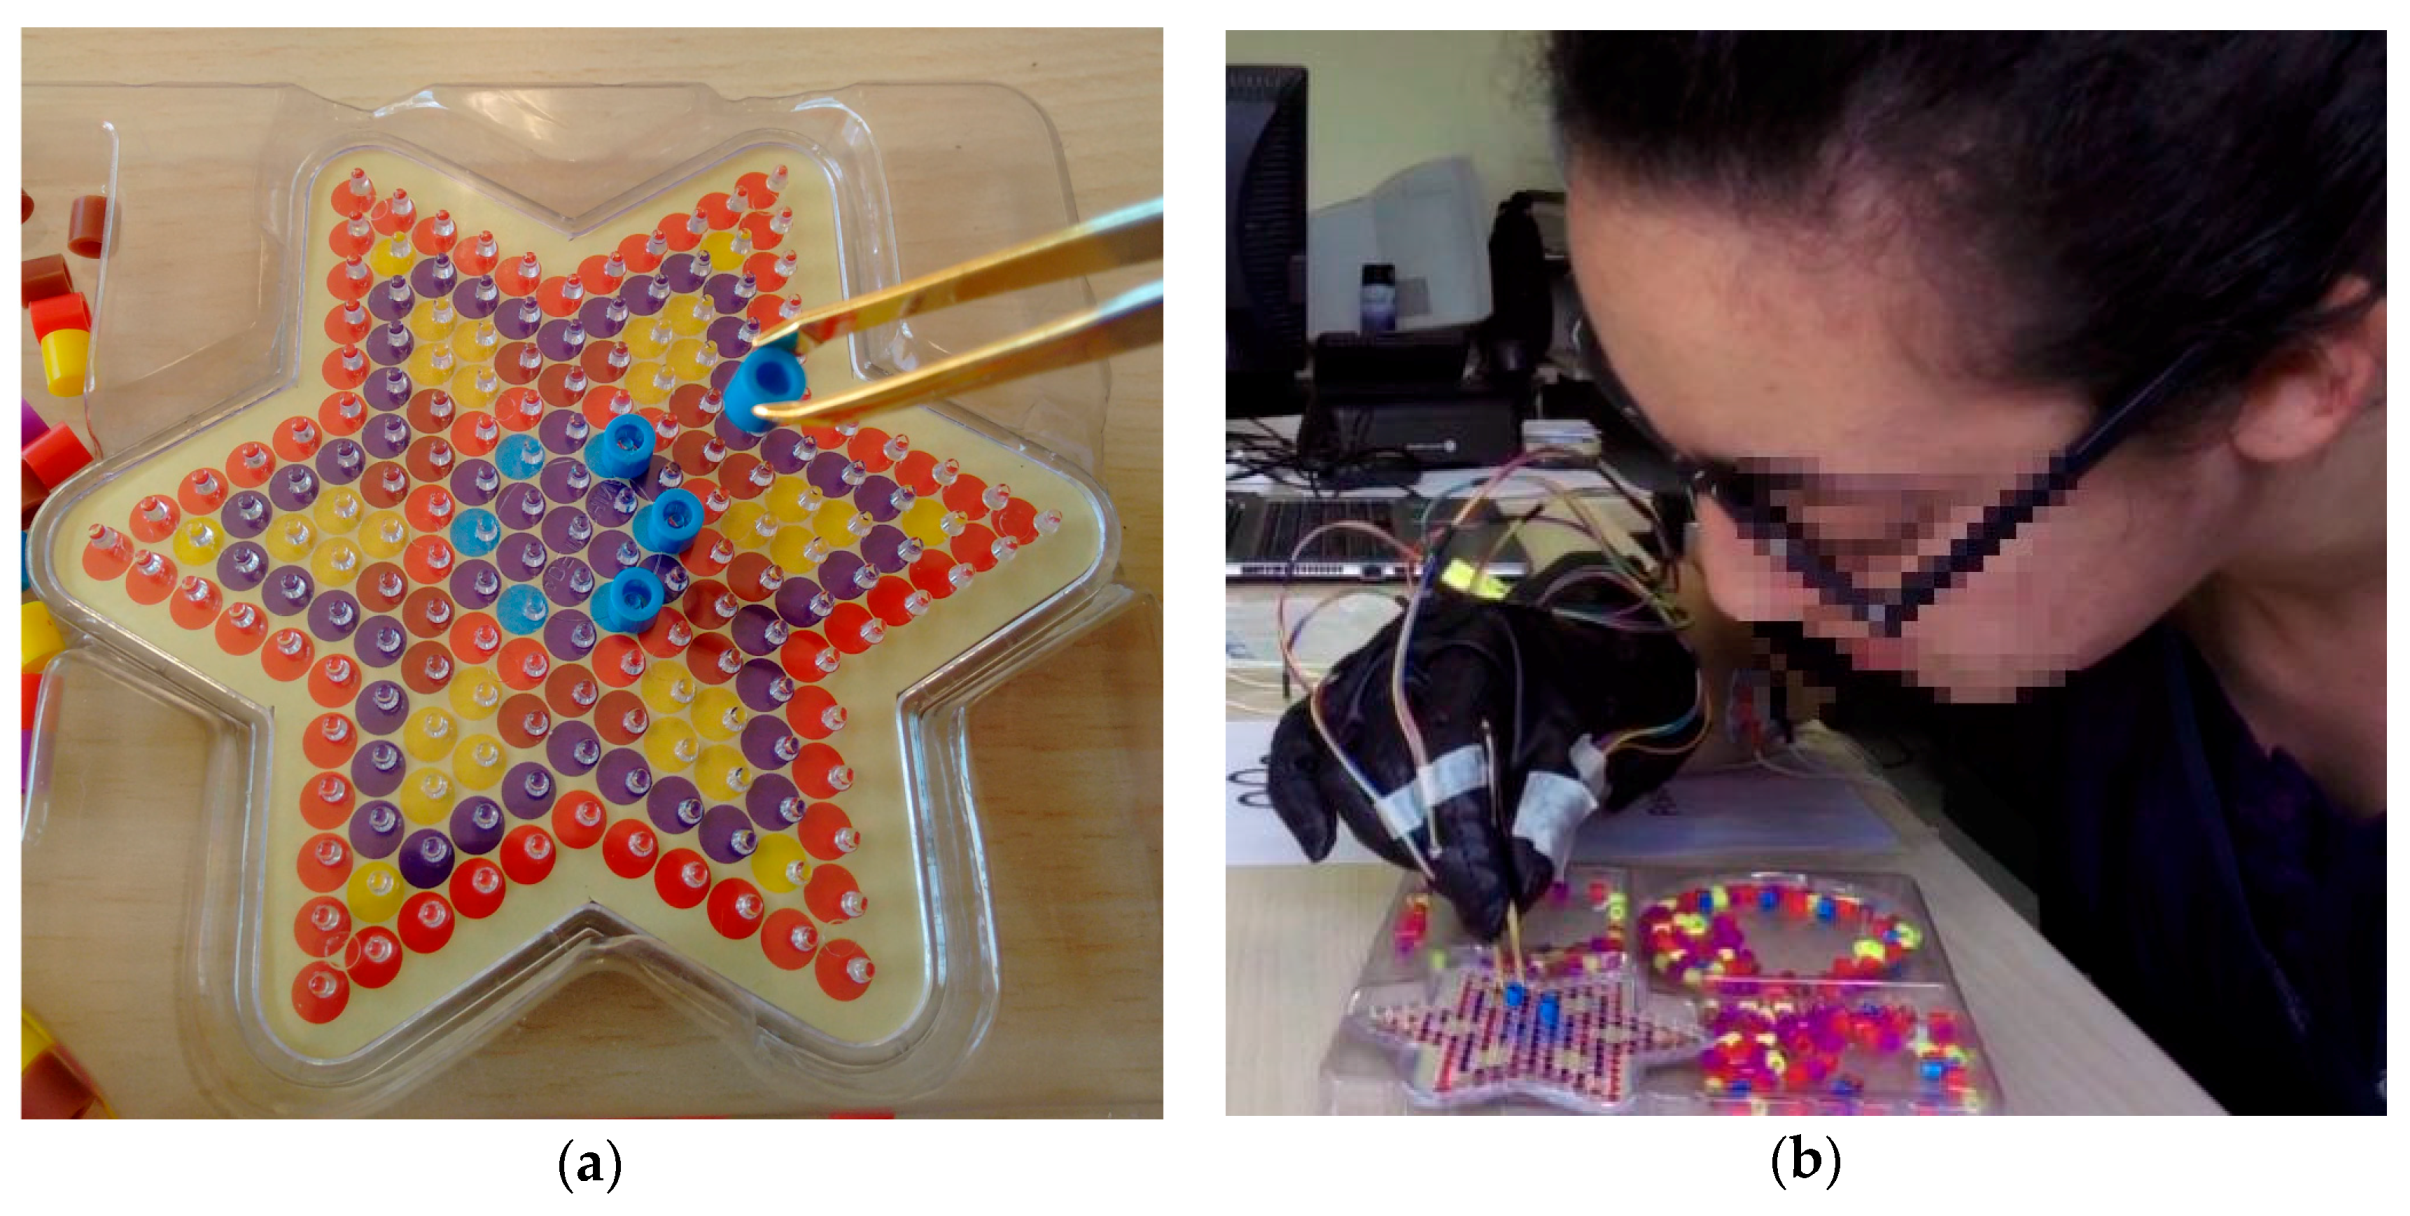
The third exercise of IGlove test: (a) Shows the PegBoard, tweezers holding a plastic bushing (PB) and a portion of PBs deposits on the far right of the image. The PegBoard features many pegs, but subjects only need to put six blue PBs on blue pins and one red PB on each peak of the star; (b) A picture of one of the volunteers while running the third exercise (she is just placing a blue PB on a blue peg).
Figure 4.
The third exercise of IGlove test: (a) Shows the PegBoard, tweezers holding a plastic bushing (PB) and a portion of PBs deposits on the far right of the image. The PegBoard features many pegs, but subjects only need to put six blue PBs on blue pins and one red PB on each peak of the star; (b) A picture of one of the volunteers while running the third exercise (she is just placing a blue PB on a blue peg).
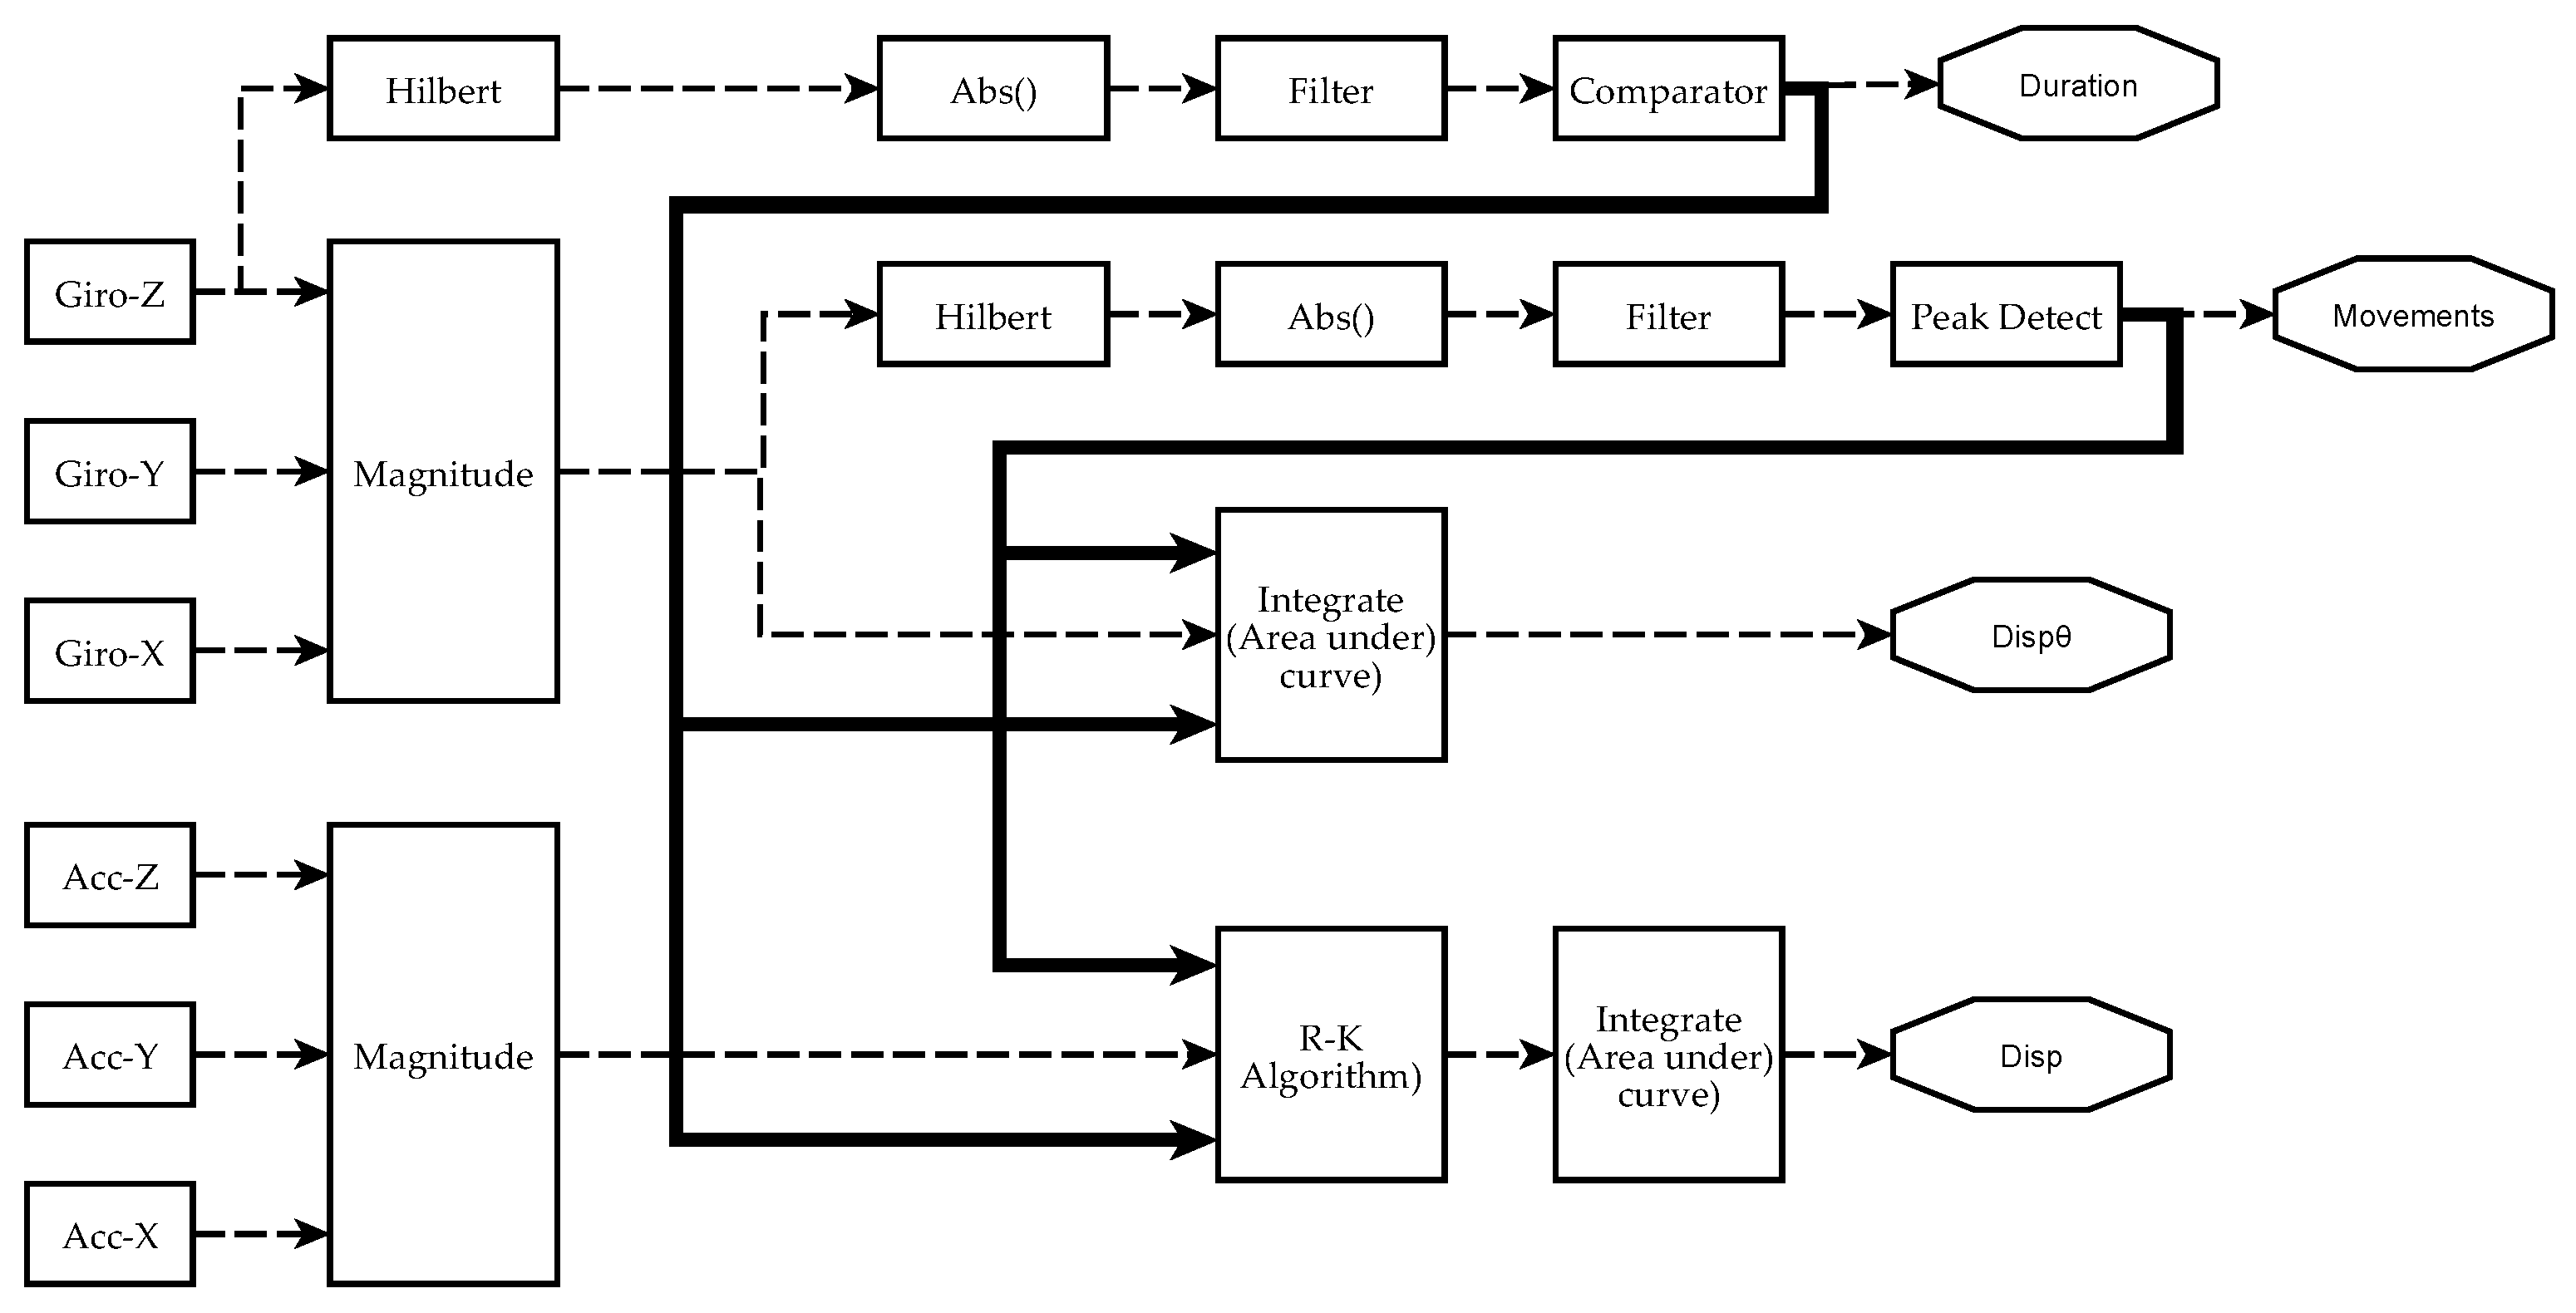
Figure 5.
Scheme of signal processing and information analysis to obtain manual dexterity metrics on each sensor. Currently, four metrics have been achieved from IGlove’s raw signals: Duration of exercises (Duration), the number of movements during each exercise (Movements), spatial displacement (Disp), and angular displacement (). The absolute value of the Hilbert transform of a gyroscope signal is filtered to obtain a smoothened signal that is higher than 0 when the hand moves. A comparator decides when the level and duration of a perturbation in the signal were enough to mark it as an exercise. The metric Duration of an exercise is the difference between the end and the beginning of a significant perturbation. Variable Movements is calculated from the magnitude of angular speed (computed from all gyroscopes using Equation (1)). It was observed that peaks on indicate when a movement was performed. To estimate the number of moves, is smoothened, but this time, a peak detector identifies the spikes in the signal that were large enough and have been caused by a valid hand movement. The area under was calculated using numerical integration to estimate . Spatial kinematic parameters were estimated from accelerometers signal (calculated using Equation (3)), Runge–Kutta method was used to obtain an approximate time series for the magnitude of velocity . Finally, spatial displacement is calculated as the area under the curve of . When performing numerical integration, Duration and Movements parameters were used to establish integration limits and estimate initial conditions.
![Sensors 17 00988 g005]()
Figure 6.
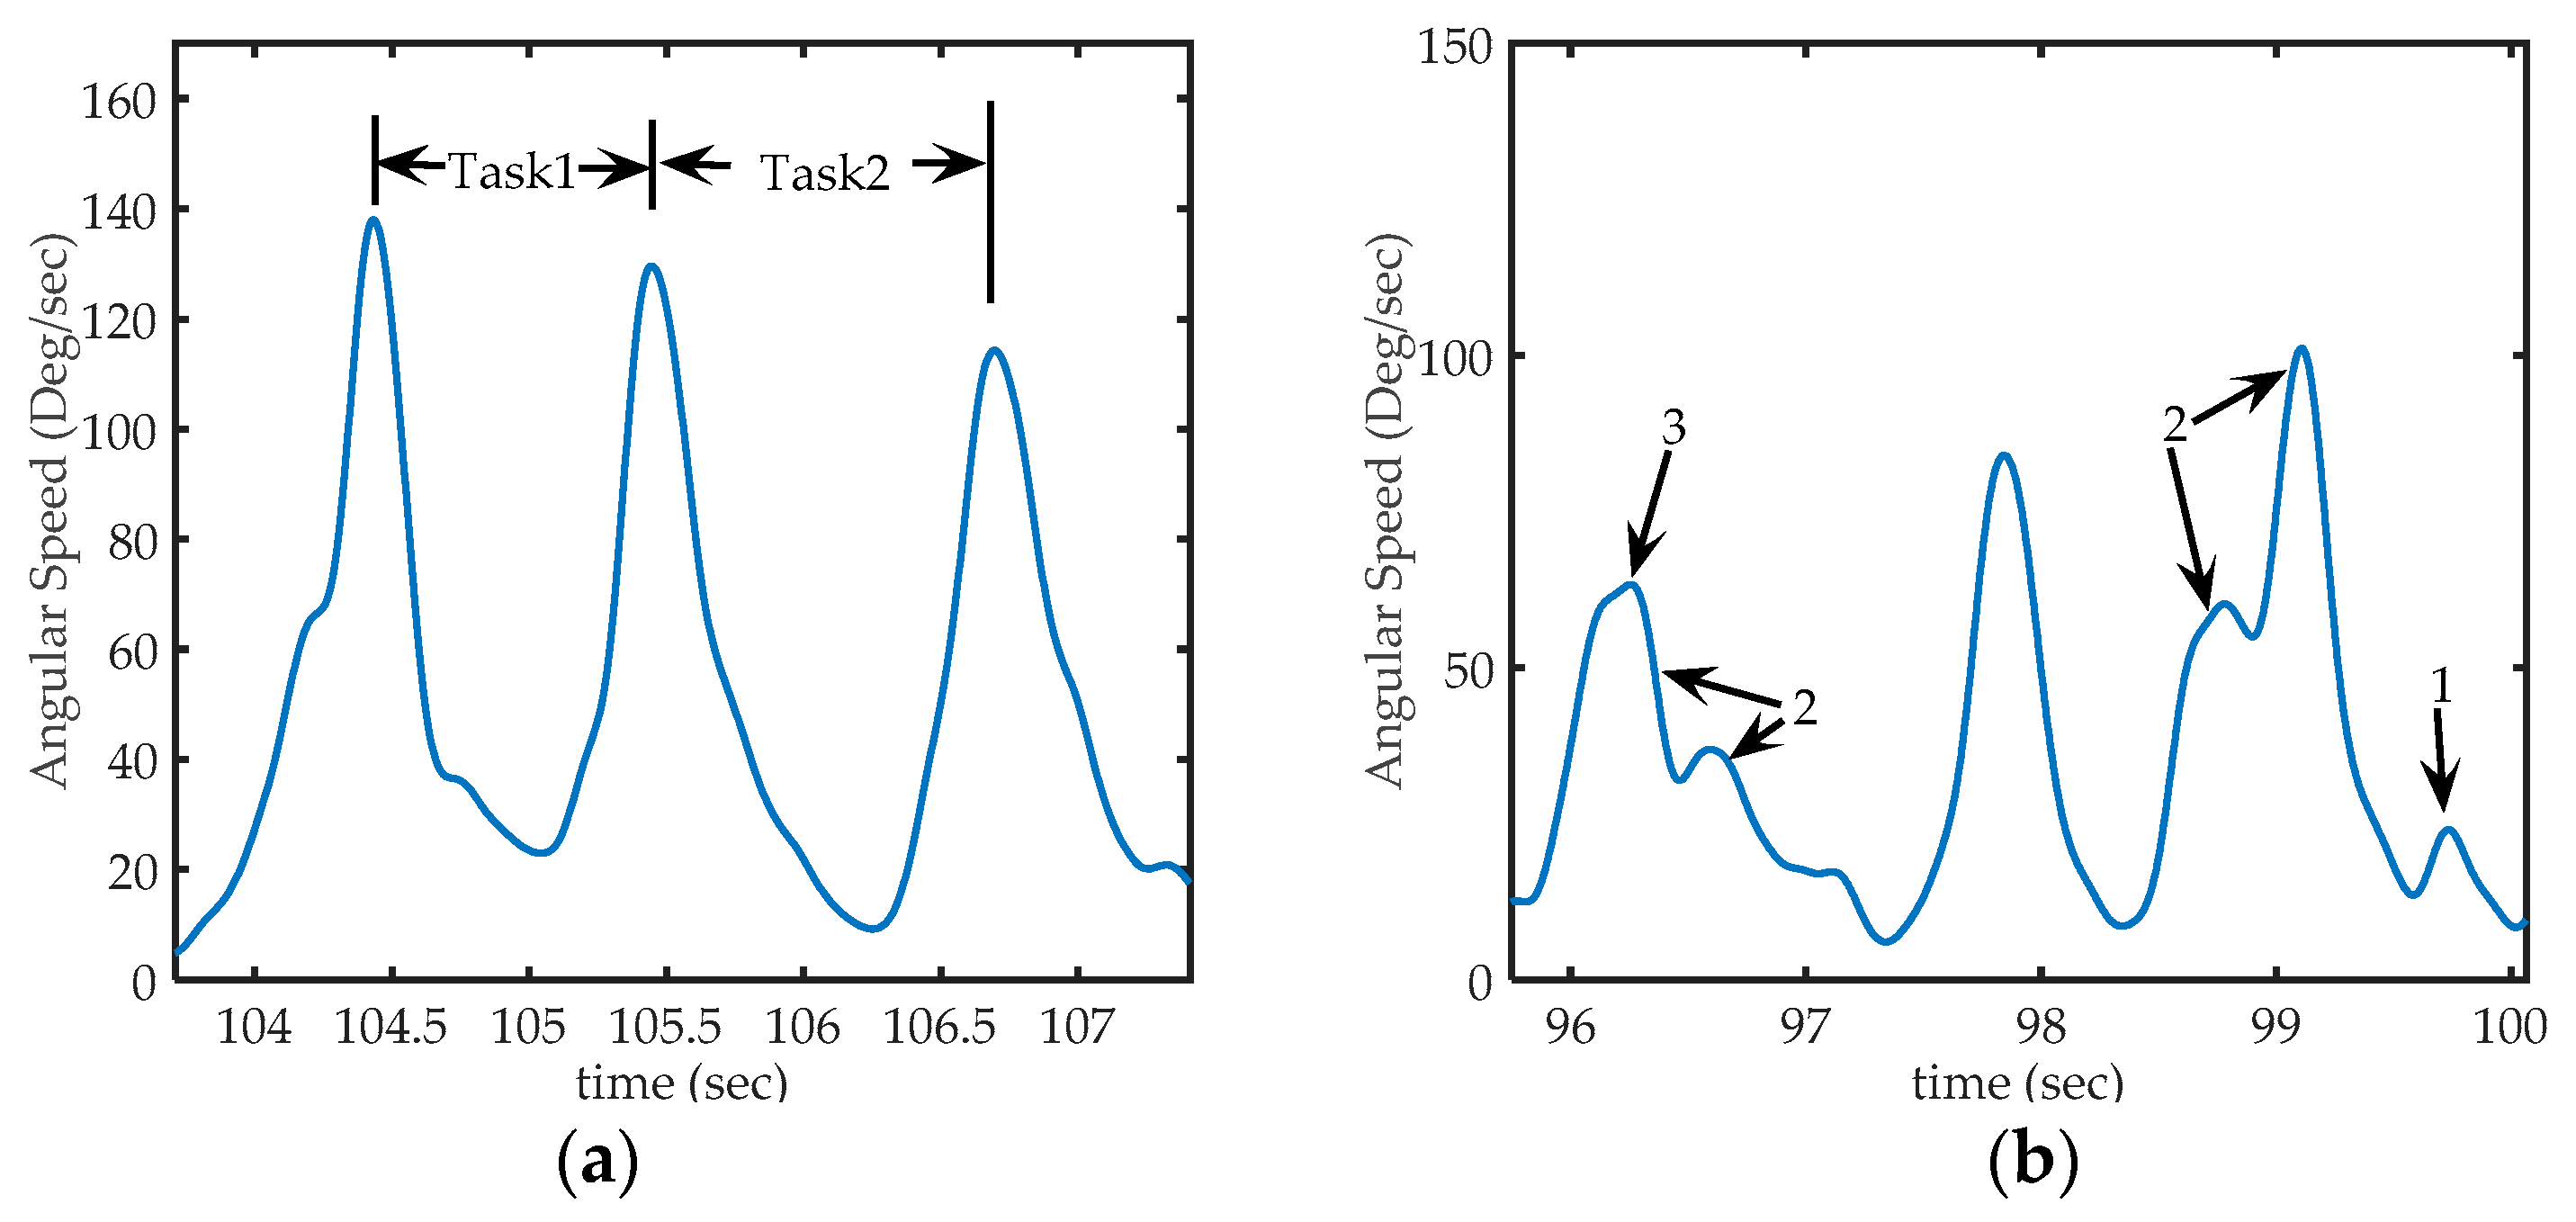
Sections of acquired from sensor 1 (in the back of the hand), (a) Representation of peaks on signal on third exercise: The first peak corresponds to the time where a PB is collected from deposit, the second peak, corresponding to the instant at which the PB is placed in the corresponding peg and, the third peak corresponds to the action of taking the next PB. Task1 occurred between the first and second peak, and Task2 occurred between the second and third peak; (b) Some particular cases of peaks that can be found in the signal. Arrow 1: shows a peak too small to be considered a voluntary movement (to be discarded), Arrows 2: shows sets of nearby peaks that represent single movements, and arrow 3, shows a much smaller peak, but not small enough to be eliminated (it represents a hand movement).
Figure 6.
Sections of acquired from sensor 1 (in the back of the hand), (a) Representation of peaks on signal on third exercise: The first peak corresponds to the time where a PB is collected from deposit, the second peak, corresponding to the instant at which the PB is placed in the corresponding peg and, the third peak corresponds to the action of taking the next PB. Task1 occurred between the first and second peak, and Task2 occurred between the second and third peak; (b) Some particular cases of peaks that can be found in the signal. Arrow 1: shows a peak too small to be considered a voluntary movement (to be discarded), Arrows 2: shows sets of nearby peaks that represent single movements, and arrow 3, shows a much smaller peak, but not small enough to be eliminated (it represents a hand movement).
Figure 7.
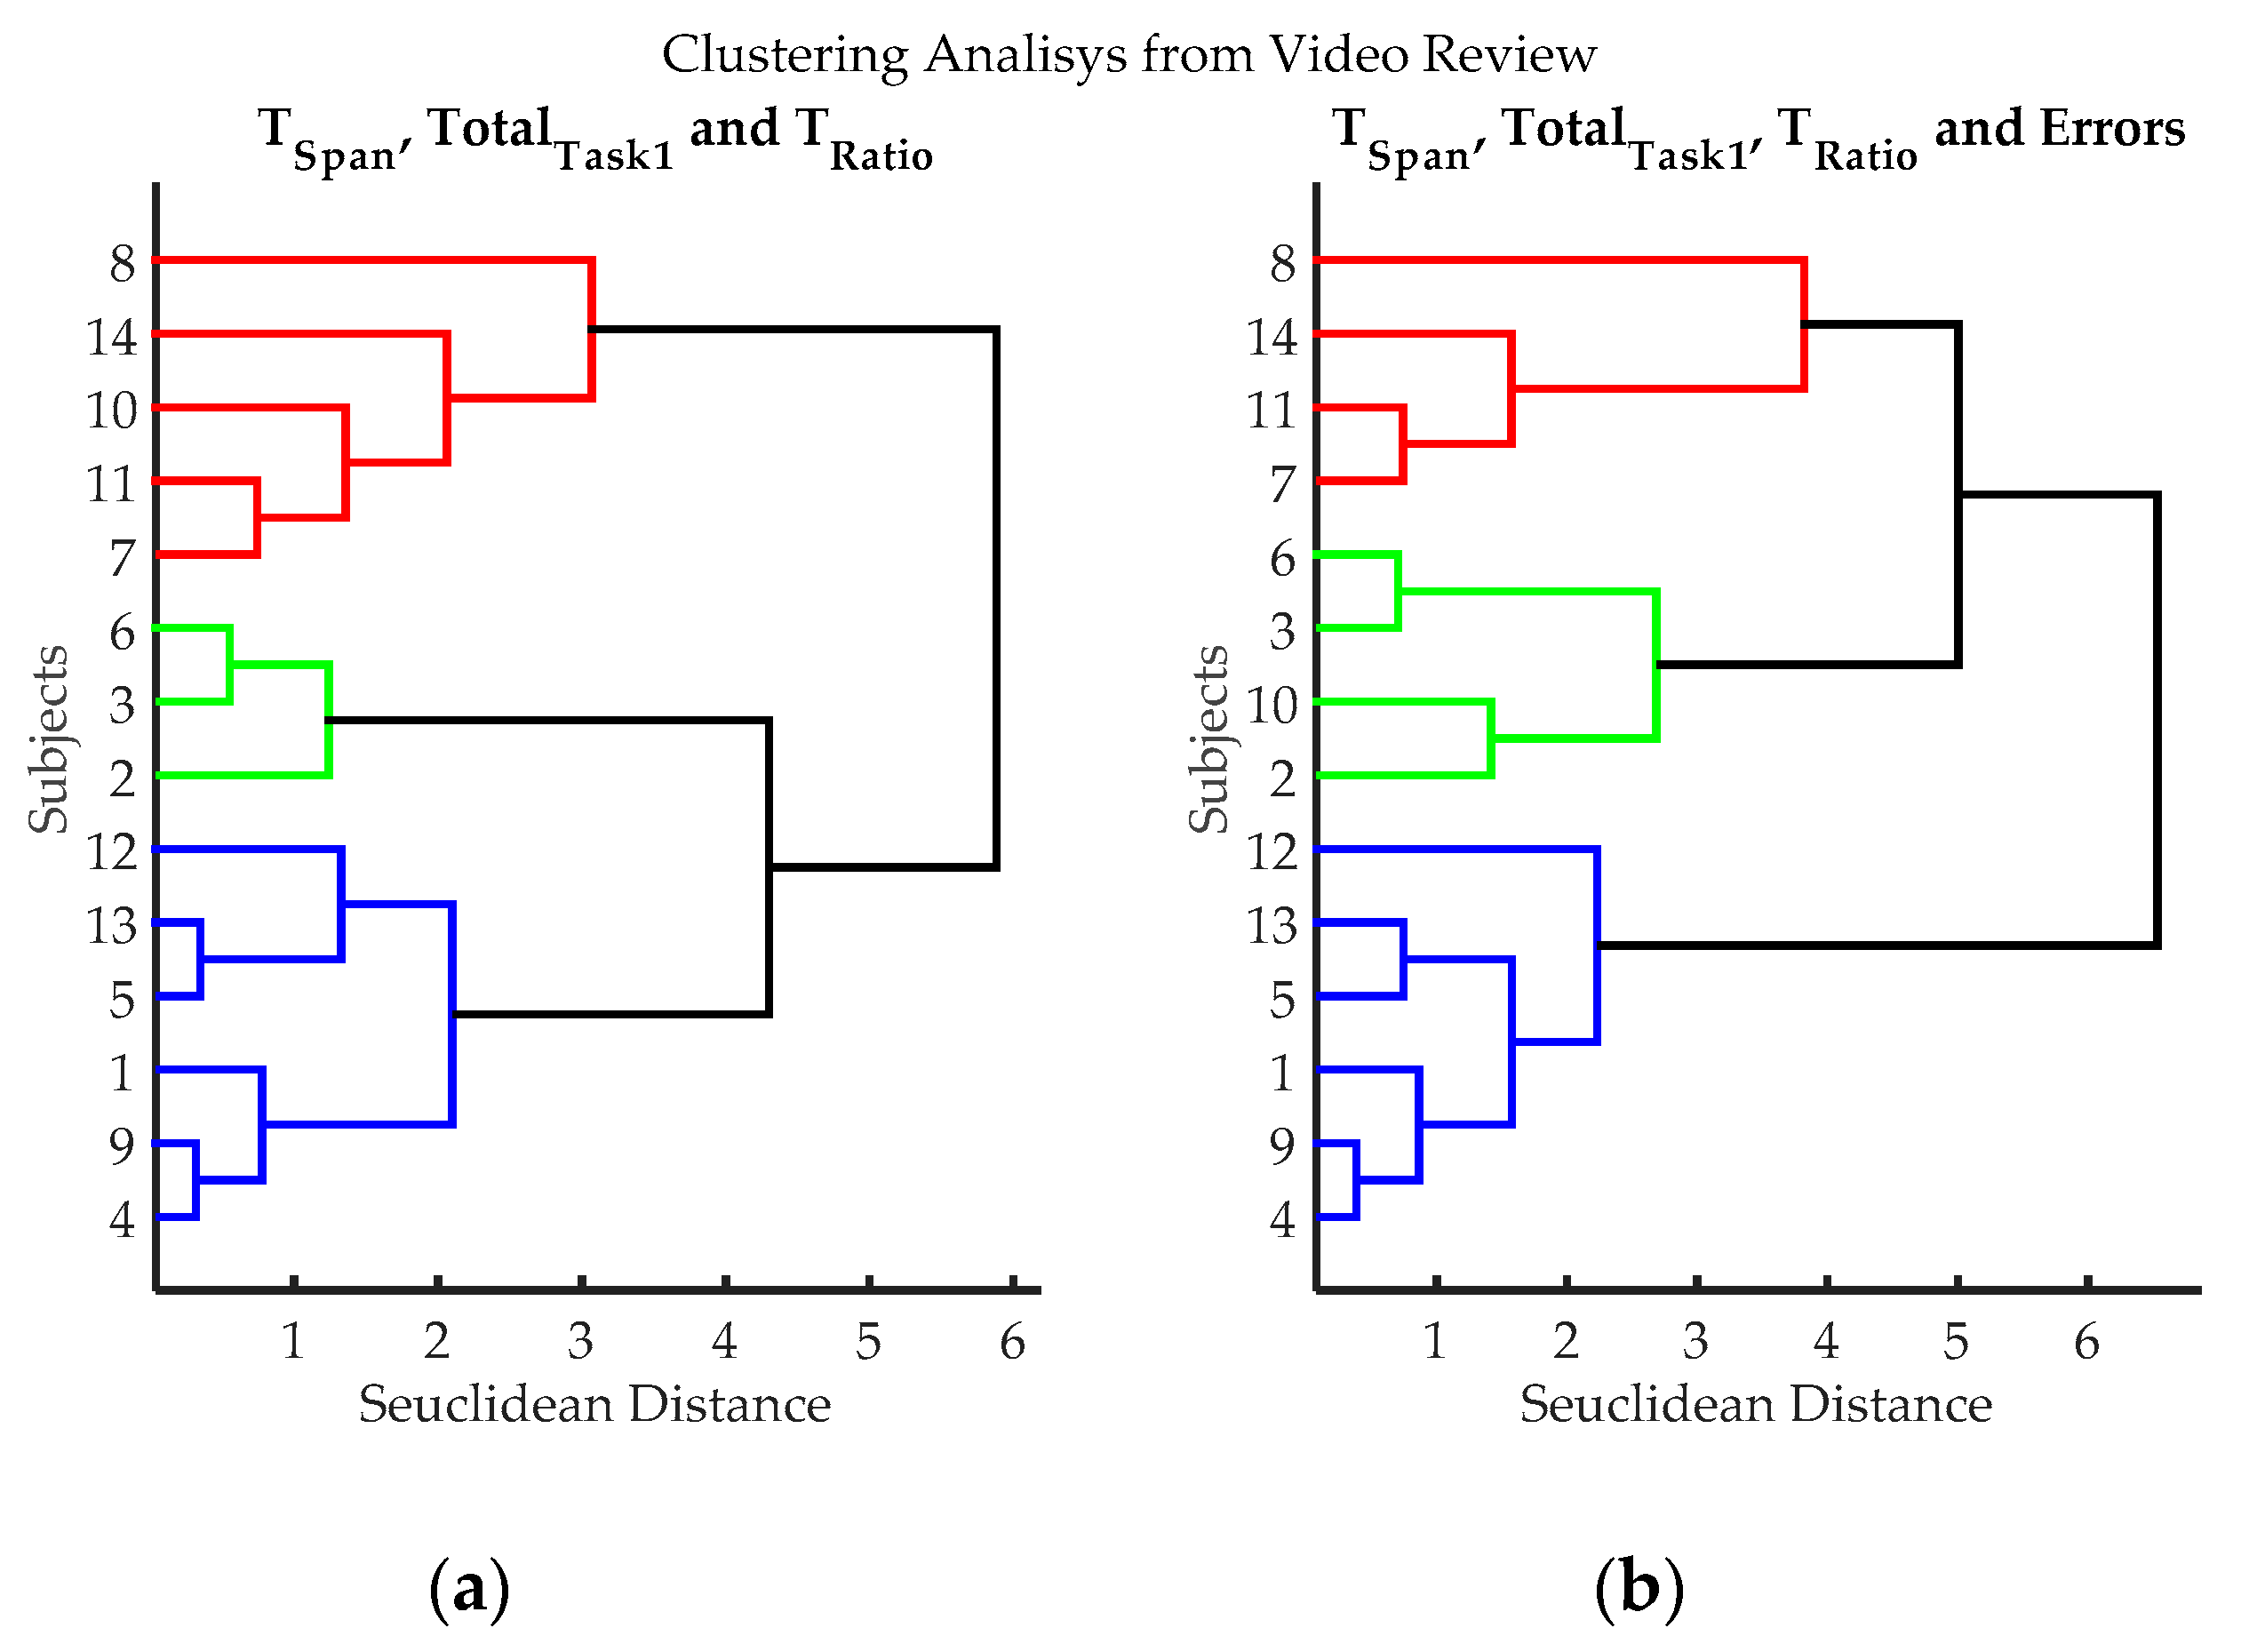
Clustering results according to the variables evaluated from video records of volunteers while executing exercise 3. (a) Clustering classification using variables: TSpan, TotalTask1, and TRatio. Errors were not utilized in this classification process, to evaluate if it introduces subjective bias (Estimating the number of errors is dependent on the judgment of the evaluator); (b) Hierarchical classification using variables: variables TSpan, TotalTask1, TRatio, and Errors. Three groups can be clearly differentiated, blue (volunteers 1, 4, 5, 9, 12 and 13), red (volunteers 7, 8, 11 and 14) and green (volunteers 2, 3, 6 and 10); volunteer 10 can be considered either green or red.
Figure 7.
Clustering results according to the variables evaluated from video records of volunteers while executing exercise 3. (a) Clustering classification using variables: TSpan, TotalTask1, and TRatio. Errors were not utilized in this classification process, to evaluate if it introduces subjective bias (Estimating the number of errors is dependent on the judgment of the evaluator); (b) Hierarchical classification using variables: variables TSpan, TotalTask1, TRatio, and Errors. Three groups can be clearly differentiated, blue (volunteers 1, 4, 5, 9, 12 and 13), red (volunteers 7, 8, 11 and 14) and green (volunteers 2, 3, 6 and 10); volunteer 10 can be considered either green or red.
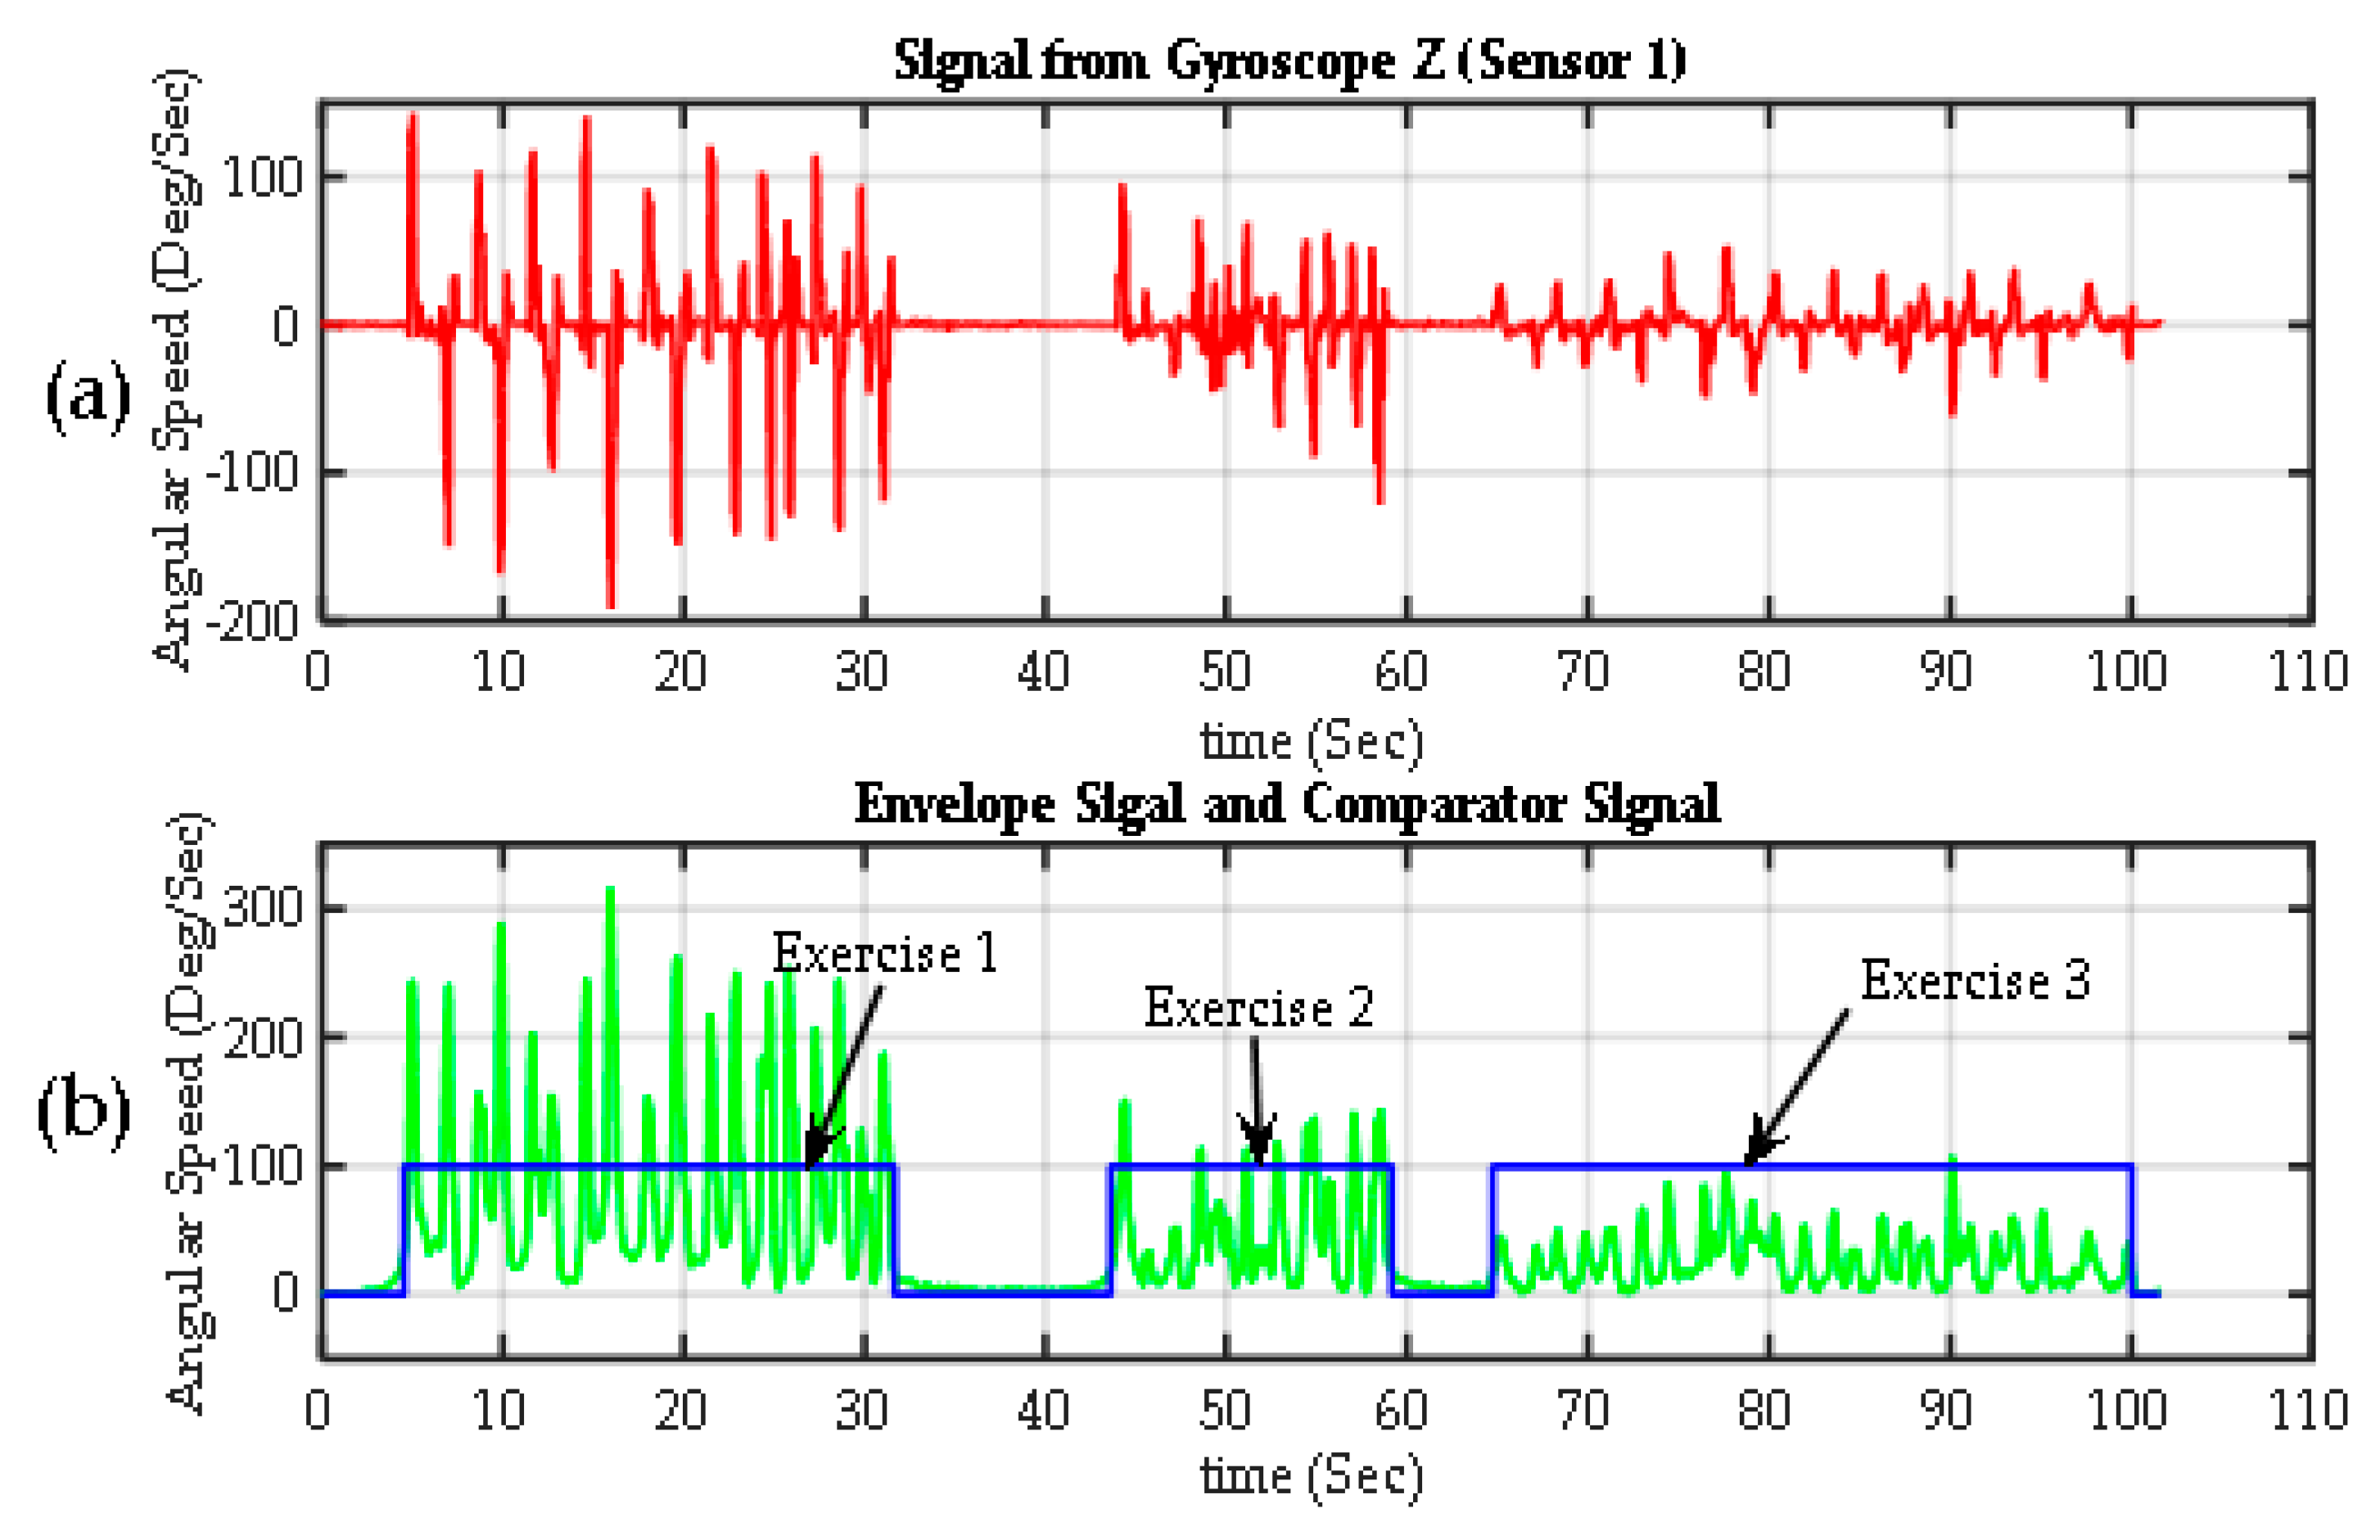
Figure 8.
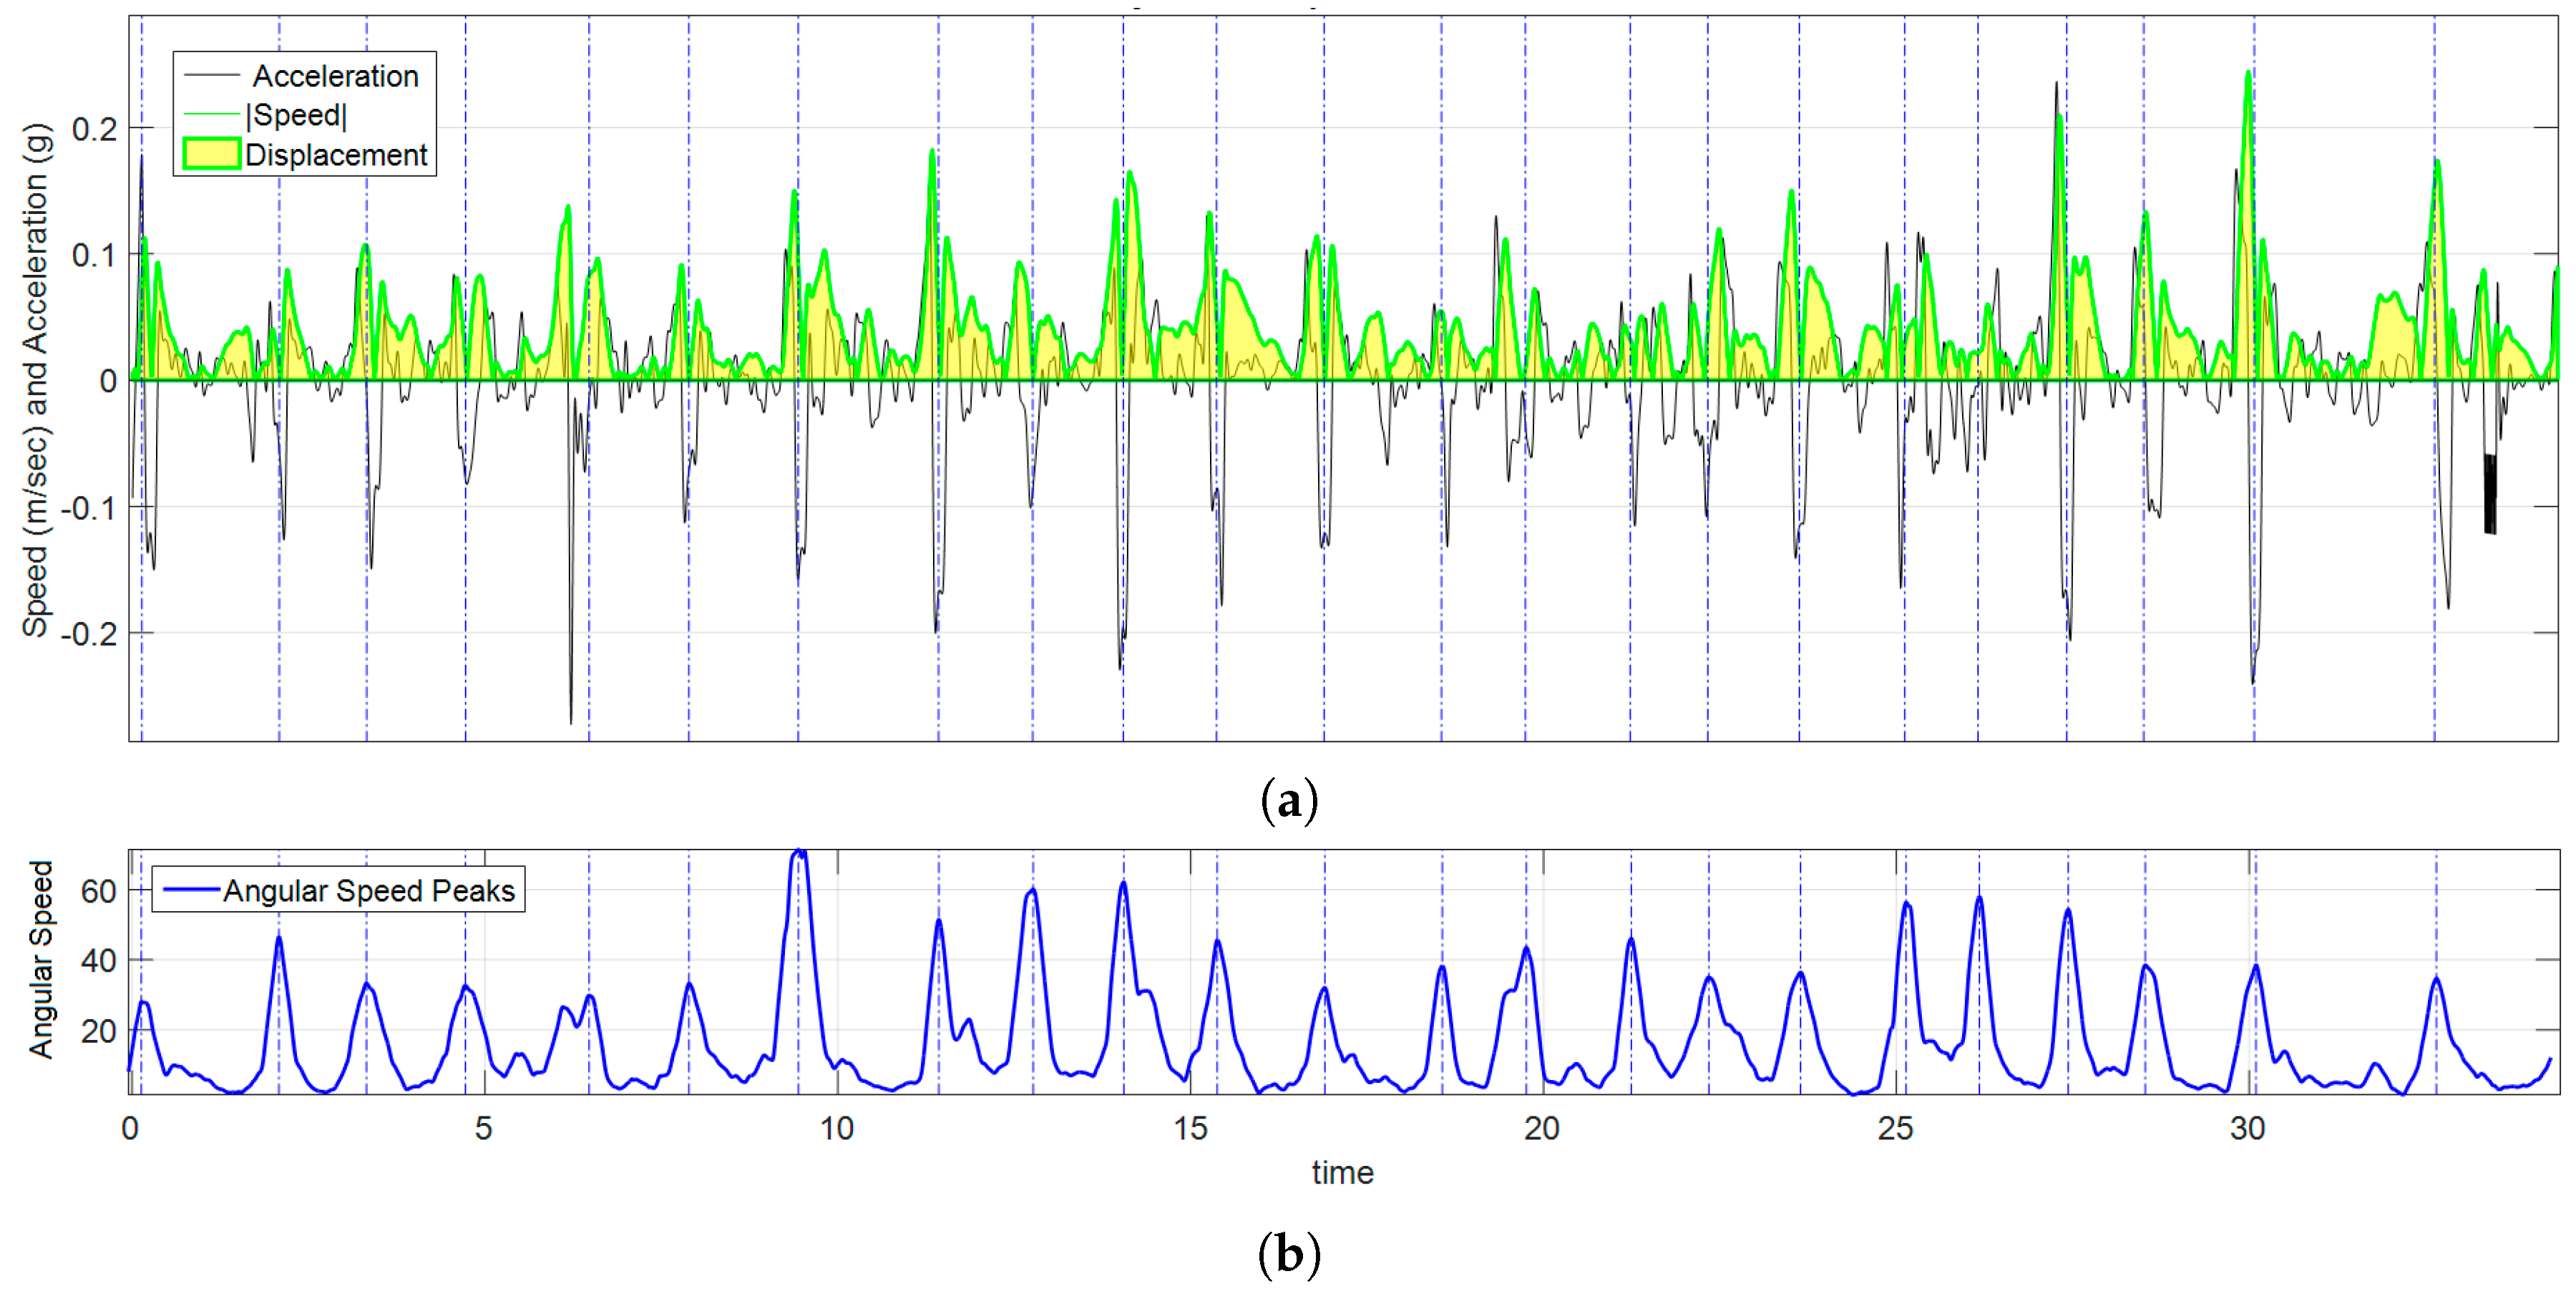
Segmentation of exercises. (a) Raw signal from one Z-axis gyroscope from Sensor 1 on the back of the hand (); (b) the envelope of the previous signal calculated using the transform Gilbert (green). The exercise detection signal (in blue), which is basically the output of a comparator, with values of 100% when > threshold (exercise is detected) and 0% when < threshold (rest periods).
Figure 8.
Segmentation of exercises. (a) Raw signal from one Z-axis gyroscope from Sensor 1 on the back of the hand (); (b) the envelope of the previous signal calculated using the transform Gilbert (green). The exercise detection signal (in blue), which is basically the output of a comparator, with values of 100% when > threshold (exercise is detected) and 0% when < threshold (rest periods).
Figure 9.
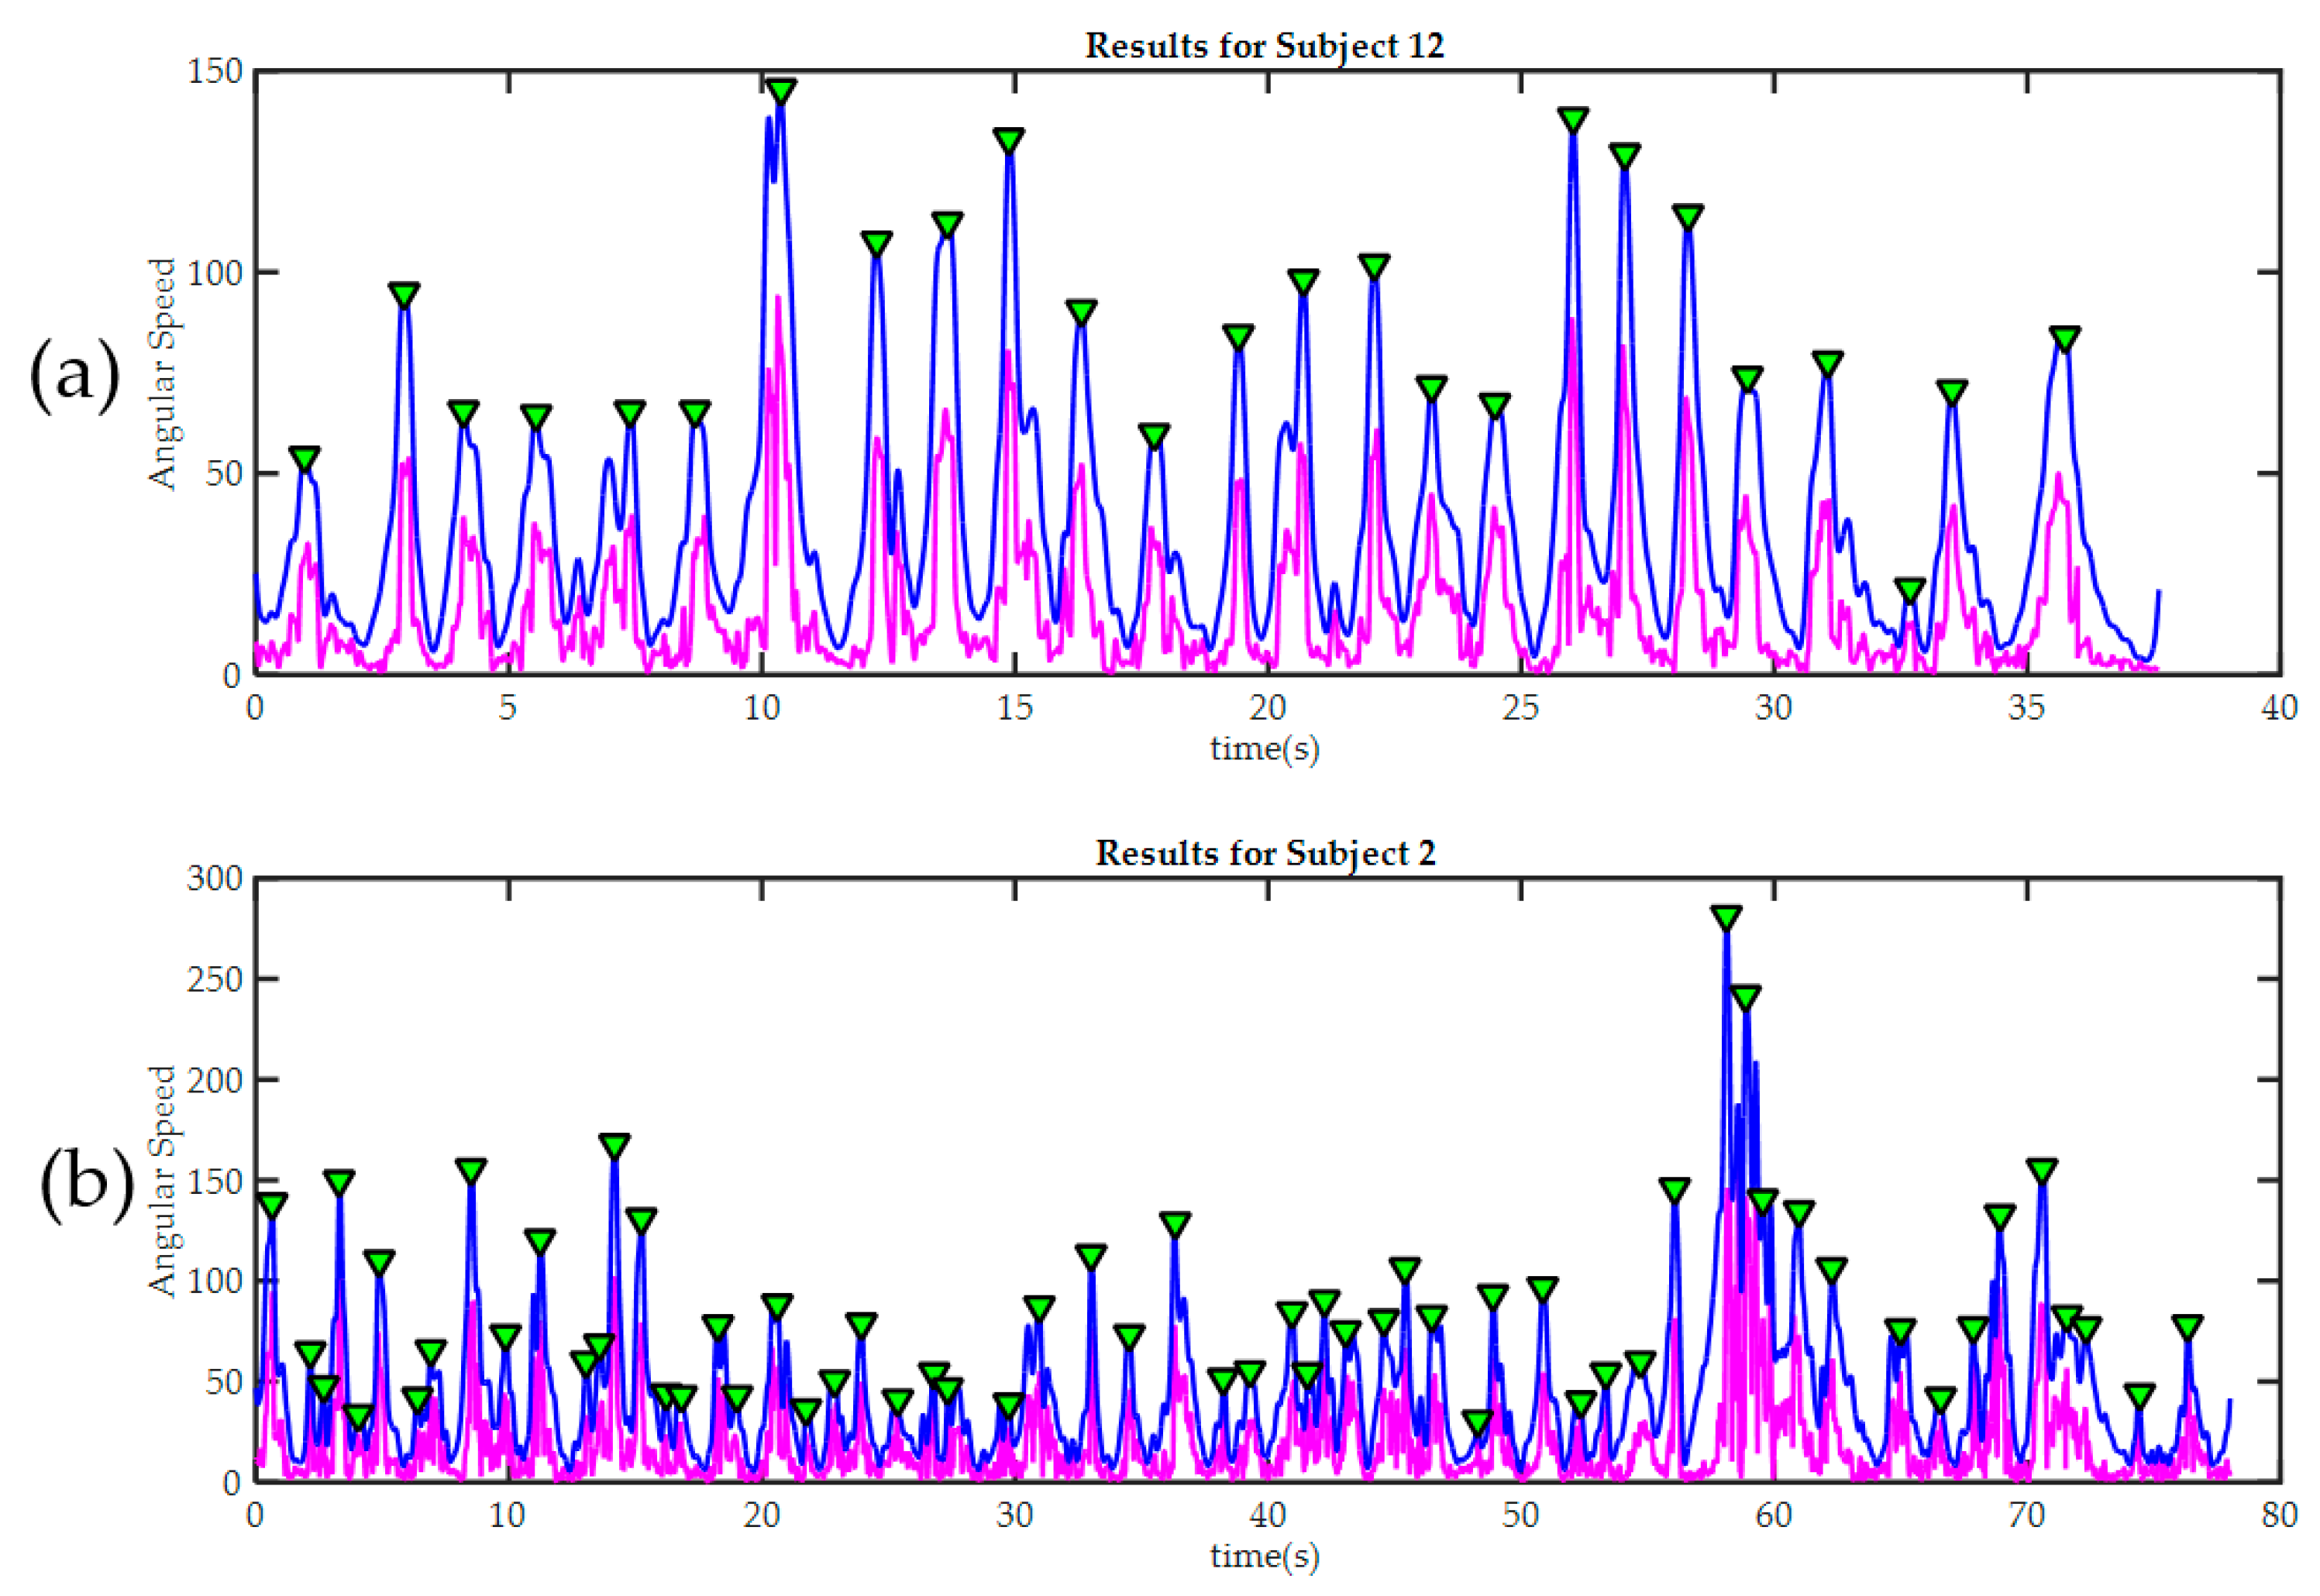
Peak detection results in two trainees during the third exercise. In both cases, the raw signal of magnitude of angular velocity is painted in magenta. The signal after being “smoothed” is painted blue. Detected peaks are marked with green triangles. (a) Subject 12, required only 25 movements to finish the third exercise. It can be seen how the good level of manual dexterity is also reflected in the in the smoothness of the signal acquired by the sensors in the glove; By contrast, subject 2 (b) made many more moves during the exercise; this was because he made several mistakes and then had to correct them. The significant differences in movement amplitude may indicate poor motor control.
Figure 9.
Peak detection results in two trainees during the third exercise. In both cases, the raw signal of magnitude of angular velocity is painted in magenta. The signal after being “smoothed” is painted blue. Detected peaks are marked with green triangles. (a) Subject 12, required only 25 movements to finish the third exercise. It can be seen how the good level of manual dexterity is also reflected in the in the smoothness of the signal acquired by the sensors in the glove; By contrast, subject 2 (b) made many more moves during the exercise; this was because he made several mistakes and then had to correct them. The significant differences in movement amplitude may indicate poor motor control.
Figure 10.
Graph of kinematic spatial parameters for volunteer 12 while playing exercise 3. (a) Black signal is the magnitude of the acceleration, the absolute value of velocity is drawn in green, and the area under the curve (in clear yellow) is ; (b) corresponds to the peak detection of , each pair of peaks were used to set the appropriate time interval for numerical calculations.
Figure 11.
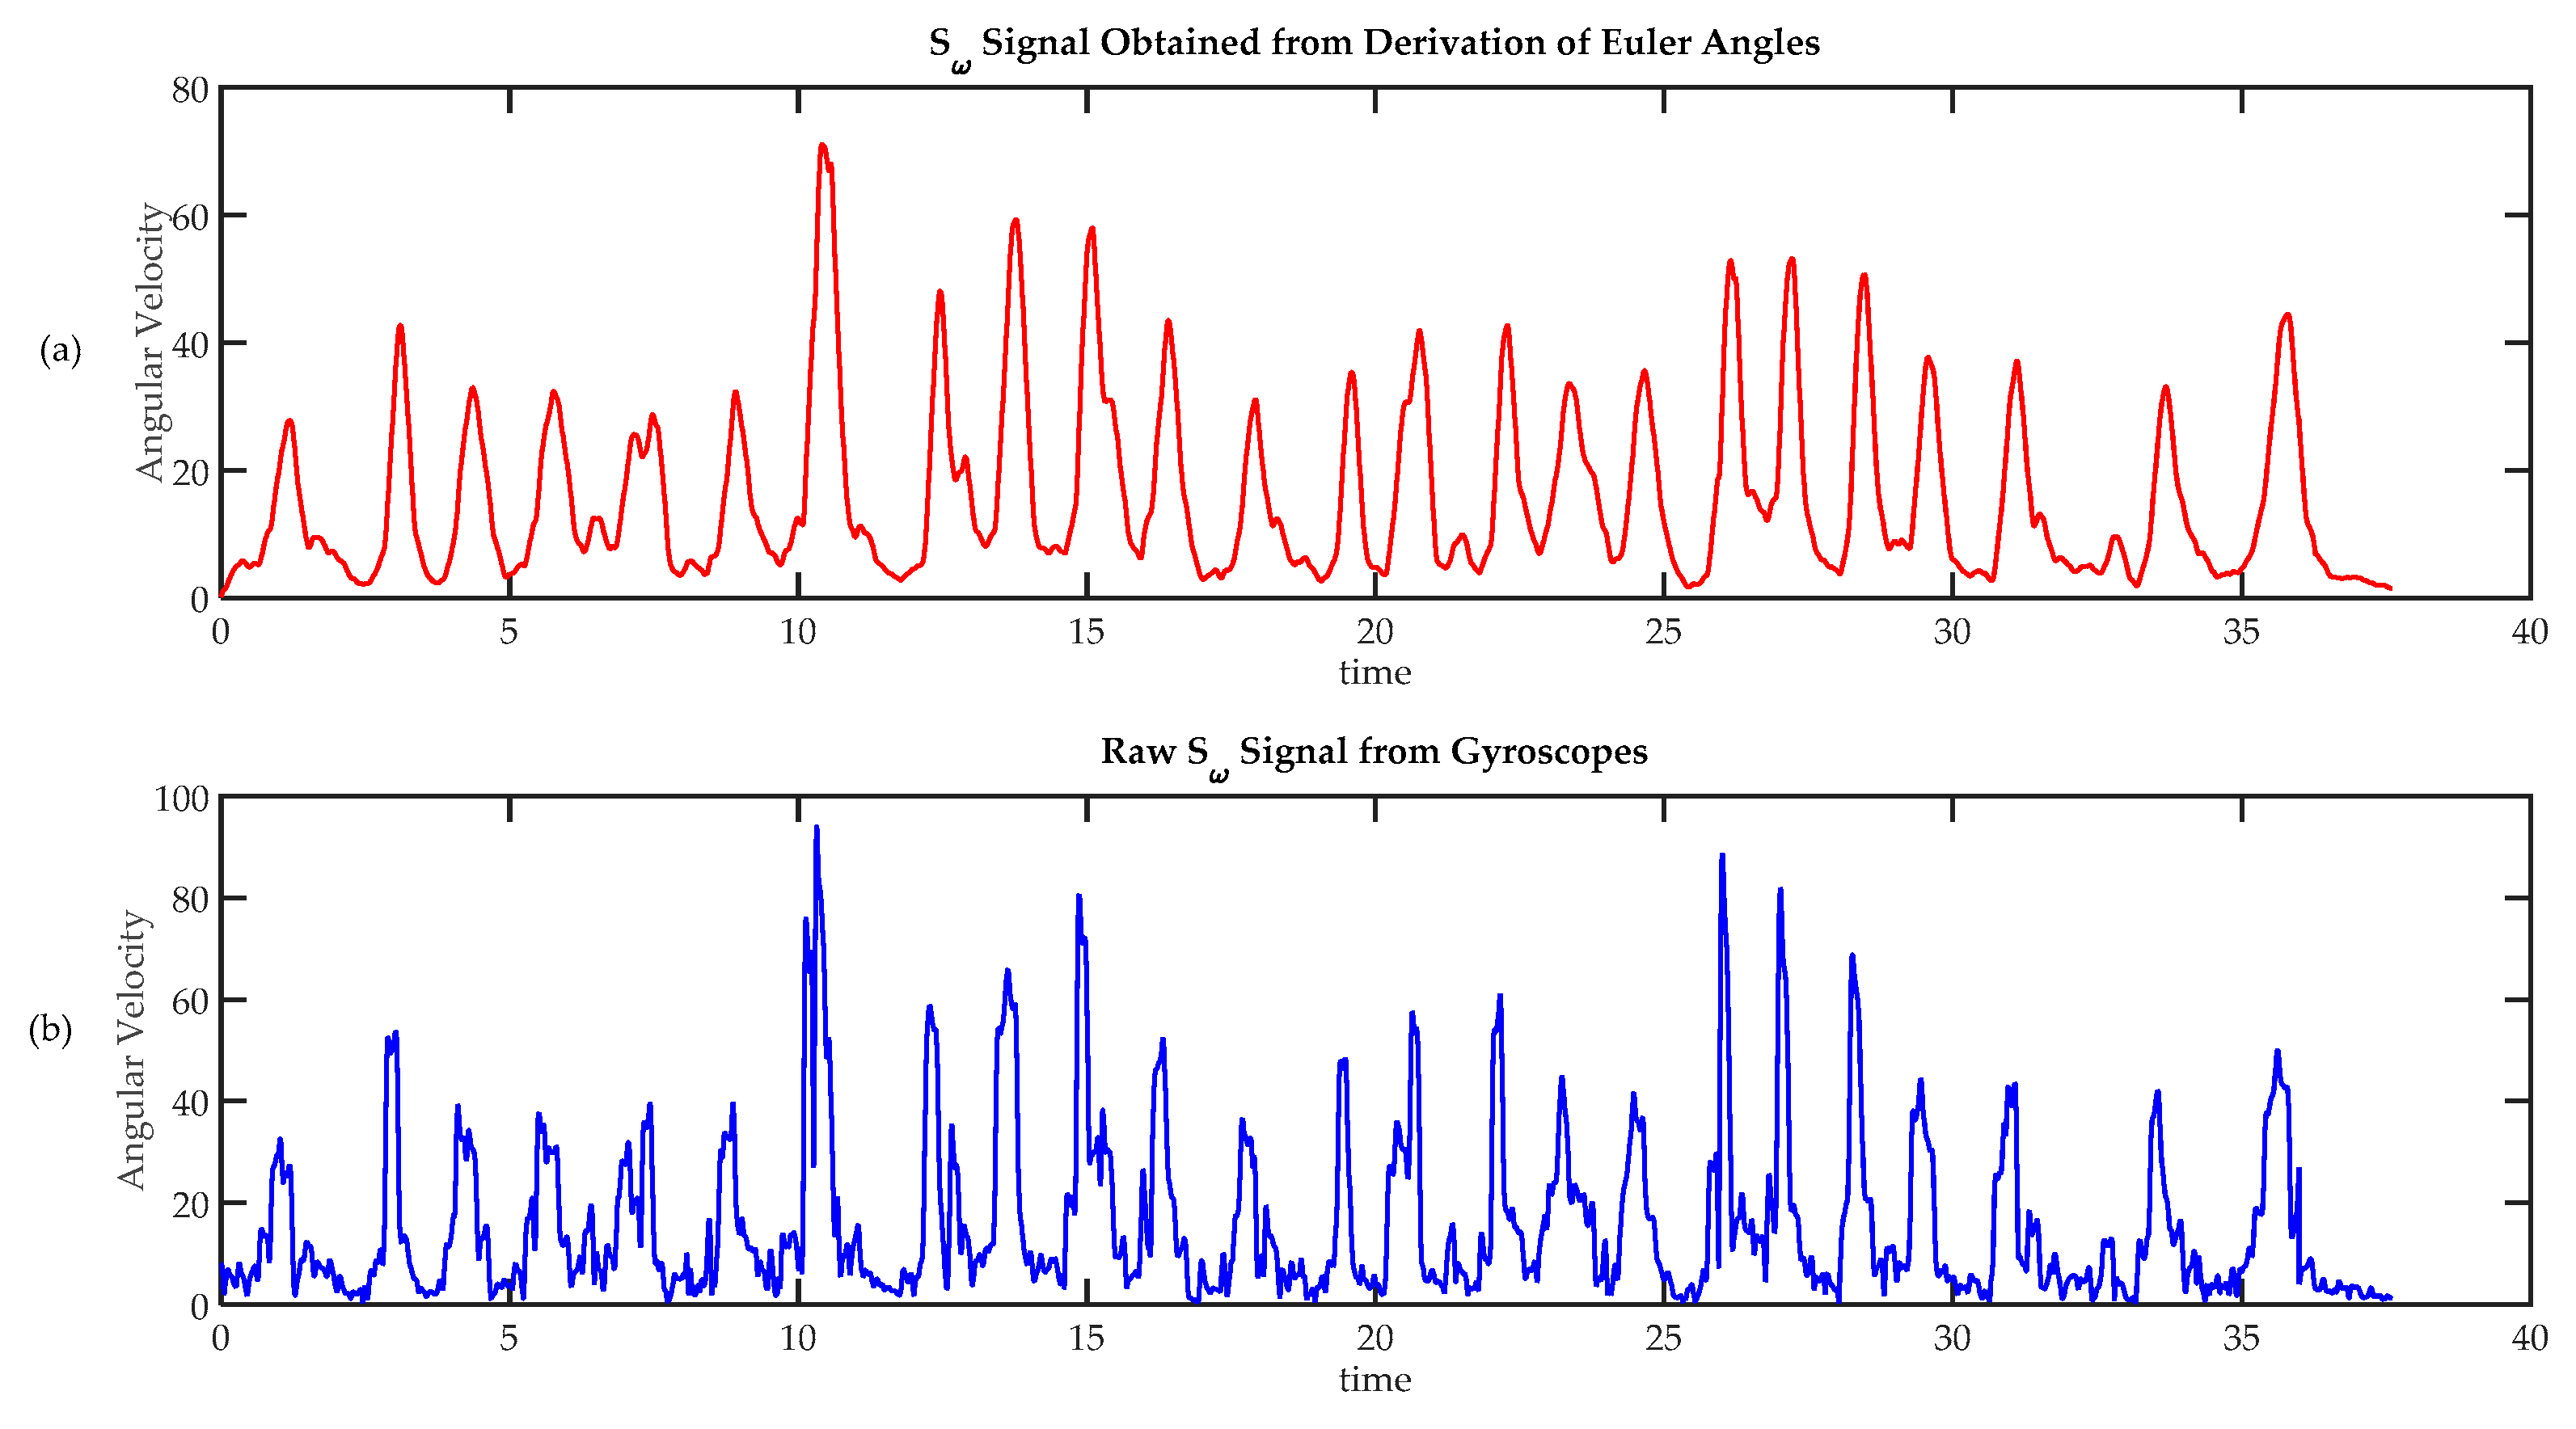
Comparison of techniques to calculate angular speed. (a) Angular velocity calculated from absolute orientation angles , and , obtained using a sensor fusion algorithm; (b) Angular speed calculated from raw gyroscope data.
Figure 11.
Comparison of techniques to calculate angular speed. (a) Angular velocity calculated from absolute orientation angles , and , obtained using a sensor fusion algorithm; (b) Angular speed calculated from raw gyroscope data.
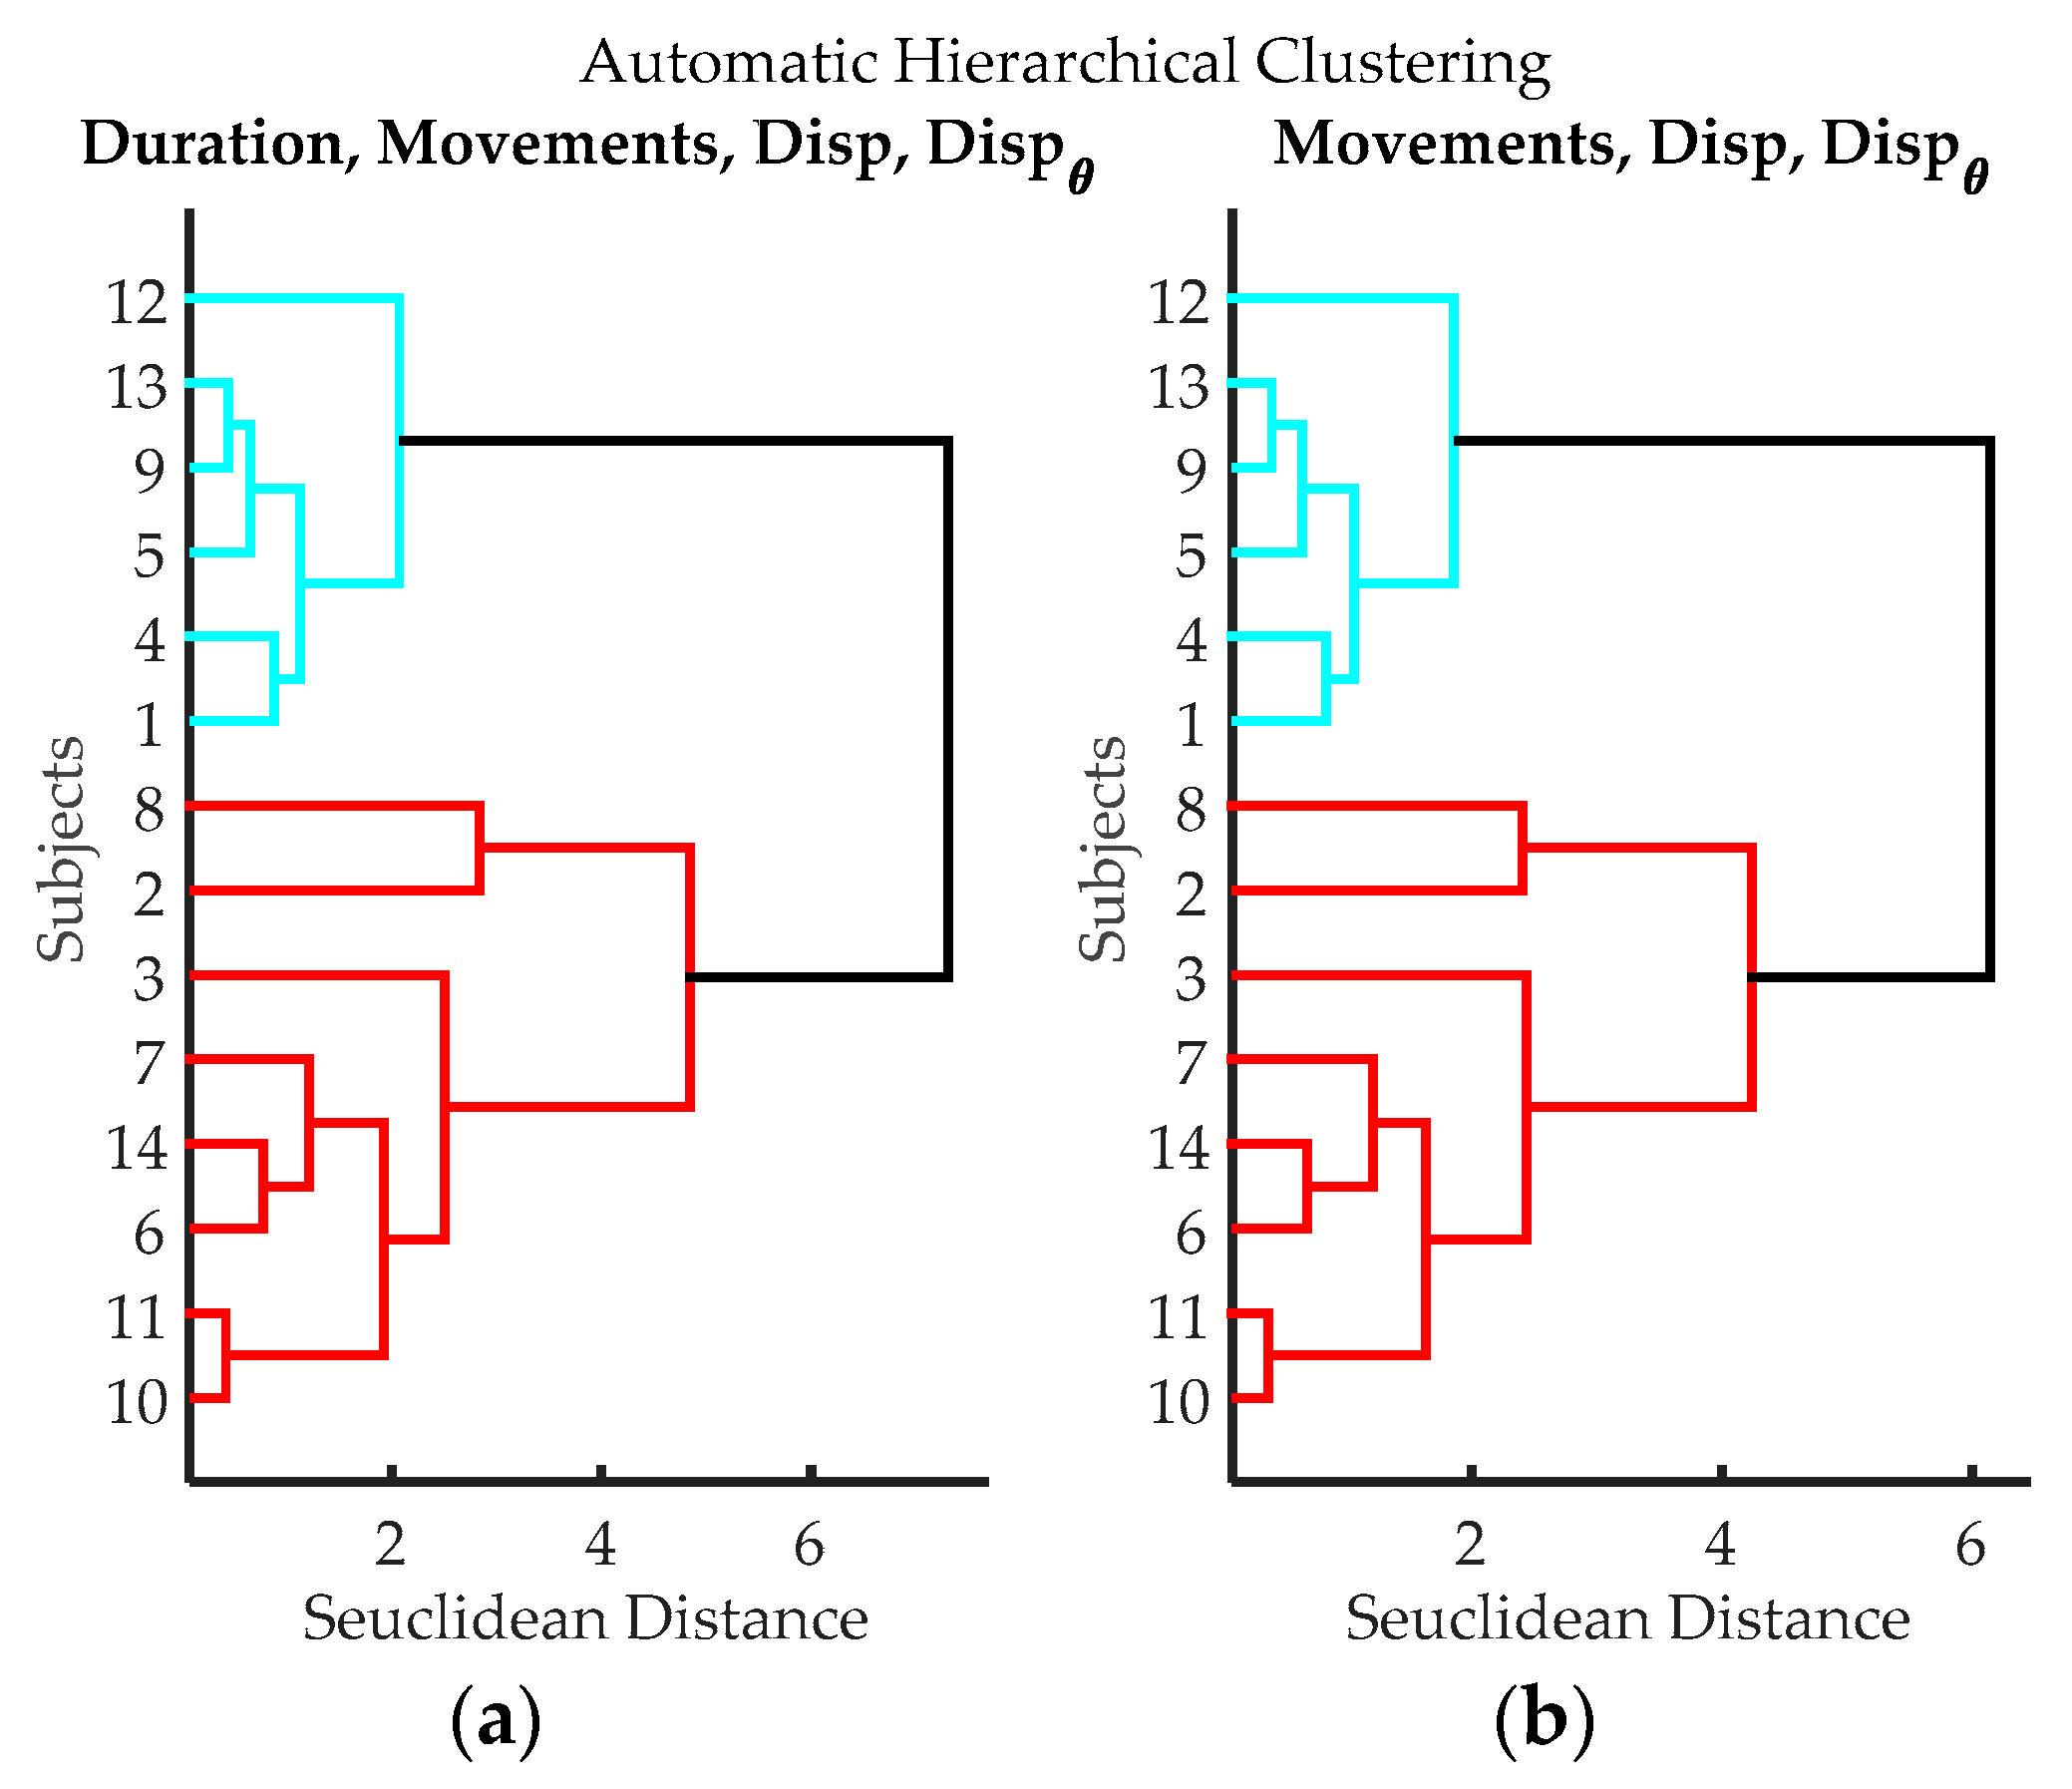
Figure 12.
Dendrograms from cluster analysis of volunteers according to variables from data processing of IGlove data. (a) Clustering using Time of Exercise, Peaks quantity, spatial displacement and angular displacement; (b) Clustering using Peaks quantity, spatial displacement, and angular displacement.
Table 1.
Results for each of the volunteers obtained from the review of videos recorded during the third exercise. The Classification column shows resulting hierarchical classification from dendrograms shown in
Figure 7.
Table 1.
Results for each of the volunteers obtained from the review of videos recorded during the third exercise. The Classification column shows resulting hierarchical classification from dendrograms shown in
Figure 7.
| Volunteer | TSpan | TotalTask1 | TRatio | Errors |
|---|
| 1 | 42.2 | 24.9 | 1.69 | 2 |
| 2 | 77.7 | 33.7 | 2.31 | 10 |
| 3 | 60.7 | 33.4 | 1.82 | 4 |
| 4 | 48 | 27.1 | 1.77 | 4 |
| 5 | 48.4 | 21.7 | 2.23 | 3 |
| 6 | 61.2 | 30.9 | 1.98 | 6 |
| 7 | 65.1 | 22.3 | 2.91 | 9 |
| 8 | 107.1 | 25 | 4.28 | 17 |
| 9 | 52.6 | 27.4 | 1.92 | 3 |
| 10 | 82.3 | 28.4 | 2.9 | 12 |
| 11 | 74.4 | 25 | 2.98 | 9 |
| 12 | 34.4 | 18.1 | 1.9 | 0 |
| 13 | 46.9 | 22.9 | 2.05 | 6 |
| 14 | 65.6 | 18.4 | 3.57 | 9 |
Table 2.
Comparison of the level of dexterity found in each group. Each column represents the average and standard deviations for each variable in each group. The blue group has high dexterity, as they, in general, take shorter times, lower TRatio values and made fewer errors. Conversely, the red group has lower dexterity, as they in general, take longer times, higher TRatio values and made many errors. The green group has average dexterity.
| Group | | | | |
|---|
| Blue | 45.42 (6.34) | 23.68 (3.54) | 1.93 (0.19) | 3 (2.00) |
| Green | 70.48 (11.16) | 31.60 (2.48) | 2.25 (0.48) | 8 (3.65) |
| Red | 78.05 (19.83) | 22.68 (3.12) | 3.44 (0.64) | 11 (4.00) |
Table 3.
Automatic measurements of the duration of the exercises, time, is represented in seconds.
Table 3.
Automatic measurements of the duration of the exercises, time, is represented in seconds.
| Volunteer | Exercise 1 | Exercise 2 | Exercise 3 |
|---|
| 1 | 44.0 | 21.6 | 43.1 |
| 2 | 33.8 | 16.3 | 78.6 |
| 3 | 50.9 | 29.5 | 60.7 |
| 4 | 23.6 | 10.8 | 47.7 |
| 5 | 40.9 | 19.5 | 49.4 |
| 6 | 37.6 | 19.2 | 60 |
| 7 | 42.3 | 29.9 | 65.1 |
| 8 | 25.4 | 15.3 | 106.3 |
| 9 | 46.1 | 24.5 | 51.8 |
| 10 | 36.7 | 17.8 | 77.9 |
| 11 | 43.1 | 20.0 | 74.4 |
| 12 | 28.4 | 17.3 | 34.9 |
| 13 | 23.5 | 13.5 | 48.3 |
| 14 | 29.5 | 15.8 | 66.6 |
Table 4.
Automatic detection of movements. Each column shows the number of movements carried out by a volunteer to complete an exercise. Exercises 1 and 2 did not represent any challenge for any of the participants as exercises were carried out with almost the same quantity of movements. On the contrary, the results of the third exercise were very heterogeneous; some participants required few movements to do exercise while others require many more movements. Extra-movements (more than 25) can be attributed to errors or unnecessary moves during the exercise execution.
| Volunteer | Exercise 1 | Exercise 2 | Exercise 3 |
|---|
| 1 | 19 | 11 | 32 |
| 2 | 19 | 11 | 51 |
| 3 | 20 | 10 | 35 |
| 4 | 19 | 10 | 33 |
| 5 | 19 | 11 | 31 |
| 6 | 19 | 11 | 47 |
| 7 | 19 | 10 | 56 |
| 8 | 19 | 10 | 71 |
| 9 | 19 | 10 | 32 |
| 10 | 21 | 10 | 60 |
| 11 | 20 | 10 | 56 |
| 12 | 19 | 10 | 25 |
| 13 | 20 | 10 | 37 |
| 14 | 19 | 10 | 51 |
Table 5.
Spatial displacement (Disp) measured by all sensors on each of the exercises. E1 means Exercise 1; E2 Exercise 2; and E3 Exercise 3. In all cases, displacements are expressed in meters.
Table 5.
Spatial displacement (Disp) measured by all sensors on each of the exercises. E1 means Exercise 1; E2 Exercise 2; and E3 Exercise 3. In all cases, displacements are expressed in meters.
| | Sensor 1 | Sensor 2 | Sensor 3 | Sensor 4 |
|---|
| Vol | E1 | E2 | E3 | E1 | E2 | E3 | E1 | E2 | E3 | E1 | E2 | E3 |
|---|
| 1 | 3.63 | 2.72 | 1.94 | 3.91 | 3.03 | 2.05 | 3.67 | 2.90 | 1.98 | 3.84 | 2.99 | 2.04 |
| 2 | 5.17 | 1.34 | 5.2 | 5.38 | 1.59 | 5.31 | 5.12 | 1.49 | 5.24 | 5.28 | 1.60 | 5.31 |
| 3 | 4.76 | 1.80 | 3.16 | 5.05 | 2.02 | 3.29 | 4.82 | 1.90 | 3.21 | 4.99 | 1.98 | 3.26 |
| 4 | 4.41 | 1.71 | 2.69 | 4.65 | 2.00 | 2.78 | 4.38 | 1.90 | 2.70 | 4.58 | 1.99 | 2.77 |
| 5 | 3.45 | 0.86 | 2.12 | 3.64 | 1.13 | 2.23 | 3.42 | 0.98 | 2.15 | 3.58 | 1.10 | 2.21 |
| 6 | 5.16 | 2.80 | 2.27 | 5.34 | 3.11 | 2.38 | 5.11 | 2.99 | 2.31 | 5.31 | 3.10 | 2.37 |
| 7 | 3.92 | 1.30 | 2.41 | 4.22 | 1.61 | 2.52 | 3.94 | 1.46 | 2.44 | 4.13 | 1.57 | 2.49 |
| 8 | 1.91 | 3.12 | 4.04 | 2.12 | 3.41 | 4.04 | 1.88 | 3.27 | 3.96 | 2.03 | 3.38 | 4.03 |
| 9 | 3.49 | 3.69 | 2.35 | 3.70 | 4.02 | 2.40 | 3.42 | 3.89 | 2.34 | 3.58 | 3.99 | 2.40 |
| 10 | 2.91 | 1.01 | 3.25 | 3.18 | 1.24 | 3.33 | 2.92 | 1.13 | 3.27 | 3.11 | 1.20 | 3.32 |
| 11 | 3.84 | 1.87 | 3.39 | 4.09 | 2.10 | 3.51 | 3.84 | 2.00 | 3.43 | 4.03 | 2.10 | 3.48 |
| 12 | 3.41 | 1.57 | 2.02 | 3.70 | 1.89 | 2.07 | 3.45 | 1.74 | 2.00 | 3.60 | 1.83 | 2.06 |
| 13 | 6.27 | 2.16 | 2.32 | 6.51 | 2.40 | 2.41 | 6.27 | 2.27 | 2.34 | 6.42 | 2.39 | 2.41 |
| 14 | 2.43 | 0.97 | 2.75 | 2.66 | 1.19 | 2.82 | 2.40 | 1.09 | 2.75 | 2.57 | 1.19 | 2.82 |
Table 6.
Angular displacement () measured by all sensors on each of the exercises. E1 means Exercise 1; E2 Exercise 2; and E3 Exercise 3. In all cases, angular displacements are expressed in degrees.
Table 6.
Angular displacement () measured by all sensors on each of the exercises. E1 means Exercise 1; E2 Exercise 2; and E3 Exercise 3. In all cases, angular displacements are expressed in degrees.
| | Sensor 1 | Sensor 2 | Sensor 3 | Sensor 4 |
|---|
| Vol | E1 | E2 | E3 | E1 | E2 | E3 | E1 | E2 | E3 | E1 | E2 | E3 |
|---|
| 1 | 1788 | 515 | 1387 | 2234 | 769 | 1565 | 1803 | 523 | 1415 | 2101 | 727 | 1568 |
| 2 | 2049 | 554 | 2578 | 2562 | 879 | 2854 | 2043 | 581 | 2584 | 2318 | 811 | 2787 |
| 3 | 1413 | 540 | 2080 | 1797 | 815 | 2272 | 1429 | 558 | 2052 | 1601 | 772 | 2237 |
| 4 | 1557 | 731 | 1432 | 1925 | 1104 | 1598 | 1561 | 735 | 1442 | 1798 | 1019 | 1545 |
| 5 | 1424 | 456 | 924 | 1715 | 708 | 1012 | 1402 | 478 | 916 | 1649 | 666 | 991 |
| 6 | 1585 | 532 | 1244 | 1996 | 795 | 1368 | 1575 | 534 | 1240 | 1812 | 731 | 1340 |
| 7 | 1530 | 499 | 1776 | 1897 | 782 | 1895 | 1541 | 523 | 1764 | 1734 | 720 | 1936 |
| 8 | 1601 | 666 | 1869 | 1980 | 1000 | 2032 | 1584 | 671 | 1854 | 1788 | 935 | 2031 |
| 9 | 1586 | 448 | 1184 | 1976 | 701 | 1297 | 1577 | 464 | 1198 | 1835 | 647 | 1299 |
| 10 | 1208 | 515 | 1415 | 1532 | 796 | 1552 | 1214 | 530 | 1426 | 1430 | 745 | 1559 |
| 11 | 1492 | 555 | 1499 | 1917 | 862 | 1714 | 1519 | 577 | 1520 | 1766 | 809 | 1671 |
| 12 | 1795 | 574 | 565 | 2215 | 892 | 612 | 1804 | 600 | 557 | 2085 | 832 | 602 |
| 13 | 1734 | 841 | 1103 | 2239 | 1288 | 1187 | 1754 | 870 | 1099 | 2015 | 1220 | 1188 |
| 14 | 1445 | 364 | 1401 | 1789 | 543 | 1547 | 1454 | 369 | 1418 | 1655 | 515 | 1519 |
Table 7.
r calculated between sensor 1 and sensors 2, 3 and 4 during exercise 3. Parameter is the average of r calculated between the signals and over all the movements that each volunteer performed to complete the exercise 3; is the standard deviation of these calculations. , gives the same information as previous column, but correlation was performed between sensors 1 and 3. In the same way as the previous two, brings the information regarding correlation between sensor 1 and 4. Finally, shows behavior of the combination thumb-index (for exercise 3, it brings information regarding tweezers manipulation).
| Exercise 3 |
|---|
| Vol | | | | | | |
|---|
| 1 | 0.90 (0.15) | 0.94 (0.10) | 0.94 (0.10) | 0.89 (0.16) | 0.92 (0.17) | 0.90 (0.19) |
| 2 | 0.88 (0.17) | 0.92 (0.12) | 0.91 (0.14) | 0.87 (0.18) | 0.94 (0.18) | 0.85 (0.20) |
| 3 | 0.81 (0.10) | 0.97 (0.04) | 0.96 (0.05) | 0.80 (0.11) | 0.93 (0.13) | 0.83 (0.15) |
| 4 | 0.87 (0.18) | 0.91 (0.16) | 0.92 (0.12) | 0.85 (0.19) | 0.90 (0.14) | 0.82 (0.19) |
| 5 | 0.80 (0.19) | 0.90 (0.18) | 0.90 (0.17) | 0.78 (0.22) | 0.89 (0.15) | 0.80 (0.21) |
| 6 | 0.80 (0.20) | 0.92 (0.19) | 0.91 (0.16) | 0.78 (0.23) | 0.92 (0.17) | 0.81 (0.21) |
| 7 | 0.88 (0.16) | 0.91 (0.13) | 0.91 (0.16) | 0.86 (0.20) | 0.89 (0.16) | 0.84 (0.23) |
| 8 | 0.83 (0.21) | 0.88 (0.15) | 0.86 (0.19) | 0.81 (0.26) | 0.91 (0.15) | 0.86 (0.22) |
| 9 | 0.91 (0.11) | 0.97 (0.03) | 0.98 (0.05) | 0.89 (0.12) | 0.93 (0.09) | 0.91 (0.11) |
| 10 | 0.80 (0.16) | 0.84 (0.27) | 0.89 (0.21) | 0.78 (0.30) | 0.88 (0.21) | 0.79 (0.24) |
| 11 | 0.90 (0.18) | 0.91 (0.15) | 0.91 (0.15) | 0.88 (0.20) | 0.89 (0.17) | 0.90 (0.21) |
| 12 | 0.89 (0.18) | 0.95 (0.04) | 0.95 (0.04) | 0.87 (0.18) | 0.91 (0.13) | 0.85 (0.19) |
| 13 | 0.85 (0.10) | 0.96 (0.06) | 0.95 (0.12) | 0.85 (0.10) | 0.92 (0.11) | 0.87 (0.10) |
| 14 | 0.84 (0.16) | 0.89 (0.14) | 0.87 (0.21) | 0.83 (0.20) | 0.90 (0.18) | 0.87 (0.21) |
Table 8.
r calculated between the sensor 1 and sensors 2, 3 and 4; and between sensors 2 and 3, during exercises 1 and 2. Columns in this table provide the same information shown in
Table 7, but in this case for exercises 1 and 2.
Table 8.
r calculated between the sensor 1 and sensors 2, 3 and 4; and between sensors 2 and 3, during exercises 1 and 2. Columns in this table provide the same information shown in
Table 7, but in this case for exercises 1 and 2.
| | Exercise 1 | Exercise 2 |
|---|
| Vol | | | | | | | | |
|---|
| 1 | 0.91(0.12) | 0.91(0.12) | 0.90(0.17) | 0.89(0.14) | 0.60(0.24) | 0.64(0.26) | 0.55(0.24) | 0.59(0.28) |
| 2 | 0.92(0.10) | 0.93(0.09) | 0.91(0.12) | 0.90(0.11) | 0.75(0.13) | 0.75(0.12) | 0.76(0.13) | 0.74(0.15) |
| 3 | 0.84(0.30) | 0.81(0.42) | 0.86(0.18) | 0.79(0.44) | 0.76(0.18) | 0.77(0.19) | 0.80(0.17) | 0.75(0.22) |
| 4 | 0.80(0.13) | 0.82(0.13) | 0.81(0.14) | 0.79(0.14) | 0.67(0.18) | 0.62(0.20) | 0.69(0.18) | 0.61(0.25) |
| 5 | 0.85(0.15) | 0.87(0.14) | 0.84(0.17) | 0.83(0.16) | 0.75(0.15) | 0.80(0.12) | 0.72(0.20) | 0.73(0.15) |
| 6 | 0.90(0.11) | 0.91(0.11) | 0.90(0.11) | 0.89(0.12) | 0.67(0.26) | 0.65(0.26) | 0.67(0.24) | 0.65(0.26) |
| 7 | 0.87(0.15) | 0.88(0.14) | 0.86(0.15) | 0.86(0.16) | 0.73(0.21) | 0.74(0.18) | 0.70(0.18) | 0.72(0.24) |
| 8 | 0.71(0.19) | 0.69(0.22) | 0.69(0.18) | 0.67(0.25) | 0.78(0.13) | 0.86(0.18) | 0.86(0.09) | 0.78(0.23) |
| 9 | 0.91(0.12) | 0.90(0.16) | 0.92(0.10) | 0.88(0.17) | 0.77(0.12) | 0.86(0.14) | 0.85(0.14) | 0.76(0.15) |
| 10 | 0.85(0.21) | 0.86(0.21) | 0.87(0.20) | 0.83(0.26) | 0.67(0.21) | 0.69(0.18) | 0.49(0.30) | 0.66(0.26) |
| 11 | 0.83(0.16) | 0.86(0.17) | 0.80(0.13) | 0.81(0.18) | 0.71(0.17) | 0.71(0.17) | 0.70(0.21) | 0.70(0.18) |
| 12 | 0.92(0.08) | 0.94(0.06) | 0.91(0.08) | 0.89(0.12) | 0.67(0.18) | 0.75(0.12) | 0.68(0.22) | 0.66(0.20) |
| 13 | 0.89(0.17) | 0.95(0.04) | 0.93(0.10) | 0.87(0.20) | 0.72(0.26) | 0.73(0.22) | 0.71(0.26) | 0.70(0.34) |
| 14 | 0.85(0.14) | 0.86(0.15) | 0.89(0.11) | 0.85(0.17) | 0.65(0.24) | 0.66(0.22) | 0.64(0.21) | 0.63(0.26) |
Table 9.
Comparison of the results of groups Type 1 and Type 2. Each column represents the average and standard deviations for each variable on both groups. Type 1, has individuals with higher dexterity, as they used less time to complete the exercise, made fewer movements, and had smaller displacements. Type 2, include volunteers who have lower dexterity as the values of parameters were higher.
| Group | | | | |
|---|
| Type 1 | 45.87 (6.08) | 31.67 (3.88) | 2.24 (0.27) | 1099.17 (321.51) |
| Type 2 | 73.70 (15.05) | 53.38 (10.41) | 3.31 (0.95) | 1732.75 (440.78) |
Table 10.
Results from Kruskal-Wallis test for each exercise. In the case of exercises 1 and 2, results of the statistical test show that the IGlove responds in the same way in the case of exercises that are not suitable to assess dexterity. By contrast, the low found for exercise 3 indicate a significant difference between groups, therefore, variables Duration, Movements, Disp and , acquired during FMS test can be used to assess dexterity using the IGlove.
|
|---|
| Exercise | Duration | Movements | Disp | |
|---|
| Exercise 1 | 0.6056 | 0.3705 | 0.8973 | 0.1967 |
| Exercise 2 | 0.6056 | 0.7420 | 0.6056 | 0.6510 |
| Exercise 3 | 0.0019 | 0.0029 | 0.0098 | 0.0098 |


