Structural Health Monitoring for a Z-Type Special Vehicle
Abstract
:1. Introduction
2. Z-Type Special Vehicle and FBG Sensors
3. Sensor Layout Scheme
4. Monitoring Results of Vehicle’s Operating Process
4.1. Monitoring Results of Loading Process
- The weight-bearing area rose up to a certain height.
- The position of the tower was adjusted by two cranes.
- The tower was hoisted slowly onto the fixtures until it was stable.
- The tower was tied up using wire cable.
- The weight-bearing area descended.
4.2. Monitoring Results of Lifting Process
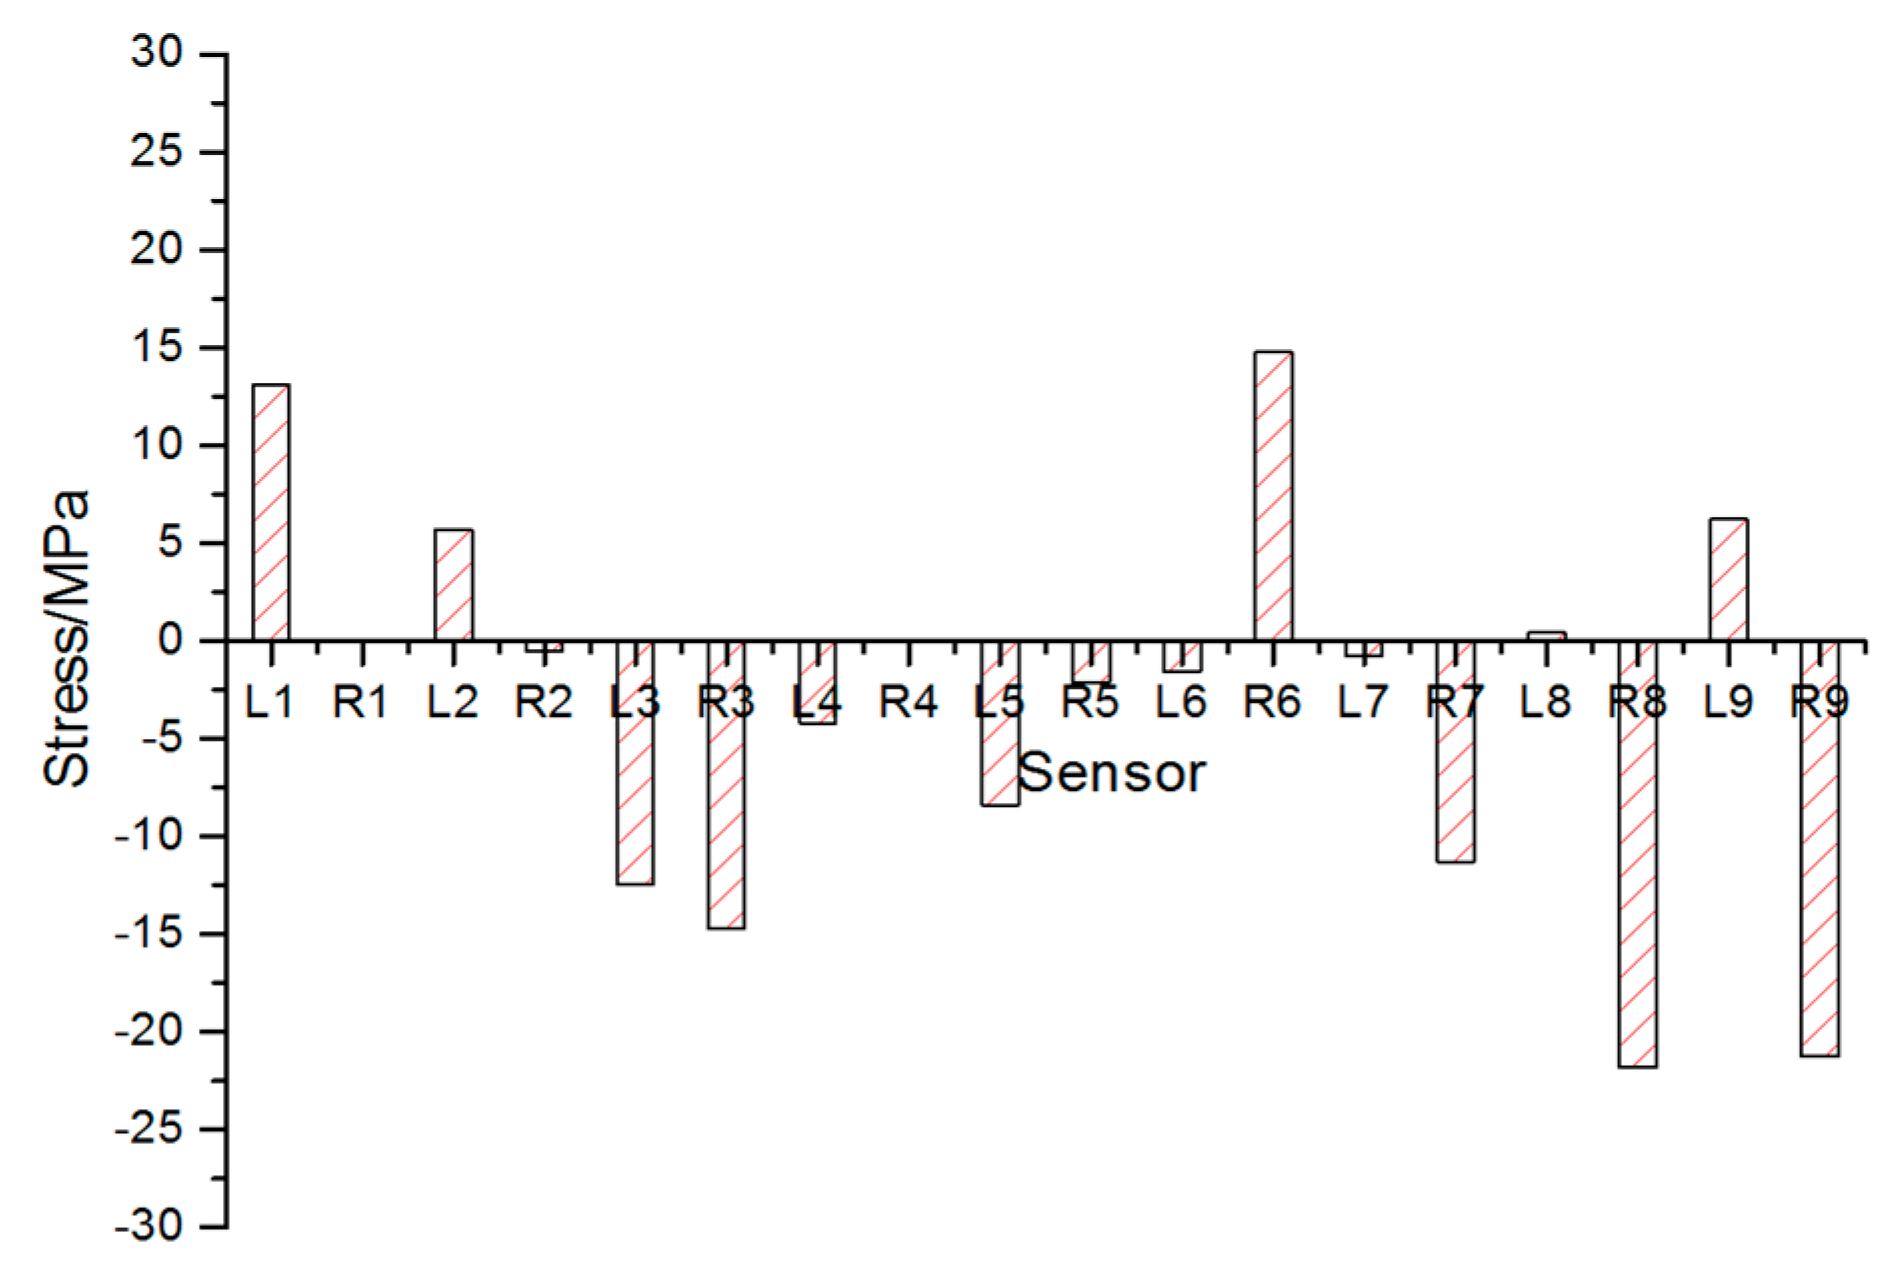
- Figure 7 gives out the maximum stress changes measured by all sensors. It is obvious that sensors on both ends of the vehicle were in tension while those in the middle part in compression. The stress change of sensor 5 was rather small but noticeable. Monitoring result of sensor L7 is unexpectedly small due to the fact that the sensor is connected incorrectly.
- The maximum stress of each sensor is shown in Table 3. In Table 3, the maximum compressive stress change 181.82 MPa occurred at L4 near to the root of the weight-bearing area as expected, while the largest tension stress change obtained from sensor L9 was 174.08 MPa. The monitoring area corresponding to the sensors set in bold in Table 3 should be reinforced for security reasons.
- The last column of Table 3 is the stress differences between sensors on the left side and those on the right side. The 110.93 MPa stress difference between sensor L4 and R4 cannot be ignored, which indicated that stress was distributed unevenly on different side. So, the process of lifting goods on the weight-bearing area deserved more attention in the case of overturning.
- During the lifting process of the weight-bearing area, the forepart and the rear part of the vehicle were not raised up at the same time (see Figure 8). The forepart was lifted up about 40 s later than the rear part. In that case, the rear part would bear most of the weight at the beginning of the process.
Finite Element Analysis
4.3. Monitoring Results of Transportation Process
4.3.1. Turning Process
4.3.2. Monitoring Results of Process of Passing through a Bump
4.4. Monitoring Results of Unloading Process
- In the first stage, crane 1 first lifted up the forepart of the tower while the rear part was still in contact with the fixture. Then the lifted end of the tower was halted in the air which explained the platform circled in the diagram of sensor L4.
- In the second stage, both of the cranes began to lift the entire tower up together.
- In the third stage, crane 2 needed to adjust its position so that the tower was put down. The rear part of the tower was in contact with the fixture again while the forepart was still lifted by crane 1, which explained the difference of magnitude in stage 3 between sensor L4 and L6.
- In Table 5, the maximum stress of each monitoring point is given out in the process of unloading. The differences in magnitude between the strain levels and the directions of change are dependent on sensor location. It is obvious that sensors on both ends of the vehicle were in compression while those in the middle part were in tension which was the opposite of the expected lifting process.
- Differences between sensors on the left side and the right side are quite small. The maximum stress 53.83 MPa appeared in R6 which indicated that the structure was in safe condition.
5. Conclusions
- The scheme of sensor location is presented which can provide a reference for other similar structures of special vehicles.
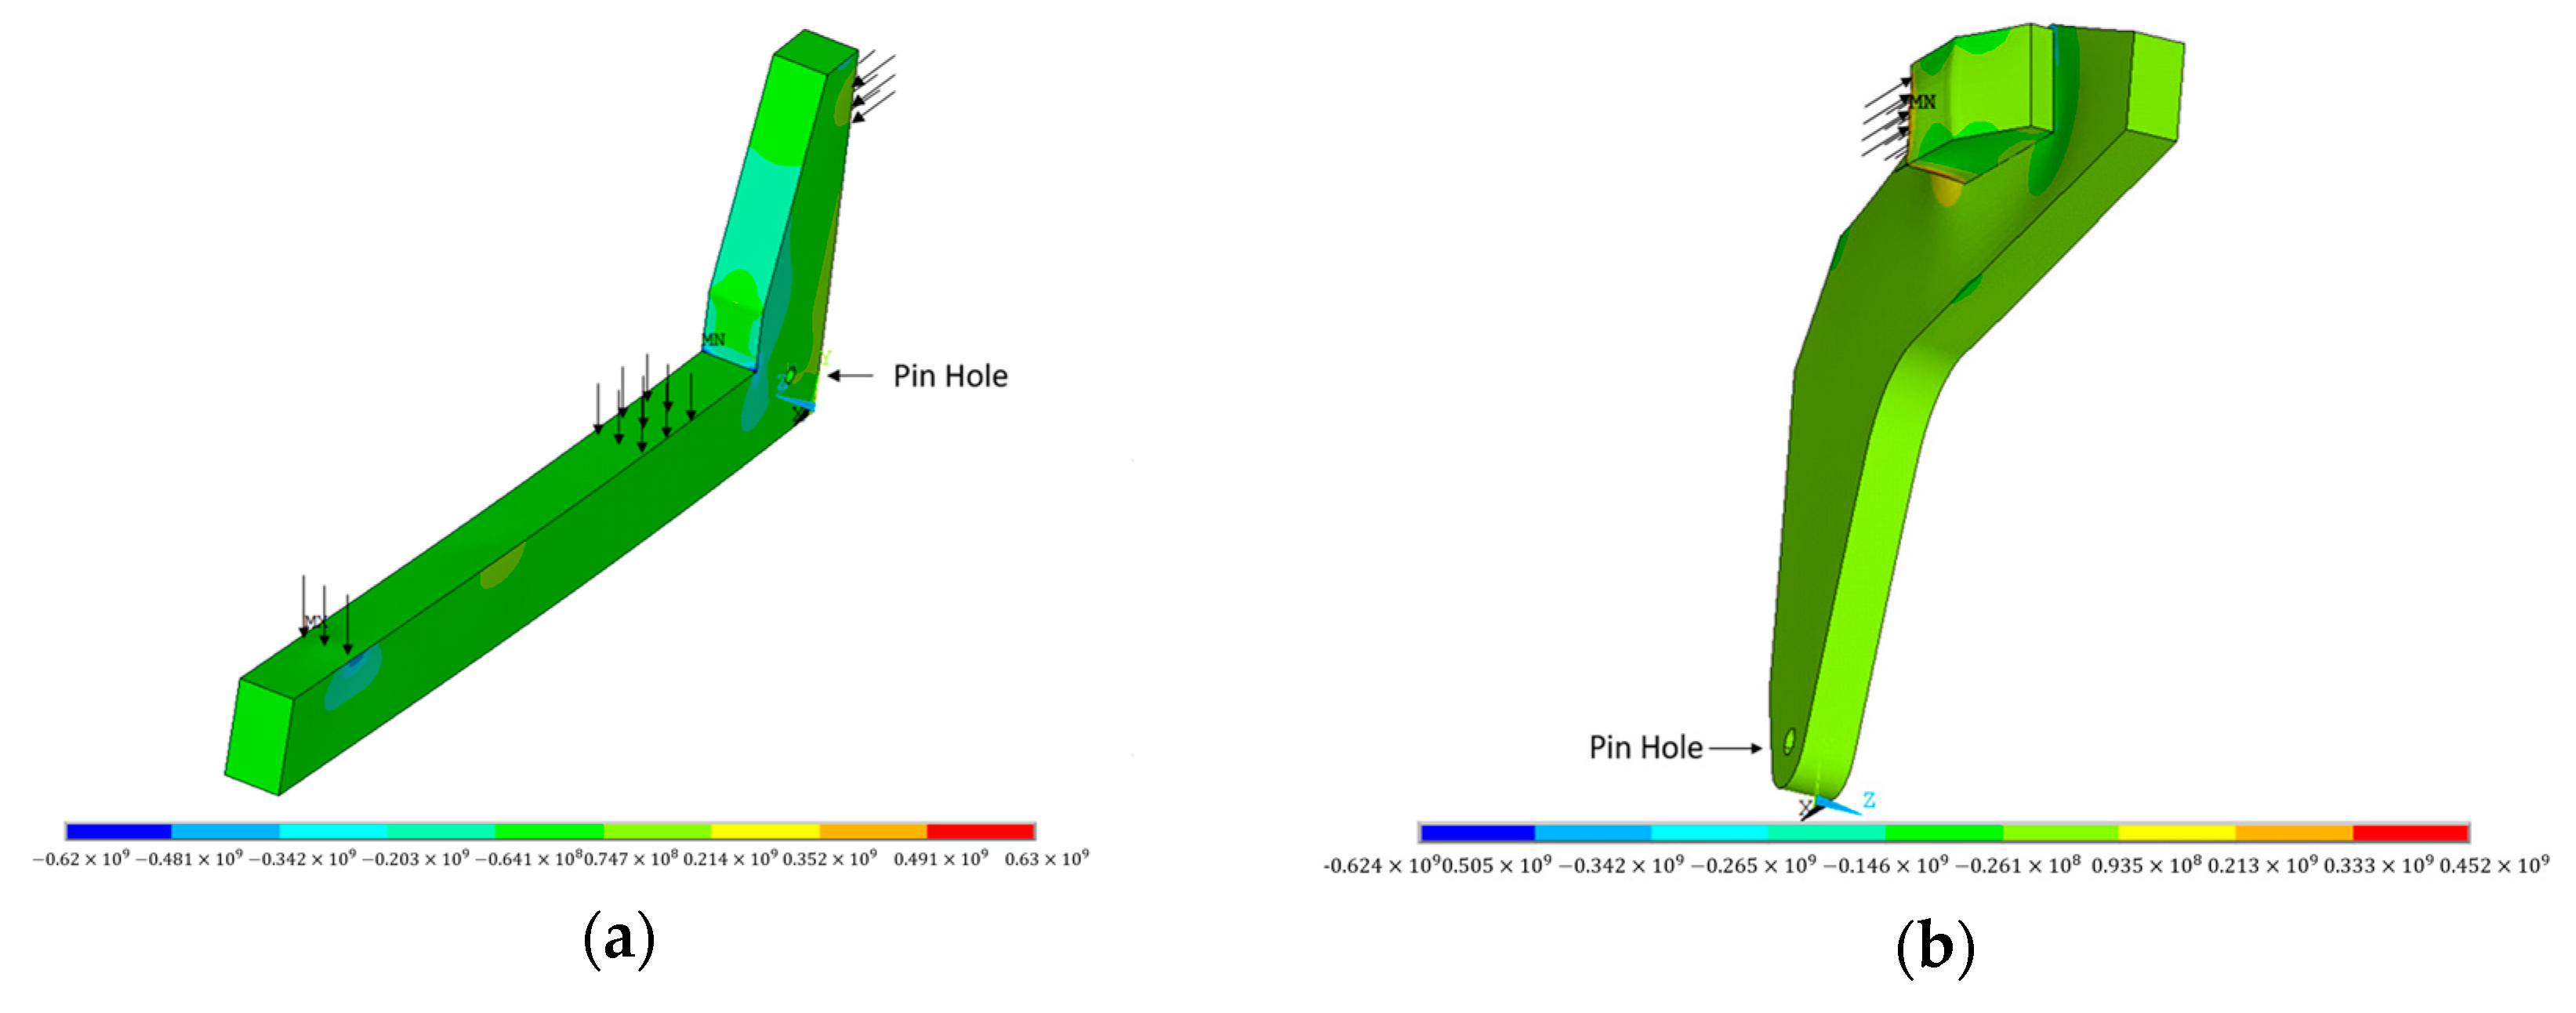
- Comparing the result of finite element analysis and that of real monitoring makes the SHM for the vehicle reliable.
- Data analysis guarantees safety for the vehicle operating process during which the sensors can monitor the structural responses in real time. It can be assumed that structural damages can be detected in time to prevent accidents.
Acknowledgments
Author Contributions
Conflicts of Interest
References
- Gan, L. Globalization of the automobile industry in China: Dynamics and barriers in greening of the road transportation. Energy Policy 2003, 31, 537–551. [Google Scholar] [CrossRef]
- Banerjee, A.; Duflo, E.; Qian, N. On the Road: Access to Transportation Infrastructure and Economic Growth in China. Available online: http://www.nber.org/papers/w17897 (accessed on 17 May 2017).
- Wu, Z.; Sun, M. Statistic analysis and countermeasure study on 200 road transportation accidents of dangerous chemicals. J. Saf. Sci. Technol. 2006, 2, 3–8. [Google Scholar]
- Li, H.N.; Li, D.S.; Song, G.B. Recent applications of fiber optic sensors to health monitoring in civil engineering. Eng. Struct. 2004, 26, 1647–1657. [Google Scholar] [CrossRef]
- Chang, P.C.; Flatau, A.; Liu, S.C. Review paper: Health monitoring of civil infrastructure. Struct. Health Monit. 2003, 2, 257–267. [Google Scholar] [CrossRef]
- Ren, L.; Yuan, C.L.; Li, H.N.; Yi, T.H. Structural Health Monitoring System Developed for Dalian Stadium. Int. J. Struct. Stab. Dyn. 2015, 16, 1640018. [Google Scholar] [CrossRef]
- Ou, J.P.; Li, H. Structural health monitoring in mainland China: Review and future trends. Struct. Health Monit. 2016, 9, 219–231. [Google Scholar]
- Ko, J.M.; Ni, Y.Q. Technology developments in structural health monitoring of large-scale bridges. Eng. Struct. 2005, 27, 1715–1725. [Google Scholar] [CrossRef]
- Jane, S.; Jo, H.; Cho, S.; Mechitov, K.; Rice, J.-A.; Sim, S.-H.; Jung, H.-J.; Yun, C.-B.; Spencer, B.F.; Agha, G. Structural health monitoring of a cable-stayed bridge using smart sensor technology: Deployment and evaluation. Smart Struct. Syst. 2010, 6, 439–459. [Google Scholar]
- Chang, F.-K. Structural Health Monitoring: A Summary Report on the First Stanford Workshop on Structural Health Monitoring; Stanford University: Stanford, CA, USA, 18–20 September 1997. [Google Scholar]
- Huang, S.; Ohn, M.M.; LeBlanc, M. Continuous arbitrary strain profile measurements with fiber Bragg gratings. Smart Mater. Struct. 1998, 7, 248. [Google Scholar] [CrossRef]
- Henderson, P.J.; Fisher, N.E.; Jackson, D.A. Current Metering Using Fiber-Grating Based Interrogation of a Conventional Current Transformer. In Proceedings of the 12th International Conference on Optical Fiber Sensors, Williamsburg, VA, USA, 28–31 October 1997. [Google Scholar]
- Lee, D.C.; Lee, J.J.; Kwon, I.B. Monitoring of fatigue crack growth in steel structures using intensity-based optical fiber sensors. J. Intell. Mater. Syst. Struct. 2000, 11, 100–107. [Google Scholar] [CrossRef]
- Kharroub, S.; Laflamme, S.; Song, C.; Qiao, D.; Phares, B.; Li, J. Smart sensing skin for detection and localization of fatigue cracks. Smart Mater. Struct. 2015, 24, 065004. [Google Scholar] [CrossRef]
- Kaloop, M.R.; Sayed, M.A.; Kim, D.; Kim, E. Movement identification model of port container crane based on structural health monitoring system. Struct. Eng. Mech. 2014, 50, 105–119. [Google Scholar] [CrossRef]
- Ding, K.Q.; Wang, Z.J.; Zhao, N.; Chen, G.; Qian, S. Development of structural health monitoring technology for large hoisting machinery structure. Hoisting Convey. Mach. 2012, 8, 1–4. [Google Scholar]
- Yang, L.D. Design and Development of Structural Health Monitoring System for Dalian Stadium. Ph.D. Thesis, Dalian University of Technology, Dalian, China, 2013. [Google Scholar]


| Parameter | Magnitude | Unit |
|---|---|---|
| Pa | ||
| Pa | ||
| 0.50 | mm² | |
| 0.01 | mm² |
| Sensor Number | L1 | L2 | L3 | L4 | L5 | L6 | L7 | L8 | L9 |
|---|---|---|---|---|---|---|---|---|---|
| Initial Wavelength (nm) | 1515.740 | 1521.486 | 1537.313 | 1545.061 | 1553.702 | 1561.428 | 1569.029 | 1577.231 | 1585.110 |
| Sensor Number | R1 | R2 | R3 | R4 | R5 | R6 | R7 | R8 | R9 |
| Initial Wavelength (nm) | NaN | 1529.667 | 1536.998 | 1545.519 | 1553.209 | 1561.886 | 1569.350 | 1577.896 | 1584.892 |
| Sensor Number | Max Stress/MPa | Sensor Number | Max Stress/MPa | Difference/MPa |
|---|---|---|---|---|
| L1 | 156.03 | / | / | / |
| L2 | 100.01 | R2 | 98.78 | 1.23 |
| L3 | −63.62 | R3 | −90.66 | 27.04 |
| L4 | −181.82 | R4 | −70.89 | 110.93 |
| L5 | −2.7 | R5 | 1.62 | 1.08 |
| L6 | −34.29 | R6 | −119.97 | 85.68 |
| L7 | −8.06 | R7 | −56.76 | 48.7 |
| L8 | 106.24 | R8 | 106.73 | 0.49 |
| L9 | 174.08 | R9 | 147.28 | 26.8 |
| Element Type | Density | Young’s Module |
|---|---|---|
| Shell element | 7850 kg/m3 | 210 GPa |
| Sensor Number | Max Stress/MPa | Sensor Number | Max Stress/MPa | Difference/MPa |
|---|---|---|---|---|
| L1 | −35.98 | - | - | - |
| L2 | −22.82 | R2 | −23.39 | 0.57 |
| L3 | 22.19 | R3 | 26.95 | 4.76 |
| L4 | 50.31 | R4 | 50.87 | 0.56 |
| L5 | 5.54 | R5 | 2.21 | 3.33 |
| L6 | 53.13 | R6 | 53.83 | 0.7 |
| L7 | 2.25 | R7 | 16.79 | 14.54 |
| L8 | −22.27 | R8 | −21.83 | 0.44 |
| L9 | −44.94 | R9 | −35.49 | 9.45 |
© 2017 by the authors. Licensee MDPI, Basel, Switzerland. This article is an open access article distributed under the terms and conditions of the Creative Commons Attribution (CC BY) license (http://creativecommons.org/licenses/by/4.0/).
Share and Cite
Yuan, C.; Ren, L.; Li, H. Structural Health Monitoring for a Z-Type Special Vehicle. Sensors 2017, 17, 1262. https://doi.org/10.3390/s17061262
Yuan C, Ren L, Li H. Structural Health Monitoring for a Z-Type Special Vehicle. Sensors. 2017; 17(6):1262. https://doi.org/10.3390/s17061262
Chicago/Turabian StyleYuan, Chaolin, Liang Ren, and Hongnan Li. 2017. "Structural Health Monitoring for a Z-Type Special Vehicle" Sensors 17, no. 6: 1262. https://doi.org/10.3390/s17061262
APA StyleYuan, C., Ren, L., & Li, H. (2017). Structural Health Monitoring for a Z-Type Special Vehicle. Sensors, 17(6), 1262. https://doi.org/10.3390/s17061262


