Landsat-Derived Estimates of Mangrove Extents in the Sierra Leone Coastal Landscape Complex during 1990–2016


Abstract
:1. Introduction
- How has the mangrove extent changed in the SLCLC over the past 26 years? Is there net mangrove gain or loss?
- Where did mangrove forests undergo the most changes—closer to the coastline or further away?
- Are there spatial differences in mangrove changes, e.g., northern SLCLC vs. southern SLCLC?
2. Materials and Methods
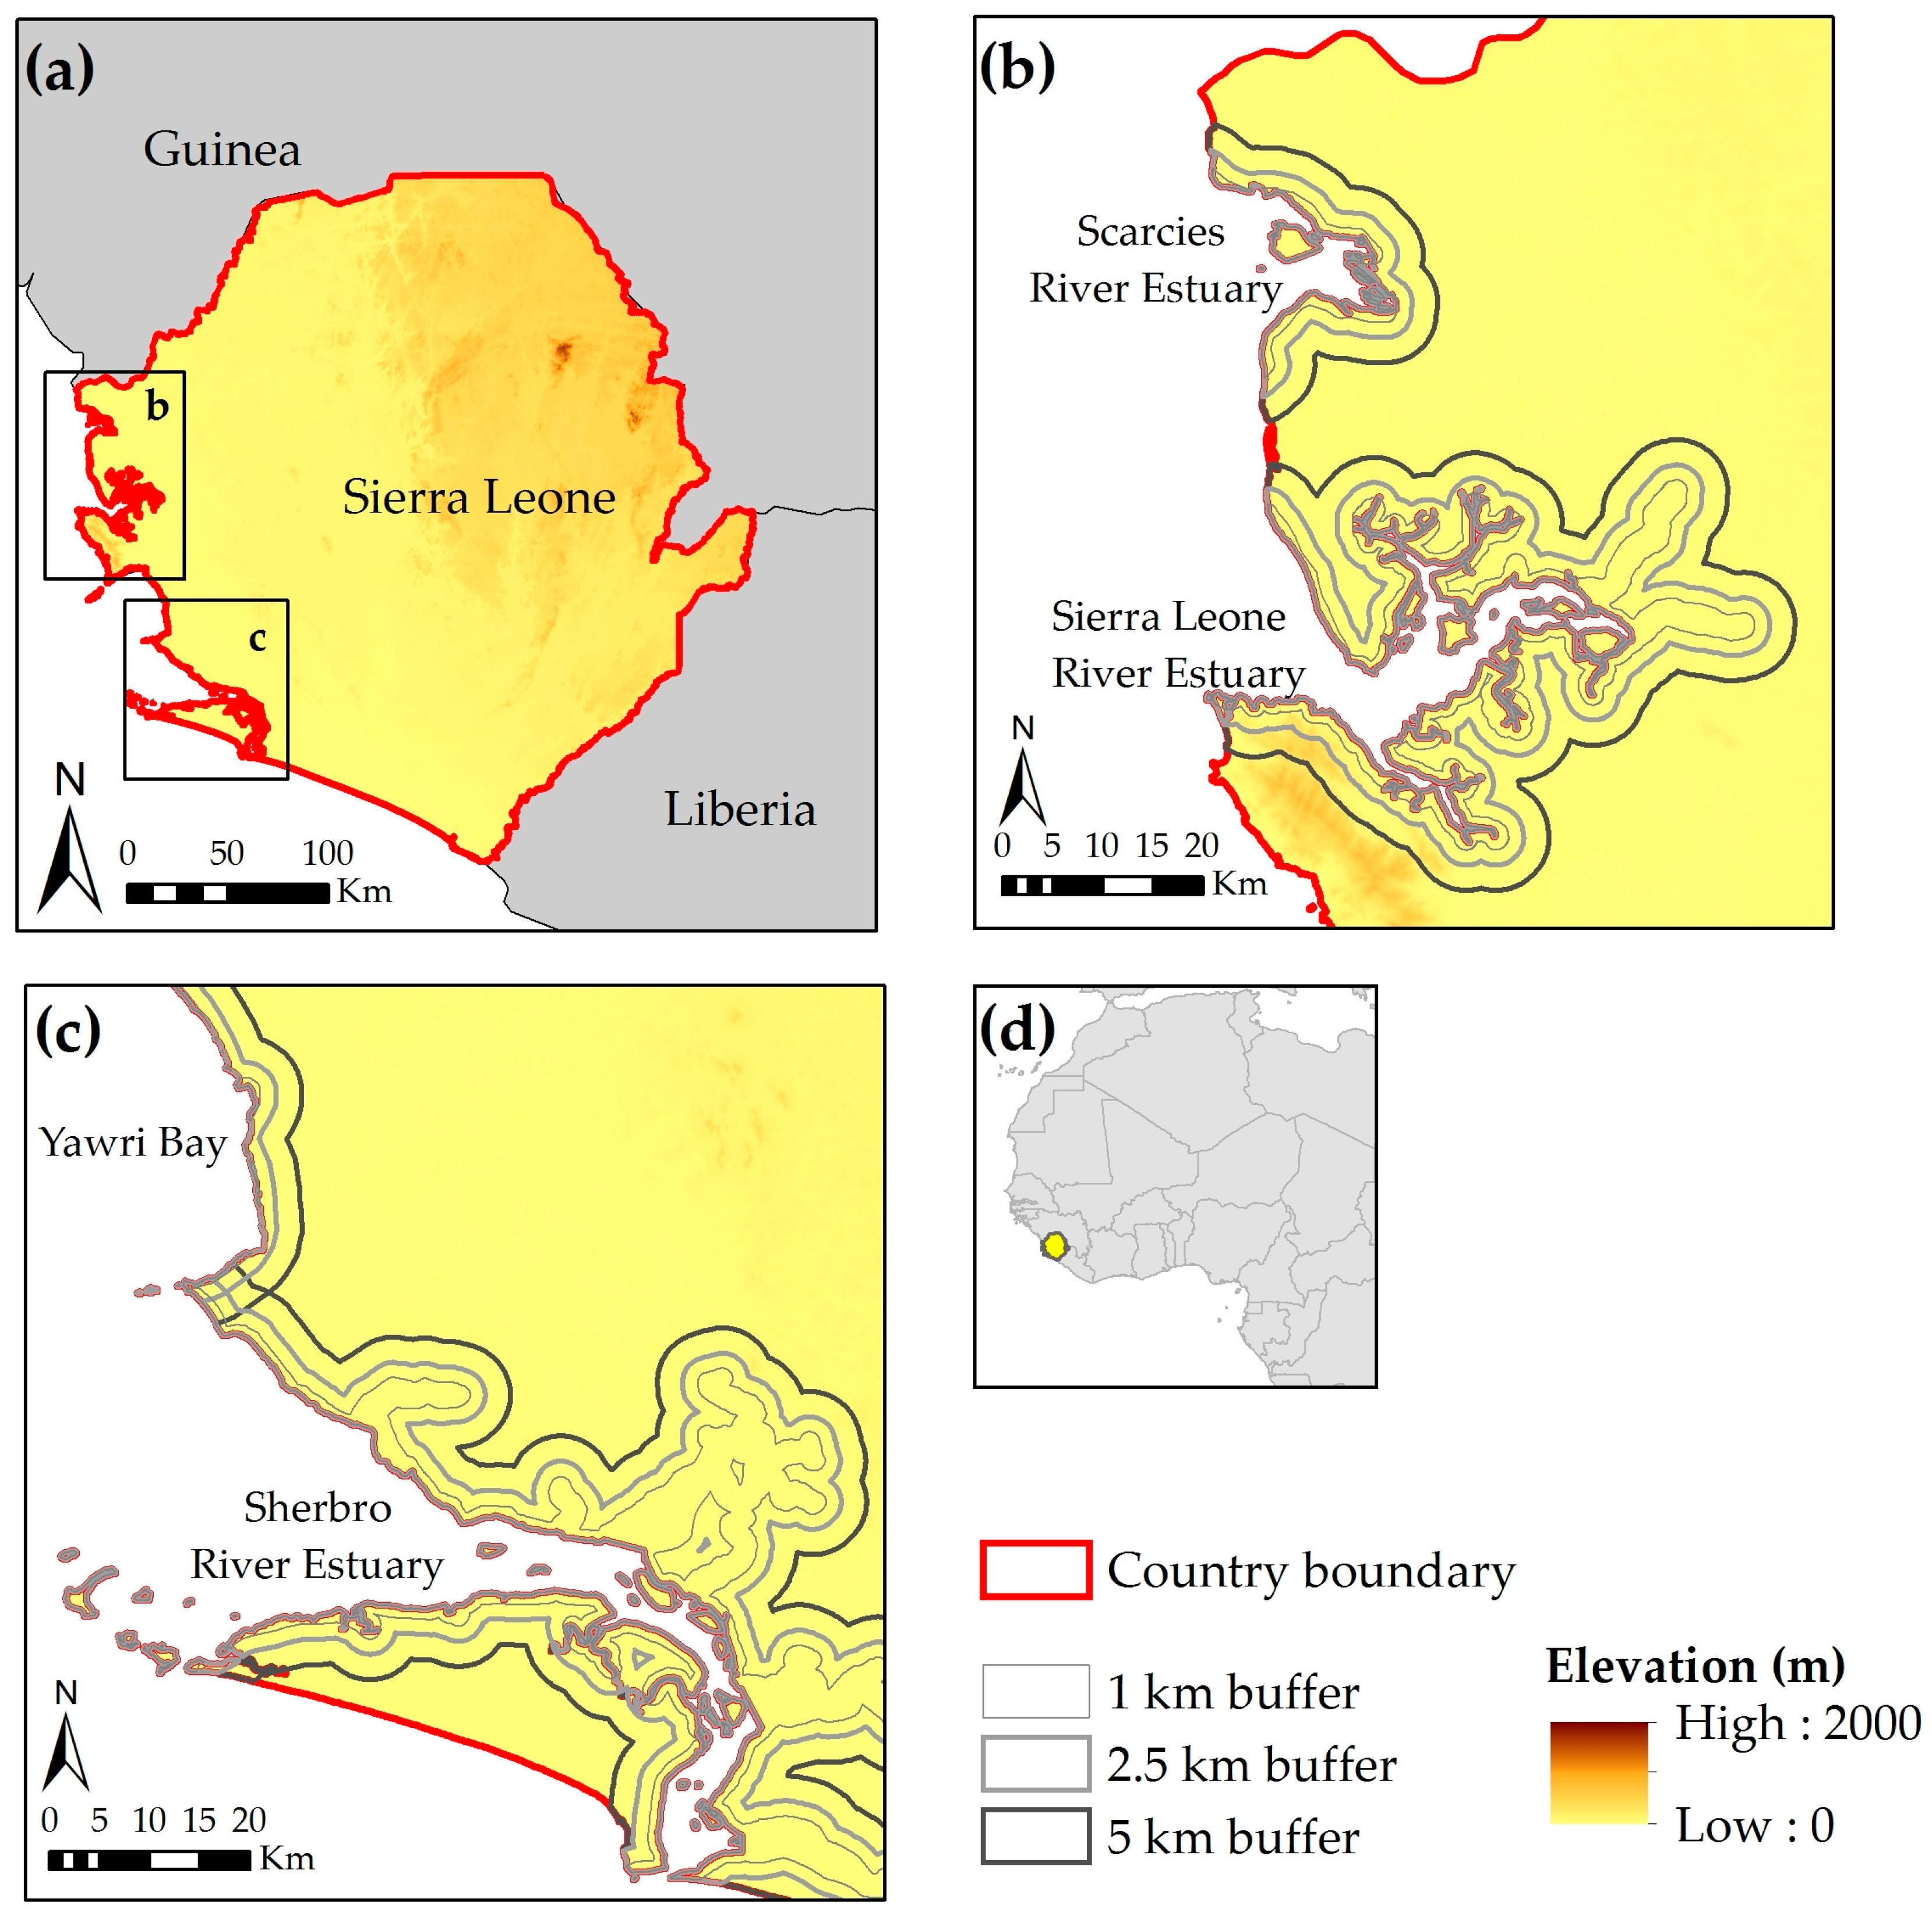
2.1. Study Area
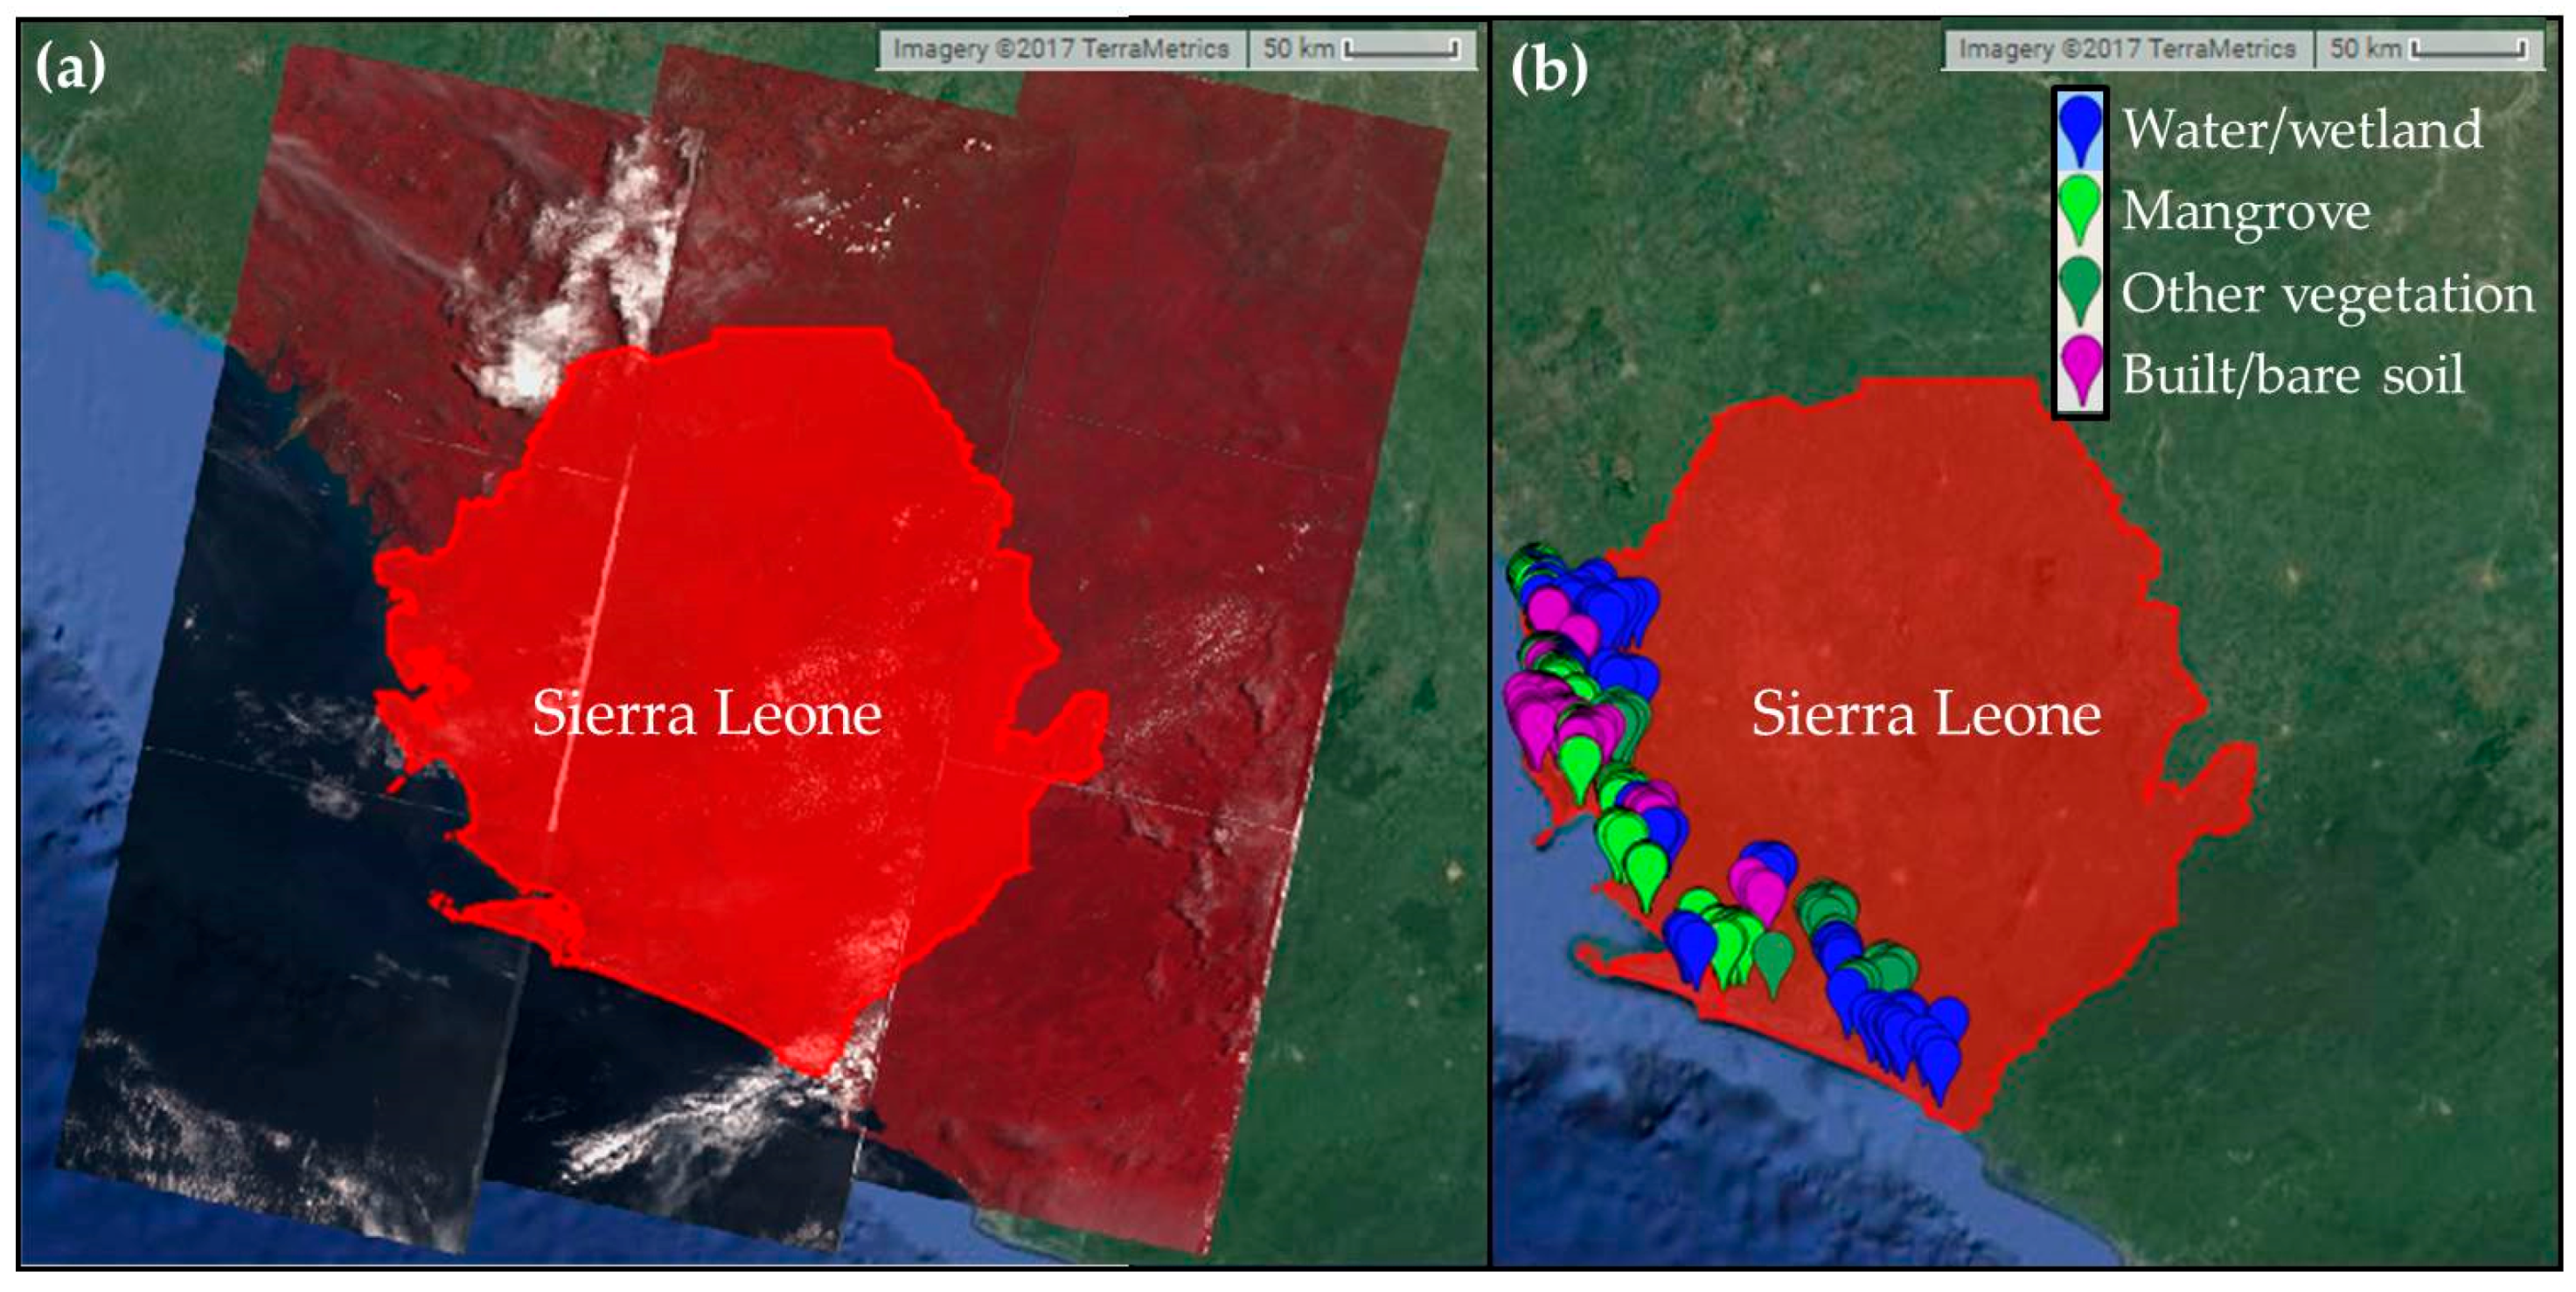
2.2. Satellite Data
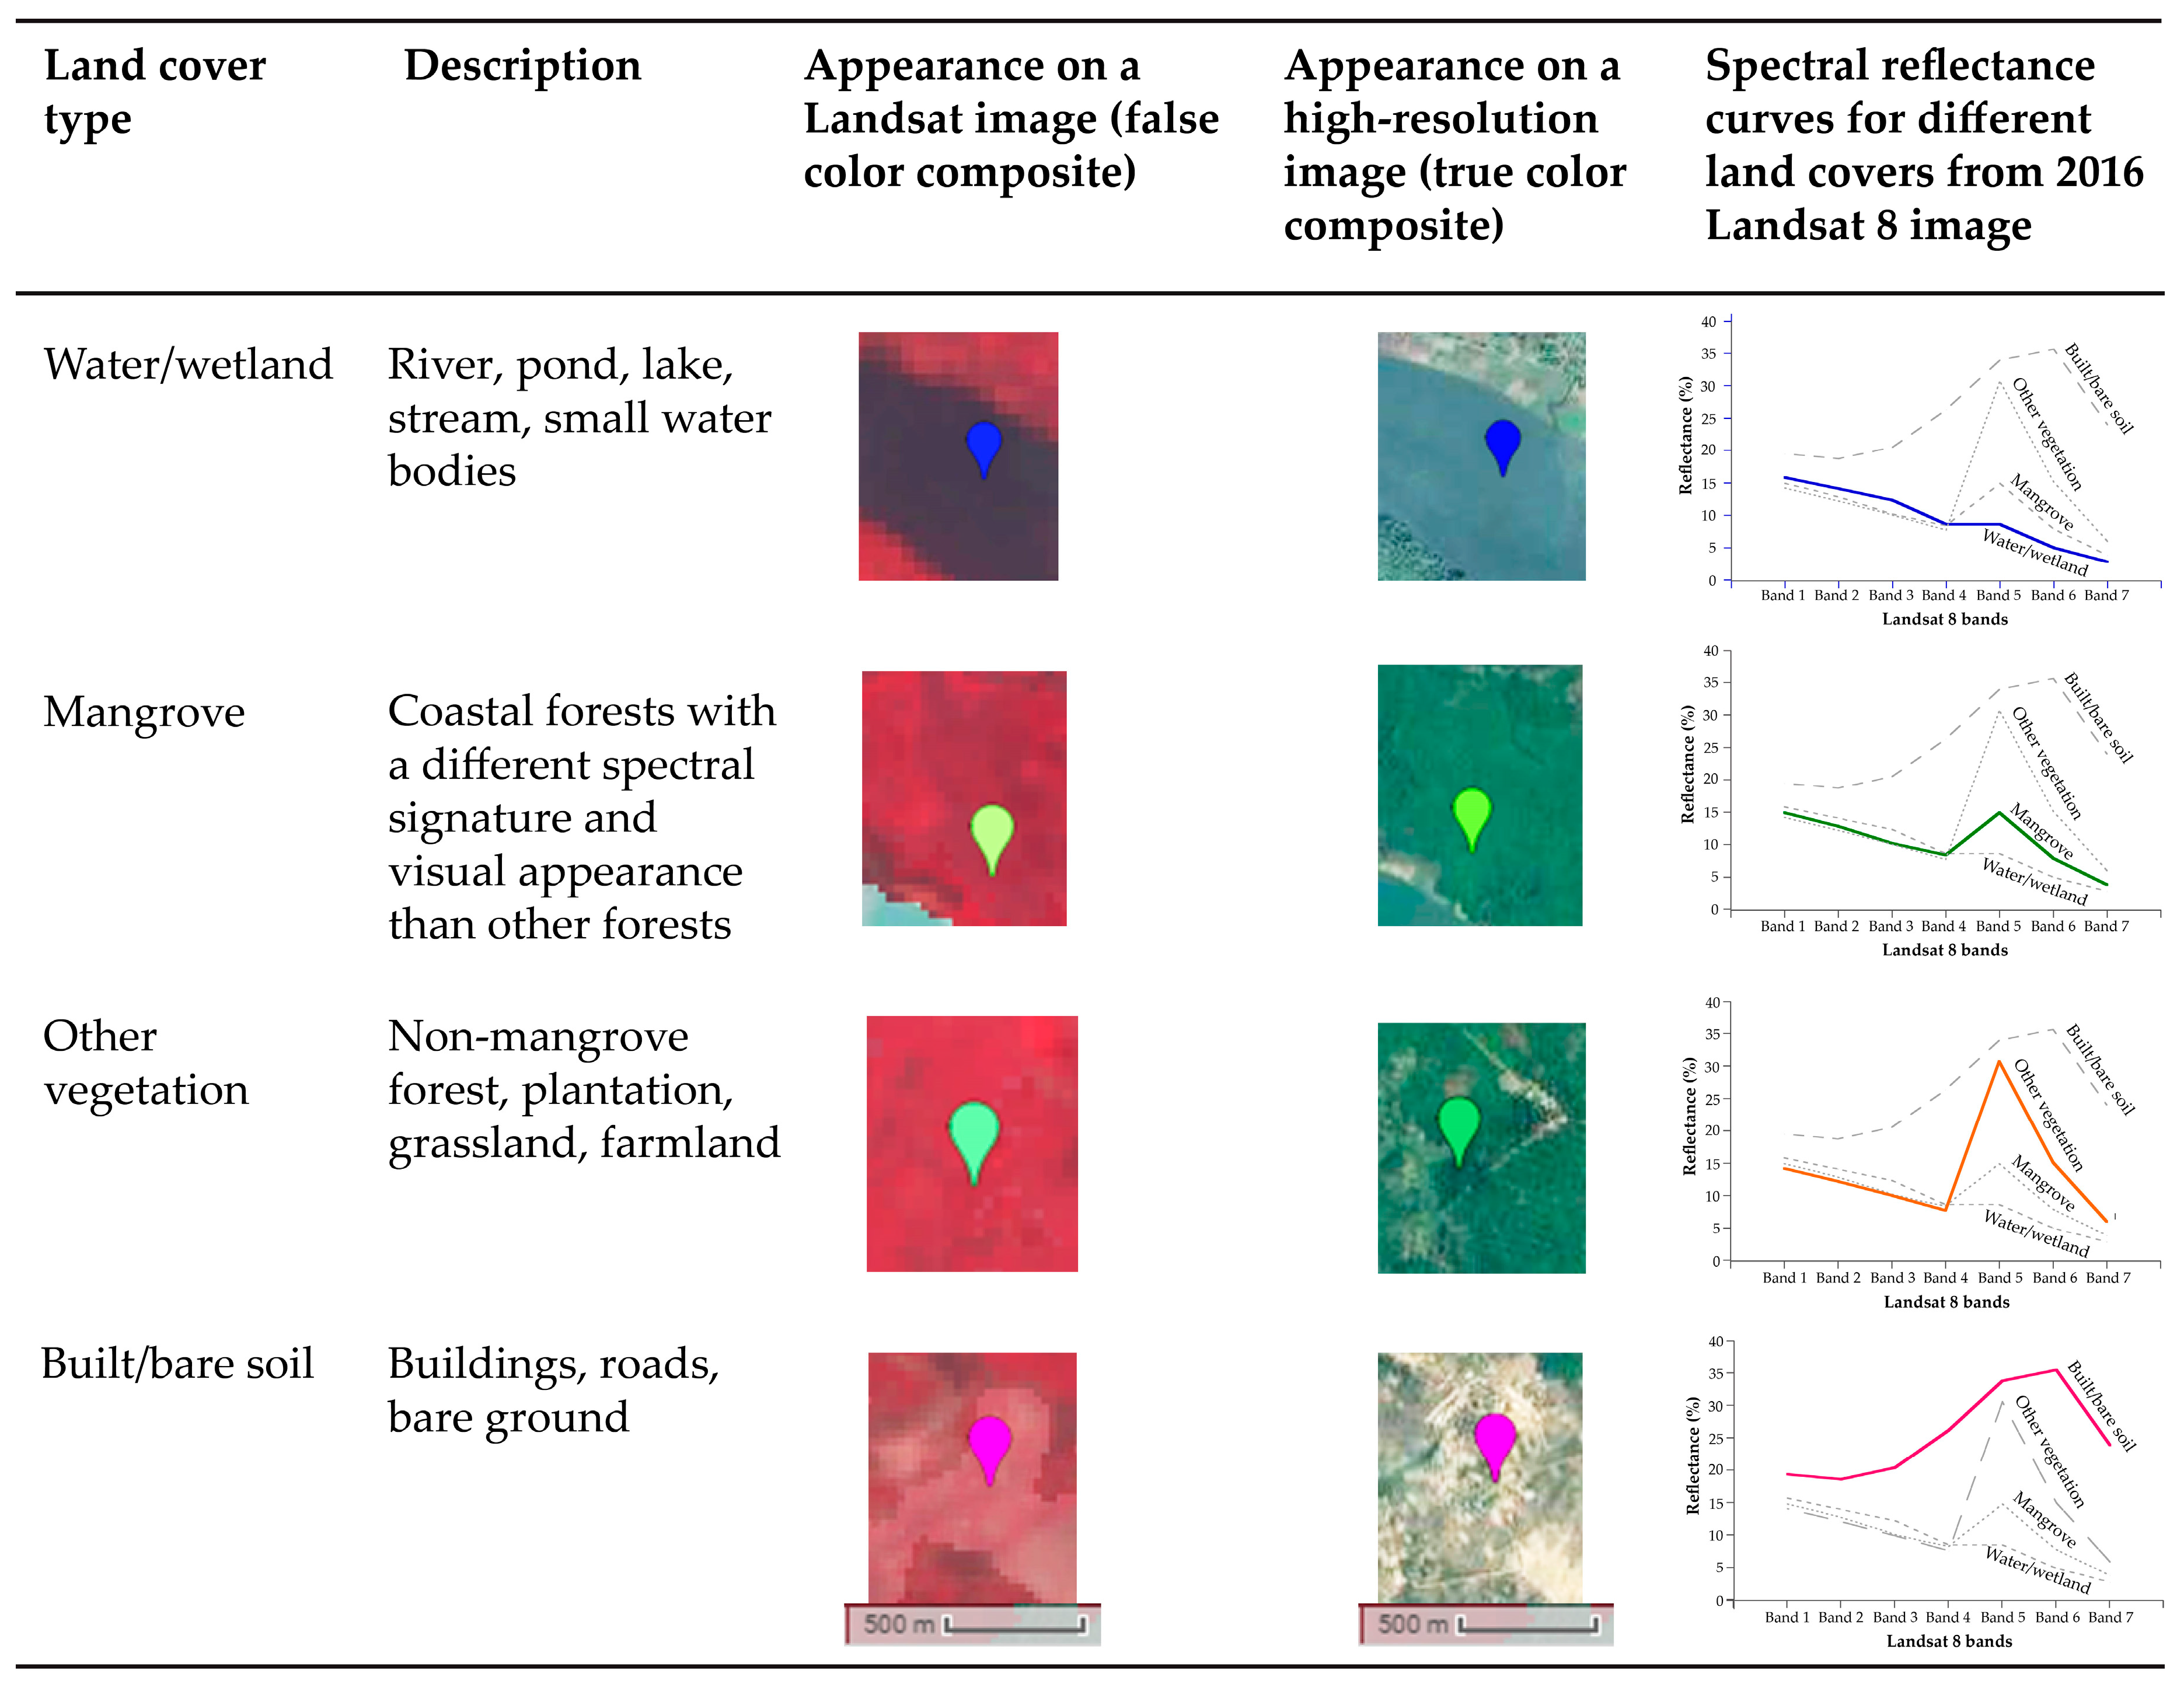
2.3. Land Cover Classification
3. Results
3.1. Accuracy Assessment
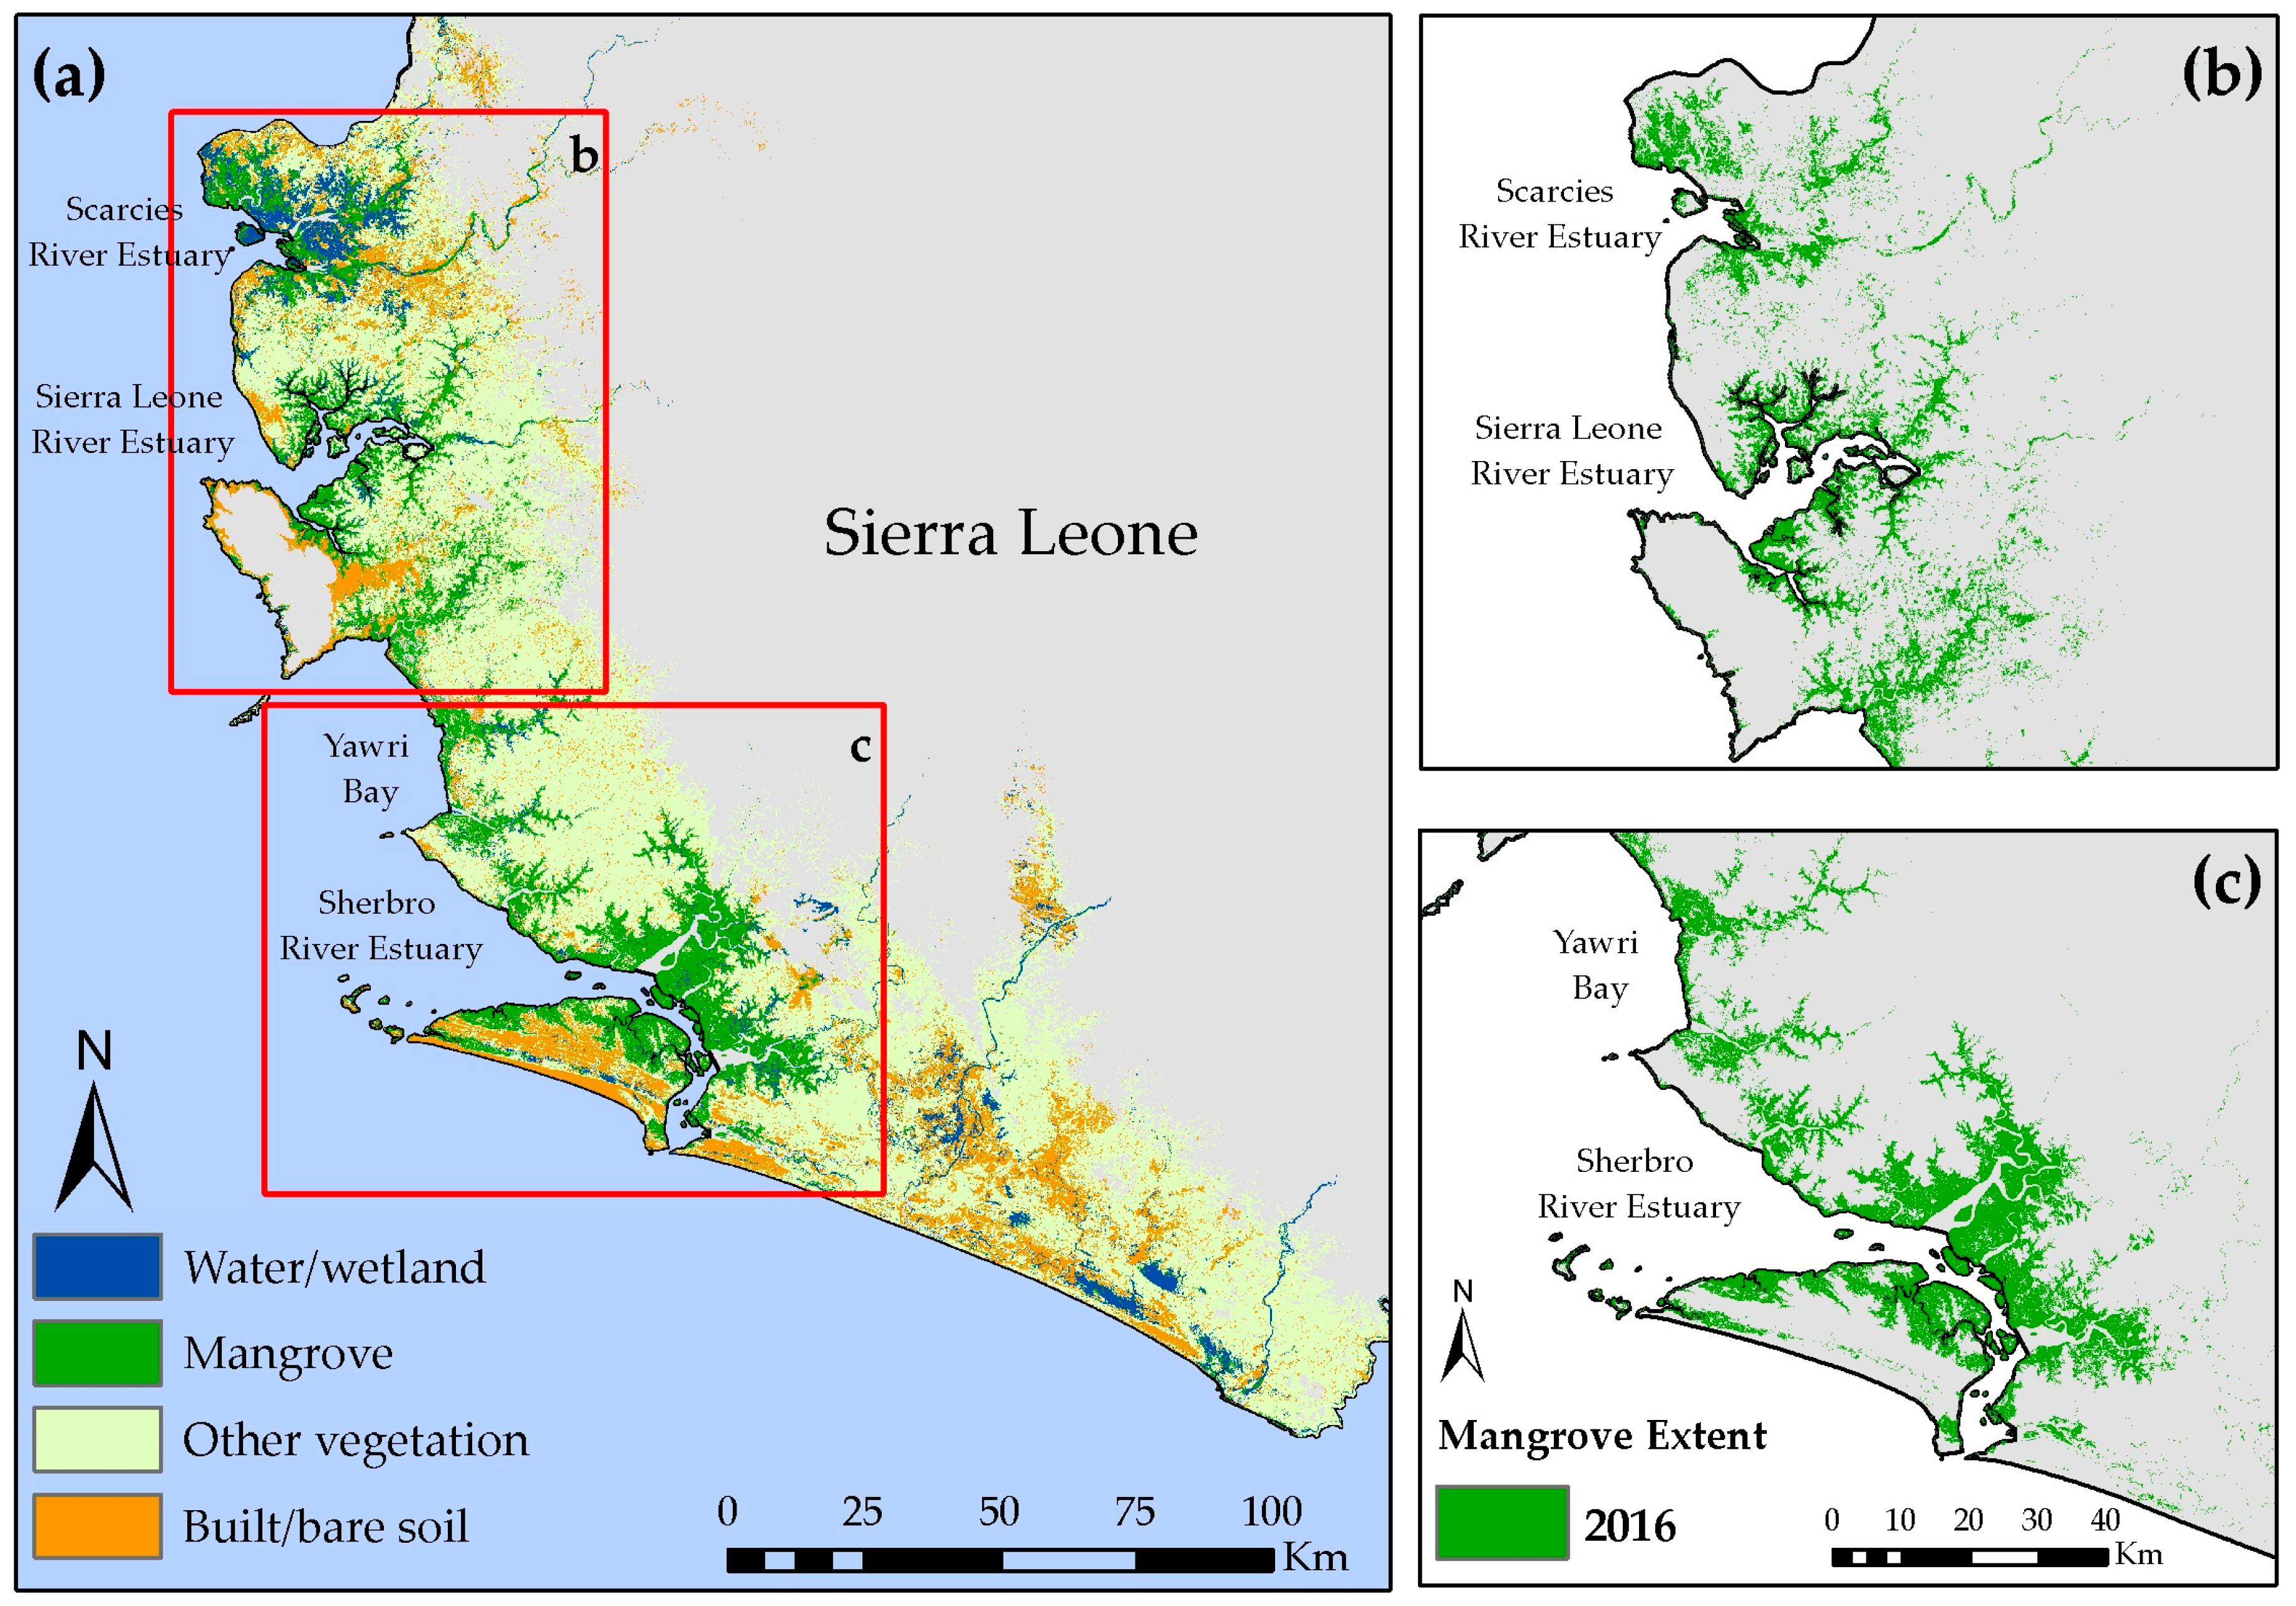
3.2. Estimated Mangrove Extents in 2016
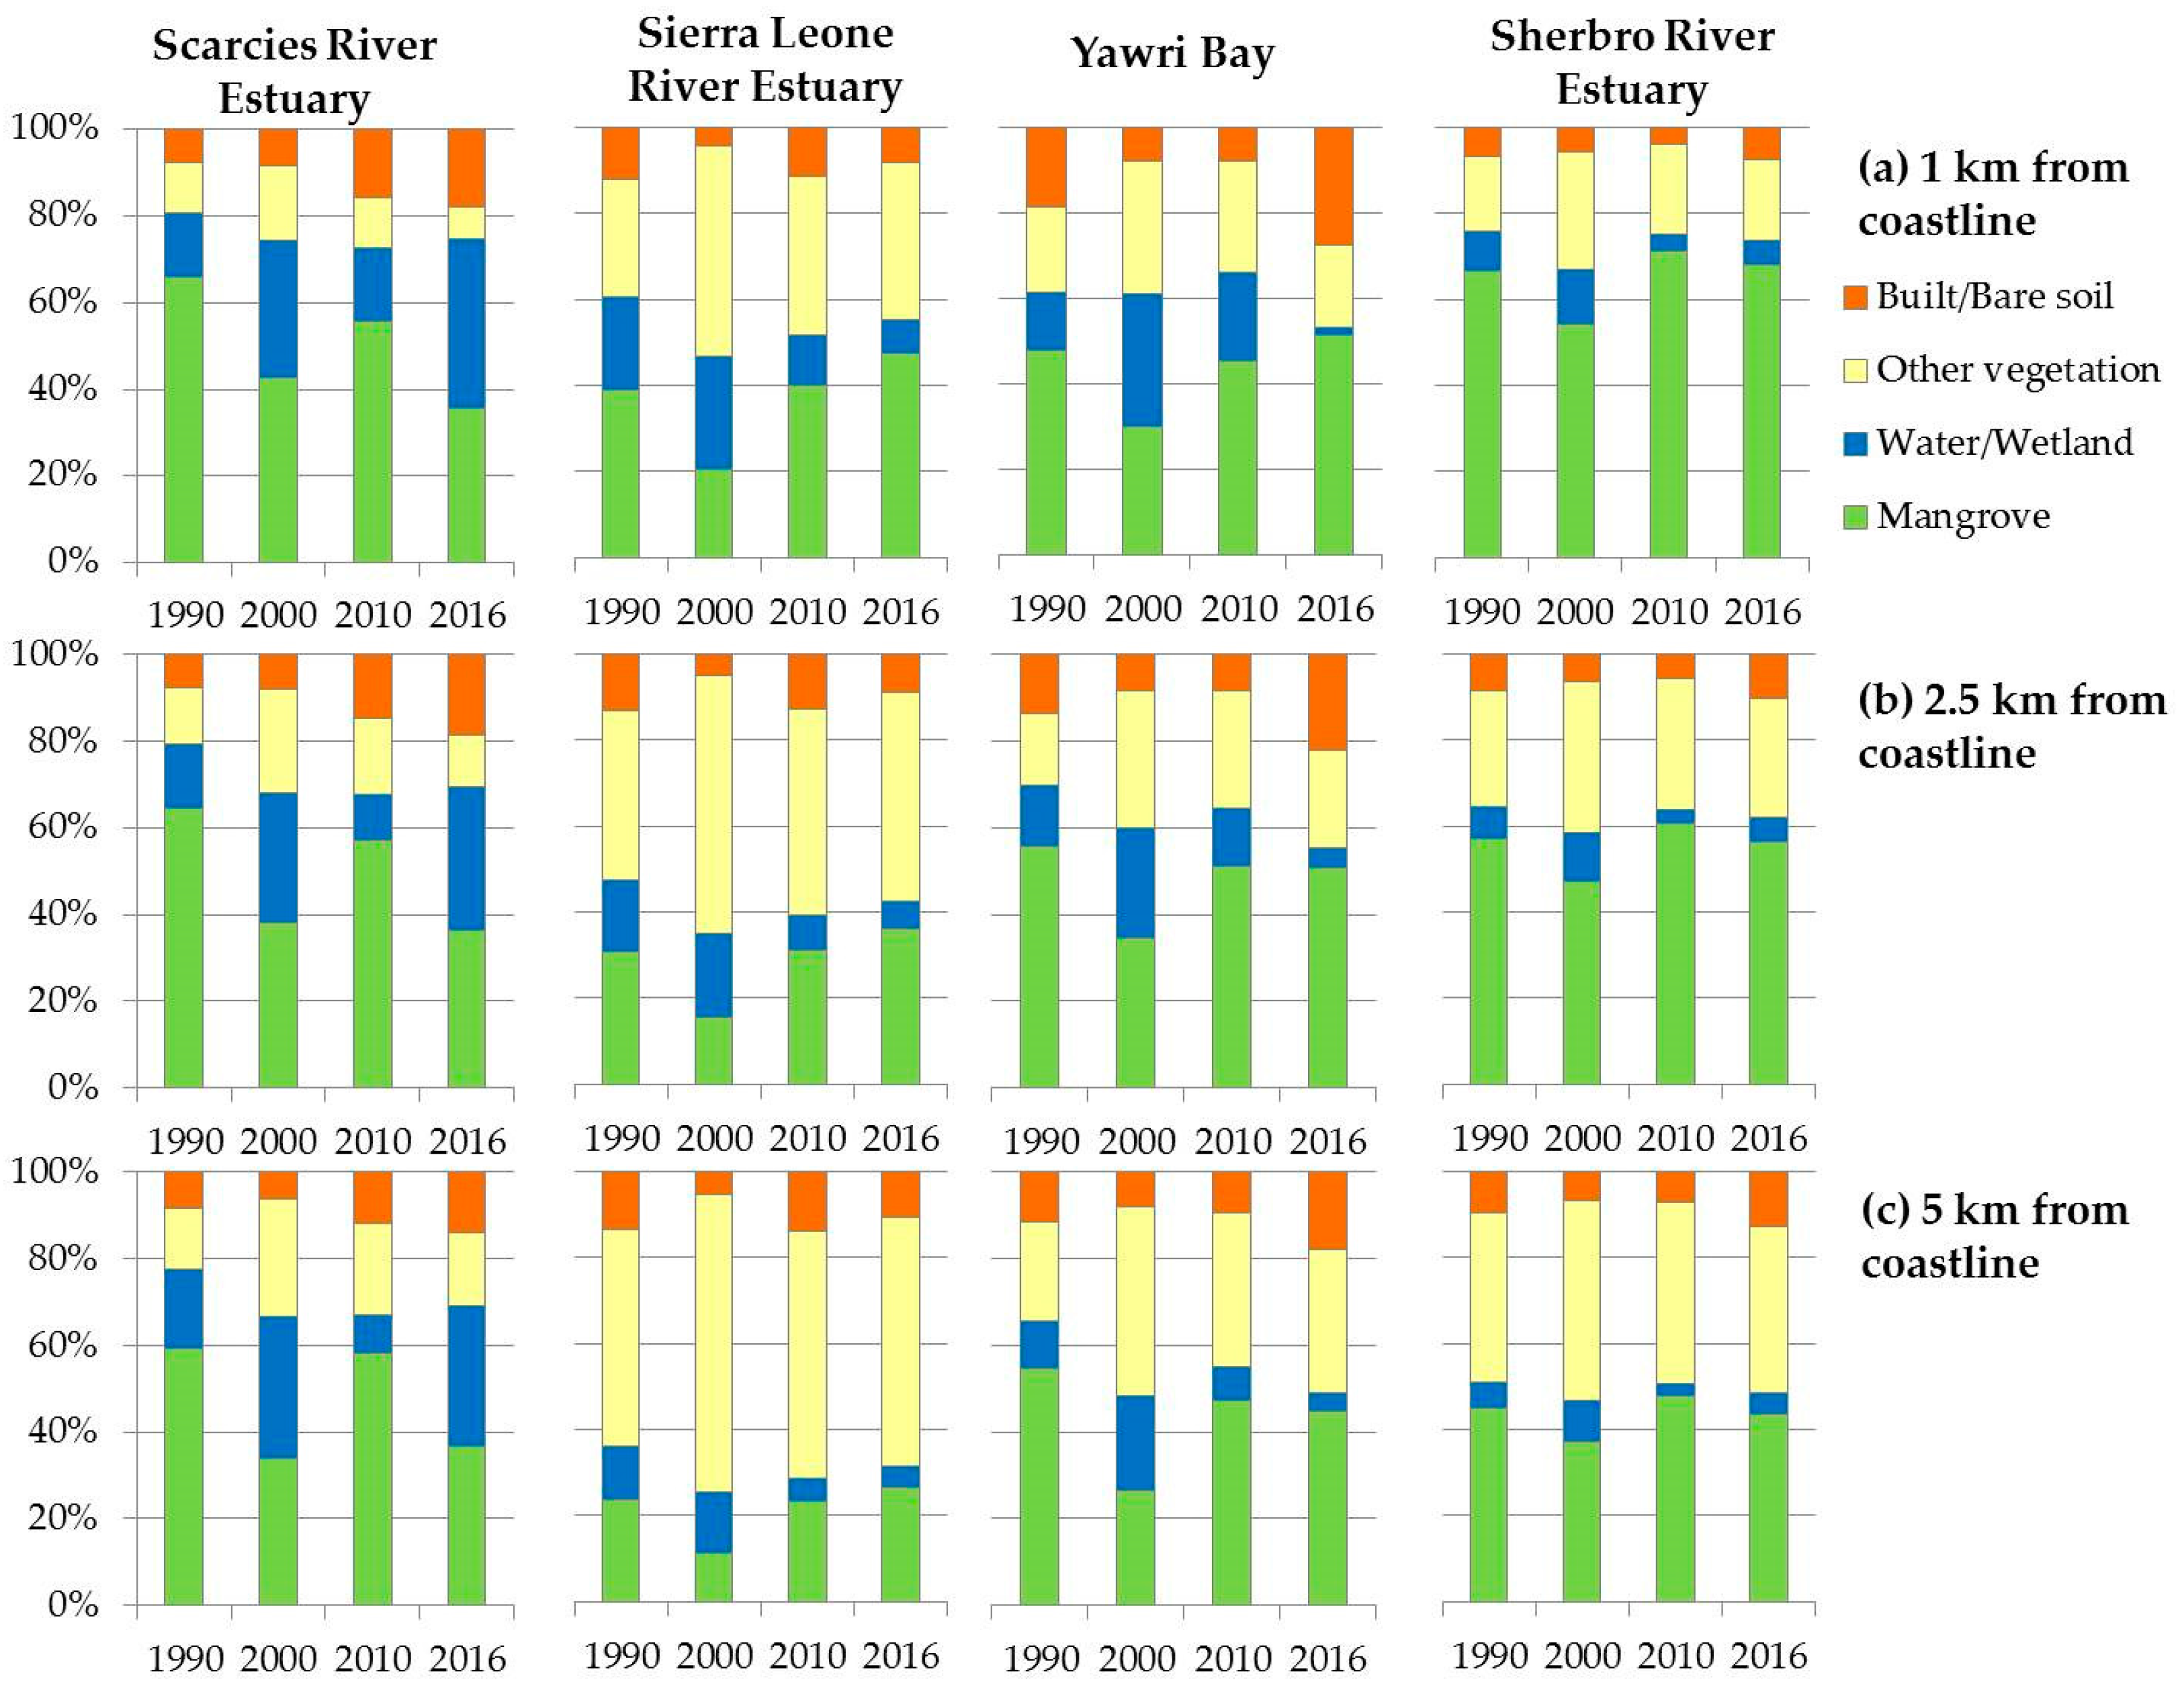
3.3. Land Cover Changes within the Focus Areas
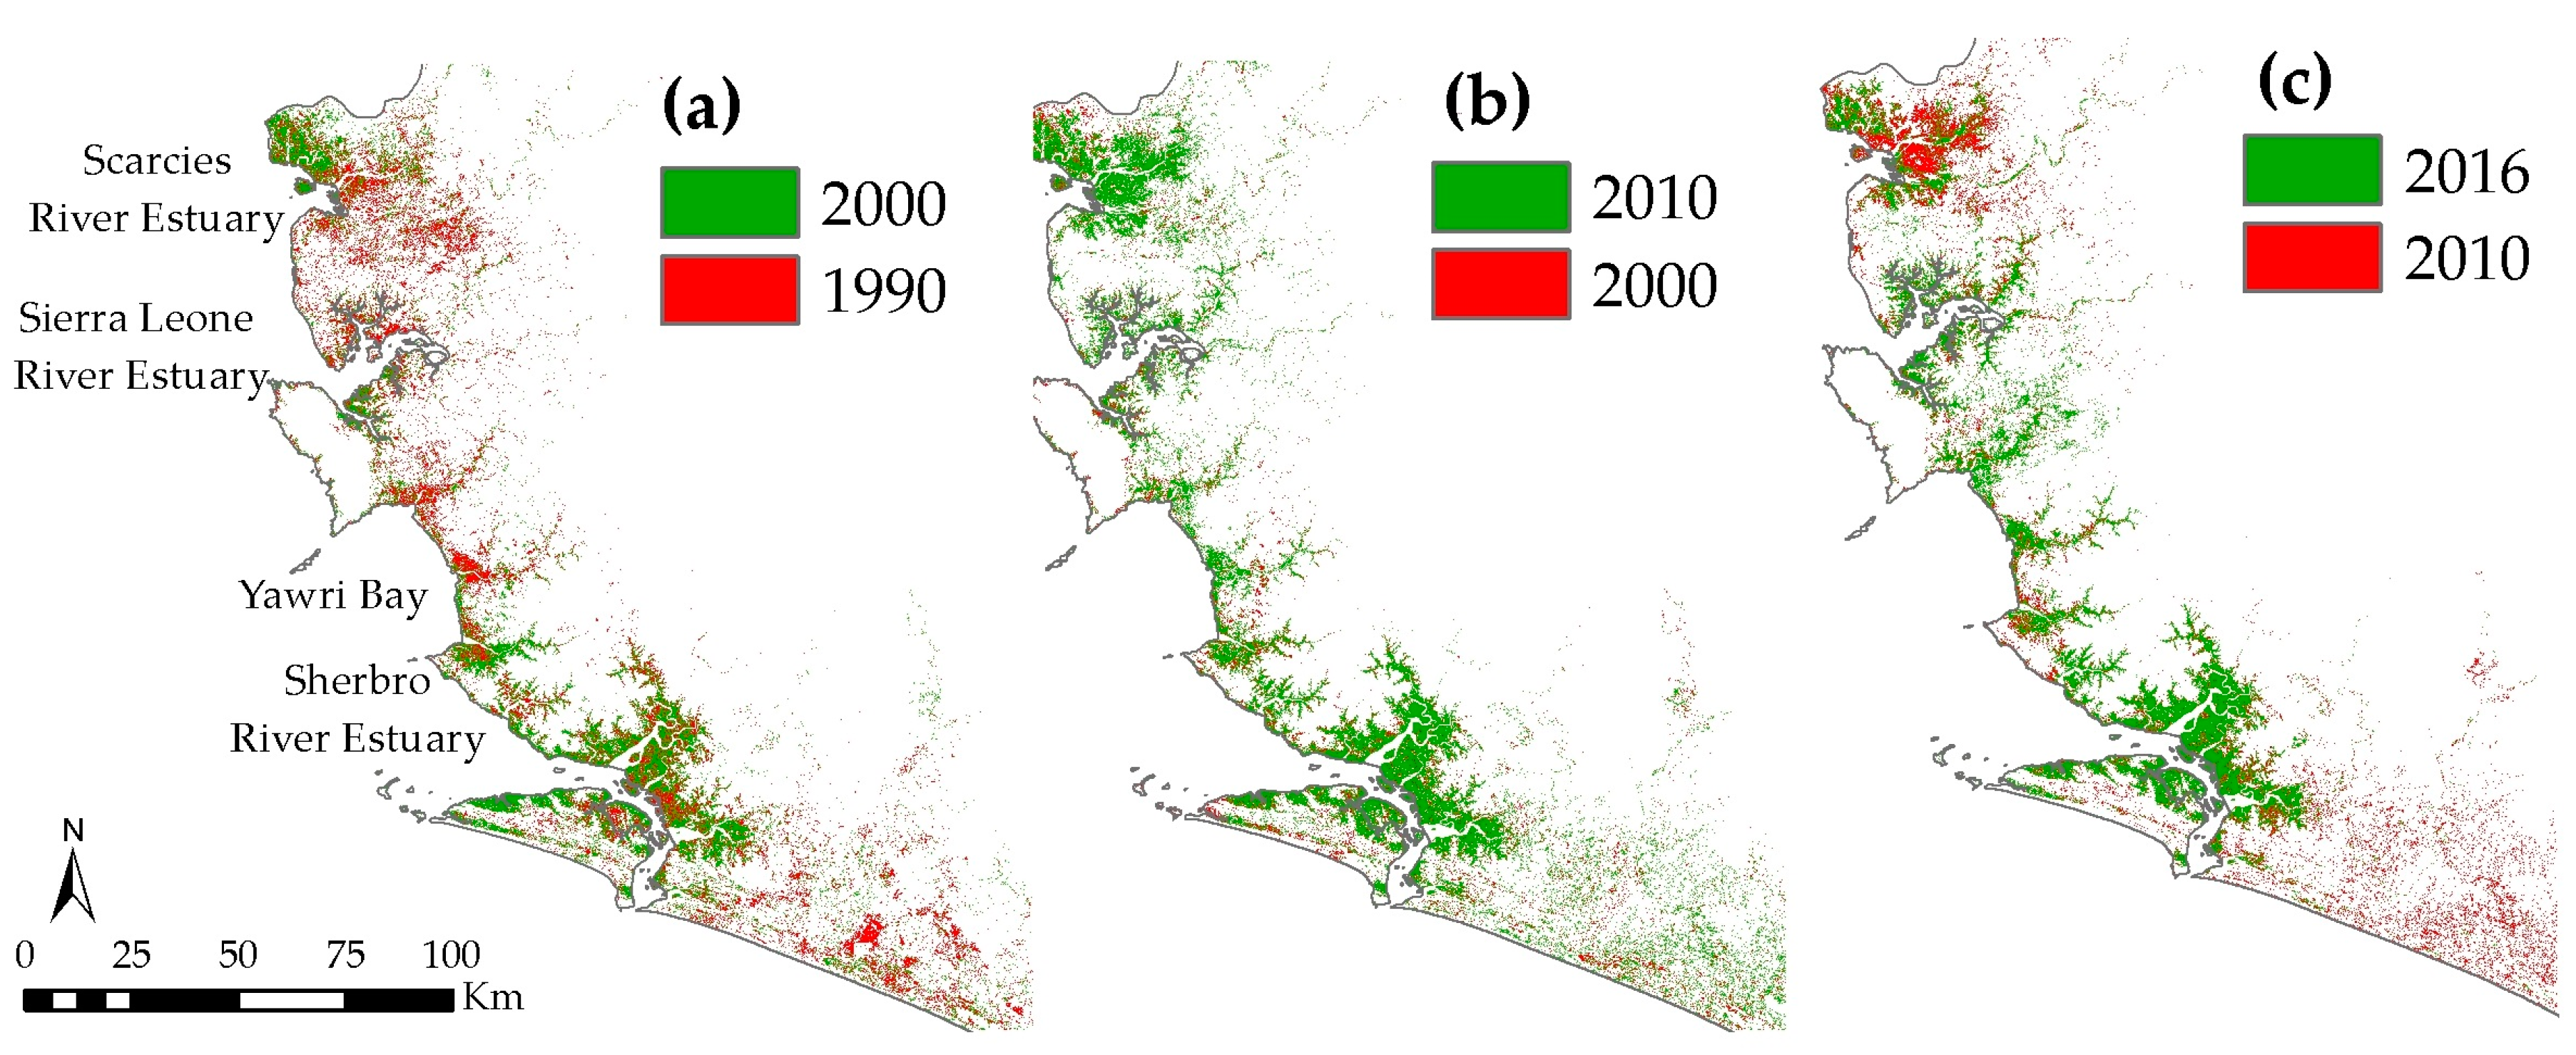
3.4. Spatiotemporal Changes in Mangrove Extents over the Last Three Decades
4. Discussion and Conclusions
Acknowledgments
Author Contributions
Conflicts of Interest
References
- Giri, C.; Ochieng, E.; Tieszen, L.L.; Zhu, Z.; Singh, A.; Loveland, T.; Masek, J.; Duke, N. Status and distribution of mangrove forests of the world using earth observation satellite data. Glob. Ecol. Biogeogr. 2011, 20, 154–159. [Google Scholar] [CrossRef]
- Murdiyarso, D.; Purbopuspito, J.; Kauffman, J.B.; Warren, M.W.; Sasmito, S.D.; Donato, D.C.; Manuri, S.; Krisnawati, H.; Taberima, S.; Kurnianto, S. The potential of Indonesian mangrove forests for global climate change mitigation. Nat. Clim. Chang. 2015, 5, 1089–1092. [Google Scholar] [CrossRef]
- Danielsen, F.; Sørensen, M.K.; Olwig, M.F.; Selvam, V.; Parish, F.; Burgess, N.D.; Hiraishi, T.; Karunagaran, V.M.; Rasmussen, M.S.; Hansen, L.B. The Asian tsunami: A protective role for coastal vegetation. Science 2005, 310, 643. [Google Scholar] [CrossRef] [PubMed]
- Kathiresan, K.; Rajendran, N. Coastal mangrove forests mitigated tsunami. Estuar. Coast. Shelf Sci. 2005, 65, 601–606. [Google Scholar] [CrossRef]
- FAO. The World’s Mangroves 1980–2005; FAO: Rome, Italy, 2007. [Google Scholar]
- Ellison, J.C. Climate Change Vulnerability Assessment and Adaptation Planning for Mangrove Systems; World Wildlife Fund (WWF): Washington, DC, USA, 2012. [Google Scholar]
- Blasco, F.; Gauquelin, T.; Rasolofoharinoro, M.; Denis, J.; Aizpuru, M.; Caldairou, V. Recent advances in mangrove studies using remote sensing data. Mar. Freshw. Res. 1998, 49, 287–296. [Google Scholar] [CrossRef]
- Giri, C. Observation and Monitoring of Mangrove Forests Using Remote Sensing: Opportunities and Challenges. Remote Sens. 2016, 8, 783. [Google Scholar] [CrossRef]
- Heumann, B.W. Satellite remote sensing of mangrove forests: Recent advances and future opportunities. Prog. Phys. Geogr. 2011, 35, 87–108. [Google Scholar] [CrossRef]
- Almahasheer, H.; Aljowair, A.; Duarte, C.M.; Irigoien, X. Decadal stability of Red Sea mangroves. Estuar. Coast. Shelf Sci. 2016, 169, 164–172. [Google Scholar] [CrossRef]
- Dan, T.T.; Chen, C.F.; Chiang, S.H.; Ogawa, S. Mapping and change analysis in mangrove forest by using Landsat imagery. In Xxiii Isprs Congress, Commission Viii; Halounova, L., Safar, V., Raju, P.L.N., Planka, L., Zdimal, V., Kumar, T.S., Faruque, F.S., Kerr, Y., Ramasamy, S.M., Comiso, J., et al., Eds.; Copernicus Gesellschaft MBH: Gottingen, Germany, 2016; Volume 3, pp. 109–116. [Google Scholar]
- Dutta, D.; Das, P.K.; Paul, S.; Sharma, J.R.; Dadhwal, V.K. Assessment of ecological disturbance in the mangrove forest of Sundarbans caused by cyclones using MODIS time-series data (2001–2011). Nat. Hazards 2015, 79, 775–790. [Google Scholar] [CrossRef]
- Dutta, D.; Das, P.K.; Paul, S.; Sharma, J.R.; Dhadwal, V.K. Spatio-temporal assessment of ecological disturbance and its intensity in the mangrove forest using MODIS derived disturbance index. In ISPRS Technical Commission Viii Symposium; Dadhwal, V.K., Diwakar, P.G., Seshasai, M.V.R., Raju, P.L.N., Hakeem, A., Eds.; Copernicus Gesellschaft MBH: Gottingen, Germany, 2014; Volume XL-8, pp. 555–559. [Google Scholar]
- Fatoyinbo, T.E.; Simard, M.; Washington-Allen, R.A.; Shugart, H.H. Landscape-scale extent, height, biomass, and carbon estimation of Mozambique’s mangrove forests with Landsat ETM+ and Shuttle Radar Topography Mission elevation data. J. Geophys. Res. Biogeosci. 2008, 113. [Google Scholar] [CrossRef]
- Fromard, F.; Vega, C.; Proisy, C. Half a century of dynamic coastal change affecting mangrove shorelines of French Guiana. A case study based on remote sensing data analyses and field surveys. Mar. Geol. 2004, 208, 265–280. [Google Scholar] [CrossRef]
- Ghosh, M.K.; Kumar, L.; Roy, C. Mapping Long-Term Changes in Mangrove Species Composition and Distribution in the Sundarbans. Forests 2016, 7, 305. [Google Scholar] [CrossRef]
- Giri, C.; Long, J.; Abbas, S.; Murali, R.M.; Qamer, F.M.; Pengra, B.; Thau, D. Distribution and dynamics of mangrove forests of South Asia. J. Environ. Manag. 2015, 148, 101–111. [Google Scholar] [CrossRef] [PubMed]
- Giri, C.; Muhlhausen, J. Mangrove forest distributions and dynamics in Madagascar (1975–2005). Sensors 2008, 8, 2104–2117. [Google Scholar] [CrossRef] [PubMed]
- Hamilton, S. Assessing the role of commercial aquaculture in displacing mangrove forest. Bull. Mar. Sci. 2013, 89, 585–601. [Google Scholar] [CrossRef]
- Hirata, Y.; Tabuchi, R.; Patanaponpaiboon, P.; Poungparn, S.; Yoneda, R.; Fujioka, Y. Estimation of aboveground biomass in mangrove forests using high-resolution satellite data. J. For. Res. 2014, 19, 34–41. [Google Scholar] [CrossRef]
- Kamal, M.; Phinn, S.; Johansen, K. Object-Based Approach for Multi-Scale Mangrove Composition Mapping Using Multi-Resolution Image Datasets. Remote Sens. 2015, 7, 4753–4783. [Google Scholar] [CrossRef]
- Kamthonkiat, D.; Rodfai, C.; Saiwanrungkul, A.; Koshimura, S.; Matsuoka, M. Geoinformatics in mangrove monitoring: Damage and recovery after the 2004 Indian Ocean tsunami in Phang Nga, Thailand. Nat. Hazards Earth Syst. Sci. 2011, 11, 1851–1862. [Google Scholar] [CrossRef]
- Kanniah, K.D.; Sheikhi, A.; Cracknell, A.P.; Goh, H.C.; Tan, K.P.; Ho, C.S.; Rasli, F.N. Satellite Images for Monitoring Mangrove Cover Changes in a Fast Growing Economic Region in Southern Peninsular Malaysia. Remote Sens. 2015, 7, 14360–14385. [Google Scholar] [CrossRef]
- Kirui, K.B.; Kairo, J.G.; Bosire, J.; Viergever, K.M.; Rudra, S.; Huxham, M.; Briers, R.A. Mapping of mangrove forest land cover change along the Kenya coastline using Landsat imagery. Ocean Coast. Manag. 2013, 83, 19–24. [Google Scholar] [CrossRef]
- Kovacs, J.M.; de Santiago, F.F.; Bastien, J.; Lafrance, P. An Assessment of Mangroves in Guinea, West Africa, Using a Field and Remote Sensing Based Approach. Wetlands 2010, 30, 773–782. [Google Scholar] [CrossRef]
- Kuenzer, C.; van Beijma, S.; Gessner, U.; Dech, S. Land surface dynamics and environmental challenges of the Niger Delta, Africa: Remote sensing-based analyses spanning three decades (1986–2013). Appl. Geogr. 2014, 53, 354–368. [Google Scholar] [CrossRef]
- Leimgruber, P.; Kelly, D.S.; Steininger, M.K.; Brunner, J.; Muller, T.; Songer, M. Forest cover change patterns in Myanmar (Burma) 1990–2000. Environ. Conserv. 2005, 32, 356–364. [Google Scholar] [CrossRef]
- LeMarie, M.; van der Zaag, P.; Menting, G.; Bacluete, E.; Schotanus, D. The use of remote sensing for monitoring environmental indicators: The case of the Incomati estuary, Mozambique. Phys. Chem. Earth 2006, 31, 857–863. [Google Scholar] [CrossRef]
- Liu, K.; Liu, L.; Liu, H.X.; Li, X.; Wang, S.G. Exploring the effects of biophysical parameters on the spatial pattern of rare cold damage to mangrove forests. Remote Sens. Environ. 2014, 150, 20–33. [Google Scholar] [CrossRef]
- Macamo, C.C.F.; Massuanganhe, E.; Nicolau, D.K.; Bandeira, S.O.; Adams, J.B. Mangrove’s response to cyclone Eline (2000): What is happening 14 years later. Aquat. Bot. 2016, 134, 10–17. [Google Scholar] [CrossRef]
- Manna, S.; Mondal, P.P.; Mukhopadhyay, A.; Akhand, A.; Hazra, S.; Mitra, D. Vegetation cover change analysis from multi-temporal satellite data in Jharkhali Island, Sundarbans, India. Indian J. Geo-Mar. Sci. 2013, 42, 331–342. [Google Scholar]
- Misra, A.; Murali, R.M.; Vethamony, P. Assessment of the land use/land cover (LU/LC) and mangrove changes along the Mandovi-Zuari estuarine complex of Goa, India. Arab. J. Geosci. 2015, 8, 267–279. [Google Scholar] [CrossRef]
- Monzon, A.K.; Reyes, S.R.; Veridiano, R.K.; Tumaneng, R.; De Alban, J.D. Synergy of optical and SAR data for mapping and monitoring mangroves. In XXIII ISPRS Congress, Commission VI; Halounova, L., Safar, V., Gong, J., Hanzl, V., Wu, H., Vyas, A., Wang, L., Musikhin, I., Tsai, F., Gruen, A., et al., Eds.; Copernicus Gesellschaft MBH: Gottingen, Germany, 2016; Volume 41, pp. 259–266. [Google Scholar]
- Omo-Irabor, O.O.; Olobaniyi, S.B.; Akunna, J.; Venus, V.; Maina, J.M.; Paradzayi, C. Mangrove vulnerability modelling in parts of Western Niger Delta, Nigeria using satellite images, GIS techniques and Spatial Multi-Criteria Analysis (SMCA). Environ. Monit. Assess. 2011, 178, 39–51. [Google Scholar] [CrossRef] [PubMed]
- Otero, V.; Quisthoudt, K.; Koedam, N.; Dahdouh-Guebas, F. Mangroves at Their Limits: Detection and Area Estimation of Mangroves along the Sahara Desert Coast. Remote Sens. 2016, 8, 512. [Google Scholar] [CrossRef]
- Reddy, C.S.; Satish, K.V.; Pasha, S.V.; Jha, C.S.; Dadhwal, V.K. Assessment and monitoring of deforestation and land-use changes (1976–2014) in Andaman and Nicobar Islands, India using remote sensing and GIS. Curr. Sci. 2016, 111, 1492–1499. [Google Scholar] [CrossRef]
- Salami, A.T.; Akinyede, J.; de Gier, A. A preliminary assessment of NigeriaSat-1 for sustainable mangrove forest monitoring. Int. J. Appl. Earth Obs. Geoinf. 2010, 12, S18–S22. [Google Scholar] [CrossRef]
- Seto, K.C.; Fragkias, M. Mangrove conversion and aquaculture development in Vietnam: A remote sensing-based approach for evaluating the Ramsar Convention on Wetlands. Glob. Environ. Chang. 2007, 17, 486–500. [Google Scholar] [CrossRef]
- Shapiro, A.C.; Trettin, C.C.; Kuchly, H.; Alavinapanah, S.; Bandeira, S. The Mangroves of the Zambezi Delta: Increase in Extent Observed via Satellite from 1994 to 2013. Remote Sens. 2015, 7, 16504–16518. [Google Scholar] [CrossRef]
- Wang, L.; Sousa, W.P.; Gong, P. Integration of object-based and pixel-based classification for mapping mangroves with IKONOS imagery. Int. J. Remote Sens. 2004, 25, 5655–5668. [Google Scholar] [CrossRef]
- Hamilton, S.E.; Casey, D. Creation of a high spatio-temporal resolution global database of continuous mangrove forest cover for the 21st century (CGMFC-21). Glob. Ecol. Biogeogr. 2016, 25, 729–738. [Google Scholar] [CrossRef]
- Olson, D.M.; Dinerstein, E.; Wikramanayake, E.D.; Burgess, N.D.; Powell, G.V.N.; Underwood, E.C.; D’amico, J.A.; Itoua, I.; Strand, H.E.; Morrison, J.C.; et al. Terrestrial ecoregions of the world: A new map of life on earth: A new global map of terrestrial ecoregions provides an innovative tool for conserving biodiversity. BioScience 2001, 51, 933–938. [Google Scholar] [CrossRef]
- Spalding, M.; Kainuma, M.; Collins, L. World Atlas of Mangroves; Earthscan: London, UK, 2010. [Google Scholar]
- Hansen, M.C.; Potapov, P.V.; Moore, R.; Hancher, M.; Turubanova, S.A.; Tyukavina, A.; Thau, D.; Stehman, S.V.; Goetz, S.J.; Loveland, T.R.; et al. High-resolution global maps of 21st-century forest cover change. Science 2013, 342, 850–853. [Google Scholar] [CrossRef] [PubMed]
- Fatoyinbo, T.E.; Simard, M. Height and biomass of mangroves in Africa from ICESat/GLAS and SRTM. Int. J. Remote Sens. 2013, 34, 668–681. [Google Scholar] [CrossRef]
- World Bank. World Development Indicators. Available online: http://databank.worldbank.org/data/reports.aspx?source=2&country=SLE (accessed on 31 July 2017).
- Blinker, L. Country Environment Profile (CEP) Sierra Leone; European Commission: Cardiff, UK, 2006. [Google Scholar]
- GoSL (Government of Sierra Leone). Conservation and Wildlife Policy 2010; Government of Sierra Leone: Freetown, Sierra Leone, 2010.
- Heymans, J.J.; Vakily, J.M. Structure and Dynamics of the Marine Ecosystem off Sierra Leone for Three Time Periods: 1964, 1978, 1990; Fisheries Centre, UBC: Vancouver, BC, Canada, 2004. [Google Scholar]
- GCLME (Guinea Current Large Marine Ecosystem). Regional Coordinating Unit. In Towards Ecosystem-Based Management of the Guinea Current Large Marine Ecosystem; United Nations Development Programme (UNDP): New York, NY, USA, 2013. [Google Scholar]
- IUCN. Strategies for Conservation and Sustainable Management of Mangrove Forest in Sierra Leone; IUCN: Gland, Switzerland, 2007. [Google Scholar]
- Trzaska, S.; de Sherbinin, A.; Kim-Blanco, P.; Mara, V.; Schnarr, E.; Jaiteh, M.; Mondal, P. Climate Change Vulnerability Assessment in Mangrove Regions of Sierra Leone; USAID: Washington, DC, USA, 2017. Available online: http://www.ciesin.columbia.edu/wa-bicc/wa-bicc-ccva-abridged-ff.pdf (accessed on 20 December 2017).
- Chander, G.; Markham, B.L.; Helder, D.L. Summary of current radiometric calibration coefficients for Landsat MSS, TM, ETM+, and EO-1 ALI sensors. Remote Sens. Environ. 2009, 113, 893–903. [Google Scholar] [CrossRef]
- Zhu, Z.; Wang, S.; Woodcock, C.E. Improvement and expansion of the Fmask algorithm: Cloud, cloud shadow, and snow detection for Landsats 4–7, 8, and Sentinel 2 images. Remote Sens. Environ. 2015, 159, 269–277. [Google Scholar] [CrossRef]
- Zhu, Z.; Woodcock, C.E. Object-based cloud and cloud shadow detection in Landsat imagery. Remote Sens. Environ. 2012, 118, 83–94. [Google Scholar] [CrossRef]
- GitHub. fmask. Available online: https://github.com/prs021/fmask (accessed on 31 July 2017).
- Arthur, D.; Vassilvitskii, S. k-means++: The advantages of careful seeding. In Proceedings of the eighteenth Annual ACM-SIAM Symposium on Discrete Algorithms, Society for Industrial and Applied Mathematics, New Orleans, Louisiana, 7–9 January 2007; pp. 1027–1035. [Google Scholar]

| Dataset | Source | Brief Description | Area (km2) |
|---|---|---|---|
| MFW | Giri et al., 2011 [1] | Landsat-derived discrete classification | 1564.96 |
| - | Fatoyinbo and Simard, 2013, [45] | Landsat-derived discrete classification | 955 |
| - | FAO, 2007 [5] | Country-specific reports based on their own classification system | 1053 |
| CGMFC-21—Revised MFW | Hamilton and Casey, 2016 [41] | Integration of discrete MFW dataset and continuous Global Forest Cover (GFC) dataset | 655.67 |
| CGMFC-21—Revised Terrestrial Ecoregions of the World (TEOW) | Hamilton and Casey, 2016 [41] | Integration of discrete TEOW dataset and continuous Global Forest Cover (GFC) dataset | 2917.01 |
| Sensor | Study Period | Image Dates | No. of Total Images |
|---|---|---|---|
| Landsat 8 | 2016 | December 2015–May 2016 | 99 |
| Landsat 5 | 2010 | November 2009–May 2010 | 46 |
| Landsat 7 | 2000 | November 1999–December 2000 | 120 |
| Landsat 5 | 1990 | November 1989–December 1990 | 34 |
| Ground Truth | |||||
|---|---|---|---|---|---|
| Classified | Water/Wetland | Mangrove | Other Vegetation | Bare/Built | User’s Accuracy |
| Water/wetland | 46 | 1 | 0 | 0 | 98% |
| Mangrove | 4 | 143 | 0 | 3 | 95% |
| Other vegetation | 0 | 6 | 50 | 1 | 88% |
| Bare/built | 0 | 0 | 0 | 46 | 100% |
| Producer’s accuracy | 92% | 95% | 100% | 92% | 95% |
| Region | 1 km Buffer | 2.5 km Buffer | 5 km Buffer | |||
|---|---|---|---|---|---|---|
| Mangrove Area (sq. km) | Relative Mangrove Extent | Mangrove Area (sq. km) | Relative Mangrove Extent | Mangrove Area (sq. km) | Relative Mangrove Extent | |
| Scarcies River Estuary | 17.35 | 36% | 42.38 | 36% | 90.39 | 37% |
| Sierra Leone River Estuary | 160.71 | 48% | 249.01 | 36% | 290.55 | 26% |
| Yawri Bay | 15.43 | 51% | 55.05 | 51% | 113.98 | 45% |
| Sherbro River Estuary | 355.78 | 68% | 605.54 | 56% | 762.99 | 44% |
| Region | 1 km Buffer | 2.5 km Buffer | 5 km Buffer | ||||||
|---|---|---|---|---|---|---|---|---|---|
| 1990 | 2016 | Change (Relative Change) | 1990 | 2016 | Change (Relative Change) | 1990 | 2016 | Change (Relative Change) | |
| Scarcies River Estuary | 31.95 | 17.35 | −14.60 (−46%) | 73.43 | 42.38 | −31.05 (−42%) | 142.58 | 90.39 | −52.19 (−37%) |
| Sierra Leone River Estuary | 131.87 | 160.71 | 28.84 (22%) | 213.02 | 249.01 | 35.99 (17%) | 261.69 | 290.55 | 28.86 (11%) |
| Yawri Bay | 14.34 | 15.43 | 1.09 (8%) | 60.11 | 55.05 | −5.06 (−8%) | 138.30 | 113.98 | −24.32 (−18%) |
| Sherbro River Estuary | 336.82 | 355.78 | 18.96 (6%) | 591.48 | 605.54 | 14.06 (2%) | 768.26 | 762.99 | −5.27 (−1%) |
| 1990 | 2016 | Overall change (Relative change) | |||||||
| Sierra Leone coastal landscape complex | 2434.82 | 1834.32 | −600.5 (−25%) | ||||||
© 2017 by the authors. Licensee MDPI, Basel, Switzerland. This article is an open access article distributed under the terms and conditions of the Creative Commons Attribution (CC BY) license (http://creativecommons.org/licenses/by/4.0/).
Share and Cite
Mondal, P.; Trzaska, S.; De Sherbinin, A. Landsat-Derived Estimates of Mangrove Extents in the Sierra Leone Coastal Landscape Complex during 1990–2016. Sensors 2018, 18, 12. https://doi.org/10.3390/s18010012
Mondal P, Trzaska S, De Sherbinin A. Landsat-Derived Estimates of Mangrove Extents in the Sierra Leone Coastal Landscape Complex during 1990–2016. Sensors. 2018; 18(1):12. https://doi.org/10.3390/s18010012
Chicago/Turabian StyleMondal, Pinki, Sylwia Trzaska, and Alex De Sherbinin. 2018. "Landsat-Derived Estimates of Mangrove Extents in the Sierra Leone Coastal Landscape Complex during 1990–2016" Sensors 18, no. 1: 12. https://doi.org/10.3390/s18010012