Guiding Ketogenic Diet with Breath Acetone Sensors
by
 ,
,
Andreas T. Güntner
1,* ,
,
Julia F. Kompalla
1,
Henning Landis
1,
S. Jonathan Theodore
1,
Bettina Geidl
2,
Noriane A. Sievi
3,
Malcolm Kohler
3,
Sotiris E. Pratsinis
1 and
Philipp A. Gerber
2,* 1
Particle Technology Laboratory, Department of Mechanical and Process Engineering, ETH Zurich, CH-8092 Zurich, Switzerland
2
Department of Endocrinology, Diabetes, and Clinical Nutrition, University Hospital Zurich, CH-8091 Zurich, Switzerland
3
Department of Pulmonology, University Hospital Zurich, CH-8091 Zurich, Switzerland
*
Authors to whom correspondence should be addressed.
Sensors 2018, 18(11), 3655; https://doi.org/10.3390/s18113655
Submission received: 8 October 2018
/
Revised: 22 October 2018
/
Accepted: 22 October 2018
/
Published: 28 October 2018
(This article belongs to the Special Issue Functional Materials for the Applications of Advanced Gas Sensors)
Abstract
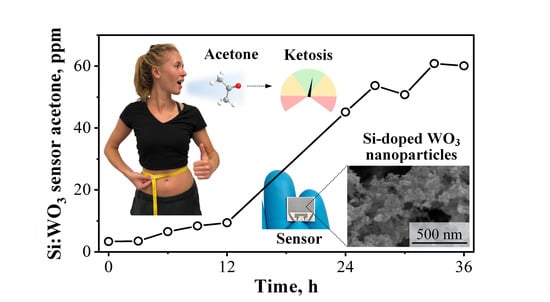
:Ketogenic diet (KD; high fat, low carb) is a standard treatment for obesity, neurological diseases (e.g., refractory epilepsy) and a promising method for athletes to improve their endurance performance. Therein, the level of ketosis must be regulated tightly to ensure an effective therapy. Here, we introduce a compact and inexpensive breath sensor to monitor ketosis online and non-invasively. The sensor consists of Si-doped WO3 nanoparticles that detect breath acetone selectively with non-linear response characteristics in the relevant range of 1 to 66 ppm, as identified by mass spectrometry. When tested on eleven subjects (five women and six men) undergoing a 36-h KD based on the Johns Hopkins protocol, this sensor clearly recognizes the onset and progression of ketosis. This is in good agreement to capillary blood β-hydroxybutyrate (BOHB) measurements. Despite similar dieting conditions, strong inter-subject differences in ketosis dynamics were observed and correctly identified by the sensor. These even included breath acetone patterns that could be linked to low tolerance to that diet. As a result, this portable breath sensor represents an easily applicable and reliable technology to monitor KD, possibly during medical treatment of epilepsy and weight loss.
1. Introduction
Ketogenic diet (KD, high fat at low carbohydrate and low protein intake) is a proven medical treatment of refractory epilepsy (i.e., drug-resistant) [1] occurring in ~30% of the approx. 50 million epileptics worldwide [2]. Also, it is an effective therapy for weight loss [3] with growing interest for treating obesity-associated metabolic disorders [4] (e.g., diabetes [5] or fatty liver disease [6]), it acts anti-inflammatory [7] and is even beneficial for athletes to improve their endurance performance by altering fuel preference [8]. During KD, body energy consumption shifts from glucose as primary fuel to the production and use of ketone bodies [9] while only moderate protein intake should limit gluconeogenesis from amino acids [10]. In specific, acetoacetate (AcAc) is such a ketone body formed in the hepatic mitochondria after β-oxidation of fatty acids and further biochemical transformations (Figure 1a, box) [9]. Its rate of production is determined also by the availability of mitochondrial 3-hydroxy-3-methyl-glutaryl-coenzyme A (HMG-CoA) synthase induced by fasting, cyclic adenosine monophosphate (cAMP) and fatty acids [11]. Other ketones are β-hydroxybutyrate (BOHB) and volatile acetone obtained from AcAc by reversible enzymatic degradation and spontaneous decarboxylation, respectively [9].
During a KD, frequent monitoring is desired to assure the persistence of the ketogenic state. Currently, this is done primarily by measuring AcAc or BOHB in urine or blood [12]. Despite blood assay’s accuracy, it is not ideal for frequent monitoring due to its invasiveness and cost. The urine assay also has drawbacks, in particular, its low precision due to varying factors such as patients’ hydration and acid-base balance [13]. Exhaled acetone measurement is a promising alternative, with breath being always accessible in a non-invasive manner [14]. In fact, measurements on 12 healthy adults revealed increasing breath acetone levels from average 0.7 to 2.5 ppm after a 12-h KD correlating well with plasma BOHB and urinary AcAc [12], a similar trend as observed in other studies [15]. This is even more pronounced in epileptic children that may follow a KD for several months, reaching breath acetone concentrations >100 ppm [16]. Most importantly, all studies reported strong inter-subject differences in ketogenic profiles at the same dietary conditions [12,15,16] highlighting the need for frequent and individual monitoring to provide personalized feed-back.
In general, the collection of repetitive measurements of biomarkers, their analysis and interpretation, serving as basis for individualized health recommendations, is considered as one of the most promising tools of modern personalized medicine. Currently, only few such systems are clinically available, but these have been shown to be superior compared to traditional systems. An example is the continuous measurement of glucose in patients with diabetes with semi-automated systems guiding insulin therapy [17].
Despite their outstanding sensitivity and selectivity, applied mass spectrometry-based methods (e.g., GC-FID [12,16], GC-MS [18], SIFT-MS [15]) are rather bulky, costly and require trained personnel impeding their application as personal breath acetone detectors in daily life. More suitable are chemical gas sensors, for instance, based on chemoresistive metal-oxides. They are applied already in indoor air monitoring with typical costs per unit of few U.S. dollars (e.g., Figaro TGS 813 for combustible gases [19]). This is enabled by scalable and CMOS compatible technologies for the sensing film fabrication. Specifically, their sensing structure can be grown [20] or deposited (e.g., by thermophoresis from flame aerosols [21] or doctor-blading [22]) directly on micro-machined chips resulting in compact sensors for ready integration into hand-held devices [23]. Furthermore, their film morphology and deposited mass can be optimized during fabrication by in-situ resistance read-out [24]. When nanostructured, such sensors exhibit high sensitivity to detect even low ppb analyte concentrations [21]. Nevertheless, selectivity against other exhaled compounds that might occur at higher concentrations remains a major challenge.
ε-phase WO3 nanoparticles are particularly suitable due to their outstanding selectivity (e.g., to ethanol, methanol, NO, NO2, CO or NH3) [25] and high sensitivity to detect acetone down to 20 ppb even at breath-relevant 90% relative humidity (RH) [26]. This metastable phase can be stabilized by Si- [27] or Cr-doping [25] during flame aerosol synthesis. Combined with an end-tidal breath sampler [28], such sensors have been used already to monitor fat burn rates through breath acetone online during exercise and rest in 20 volunteers in good agreement to state-of-the-art proton transfer reaction time-of-flight mass spectrometry and venous blood BOHB [29]. Even sub-ppm concentrations of breath- and skin-emitted acetone can be detected with high accuracy (i.e., 19 ppb) [30] when used in combination with isoprene-selective Ti-doped ZnO [31] and ammonia-selective Si-doped MoO3 [32] as an orthogonal sensor array for search and rescue applications. Note that isoprene is an attractive breath marker for physical activity [33] and has potential for non-invasive cholesterol monitoring [34] while breath ammonia could be applied to detect end-stage renal disease [35]. For KD monitoring, however, selective detection of breath acetone at higher ppm concentrations [16] is necessary. So far, Si-doped WO3 sensors had been characterized only up to 3 ppm at 90% RH in simulated breath [26] and up to 2.4 ppm in real breath [29].
Here, compact sensors based on Si-doped WO3 nanoparticles are tested to monitor ketosis during a 36-h ketogenic diet based on the Johns Hopkins protocol [36] (Figure 1). Together with a sampler for end-tidal breath extraction [28], these sensors are applied on eleven volunteers (five females and six males) to monitor their individual breath acetone profiles. Sensor responses are compared closely to quadrupole mass spectrometry (QMS) to identify the sensing characteristics at elevated breath acetone concentrations up to 66 ppm. Simultaneous capillary blood assay (BOHB and glucose) is performed as a benchmark.
2. Materials and Methods
2.1. Acetone Sensor Fabrication and Film Characterization
The sensor is based on Si-doped WO3 nanoparticle films prepared by flame spray pyrolysis (FSP) [26]. The precursor solution consisted of ammonium metatungstate hydrate (Sigma Aldrich, St- Louis, MO, USA, purity ≥97%) and hexamethyl disiloxane (Sigma Aldrich, purity ≥98%) diluted in a mixture of 1:1 ethanol (Sigma Aldrich, purity ≥99.8%) and diethylene glycol monobutyl ether (Sigma Aldrich, purity ≥98%) to obtain a final metal (W and Si) concentration of 0.2 M at 10 mol% Si content. This solution was fed through a capillary at 5 mL min−1 and dispersed by 5 L min−1 oxygen at a pressure drop of 1.5 bar. A surrounding premixed methane (1.25 L min−1)/oxygen (3.2 L min−1) flame was used to ignite the spray while 5 L min−1 sheath oxygen through an annulus surrounding the flame ensured complete combustion. Obtained nanoparticles were deposited directly by thermophoresis [37] for 4 min at 20 cm height above the burner onto interdigitated Pt electrodes (sputtered, 350 µm width and spacing) on Al2O3 substrates (15 mm × 13 mm × 0.8 mm, Electronic Design Center, Case Western Reserve University, USA). Furthermore, adhesion and cohesion were increased by in-situ annealing with a particle-free xylene-flame (11 mL min−1) for 30 s and an oxygen dispersion rate of 5 L min−1. Finally, the sensors were thermally stabilized by annealing in an oven (Carbolite Gero 30–3000 °C) at 500 °C for 5 h. The sensing film’s morphology was evaluated with a Hitachi FE-SEM 4000 scanning electron microscope (SEM) operated at 5 kV.
2.2. Breath and Blood Analysis
End-tidal breath was extracted in a monitored and reproducible fashion with a tailor-made and modular sampler illustrated and described in detail elsewhere (Figure 1a in ref. [28]). In brief, it consisted of an inlet to measure airway pressure and guide the exhalation flow by visual prompting and an open-ended exhalation tube to capture and buffer end-tidal breath. Volunteers were asked to exhale for 30 s through a disposable mouthpiece into the sampler while maintaining an airway pressure of 980 Pa (corresponding to 50 mL s−1 exhalation flow), as recommended by the American Thoracic and European Respiratory Societies for sampling of NO [38]. A CO2 (Capnostat 5, Respironics, Murrysville, PA, USA) was used to check if the volunteer reached the end-tidal breath portion (CO2 > 3% [39]) at the end of the exhalation. Breath was analyzed online by directing samples through a heated transfer line to the acetone sensor and a mass spectrometer for cross-validation. All surfaces in contact with breath consisted of inert Teflon and were heated (65 °C) to avoid water condensation and analyte adsorption.
The acetone sensor was mounted on a Macor holder, installed inside a Teflon chamber (shown in Figure 1a of [40]) and fed with 130 mL min−1 from the sampler with a pump (SP 135 FZ, Schwarzer Precision, Essen, Germany). For optimal selectivity and sensitivity, the acetone sensor was heated to 350 °C [40] by applying constant voltage (R&S HMC8043, HAMEG, Mainhausen, Germany) through a Pt heater located on the backside of the substrates while monitoring the temperature with a resistance temperature detector on the front. The resistance of the sensing film was continuously measured and recorded by a Multimeter (Keithley 2700, Keithley Instruments, Solon, OH, USA). The sensor response was defined as [29]
with and being the sensor resistances in background room air and upon breath exposure, respectively.
An additional line was connected just before the acetone sensor chamber to extract samples for the QMS (QMS 422, ThermoStarTM, Pfeiffer Vacuum, Asslar, Germany). Secondary electron multiplier voltage was set to 950 V, while the analysis unit was heated to 150 °C. For acetone detection, the ion current at mass-to-charge ratio of 58.0 was measured with a dwell time of 0.2 s and resolution of 200. The QMS was calibrated with 9-point curves of single-component acetone in the range of 0.5 to 50 ppm in synthetic air at 90% RH. Certified acetone cylinder gas (13.6 ppm in synthetic air, Pan Gas, for concentrations ≤ 1 ppm and 500 ppm in synthetic air, Pan Gas, for concentrations > 1 ppm) was diluted in humidified synthetic air (Pan Gas 6.0, CnHm and NOx ≤ 100 ppb) with a mixing setup described elsewhere [32]. Capillary blood was sampled via finger pricking with lancet pens. BOHB and glucose were determined with a FreeStyle Neo Precision (Abbott Diabetes Care, Alameda, CA, USA).
2.3. Study Protocol
Healthy non-smokers free from respiratory or cardiovascular disease were included in this study. Each volunteer was informed about the experimental protocol prior to the test, gave written consent and could interrupt the test or withdraw consent anytime. This study was approved by the local ethics commission (Kantonale Ethikkommission Zürich, #2015-0675). Weight and height were measured on the first day prior to the first experiment. The participants followed a fat:(carbohydrate+protein) 4:1 KD based on the Johns Hopkins protocol [36] for 36 h including overnight fasting periods. The study timeline is illustrated schematically in Figure 1c. Each subject was asked to avoid physical exercise and alcoholic beverages 24 h before and during the experiment, fast for 12 h prior to the experiment and to avoid tooth brushing and mouth wash 2 h prior to and during the experiment to minimize exogenous confounders. Participants were allowed to drink water throughout the experiment but were asked to stop 30 min before breath and blood sampling. On the first day, each volunteer was given a total of 4 liquid ketogenic meals (circles, Figure 1c) every 3 h starting at around 8 a.m. This was followed by 15 h of fasting during the night and another 4 ketogenic meals on the second day at the same times. Breath and blood samples (diamonds, Figure 1c) were collected just before meal consumption and at the end of each testing day.
Each ketogenic meal was composed of 35% fat whipping cream (Coop, Basel, Switzerland) and chocolate-flavoured protein supplement powder (Sponsor Whey Protein 94, Wollerau, Switzerland) to accomplish a total fat content of 80 wt%. The corresponding macronutritional composition of both products is summarized in Table 1. Four meals accounted for 75% of the 24-h energy expenditure (24-EE in kcal/d) of the individual’s daily calorie requirement determined by multiplying the resting energy expenditure (REE) of each volunteer with the physical activity factor. The REE is calculated using the revised Harris-Benedict formula [41] which provides a quite accurate estimate in non-overweight subjects [42]. The physical activity factor is based on the physical activity during working and free time [43].
3. Results and Discussion
3.1. Study Cohort
Eleven volunteers (five females and six males) with a median age (±SD) of 22.7 (±2.0) years participated in this study. Their body mass index was 22.4 (±3.3) kg/m2. All volunteers had office jobs and were rather inactive (volunteers #1-9), moderately (volunteer #11) and highly active (volunteer #10) during their free time. Consequently, physical activity factors of 1.4, 1.5 and 1.6 were assumed, respectively, following the literature [43]. Individual physiological parameters, physical activity factors and calculated 24-EE are shown in Table 2.
3.2. Breath Acetone Sensor Design
The applied breath acetone sensor consisted of chemoresistive Si:WO3 nanoparticles with average particle size (dBET) of 12 nm [26]. By depositing them directly from flame-aerosols onto sensor substrates by thermophoresis [37], these nanoparticles agglomerate and aggregate to fine and porous sensing networks, as revealed by top-view SEM (Figure 1b). The open and nanostructured film morphology is advantageous for gas sensing as analytes (e.g., acetone) can access easily the sensing structure and interact with its large specific surface area. This promotes fast response times and high sensitivity to detect, for instance, 20 ppb of acetone at breath-relevant 90% RH in less than 60 s, as demonstrated on laboratory gas mixtures [40].
Human breath contains more than 870 compounds [44]. High selectivity is therefore a key requirement for a breath acetone sensor. This is addressed by employing the ferroelectric ε-phase of WO3 featuring a monoclinic, similar to the widely applied γ-phase, but acentric crystal configuration [45]. This metastable phase (stable below −40 °C [45]) can be stabilized at room and sensor operational temperature (350 °C [40]) by Si- [26] or Cr- [25] doping. It has been proposed that the outstanding selectivity of ε-WO3 is associated to its spontaneous electric dipole moment that interacts with the strong dipole moment of acetone [25]. However, also other factors may contribute to acetone selectivity, for instance, the orientation of exposed surface facets, as demonstrated with WO3 nanorods [46].
3.3. Sensor Performance and Calibration at Elevated Breath Acetone Concentrations
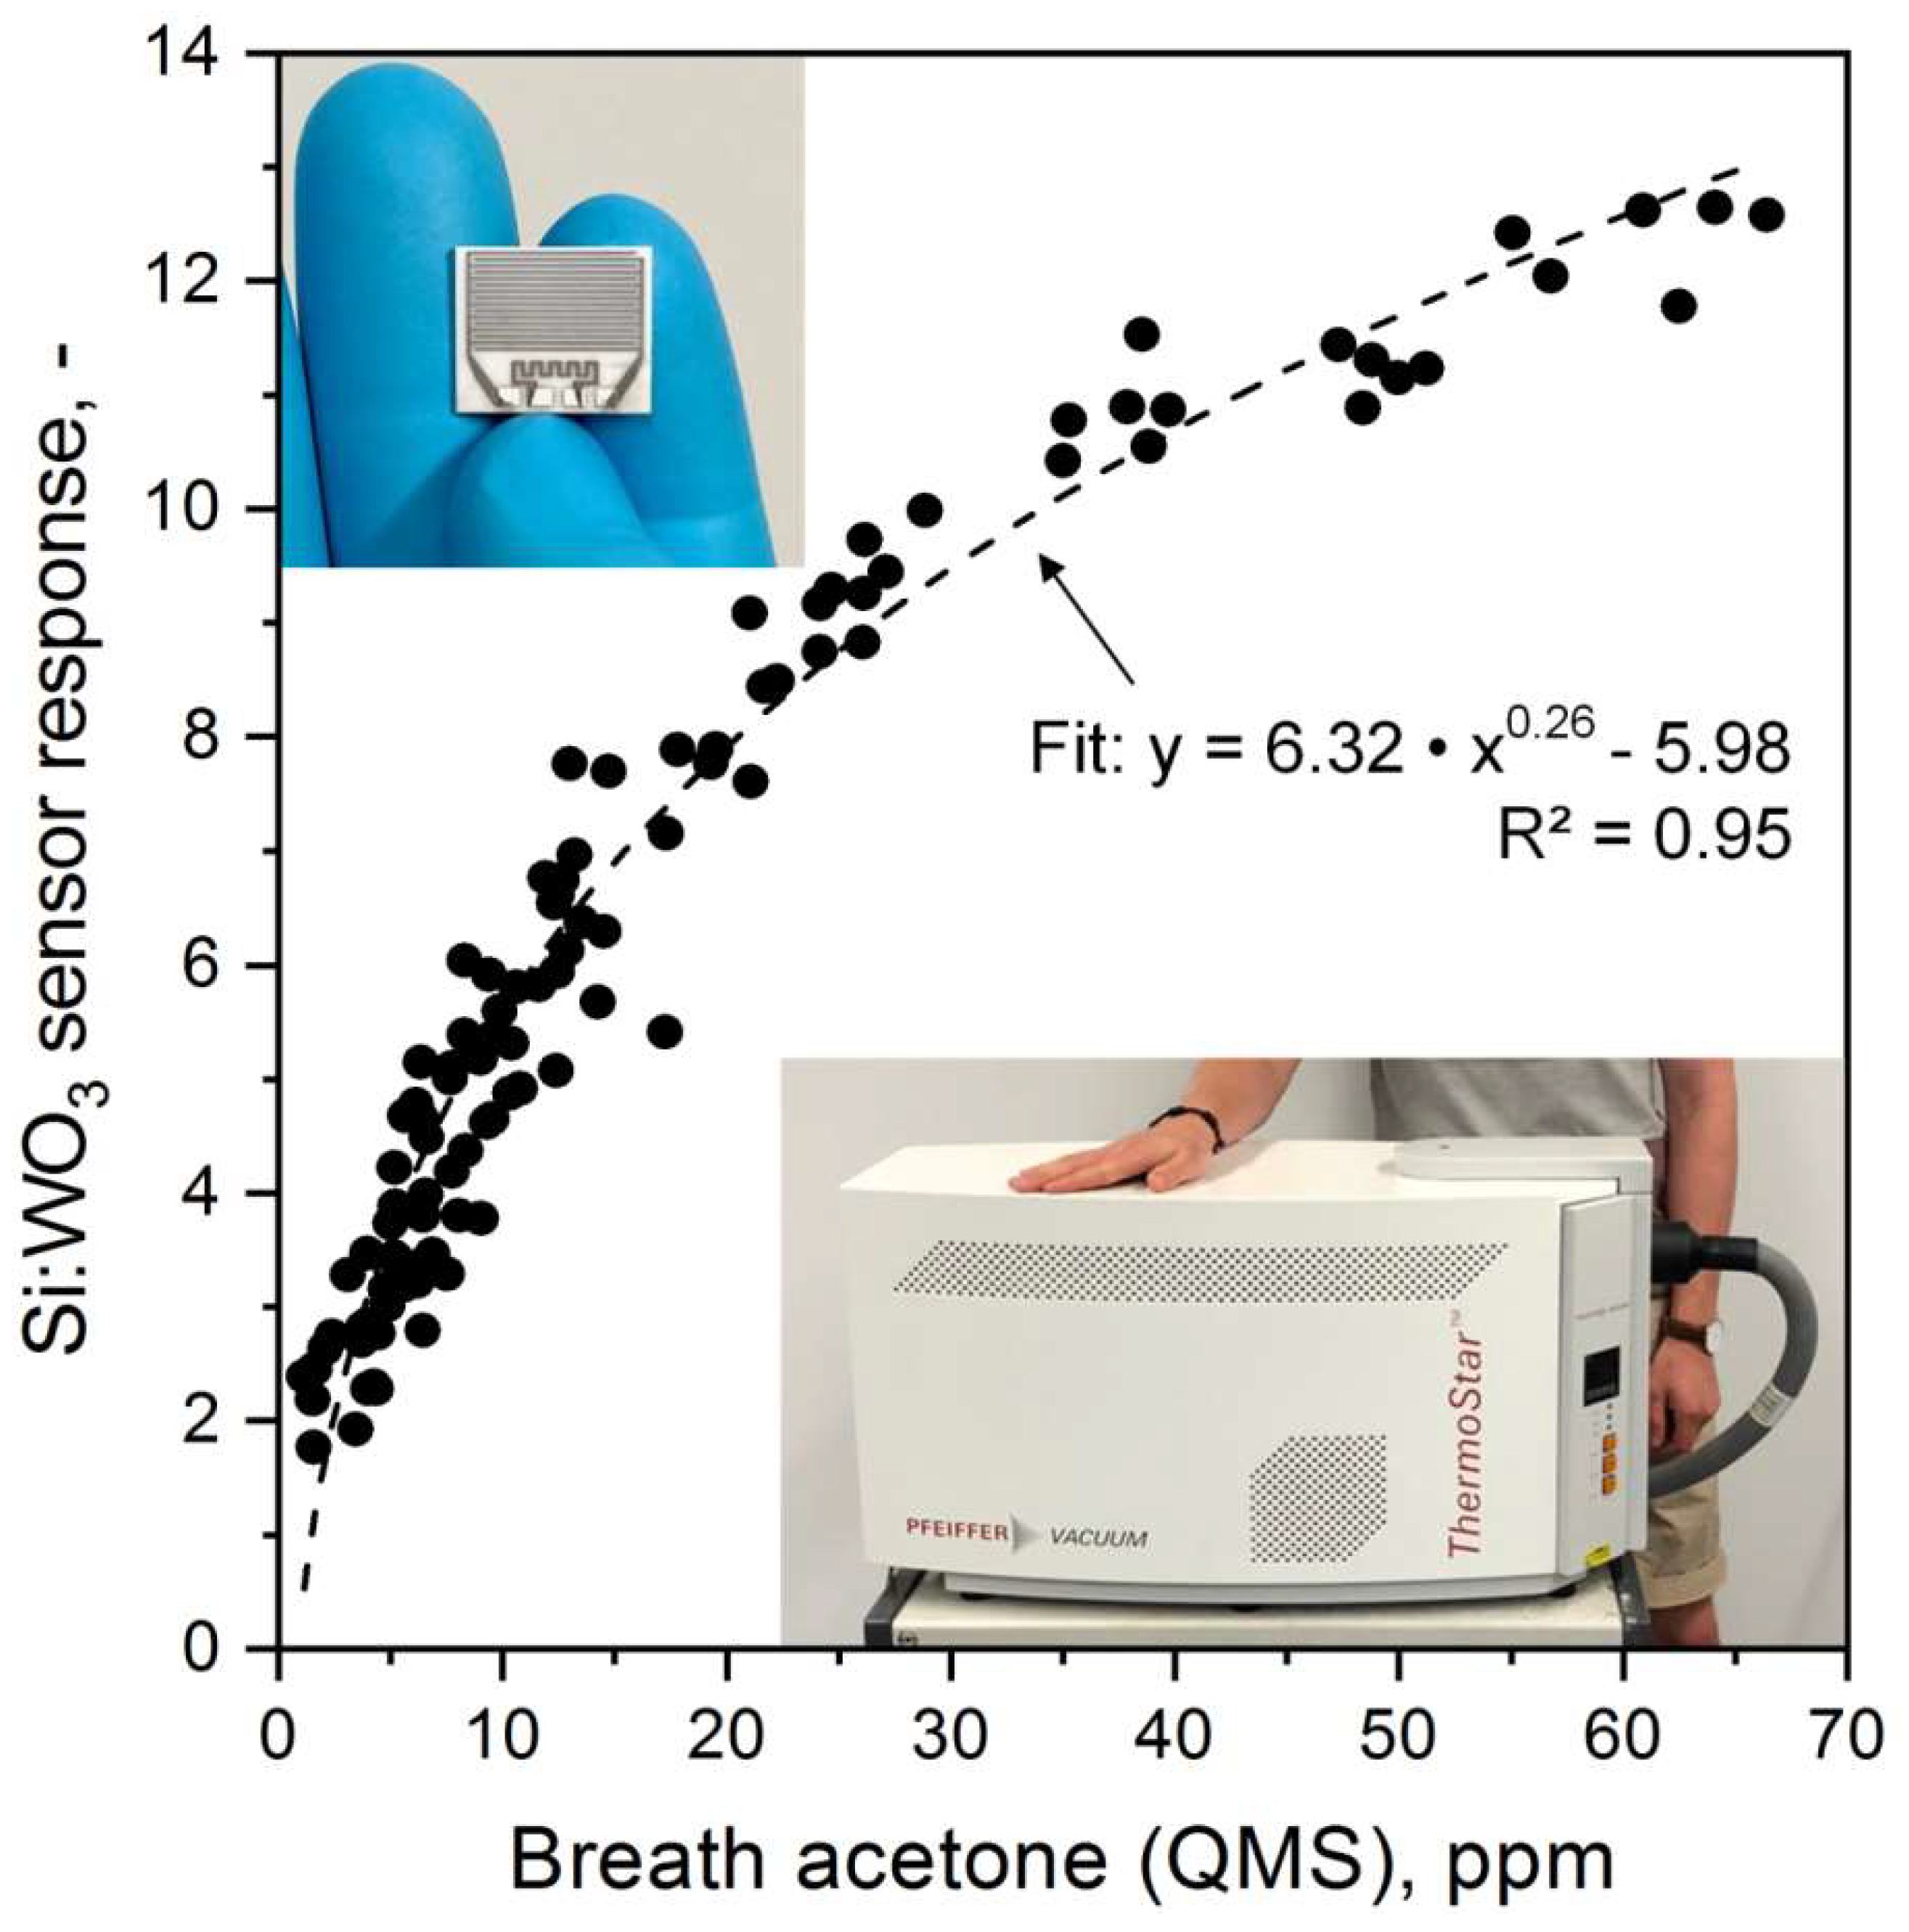
Si:WO3 sensor response and QMS-measured breath acetone concentrations from eleven volunteers (105 breath samples) from the 36-h KD are shown in Figure 2. In general, the sensor resolves the entire range from 1.1 to 66.4 ppm, a remarkable performance considering the sensor’s compact and inexpensive design compared to that of the QMS. However, the acetone sensitivity (i.e., slope of response curve) decreases with increasing breath acetone concentrations indicating non-linear response characteristics. This is similar to other flame-made metal-oxide sensors (e.g., Pt:SnO2 with CO [37]) at such concentrations and in agreement with non-linear diffusion-reaction theory [47]. Accordingly, the response S can be approximated with a power law [48]: with cace being the breath acetone concentration. Best fit (dashed line, R2 = 0.95) was obtained with a pre-factor A of 6.32, exponent B of 0.26 and constant K of −5.98. This transfer function was used in the following to determine breath acetone concentrations from sensor responses.
It is also worth discussing the observed spread between sensor and QMS (Figure 2). This may be related to minor interference of the sensor by other gases than acetone. In fact, Si:WO3 shows a smaller response, for instance, to ethanol [26] or isoprene [40] that are contained typically at sub-ppm concentrations in sober and healthy breath [49,50]. Also the high relative humidity in exhaled breath alters the sensor response to acetone [26]. To compensate for these, the Si:WO3 sensor could be combined with other selective sensors (e.g., Ti-doped ZnO for isoprene [31], Si-doped MoO3 for ammonia [32] and commercial humidity sensors) in orthogonal arrays [30]. Such improved accuracy is especially required when lower ppb concentrations of acetone need to be detected (e.g., in search and rescue when sniffing entrapped humans [30]) but less important in KD monitoring where exhaled acetone concentrations are at elevated ppm levels (Figure 2). Also filters (e.g., microporous membranes [51] for larger interfering molecules or adsorption packed beds [52]) or GC columns [53] are quite effective to improve selectivity.
3.4. Monitoring Individual Ketosis through Breath and Blood
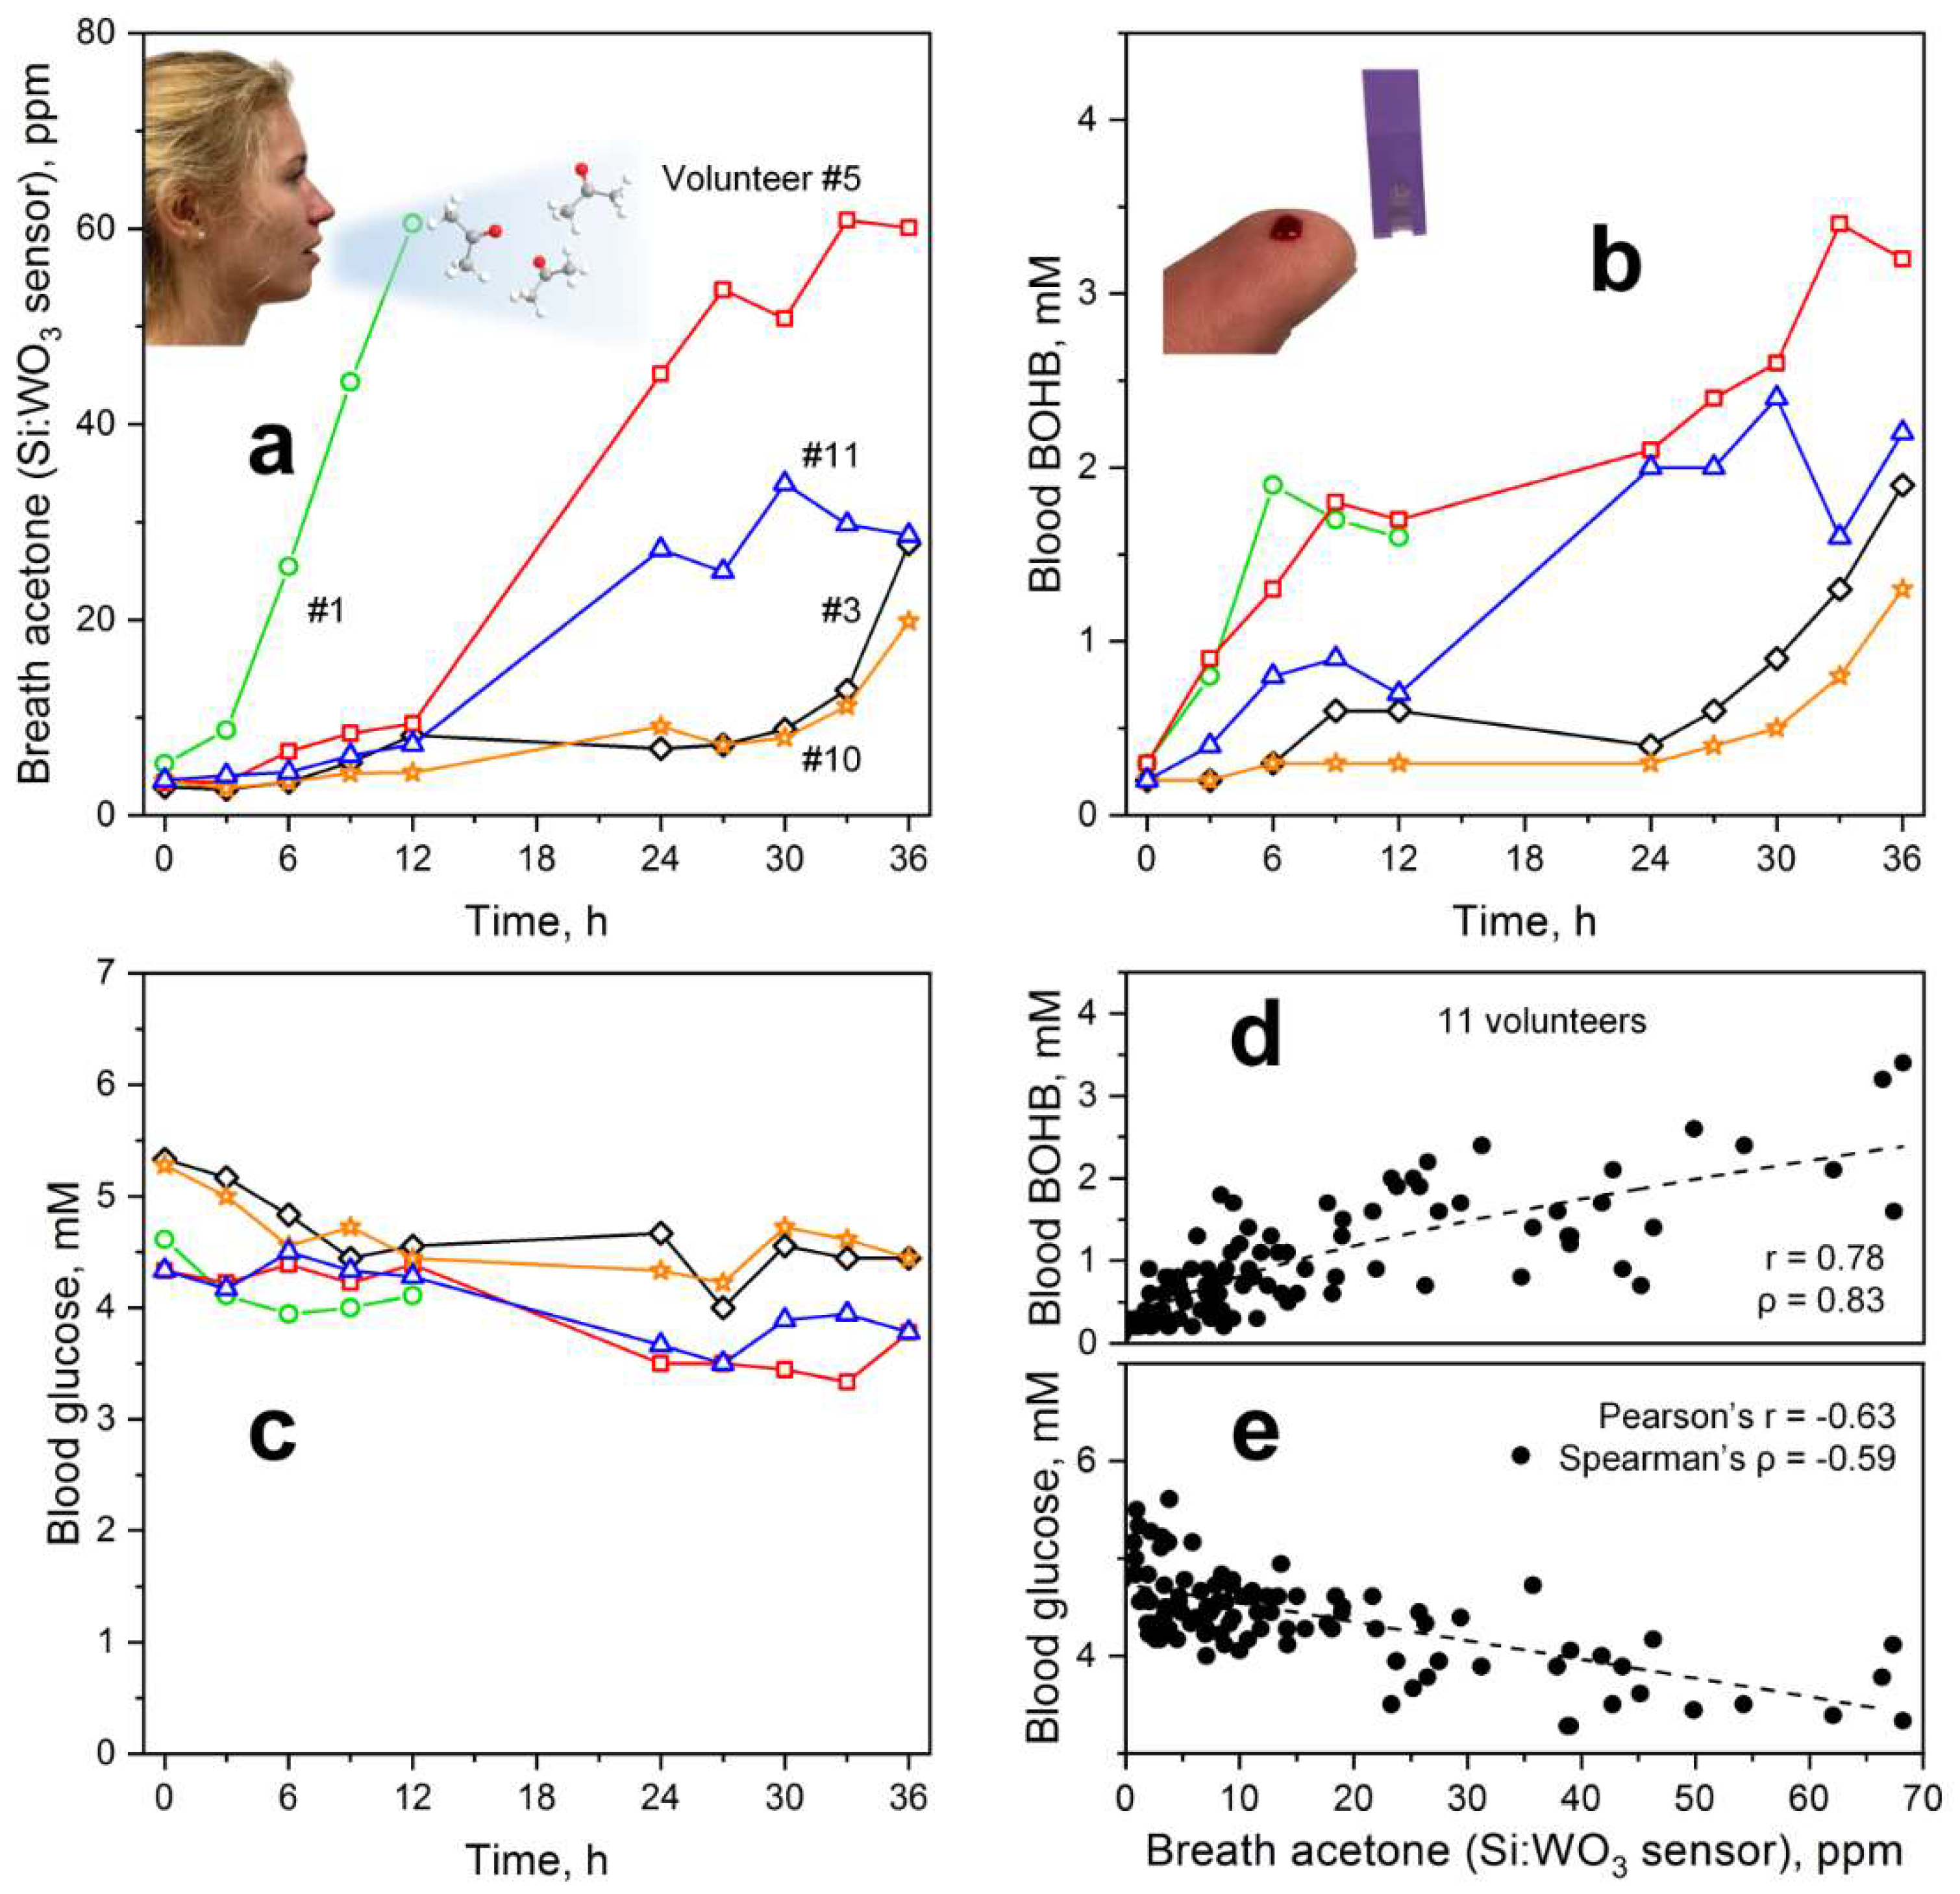
As a next step, the individual sensor-measured breath acetone dynamics of the volunteers during the KD were analyzed and compared to a commercial capillary blood BOHB and glucose monitoring system. Figure 3 shows the simultaneously measured profiles for (a) breath acetone, (b) capillary blood BOHB and (c) glucose of five representative volunteers during a 36-h KD. Data of all eleven volunteers are provided in Figure S1. For volunteer #3 (black diamonds), breath acetone almost tripled within the first 12 h, similar to other KD studies where an average increase by a factor of 3.5 was observed [12]. Most interestingly, the strongest increase was observed after 30 h when breath acetone concentrations exceeded 20 ppm, which should reflect advanced ketosis from intensified ketogenesis [9] (Figure 1a, box). This is significantly higher than observed, for instance, during exercise and post-exercise rest where breath acetone levels did not exceed 3 ppm [29]. Remarkably, capillary blood BOHB (Figure 3b) as an established marker for ketosis followed the same dynamic. In specific, nutritional ketosis (0.5–3 mM [54]) is entered after 9 h and mild ketosis (2–7 mM [55]) after 36 h of KD, the latter is needed for an efficient treatment of epilepsy [56]. This indicates that the present breath acetone sensor is suitable to monitor ketosis during KD and, most importantly, it operates non-invasively.
Within the first 12 h, a similar breath acetone trend was observed also for volunteers #5 (red squares), #10 (orange stars) and #11 (blue triangles). However, #5 and #11 differed significantly afterwards. In particular, breath acetone concentrations of both increased strongly already during overnight fasting (t = 12–24 h). On the second day, further increase was observed for volunteer #5 who reached breath acetone concentrations above 60 ppm after 33 h, while they leveled off for #11 at around 30 ppm. These breath acetone trends were in agreement with BOHB (Figure 3b) where volunteer #5 reached highest levels above 3 mM toward the end of the KD. It is also interesting to observe that BOHB increased stronger than the breath acetone levels within the first 12 h for volunteer #11 and especially #5. This may be related to the dynamic equilibrium between BOHB and AcAc (Figure 1a, box) [9]. In summary, the volunteers showed distinctly different ketosis dynamics despite similar KD conditions, as recognized correctly by the sensor.
Finally, it is worth discussing volunteer #1 (Figure 3a, green circles) who showed a distinctly different breath acetone profile. Most notably, this volunteer had already an extraordinary increase in breath acetone at the beginning of the KD reaching about 60 ppm after 12 h. A similar trend within the first 6 h is observed for blood BOHB (Figure 3b), though less distinct from the other volunteers (e.g., #5, red squares) than observed for breath acetone (Figure 3a). Interestingly, BOHB decreases thereafter. Glucose concentrations (Figure 3c, green circles), on the other hand, decreased until t = 6 h and started to increase slightly thereafter coinciding with the drop in BOHB levels. On the second day, this volunteer had to stop the KD due to strong nausea. This is probably caused by ketones activating the chemoreceptor zone in the vomiting center of the brain that is a known reason for nausea and vomiting in ketosis [57]. As a result, this volunteer showed low tolerance to the KD protocol that was reflected in an abnormal breath acetone pattern. In a next step, the present breath acetone sensor could be used to guide this volunteer to an optimized KD protocol (e.g., different nutritional composition) to achieve and maintain a healthy status of ketosis.
Corresponding capillary glucose levels (Figure 3c) of the five volunteers (for all volunteers, see Figure S1c) were consistently below 5.5 mM at the start and during the KD. This suggests that they adhered to the overnight fasting prior to the KD and stayed abstinent from other external carbohydrate sources during the KD (see Figure 1c for protocol). During the KD, glucose levels typically decreased within the first 12 h and leveled off thereafter between 3 and 5 mM probably due to gluconeogenesis to inhibit hypoglycemia [10], as suggested above.
3.5. Correlations between Breath and Blood Parameters
The blood and breath ketone concentrations for all volunteers are shown in Figure 3d. Breath acetone and capillary blood BOHB correlated significantly with Spearman’s rank correlation coefficient ρ of 0.83 (p < 0.001) and Pearson’s correlation coefficient r of 0.78 (p < 0.001), as expected from their similar intra-subject dynamics during KD (Figure 3a vs. Figure 3b) and joint biochemical origin as products of ketogenesis (Figure 1a, box) [9]. When applying a power law fit (dashed line), a degree of determination (R2) of 0.62 is obtained that is well within the range of fasting and dieting experiments (0.54 ≤ R2 ≤ 0.94) [14].
A weaker and inverse correlation was found between breath acetone and capillary blood glucose (r = −0.63, ρ = −0.59, both p < 0.001). This was anticipated from the observed trends during KD (Figure 3a vs. Figure 3c). Ketogenesis is driven by hepatic β-oxidation which increases during fasting when lipolysis increases as no longer suppressed by insulin and by the expression of mitochondrial HMG-CoA synthase which is induced by fasting and downregulated by insulin [11]. Although low insulin and high glucagon levels resulting from low blood glucose serve as an initial trigger for ketogenesis, ketone body levels are rather determined by glucose level-independent effects, such as free fatty acid availability for ketone body production and ketone body consumption by peripheral tissues [58].
4. Conclusions
A compact and inexpensive breath acetone sensor was introduced to monitor the status of ketosis during ketogenic diets. Its sensing film consisted of chemoresistive Si-doped WO3 nanoparticles that showed high selectivity and non-linear response characteristics for breath acetone concentrations up to around 66 ppm, as revealed by mass spectrometry. When applied on eleven volunteers during a 36-h ketogenic diet, the breath sensor accurately followed the individual breath acetone dynamics, in general agreement with capillary blood BOHB. Most interestingly, strong differences in individual breath and blood profiles were identified between volunteers despite identical KD conditions. These were correctly recognized by the breath acetone sensor including patterns possibly associated to low tolerance to the KD protocol. The sensor’s ability to accurately and rapidly monitor individual changes in the ketogenic state together with its compact size renders it attractive for repetitive measurements by the public. As a result, this breath sensor is promising as a portable ketosis monitor in a broad range of applications including personalized, non-pharmaceutical treatment of epileptics and guiding of dietary interventions for weight loss.
5. Patents
A.T.G. and S.E.P. declare a patent application.
Supplementary Materials
The following are available online at https://www.mdpi.com/1424-8220/18/11/3655/s1, Figure S1: Individual (a) breath acetone, capillary blood (b) BOHB and (c) glucose levels of 11 volunteers during a 36-h ketogenic diet. Note that volunteer #1 (green circles) aborted the experiment already after 24 h due to strong nausea. Volunteer #4 (pink crosses) suffered also from nausea after the overnight sleep (approx. at t = 22 h) and took a small dose of dextrose resulting in the observed blood glucose peak at t = 24 h.
Author Contributions
Conceptualization, A.T.G., J.F.K., B.G., S.E.P. and P.A.G.; methodology, A.T.G., J.F.K. and P.A.G.; investigation, A.T.G., J.F.K., H.L., S.J.T., N.A.S. and P.A.G.; resources, S.E.P., M.K. and P.A.G.; data curation, A.T.G., J.F.K., H.L., S.J.T., N.A.S., S.E.P. and P.A.G.; writing—original draft preparation, A.T.G.; writing—review and editing, all authors; visualization, A.T.G., J.F.K., H.L. and S.J.T.; supervision, A.T.G., M.K., S.E.P. and P.A.G.; funding acquisition, A.T.G., M.K., S.E.P. and P.A.G.
Funding
Financial support by the Swiss National Science Foundation (project grants 159763, 175754 and R’Equip grant 170729) and ETH Zürich (research grant ETH-21 18-1) is gratefully acknowledged. This study is part of the Hochschulmedizin Zurich flagship project Zurich Exhalomics.
Acknowledgments
The authors thank C.O. Blattmann for support with the microscopy and the Optical Materials Engineering Laboratory at ETH Zürich (D.J. Norris) for providing the SEM.
Conflicts of Interest
The authors declare no conflict of interest.
References
- Wheless, J.W. History of the ketogenic diet. Epilepsia 2008, 49, 3–5. [Google Scholar] [CrossRef] [PubMed] [Green Version]
- Laxer, K.D.; Trinka, E.; Hirsch, L.J.; Cendes, F.; Langfitt, J.; Delanty, N.; Resnick, T.; Benbadis, S.R. The consequences of refractory epilepsy and its treatment. Epilepsy Behav. 2014, 37, 59–70. [Google Scholar] [CrossRef] [PubMed] [Green Version]
- Yancy, W.S.; Olsen, M.K.; Guyton, J.R.; Bakst, R.P.; Westman, E.C. A low-carbohydrate, ketogenic diet versus a low-fat diet to treat obesity and hyperlipidemia: A randomized, controlled trial. Ann. Intern. Med. 2004, 140, 769–777. [Google Scholar] [CrossRef] [PubMed]
- Abbasi, J. Interest in the Ketogenic Diet Grows for Weight Loss and Type 2 Diabetes. JAMA 2018, 319, 215–217. [Google Scholar] [CrossRef] [PubMed] [Green Version]
- Westman, E.C.; Yancy, W.S., Jr.; Mavropoulos, J.C.; Marquart, M.; McDuffie, J.R. The effect of a low-carbohydrate, ketogenic diet versus a low-glycemic index diet on glycemic control in type 2 diabetes mellitus. Nutr. Metab. 2008, 5, 36. [Google Scholar] [CrossRef] [PubMed] [Green Version]
- Mardinoglu, A.; Wu, H.; Bjornson, E.; Zhang, C.; Hakkarainen, A.; Rasanen, S.M.; Lee, S.; Mancina, R.M.; Bergentall, M.; Pietilainen, K.H.; et al. An Integrated Understanding of the Rapid Metabolic Benefits of a Carbohydrate-Restricted Diet on Hepatic Steatosis in Humans. Cell Metab. 2018, 27, 559–571. [Google Scholar] [CrossRef] [PubMed]
- Youm, Y.-H.; Nguyen, K.Y.; Grant, R.W.; Goldberg, E.L.; Bodogai, M.; Kim, D.; D’agostino, D.; Planavsky, N.; Lupfer, C.; Kanneganti, T.D. The ketone metabolite β-hydroxybutyrate blocks NLRP3 inflammasome–mediated inflammatory disease. Nat. Med. 2015, 21, 263–269. [Google Scholar] [CrossRef] [PubMed] [Green Version]
- Cox, P.J.; Kirk, T.; Ashmore, T.; Willerton, K.; Evans, R.; Smith, A.; Murray, A.J.; Stubbs, B.; West, J.; McLure, S.W.; et al. Nutritional Ketosis Alters Fuel Preference and Thereby Endurance Performance in Athletes. Cell Metab. 2016, 24, 256–268. [Google Scholar] [CrossRef] [PubMed]
- Puchalska, P.; Crawford, P.A. Multi-dimensional roles of ketone bodies in fuel metabolism, signaling, and therapeutics. Cell Metab. 2017, 25, 262–284. [Google Scholar] [CrossRef] [PubMed]
- Cahill, G.F., Jr. Fuel metabolism in starvation. Annu. Rev. Nutr. 2006, 26, 1–22. [Google Scholar] [CrossRef] [PubMed]
- Hegardt, F.G. Transcriptional regulation of mitochondrial HMG-CoA synthase in the control of ketogenesis. Biochimie 1998, 80, 803–806. [Google Scholar] [CrossRef]
- Musa-Veloso, K.; Likhodii, S.S.; Cunnane, S.C. Breath acetone is a reliable indicator of ketosis in adults consuming ketogenic meals. Am. J. Clin. Nutr. 2002, 76, 65–70. [Google Scholar] [CrossRef] [PubMed]
- Freund, G. The calorie deficiency hypothesis of ketogenesis tested in man. Metabolism 1965, 14, 985–990. [Google Scholar] [CrossRef]
- Anderson, J.C. Measuring breath acetone for monitoring fat loss: Review. Obesity 2015, 23, 2327–2334. [Google Scholar] [CrossRef] [PubMed] [Green Version]
- Spanel, P.; Dryahina, K.; Rejskova, A.; Chippendale, T.W.E.; Smith, D. Breath acetone concentration; biological variability and the influence of diet. Physiol. Meas. 2011, 32, N23–N31. [Google Scholar] [CrossRef] [PubMed]
- Musa-Veloso, K.; Likhodii, S.S.; Rarama, E.; Benoit, S.; Liu, Y.-M.C.; Chartrand, D.; Curtis, R.; Carmant, L.; Lortie, A.; Comeau, F.J. Breath acetone predicts plasma ketone bodies in children with epilepsy on a ketogenic diet. Nutrition 2006, 22, 1–8. [Google Scholar] [CrossRef] [PubMed]
- Bergenstal, R.M.; Garg, S.; Weinzimer, S.A.; Buckingham, B.A.; Bode, B.W.; Tamborlane, W.V.; Kaufman, F.R. Safety of a hybrid closed-loop insulin delivery system in patients with type 1 diabetes. JAMA 2016, 316, 1407–1408. [Google Scholar] [CrossRef] [PubMed]
- Ruzsányi, V.; Kalapos, M.P.; Schmidl, C.; Karall, D.; Scholl-Bürgi, S.; Baumann, M. Breath profiles of children on ketogenic therapy. J. Breath Res. 2018, 12, 036021. [Google Scholar] [CrossRef] [PubMed] [Green Version]
- Figaro TGS 813: Technical Datasheet. Available online: http://www.figarosensor.com/products/813pdf.pdf (accessed on 22 October 2018).
- Steinhauer, S.; Chapelle, A.; Menini, P.; Sowwan, M. Local CuO Nanowire Growth on Microhotplates: In Situ Electrical Measurements and Gas Sensing Application. ACS Sens. 2016, 1, 503–507. [Google Scholar] [CrossRef]
- Güntner, A.T.; Koren, V.; Chikkadi, K.; Righettoni, M.; Pratsinis, S.E. E-Nose sensing of low-ppb formaldehyde in gas mixtures at high relative humidity for breath screening of lung cancer? ACS Sens. 2016, 1, 528–535. [Google Scholar] [CrossRef]
- Tsuruta, A.; Itoh, T.; Mikami, M.; Kinemuchi, Y.; Terasaki, I.; Murayama, N.; Shin, W. Trial of an All-Ceramic SnO2 Gas Sensor Equipped with CaCu3Ru4O12 Heater and Electrode. Materials 2018, 11, 981. [Google Scholar] [CrossRef] [PubMed]
- Righettoni, M.; Ragnoni, A.; Güntner, A.T.; Loccioni, C.; Pratsinis, S.E.; Risby, T.H. Monitoring breath markers under controlled conditions. J. Breath Res. 2015, 9, 047101. [Google Scholar] [CrossRef] [PubMed]
- Blattmann, C.O.; Güntner, A.T.; Pratsinis, S.E. In Situ Monitoring of the Deposition of Flame-Made Chemoresistive Gas-Sensing Films. ACS Appl. Mater. Interfaces 2017, 9, 23926–23933. [Google Scholar] [CrossRef] [PubMed]
- Wang, L.; Teleki, A.; Pratsinis, S.E.; Gouma, P.I. Ferroelectric WO3 Nanoparticles for Acetone Selective Detection. Chem. Mater. 2008, 20, 4794–4796. [Google Scholar] [CrossRef]
- Righettoni, M.; Tricoli, A.; Pratsinis, S.E. Si:WO3 Sensors for Highly Selective Detection of Acetone for Easy Diagnosis of Diabetes by Breath Analysis. Anal. Chem. 2010, 82, 3581–3587. [Google Scholar] [CrossRef] [PubMed]
- Righettoni, M.; Tricoli, A.; Pratsinis, S.E. Thermally Stable, Silica-Doped ε-WO3 for Sensing of Acetone in the Human Breath. Chem. Mater. 2010, 22, 3152–3157. [Google Scholar] [CrossRef]
- Schon, S.; Theodore, S.J.; Güntner, A.T. Versatile breath sampler for online gas sensor analysis. Sens. Actuators B Chem. 2018, 273, 1780–1785. [Google Scholar] [CrossRef]
- Güntner, A.T.; Sievi, N.A.; Theodore, S.J.; Gulich, T.; Kohler, M.; Pratsinis, S.E. Noninvasive Body Fat Burn Monitoring from Exhaled Acetone with Si-doped WO3-sensing Nanoparticles. Anal. Chem. 2017, 89, 10578–10584. [Google Scholar] [CrossRef] [PubMed]
- Güntner, A.T.; Pineau, N.J.; Mochalski, P.; Wiesenhofer, H.; Agapiou, A.; Mayhew, C.A.; Pratsinis, S.E. Sniffing Entrapped Humans with Sensor Arrays. Anal. Chem. 2018, 90, 4940–4945. [Google Scholar] [CrossRef] [PubMed] [Green Version]
- Güntner, A.T.; Pineau, N.J.; Chie, D.; Krumeich, F.; Pratsinis, S.E. Selective sensing of isoprene by Ti-doped ZnO for breath diagnostics. J. Mater. Chem. B 2016, 4, 5358–5366. [Google Scholar] [CrossRef]
- Güntner, A.T.; Righettoni, M.; Pratsinis, S.E. Selective sensing of NH3 by Si-doped α-MoO3 for breath analysis. Sens. Actuators B Chem. 2016, 223, 266–273. [Google Scholar] [CrossRef]
- King, J.; Kupferthaler, A.; Unterkofler, K.; Koc, H.; Teschl, S.; Teschl, G.; Miekisch, W.; Schubert, J.; Hinterhuber, H.; Amann, A. Isoprene and acetone concentration profiles during exercise on an ergometer. J. Breath Res. 2009, 3, 027006. [Google Scholar] [CrossRef] [PubMed] [Green Version]
- Karl, T.; Prazeller, P.; Mayr, D.; Jordan, A.; Rieder, J.; Fall, R.; Lindinger, W. Human breath isoprene and its relation to blood cholesterol levels: New measurements and modeling. J. Appl. Physiol. 2001, 91, 762–770. [Google Scholar] [CrossRef] [PubMed]
- Davies, S.; Spanel, P.; Smith, D. Quantitative analysis of ammonia on the breath of patients in end-stage renal failure. Kidney Int. 1997, 52, 223–228. [Google Scholar] [CrossRef] [PubMed]
- Freeman, J.M.; Kelly, M.T.; Freeman, J.B. The Epilepsy Diet Treatment: An Introduction to the Ketogenic Diet; Demos Vermande: New York, NY, USA, 1996. [Google Scholar]
- Mädler, L.; Roessler, A.; Pratsinis, S.E.; Sahm, T.; Gurlo, A.; Barsan, N.; Weimar, U. Direct formation of highly porous gas-sensing films by in situ thermophoretic deposition of flame-made Pt/SnO2 nanoparticles. Sens. Actuators B Chem. 2006, 114, 283–295. [Google Scholar] [CrossRef]
- American Thoracic Society European Respiratory Society. Recommendations for Standardized Procedures for the Online and Offline Measurement of Exhaled Lower Respiratory Nitric Oxide and Nasal Nitric Oxide. Am. J. Respir. Crit. Care Med. 2005, 171, 912–930. [Google Scholar] [CrossRef] [PubMed]
- Di Francesco, F.; Loccioni, C.; Fioravanti, M.; Russo, A.; Pioggia, G.; Ferro, M.; Roehrer, I.; Tabucchi, S.; Onor, M. Implementation of Fowler’s method for end-tidal air sampling. J. Breath Res. 2008, 2, 037009. [Google Scholar] [CrossRef] [PubMed]
- Righettoni, M.; Tricoli, A.; Gass, S.; Schmid, A.; Amann, A.; Pratsinis, S.E. Breath acetone monitoring by portable Si:WO3 gas sensors. Anal. Chim. Acta 2012, 738, 69–75. [Google Scholar] [CrossRef] [PubMed]
- Mifflin, M.D.; St Jeor, S.T.; Hill, L.A.; Scott, B.J.; Daugherty, S.A.; Koh, Y.O. A new predictive equation for resting energy expenditure in healthy individuals. Am. J. Clin. Nutr. 1990, 51, 241–247. [Google Scholar] [CrossRef] [PubMed]
- Frankenfield, D.C. Bias and accuracy of resting metabolic rate equations in non-obese and obese adults. Clin. Nutr. 2013, 32, 976–982. [Google Scholar] [CrossRef] [PubMed]
- Suter, P.M. Checkliste Ernährung; Georg Thieme Verlag: Stuttgart, Germany, 2008. [Google Scholar]
- De Lacy Costello, B.; Amann, A.; Al-Kateb, H.; Flynn, C.; Filipiak, W.; Khalid, T.; Osborne, D.; Ratcliffe, N.M. A review of the volatiles from the healthy human body. J. Breath Res. 2014, 8, 014001. [Google Scholar] [CrossRef] [PubMed]
- Woodward, P.M.; Sleight, A.W.; Vogt, T. Ferroelectric Tungsten Trioxide. J. Solid State Chem. 1997, 131, 9–17. [Google Scholar] [CrossRef]
- Jia, Q.-Q.; Ji, H.-M.; Wang, D.-H.; Bai, X.; Sun, X.-H.; Jin, Z.-G. Exposed facets induced enhanced acetone selective sensing property of nanostructured tungsten oxide. J. Mater. Chem. A 2014, 2, 13602–13611. [Google Scholar] [CrossRef]
- Gardner, J.W. A non-linear diffusion-reaction model of electrical conduction in semiconductor gas sensors. Sens. Actuators B Chem. 1990, 1, 166–170. [Google Scholar] [CrossRef]
- Barsan, N.; Weimar, U. Understanding the fundamental principles of metal oxide based gas sensors; the example of CO sensing with SnO2 sensors in the presence of humidity. J. Phys.-Condes. Matter 2003, 15, R813–R839. [Google Scholar] [CrossRef]
- Turner, C.; Španěl, P.; Smith, D. A longitudinal study of ethanol and acetaldehyde in the exhaled breath of healthy volunteers using selected-ion flow-tube mass spectrometry. Rapid Commun. Mass Spectrom. 2006, 20, 61–68. [Google Scholar] [CrossRef] [PubMed]
- Kushch, I.; Arendacka, B.; Stolc, S.; Mochalski, P.; Filipiak, W.; Schwarz, K.; Schwentner, L.; Schmid, A.; Dzien, A.; Lechleitner, M. Breath isoprene—Aspects of normal physiology related to age, gender and cholesterol profile as determined in a proton transfer reaction mass spectrometry study. Clin. Chem. Lab. Med. 2008, 46, 1011–1018. [Google Scholar] [CrossRef] [PubMed]
- Güntner, A.T.; Abegg, S.; Wegner, K.; Pratsinis, S.E. Zeolite membranes for highly selective formaldehyde sensors. Sens. Actuators B Chem. 2018, 257, 916–923. [Google Scholar] [CrossRef]
- Van den Broek, J.; Güntner, A.T.; Pratsinis, S.E. Highly Selective and Rapid Breath Isoprene Sensing Enabled by Activated Alumina Filter. ACS Sens. 2018, 3, 677–683. [Google Scholar] [CrossRef] [PubMed]
- Itoh, T.; Miwa, T.; Tsuruta, A.; Akamatsu, T.; Izu, N.; Shin, W.; Park, J.; Hida, T.; Eda, T.; Setoguchi, Y. Development of an Exhaled Breath Monitoring System with Semiconductive Gas Sensors, a Gas Condenser Unit, and Gas Chromatograph Columns. Sensors 2016, 16, 1891. [Google Scholar] [CrossRef] [PubMed]
- Saslow, L.R.; Kim, S.; Daubenmier, J.J.; Moskowitz, J.T.; Phinney, S.D.; Goldman, V.; Murphy, E.J.; Cox, R.M.; Moran, P.; Hecht, F.M. A randomized pilot trial of a moderate carbohydrate diet compared to a very low carbohydrate diet in overweight or obese individuals with type 2 diabetes mellitus or prediabetes. PLoS ONE 2014, 9, e91027. [Google Scholar] [CrossRef] [PubMed]
- Veech, R.L.; Chance, B.; Kashiwaya, Y.; Lardy, H.A.; Cahill, G.F. Ketone bodies, potential therapeutic uses. IUBMB Life 2001, 51, 241–247. [Google Scholar] [PubMed]
- VanItallie, T.B.; Nufert, T.H. Ketones: Metabolism’s ugly duckling. Nutr. Rev. 2003, 61, 327–341. [Google Scholar] [CrossRef] [PubMed]
- Canziani, B.C.; Uestuener, P.; Fossali, E.F.; Lava, S.A.; Bianchetti, M.G.; Agostoni, C.; Milani, G.P. Clinical Practice: Nausea and vomiting in acute gastroenteritis: Physiopathology and management. Eur. J. Pediatr. 2018, 177, 1–5. [Google Scholar] [CrossRef] [PubMed]
- McPherson, P.A.C.; McEneny, J. The biochemistry of ketogenesis and its role in weight management, neurological disease and oxidative stress. J. Physiol. Biochem. 2012, 68, 141–151. [Google Scholar] [CrossRef] [PubMed]
Figure 1.
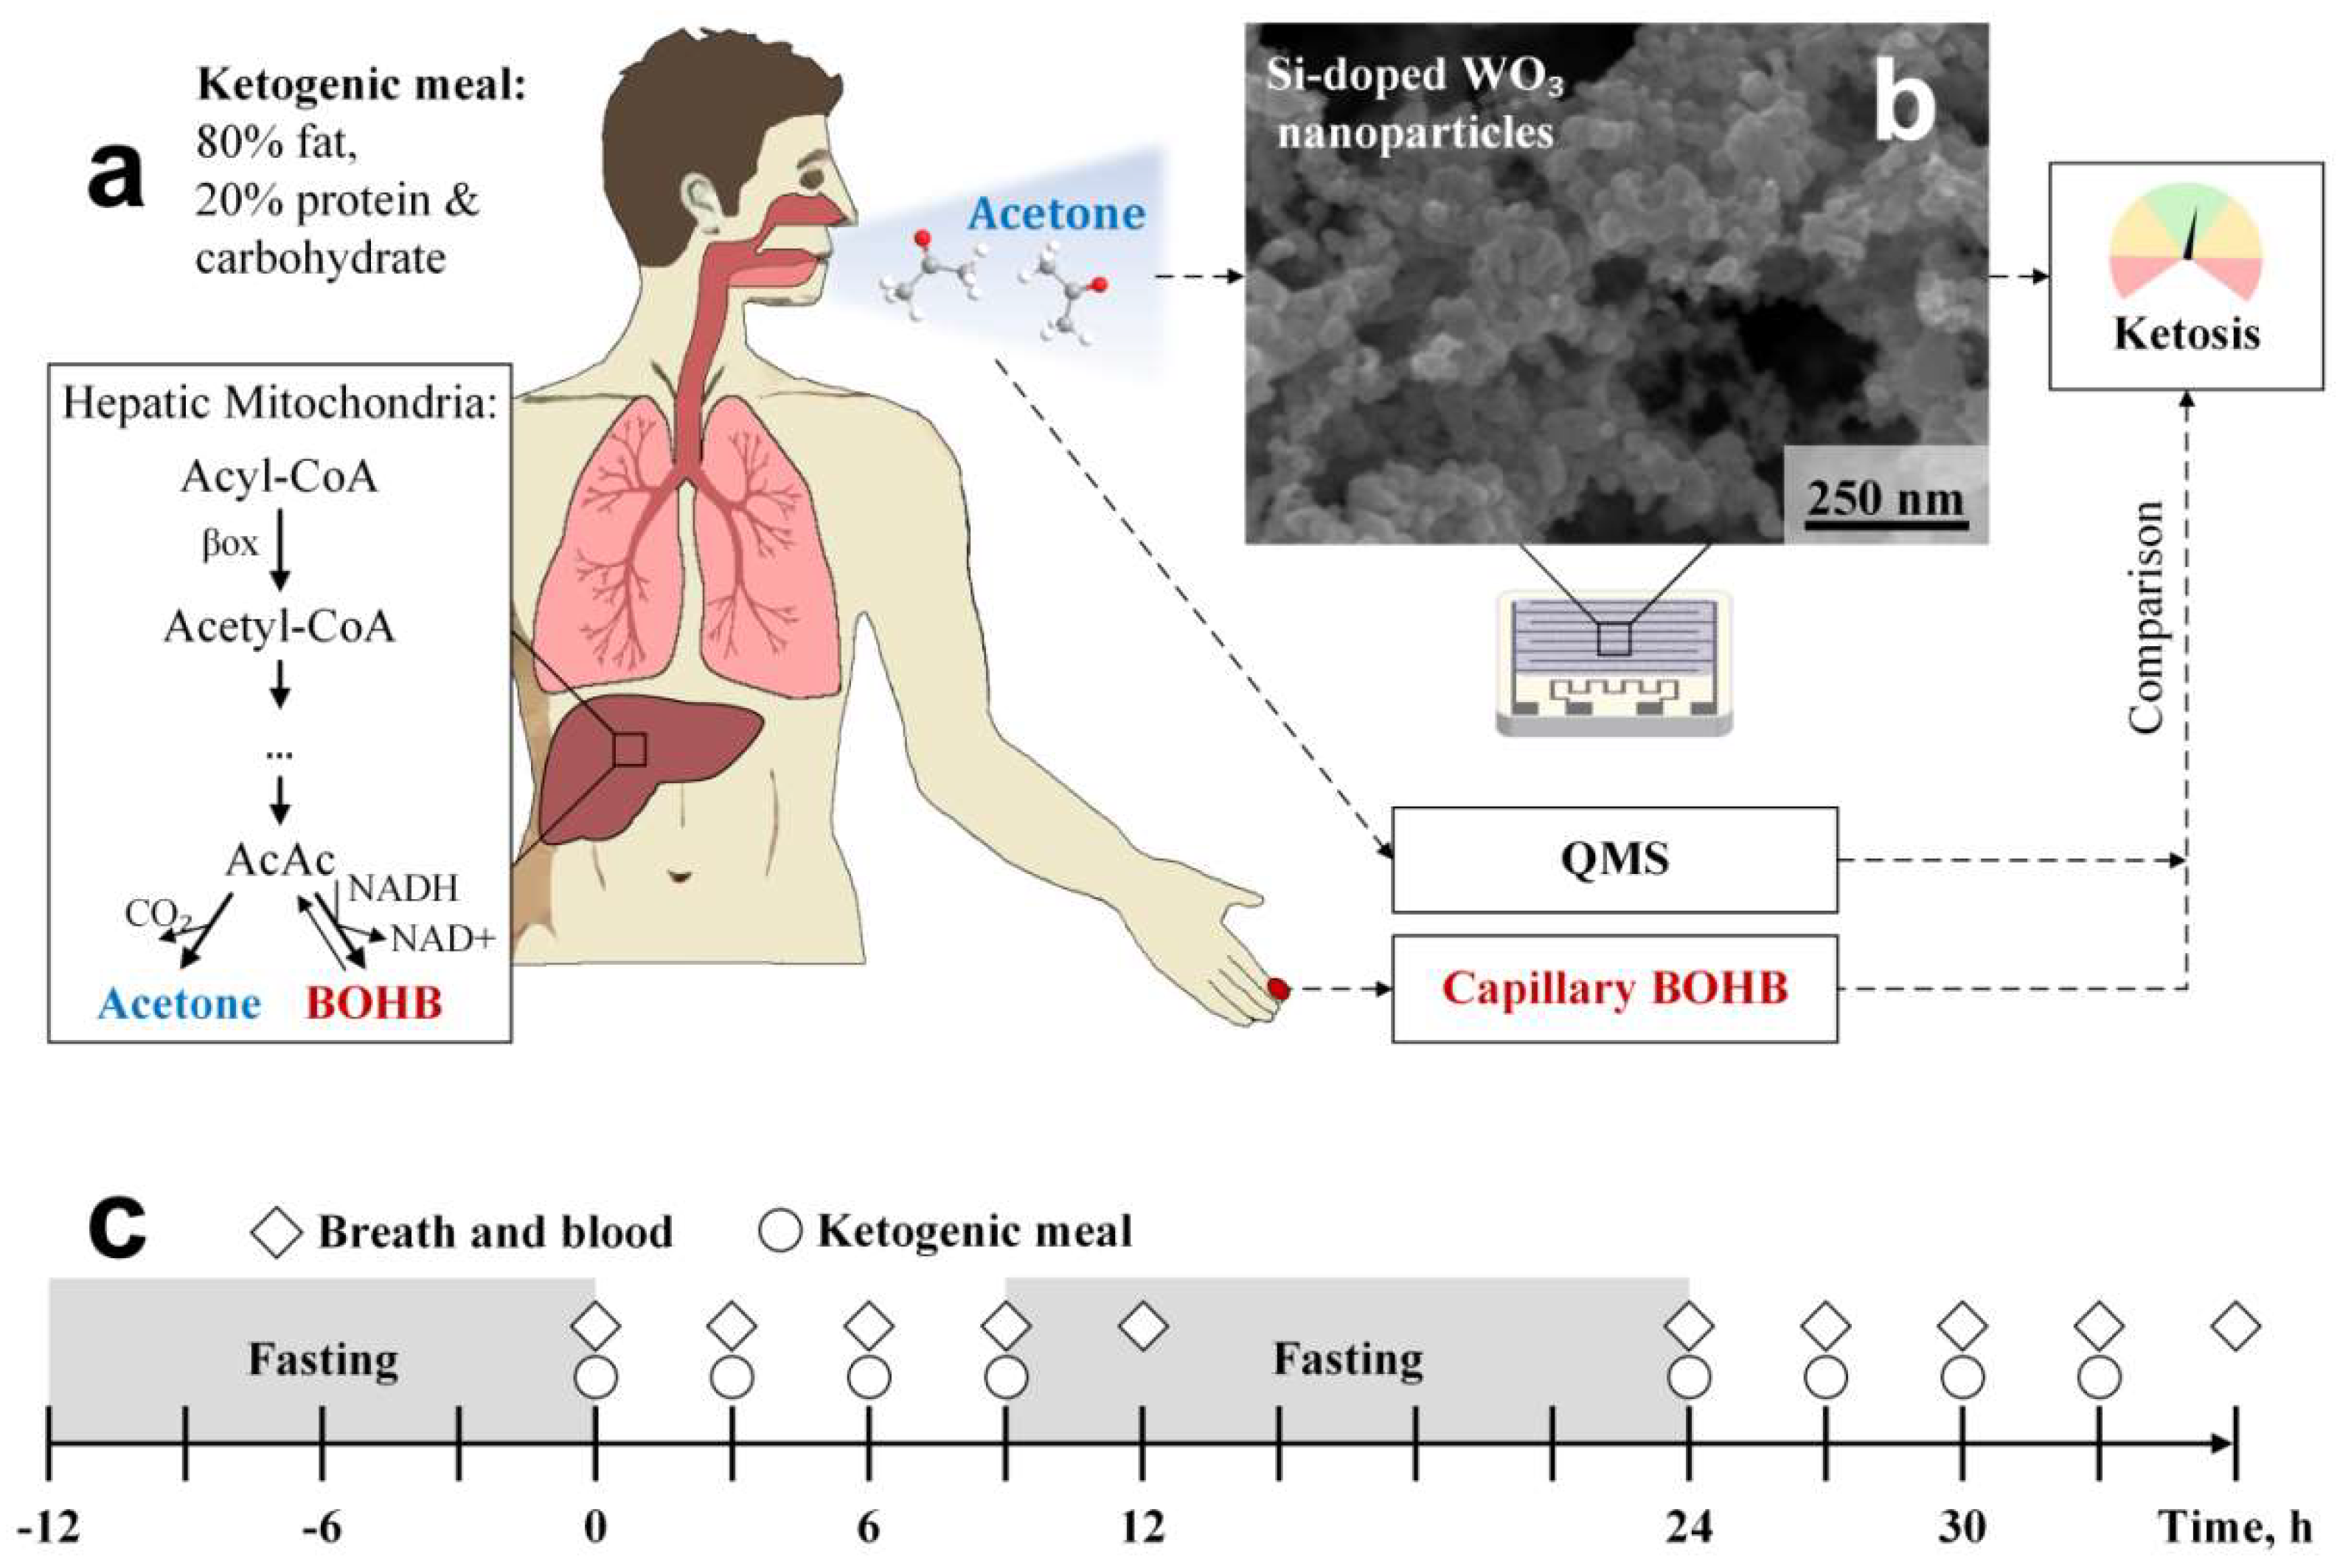
(a) Participants undergoing a KD feature intensified ketogenesis. Therein, acetone and BOHB are formed at elevated rates by metabolizing free fatty acids in the hepatic mitochondria (box). Acetone is volatile and can be measured non-invasively in the exhaled breath while non-volatile BOHB can be determined through capillary blood assay. To indicate the status of ketosis, breath acetone is measured with tailor-made and inexpensive chemoresistive sensing films (b). These consist of agglomerated and aggregated Si-doped WO3 nanoparticles, as indicated by SEM (top view). Sensor results are compared to parallel measurements of breath acetone by QMS and capillary blood BOHB. (c) Experimental protocol: Volunteers ingest a total of 8 ketogenic meals every 3 h (circles) on two consecutive days. Breath and capillary blood are analyzed 10 times, always just before the ketogenic meals and at the end of each measurement day. Prior to and in between both days, overnight fasting (gray shaded) is performed.
Figure 1.
(a) Participants undergoing a KD feature intensified ketogenesis. Therein, acetone and BOHB are formed at elevated rates by metabolizing free fatty acids in the hepatic mitochondria (box). Acetone is volatile and can be measured non-invasively in the exhaled breath while non-volatile BOHB can be determined through capillary blood assay. To indicate the status of ketosis, breath acetone is measured with tailor-made and inexpensive chemoresistive sensing films (b). These consist of agglomerated and aggregated Si-doped WO3 nanoparticles, as indicated by SEM (top view). Sensor results are compared to parallel measurements of breath acetone by QMS and capillary blood BOHB. (c) Experimental protocol: Volunteers ingest a total of 8 ketogenic meals every 3 h (circles) on two consecutive days. Breath and capillary blood are analyzed 10 times, always just before the ketogenic meals and at the end of each measurement day. Prior to and in between both days, overnight fasting (gray shaded) is performed.

Figure 2.
Scatter plot between the Si-doped WO3 sensor responses and QMS-measured acetone concentrations of 105 breath samples (11 volunteers). Power law fit is indicated as dashed line together with the corresponding coefficient of determination (R2). Inset images show the sensor chip (top left) and the QMS instrument (bottom right).
Figure 3.
Individual (a) breath acetone levels as determined by the Si-doped WO3 sensor, capillary blood (b) BOHB and (c) glucose concentrations of five representative volunteers during a 36-h KD. Note that volunteer #1 (green circles) had to abort the experiment already after 24 h due to strong nausea. Scatter plot of (d) BOHB and (e) glucose versus acetone concentrations for all eleven volunteers (105 samples) with corresponding Pearson’s (r) and Spearman’s (ρ) correlation coefficients. Dashed lines indicate fitted (power law in d and linear in e) trend lines.


Table 1.
Macronutrient composition of ketogenic meals.
| Macronutrient | Whipping Cream [wt%] | Protein Supplement Powder [wt%] |
|---|---|---|
| Fat | 35 | 2 |
| Carbohydrates | 3 | 3.8 |
| Protein | 3 | 80 |
| Calories [kcal/g] | 3.37 | 3.65 |
Table 2.
Demographic and anthropometric data as well as calculated energy expenditures of the participants.
Table 2.
Demographic and anthropometric data as well as calculated energy expenditures of the participants.
| Volunteer [-] | Gender [-] | Age [y] | Weight [kg] | Height [m] | BMI [kg/m²] | Physical Activity Factors [-] | 24-h Energy Expenditure [kcal/d] |
|---|---|---|---|---|---|---|---|
| 1 | f | 21 | 58.0 | 1.59 | 22.94 | 1.4 | 1831 |
| 2 | m | 23 | 69.4 | 1.77 | 22.15 | 1.4 | 2352 |
| 3 | m | 22 | 72.0 | 1.80 | 22.22 | 1.4 | 2610 |
| 4 | f | 22 | 51.4 | 1.63 | 19.35 | 1.4 | 1753 |
| 5 | m | 22 | 51.8 | 1.78 | 16.35 | 1.4 | 1598 |
| 6 | f | 28 | 78.8 | 1.63 | 29.66 | 1.4 | 2234 |
| 7 | f | 25 | 74.1 | 1.71 | 25.34 | 1.4 | 2142 |
| 8 | m | 22 | 73.2 | 1.73 | 24.46 | 1.4 | 1807 |
| 9 | m | 22 | 74.5 | 1.80 | 22.99 | 1.4 | 2471 |
| 10 | m | 22 | 70.8 | 1.82 | 21.37 | 1.6 | 2786 |
| 11 | f | 21 | 59.4 | 1.72 | 20.08 | 1.5 | 2100 |
© 2018 by the authors. Licensee MDPI, Basel, Switzerland. This article is an open access article distributed under the terms and conditions of the Creative Commons Attribution (CC BY) license (http://creativecommons.org/licenses/by/4.0/).
Share and Cite
MDPI and ACS Style
Güntner, A.T.; Kompalla, J.F.; Landis, H.; Theodore, S.J.; Geidl, B.; Sievi, N.A.; Kohler, M.; Pratsinis, S.E.; Gerber, P.A. Guiding Ketogenic Diet with Breath Acetone Sensors. Sensors 2018, 18, 3655. https://doi.org/10.3390/s18113655
AMA Style
Güntner AT, Kompalla JF, Landis H, Theodore SJ, Geidl B, Sievi NA, Kohler M, Pratsinis SE, Gerber PA. Guiding Ketogenic Diet with Breath Acetone Sensors. Sensors. 2018; 18(11):3655. https://doi.org/10.3390/s18113655
Chicago/Turabian StyleGüntner, Andreas T., Julia F. Kompalla, Henning Landis, S. Jonathan Theodore, Bettina Geidl, Noriane A. Sievi, Malcolm Kohler, Sotiris E. Pratsinis, and Philipp A. Gerber. 2018. "Guiding Ketogenic Diet with Breath Acetone Sensors" Sensors 18, no. 11: 3655. https://doi.org/10.3390/s18113655
Note that from the first issue of 2016, this journal uses article numbers instead of page numbers. See further details here.