Occupational Risk Prevention through Smartwatches: Precision and Uncertainty Effects of the Built-In Accelerometer

 ,
,  , ,
, ,  , and
, and
Abstract
:1. Introduction
Accelerometers
2. Materials and Methods
2.1. Test Devices
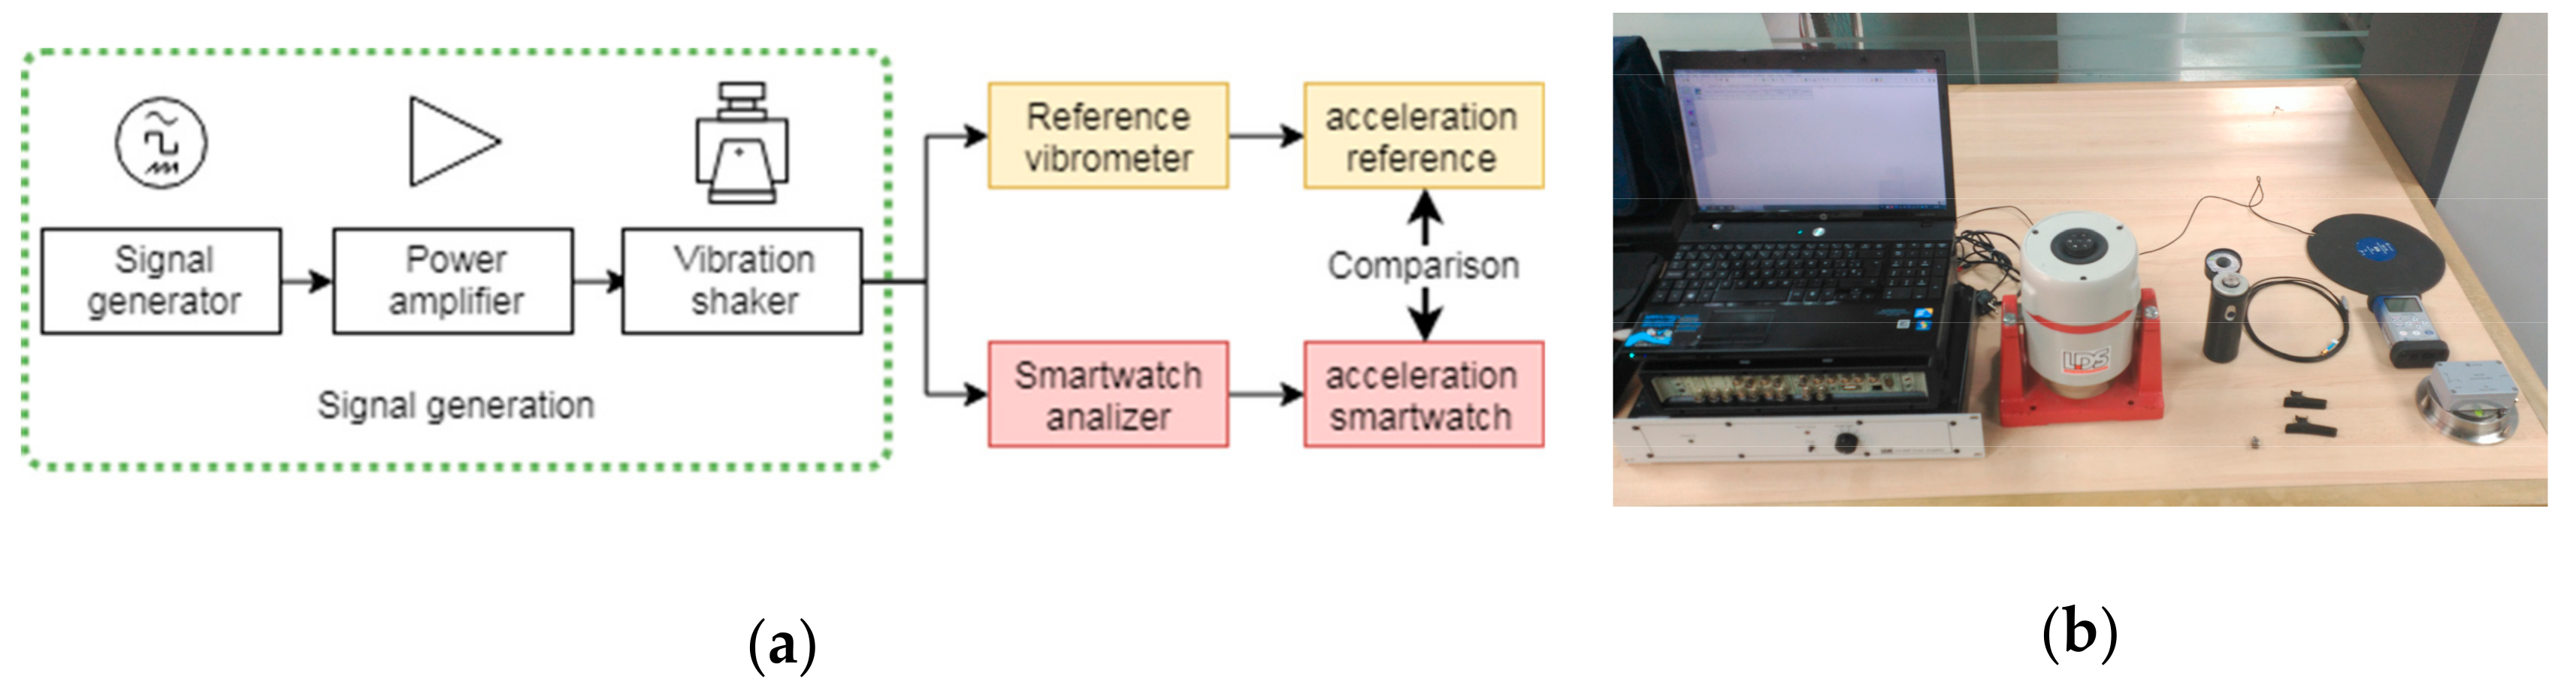
2.2. Test Bench
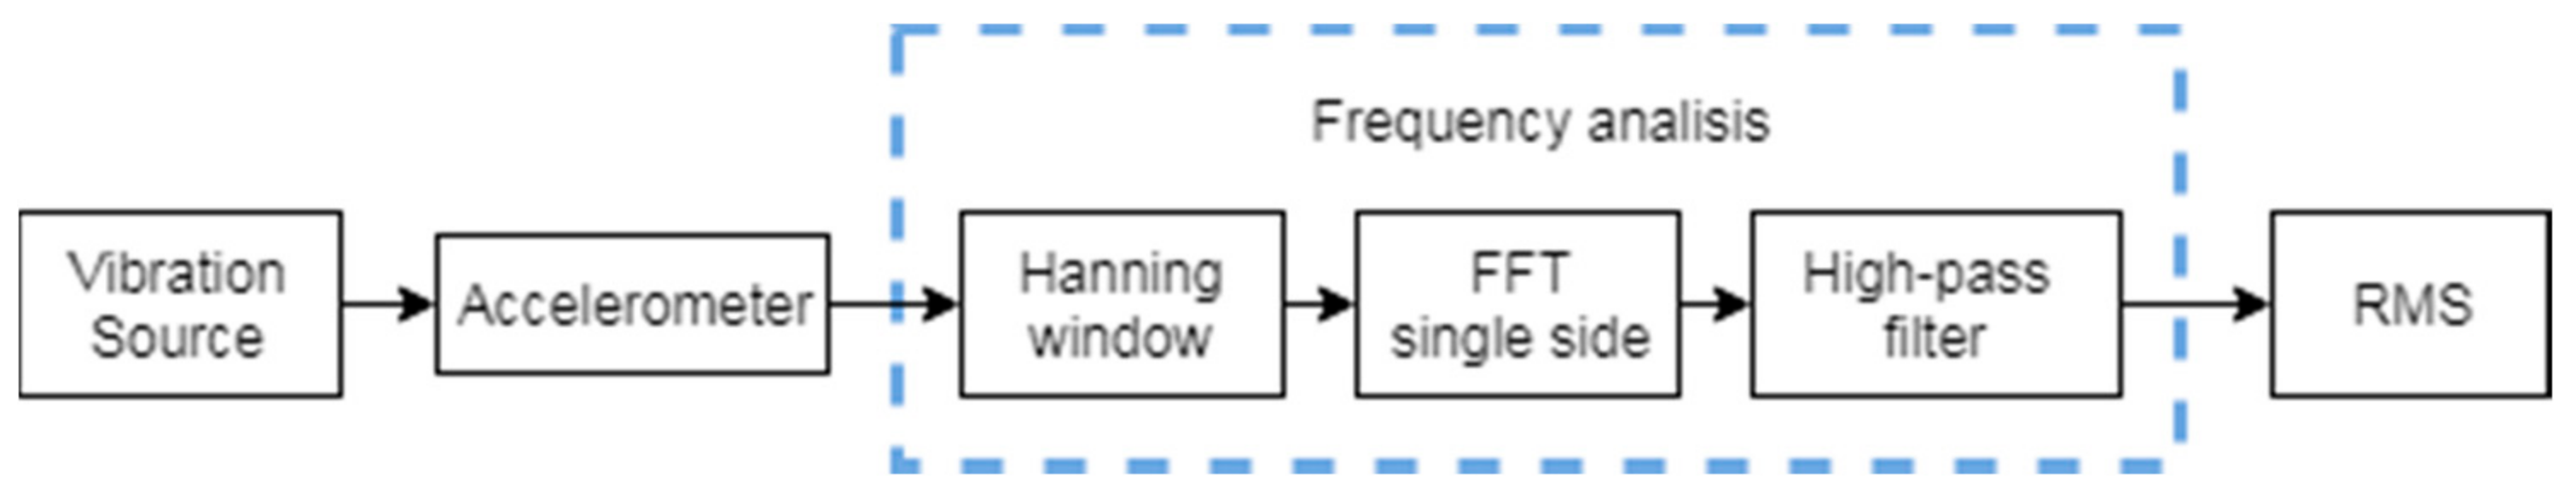
2.3. Development of the Vibration Measurement System for the Android Wear Devices
2.4. Calibration and Adjustment through the Comparison Method
2.5. Test of the Frequency Response at Different Amplitudes
2.6. Calibration and Measurement Uncertainties
- The uncertainty associated to the reference device.
- The temporary drift of the reference device.
- The scale division of the reference device and the device to be calibrated.
- The repeatability of the test during the calibration process.
- The alignment of the device to be calibrated against the reference.
- Environmental effects (temperature and humidity variation).
- Variations produced by the magnetic field of the vibration shaker.
- The uncertainty of the power amplifier and the vibration shaker.
- The uncertainty produced by the sampling rate variation of the smartwatches.
2.6.1. Model
- ctemp is the correction due to the temperature;
- cres is the correction due to the finite resolution of the meter;
- ccalib is the correction due to the calibration of the meter;
- ccross is the correction due to the cross sensitivity;
- cjitt is the correction due the sampling rate variation in the smartwatch (jitter error).
2.6.2. Characterization and Estimation of the Value of Contributions Type A and Type B
- uc,rel is the combined relative standard uncertainty;
- y is the measurand determinate for N input quantities x1, x2, …, xn;
- ∂f/∂xi are partial derivatives evaluated at Xi = xi;
- xi are estimated input values;
- urel (xi, xj) are estimated covariance.
3. Results
3.1. Frequency Response Test at Different Amplitudes
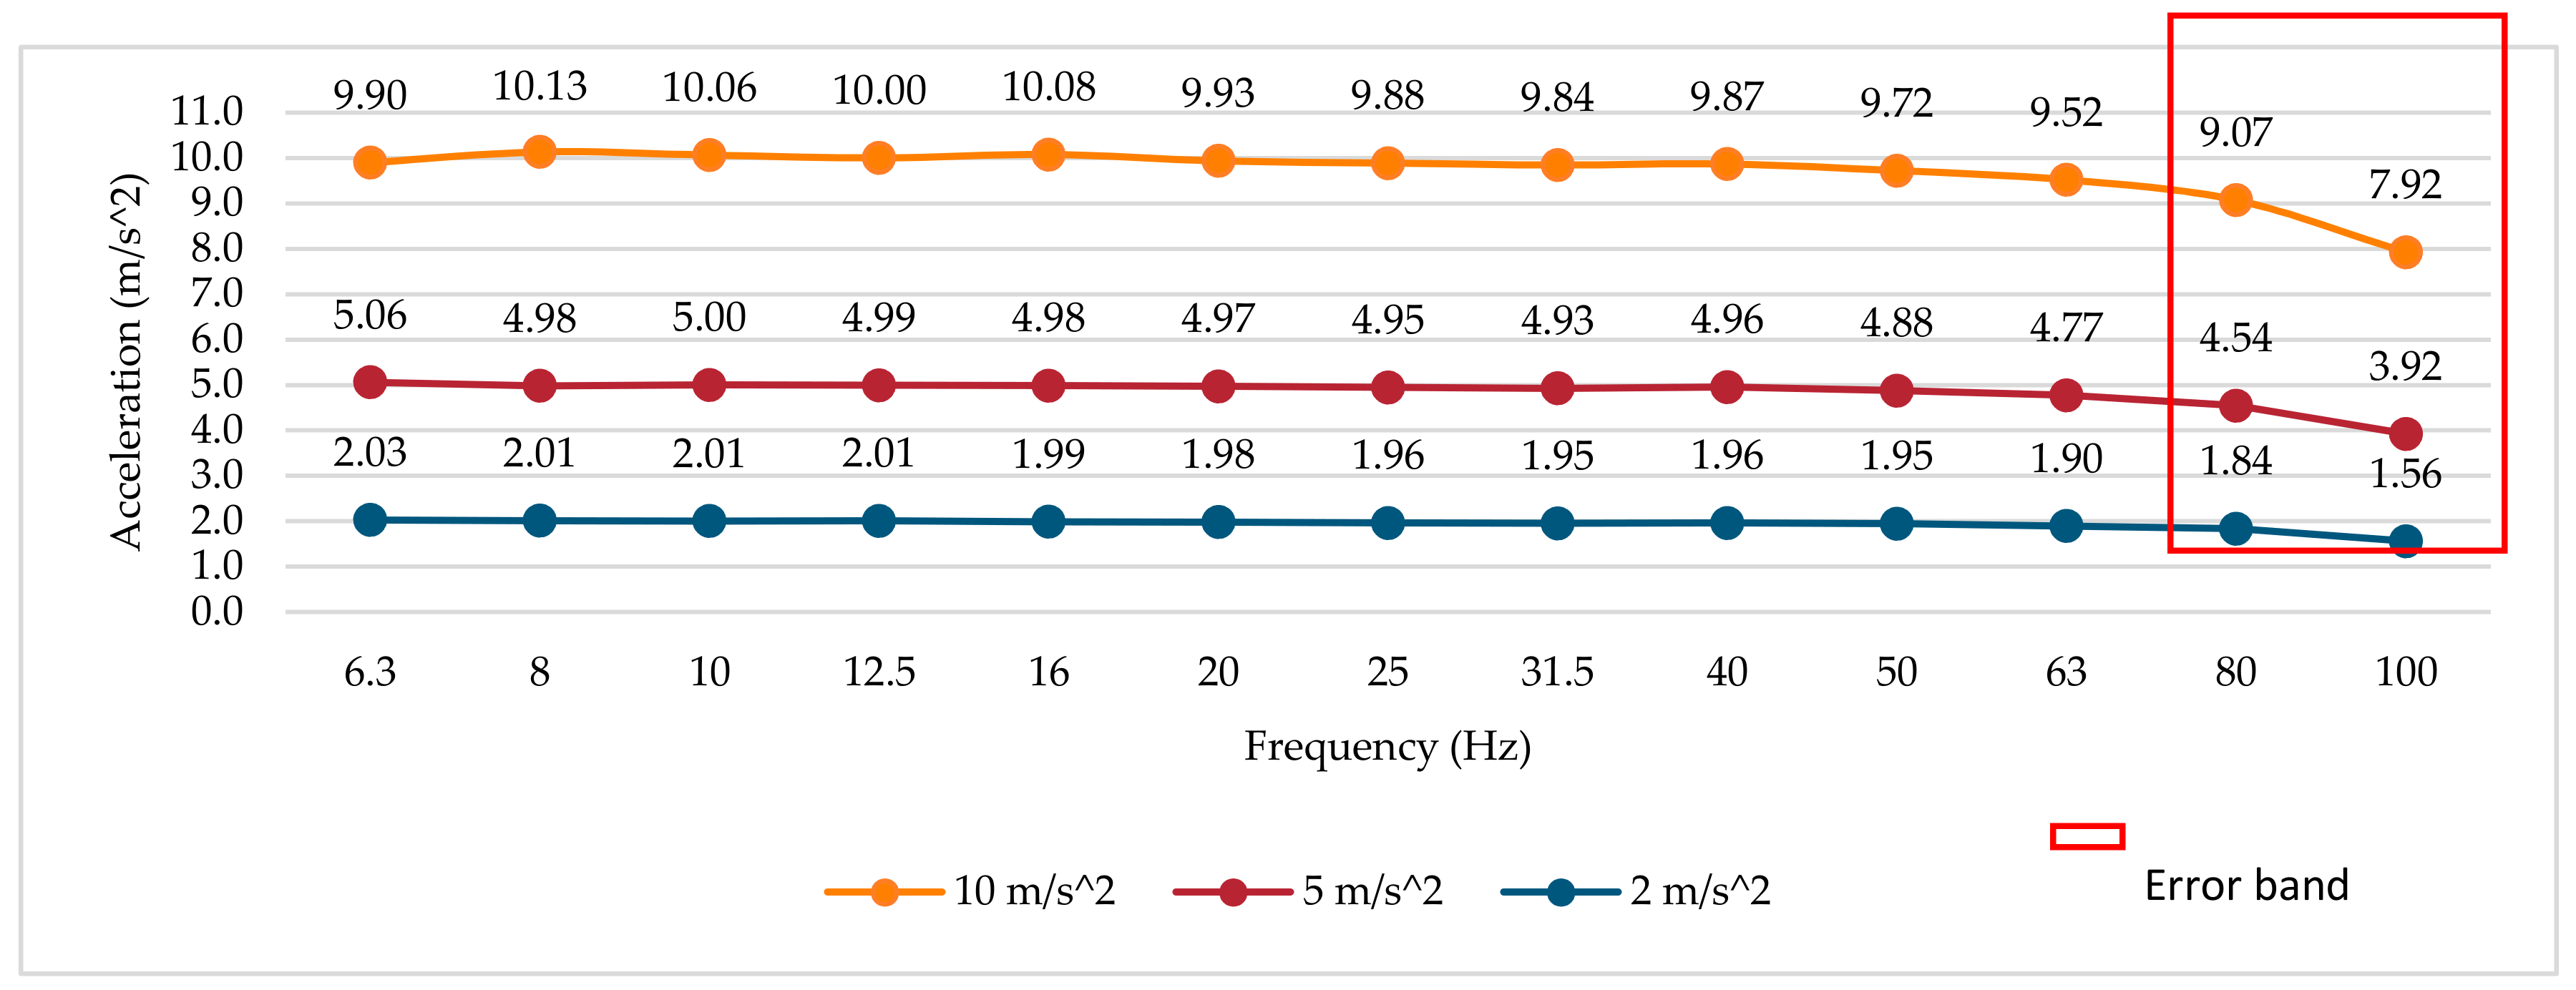
3.1.1. Smartwatch 1
3.1.2. Smartwatch 2
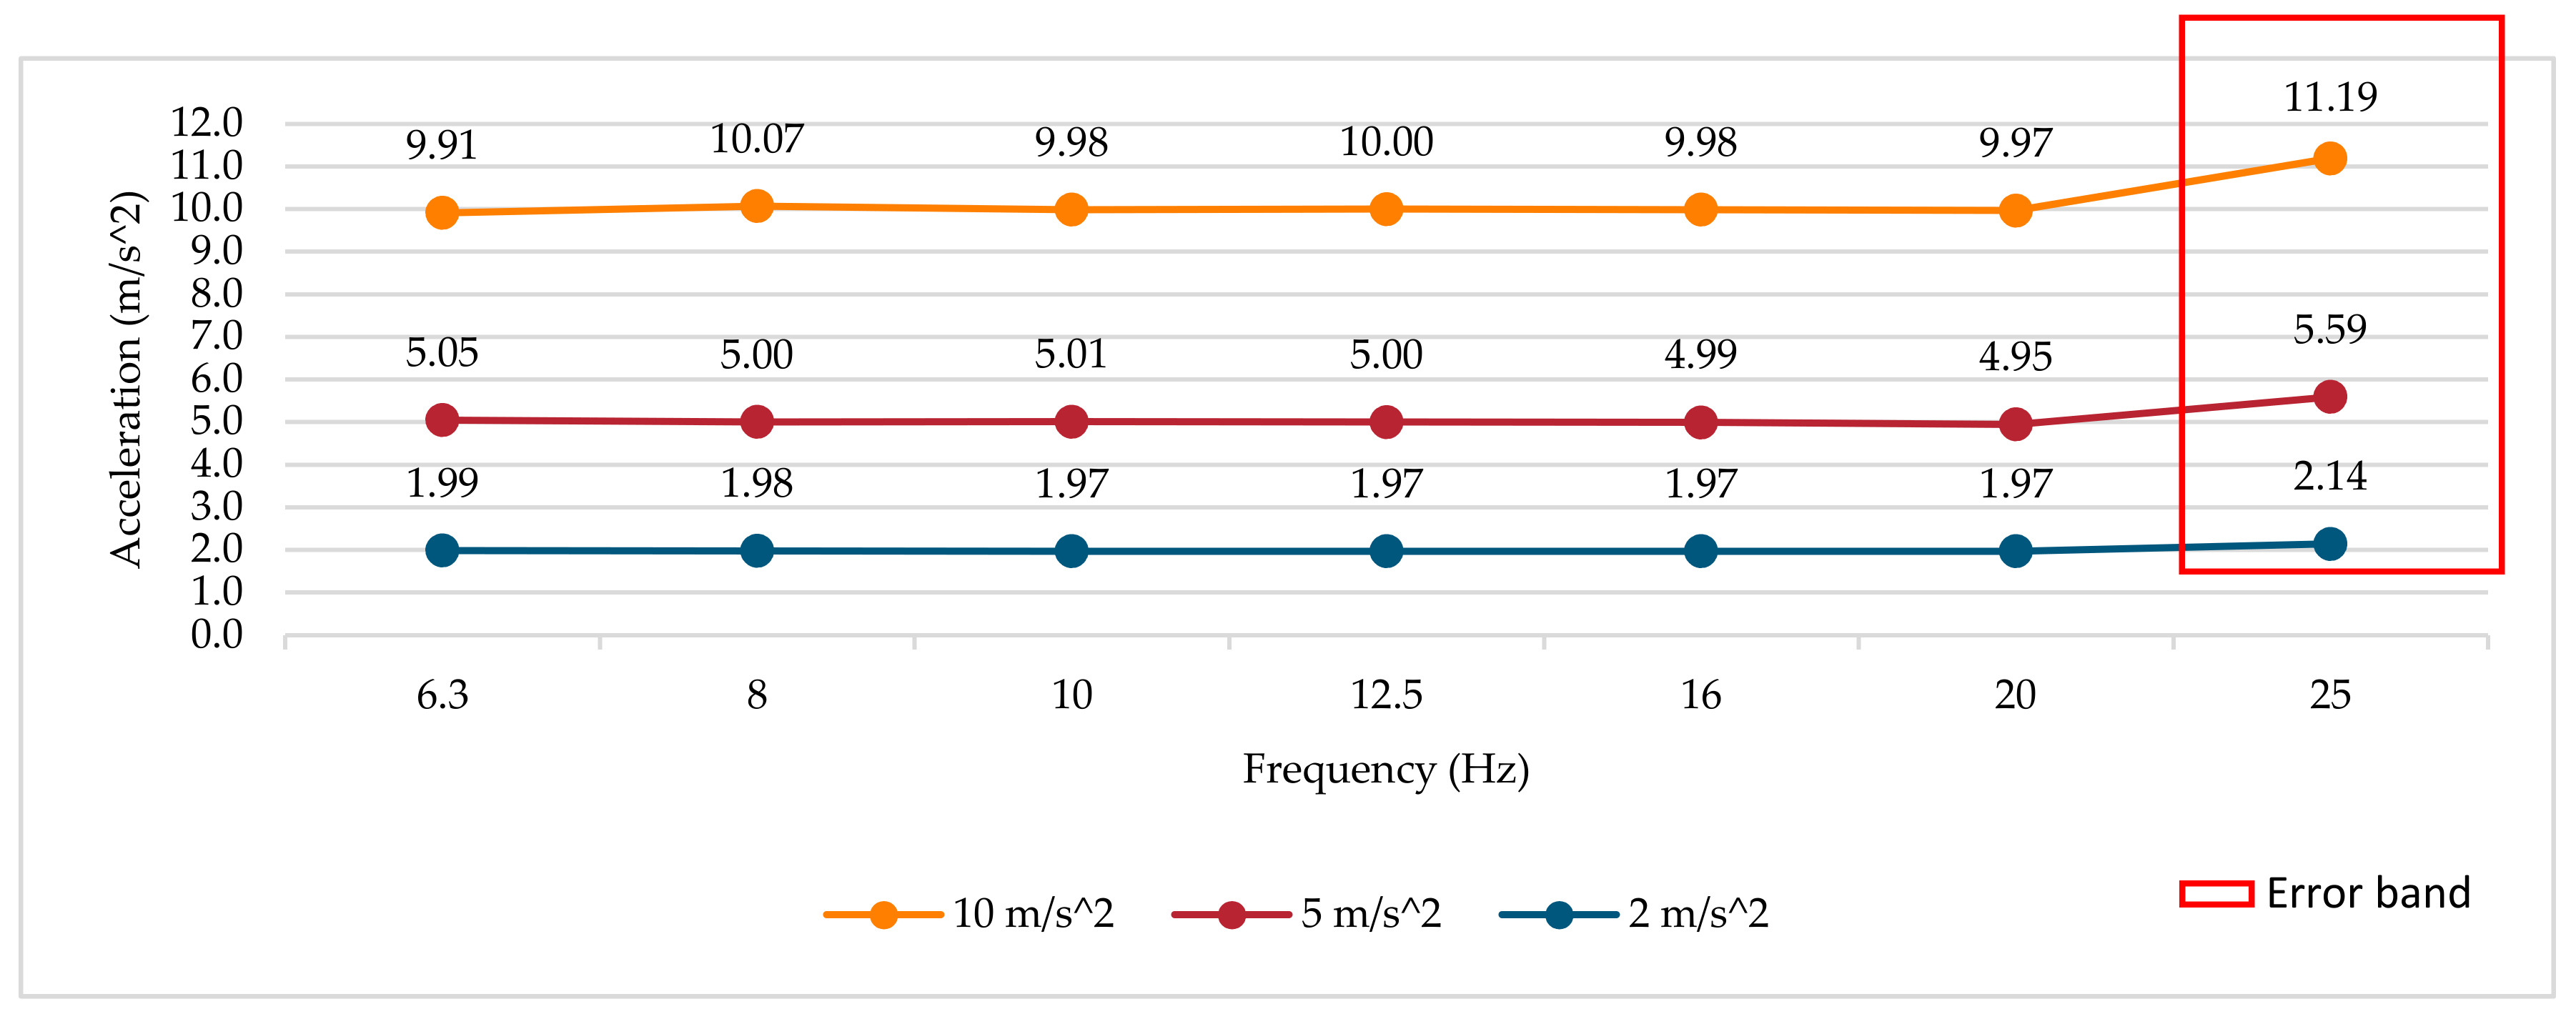
3.1.3. Smartwatch 3
3.2. Results of the Expanded Relative Uncertainties and Relative Deviation of the Smartwatches Measured from the Reference at Different Amplitudes and Frequencies
3.2.1. Smartwatch 1
3.2.2. Smartwatch 2
3.2.3. Smartwatch 3
4. Discussion
4.1. Analysis of the Frequency Response at Different Amplitudes
4.2. Measurement Uncertainties Analysis
4.3. Possible Uses with the Current Configuration and Limitations
4.3.1. Smartwatches for Physical Activity
4.3.2. Smartwatches for Fall Detection
4.3.3. Smartwatches for Hand–Arm Vibration
Author Contributions
Funding
Conflicts of Interest
References
- Sazonov, E.; Neuman, M.R. Wearable Sensors: Fundamentals, Implementation and Applications; Elsevier: Amsterdam, The Netherlands, 2014. [Google Scholar]
- Park, S.; Chung, K.; Jayaraman, S. Chapter 1.1—Wearables: Fundamentals, Advancements, and a Roadmap for the Future. Wearable Sens. 2014, 1–23. [Google Scholar] [CrossRef]
- Page, T. A Forecast of the Adoption of Wearable Technology. Int. J. Technol. Diffus. 2015, 6, 12–29. [Google Scholar] [CrossRef] [Green Version]
- Wright, R.; Keith, L. Wearable Technology: If the Tech Fits, Wear It. J. Electron. Resour. Med. Libr. 2014, 11, 204–216. [Google Scholar] [CrossRef]
- Rawassizadeh, R.; Price, B.; Petre, M. Wearables: Has the age of smartwatches finally arrived? Commun. ACM 2015, 58, 45–47. [Google Scholar] [CrossRef]
- Cecchinato, M.; Cox, A.; Bird, J. Smartwatches: The Good, the Bad and the Ugly? ACM: New York, NY, USA, 2015; pp. 2133–2138. [Google Scholar]
- Choi, J.; Kim, S. Is the smartwatch an IT product or a fashion product? A study on factors affecting the intention to use smartwatches. Comput. Hum. Behav. 2016, 63, 777–786. [Google Scholar] [CrossRef]
- Kim, K.; Shin, D. An acceptance model for smart watches Implications for the adoption of future wearable technology. Internet Res. 2015, 25, 527–541. [Google Scholar] [CrossRef]
- Page, T. Barriers to the Adoption of Wearable Technology. i-Manager’s J. Inform. Technol. 2015, 4, 1. [Google Scholar] [CrossRef]
- Chuah, S.; Rauschnabel, P.; Krey, N.; Nguyen, B.; Ramayah, T.; Lade, S. Wearable technologies: The role of usefulness and visibility in smartwatch adoption. Comput. Hum. Behav. 2016, 65, 276–284. [Google Scholar] [CrossRef]
- Wu, L.; Wu, L.; Chang, S. Exploring consumers’ intention to accept smartwatch. Comput. Hum. Behav. 2016, 64, 383–392. [Google Scholar] [CrossRef]
- Jackson, W. Pro Android Wearables: Building Apps for Smartwatches, 1st ed.; Apress: Berkeley, CA, USA, 2015. [Google Scholar]
- Hameed, S. Mastering Android Wear Application Development, 1st ed.; Packt Publishing: Mumbai, India; Birmingham, UK, 2016. [Google Scholar]
- Mishra, S. Wearable Android: Android Wear & Google Fit App Development, 1st ed.; Wiley: Hoboken, NJ, USA, 2015. [Google Scholar]
- Negi, I.; Tsow, F.; Tanwar, K.; Zhang, L.; Iglesias, R.A.; Chen, C.; Rai, A.; Forzani, E.S.; Tao, N. Novel monitor paradigm for real-time exposure assessment. J. Expo. Sci. Environ. Epidemiol. 2011, 21, 419–426. [Google Scholar] [CrossRef] [PubMed]
- Chan, M.; Estève, D.; Fourniols, J.; Escriba, C.; Campo, E. Smart wearable systems: Current status and future challenges. Artif. Intell. Med. 2012, 56, 137–156. [Google Scholar] [CrossRef] [PubMed]
- Kim, S.; Nussbaum, M. Performance evaluation of a wearable inertial motion capture system for capturing physical exposures during manual material handling tasks. Ergonomics 2013, 56, 314–326. [Google Scholar] [CrossRef] [PubMed]
- Peppoloni, L.; Filippeschi, A.; Ruffaldi, E.; Avizzano, C. A novel wearable system for the online assessment of risk for biomechanical load in repetitive efforts. Int. J. Ind. Ergon. 2016, 52, 1–11. [Google Scholar] [CrossRef]
- Aiello, G.; La Scalia, G.; Vallone, M.; Catania, P.; Venticinque, M. Real time assessment of hand-arm vibration system based on capacitive MEMS accelerometers. Comput. Electron. Agric. 2012, 85, 45–52. [Google Scholar] [CrossRef] [Green Version]
- Morello, R.; De Capua, C.; Meduri, A. A Wireless Measurement System for Estimation of Human Exposure to Vibration During the Use of Handheld Percussion Machines. IEEE Trans. Instrum. Meas. 2010, 59, 2513–2521. [Google Scholar] [CrossRef]
- Ferreira, B.; Serejo, G.; Ferreira, M.; Ferreira, D.; Cardoso, L.; Yoshidome, E.; Arruda, H.; Lira, W.; Ferreira, J.; Carvalho, E.; et al. Wearable computing for railway environments: Proposal and evaluation of a safety solution. IET Intell. Transp. Syst. 2017, 11, 319–325. [Google Scholar] [CrossRef]
- Bernal, G.; Colombo, S.; Al Ai Baky, M.; Casalegno, F. Safety: Designing IoT and Wearable Systems for Industrial Safety through a User Centered Design Approach. In Proceedings of the 10th International Conference on Pervasive Technologies Related to Assistive Environments, Island of Rhodes, Greece, 21–23 June 2017; ACM: New York, NY, USA, 2017; pp. 163–170. [Google Scholar]
- Lee, W.; Lin, K.; Seto, E.; Migliaccio, G. Wearable sensors for monitoring on-duty and off-duty worker physiological status and activities in construction. Autom. Constr. 2017, 83, 341–353. [Google Scholar] [CrossRef]
- Valero, E.; Sivanathan, A.; Bosche, F.; Abdel-Wahab, M. Analysis of construction trade worker body motions using a wearable and wireless motion sensor network. Autom. Constr. 2017, 83, 48–55. [Google Scholar] [CrossRef]
- Yan, X.; Li, H.; Li, A.; Zhang, H. Wearable IMU-based real-time motion warning system for construction workers’ musculoskeletal disorders prevention. Autom. Constr. 2017, 74, 2–11. [Google Scholar] [CrossRef]
- Daponte, P.; De Vito, L.; Picariello, F.; Riccio, M. State of the art and future developments of measurement applications on smartphones. Meas. J. Int. Meas. Confed. 2013, 46, 3291–3307. [Google Scholar] [CrossRef]
- Liu, B.; Koc, A.B. Hand-Arm Vibration Measurements and Analysis Using Smartphones. In Proceedings of the ASABE Annual International Meeting, Kansas City, MO, USA, 21–24 July 2013; American Society of Agricultural and Biological Engineers: St. Joseph, MI, USA, 2013. [Google Scholar]
- Cutini, M.; Bisaglia, C. Whole body vibration monitoring using a smartphone. In Proceedings of the International Conference of Agricultural Engineering (AgEng), Zurich, Switzerland, 6–10 July 2014. [Google Scholar]
- Pancardo, P.; Acosta, F.; Hernandez-Nolasco, J.; Wister, M.; Lopez-de-Ipina, D. Real-Time Personalized Monitoring to Estimate Occupational Heat Stress in Ambient Assisted Working. Sensors 2015, 15, 16956–16980. [Google Scholar] [CrossRef] [PubMed] [Green Version]
- Nath, N.; Akhavian, R.; Behzadan, A. Ergonomic analysis of construction worker’s body postures using wearable mobile sensors. Appl. Ergon. 2017, 62, 107–117. [Google Scholar] [CrossRef] [PubMed]
- Wolfgang, R.; Burgess-Limerick, R. Using Consumer Electronic Devices to Estimate Whole-Body Vibration Exposure. J. Occup. Environ. Hyg. 2014, 11, D77–D81. [Google Scholar] [CrossRef] [PubMed]
- Wolfgang, R.; Di Corleto, L.; Burgess-Limerick, R. Can an iPod Touch Be Used to Assess Whole-Body Vibration Associated with Mining Equipment? Ann. Occup. Hyg. 2014, 58, 1200–1204. [Google Scholar] [CrossRef] [PubMed] [Green Version]
- Kardous, C.A.; Celestina, M. Use of smartphone sound measurement apps for occupational noise assessments. J. Acoust. Soc. Am. 2015, 137, 2292. [Google Scholar] [CrossRef]
- Robinson, D.; Tingay, J. Comparative study of the performance of smartphone-based sound level meter apps, with and without the application of a ½” IEC-61094-4 working standard microphone, to IEC-61672 standard metering equipment in the detection of various problematic workplace noise environments. In Proceedings of the 43rd International Congress on Noise Control Engineering, Melbourne, Australia, 16–19 November 2014. [Google Scholar]
- Cerqueira, D.; Carvalho, F.; Melo, R.B. Is It Smart to Use Smartphones to Measure Illuminance for Occupational Health and Safety Purposes? In Proceedings of the International Conference on Applied Human Factors and Ergonomics, Los Angeles, CA, USA, 17–21 July 2017; Springer: Cham, Switzerland, 2017; pp. 258–268. [Google Scholar]
- Bieber, G.; Kirste, T.; Urban, B. Ambient Interaction by Smart Watches; ACM: New York, NY, USA, 2012; pp. 1–6. [Google Scholar]
- Matthies, D.; Bieber, G.; Kaulbars, U. AGIS: Automated Tool Detection & Hand-Arm Vibration Estimation Using an Unmodified Smartwatch; ACM: New York, NY, USA, 2016; pp. 1–4. [Google Scholar]
- Pavón, I.; Sigcha, L.; López, J.; De Arcas, G. Wearable technology usefulness for occupational risk prevention: Smartwatches for hand-arm vibration exposure assessment. In Proceedings of the Occupational Safety and Hygiene V: Selected Papers from the International Symposium on Occupational Safety and Hygiene (SHO 2017), Guimarães, Portugal, 10–11 April 2017; CRC Press: Boca Raton, FL, USA, 2017; p. 65. [Google Scholar]
- Pavón, I.; Sigcha, L.; Arezes, P.; Costa, N.; Arcas, G.; López, J. Wearable technology for occupational risk assessment: Potential avenues for applications. In Occupational Safety and Hygiene VI, Proceedings of the 6th International Symposium on Occupation Safety and Hygiene (SHO 2018), Guimarães, Portugal, 26–27 March 2018; CRC Press: Boca Raton, FL, USA, 2018; p. 447. [Google Scholar]
- Podgorski, D.; Majchrzycka, K.; Dabrowska, A.; Gralewicz, G.; Okrasa, M. Towards a conceptual framework of OSH risk management in smart working environments based on smart PPE, Ambient intelligence and the Internet of Things technologies. Int. J. Occup. Saf. Ergon. 2017, 23, 1–20. [Google Scholar] [CrossRef] [PubMed]
- Li, R.Y.M. Smart Working Environments Using the Internet of Things and Construction Site Safety. In An Economic Analysis on Automated Construction Safety; Springer: Berlin, Germany, 2018; pp. 137–153. [Google Scholar]
- Knight, J.F.; Bristow, H.W.; Anastopoulou, S.; Baber, C.; Schwirtz, A.; Arvanitis, T.N. Uses of accelerometer data collected from a wearable system. Pers. Ubiquitous Comput. 2007, 11, 117–132. [Google Scholar] [CrossRef]
- Yang, C.; Hsu, Y. A review of accelerometry-based wearable motion detectors for physical activity monitoring. Sensors 2010, 10, 7772–7788. [Google Scholar] [CrossRef] [PubMed]
- Ohtaki, Y.; Susumago, M.; Suzuki, A.; Sagawa, K.; Nagatomi, R.; Inooka, H. Automatic classification of ambulatory movements and evaluation of energy consumptions utilizing accelerometers and a barometer. Microsyst. Technol. 2005, 11, 1034–1040. [Google Scholar] [CrossRef]
- Scott, K.; Browning, R. Occupational physical activity assessment for chronic disease prevention and management: A review of methods for both occupational health practitioners and researchers. J. Occup. Environ. Hyg. 2016, 13, 451–463. [Google Scholar] [CrossRef] [PubMed]
- Mannini, A.; Intille, S.S.; Rosenberger, M.; Sabatini, A.M.; Haskell, W. Activity Recognition Using a Single Accelerometer Placed at the Wrist or Ankle. Med. Sci. Sports Exerc. 2013, 45, 2193–2203. [Google Scholar] [CrossRef] [PubMed] [Green Version]
- Bieber, G.; Haescher, M.; Vahl, M. Sensor Requirements for Activity Recognition on Smart Watches; ACM: New York, NY, USA, 2013; pp. 1–6. [Google Scholar]
- Mortazavi, B.; Nemati, E.; VanderWall, K.; Flores-Rodriguez, H.; Cai, J.; Lucier, J.; Naeim, A.; Sarrafzadeh, M. Can Smartwatches Replace Smartphones for Posture Tracking? Sensors 2015, 15, 26783–26800. [Google Scholar] [CrossRef] [PubMed] [Green Version]
- Weiss, G.M.; Timko, J.L.; Gallagher, C.M.; Yoneda, K.; Schreiber, A.J. Smartwatch-based activity recognition: A machine learning approach. In Proceedings of the 2016 IEEE EMBS International Conference on Biomedical and Health Informatics (BHI), Las Vegas, NV, USA, 24–27 February 2016; pp. 426–429. [Google Scholar]
- Ramos, F.; Moreira, A.; Costa, A.; Rolim, R.; Almeida, H.; Perkusich, A. Combining Smartphone and Smartwatch Sensor Data in Activity Recognition Approaches: An Experimental Evaluation. In Proceedings of the International Conference on Software Engineering & Knowledge Engineering; SEKE: San Francisco Bay, CA, USA, 2016; pp. 267–272. [Google Scholar]
- Pannurat, N.; Thiemjarus, S.; Nantajeewarawat, E. Automatic Fall Monitoring: A Review. Sensors 2014, 14, 12900–12936. [Google Scholar] [CrossRef] [PubMed] [Green Version]
- Casilari, E.; Luque, R.; Moron, M. Analysis of Android Device-Based Solutions for Fall Detection. Sensors 2015, 15, 17827–17894. [Google Scholar] [CrossRef] [PubMed]
- Fang, Y.; Dzeng, R. Accelerometer-based fall-portent detection algorithm for construction tiling operation. Autom. Constr. 2017, 84, 214–230. [Google Scholar] [CrossRef]
- Gjoreski, M.; Gjoreski, H.; Lustrek, M.; Gams, M. How Accurately Can Your Wrist Device Recognize Daily Activities and Detect Falls? Sensors 2016, 16, 800. [Google Scholar] [CrossRef] [PubMed]
- Casilari, E.; Oviedo-Jiménez, M.A. Automatic Fall Detection System Based on the Combined Use of a Smartphone and a Smartwatch. PLoS ONE 2015, 10. [Google Scholar] [CrossRef] [PubMed]
- Westbrook, M.H.; Turner, J.D. Automotive Sensors; CRC Press: Bristol, UK, 1994. [Google Scholar]
- Jean-Michel, S. Market opportunities for advanced MEMS accelerometers and overview of actual capabilities vs. required specifications. In Proceedings of the PLANS 2004, Position Location and Navigation Symposium (IEEE Cat. No.04CH37556), Monterey, CA, USA, 26–29 April 2004; pp. 78–82. [Google Scholar]
- Mohd-Yasin, F.; Korman, C.E.; Nagel, D.J. Measurement of noise characteristics of MEMS accelerometers. Solid State Electron. 2003, 47, 357–360. [Google Scholar] [CrossRef]
- Albarbar, A.; Badri, A.; Sinha, J.K.; Starr, A. Performance evaluation of MEMS accelerometers. Measurement 2009, 42, 790–795. [Google Scholar] [CrossRef] [Green Version]
- Ghisi, A.; Kalicinski, S.; Mariani, S.; De Wolf, I.; Corigliano, A. Polysilicon MEMS accelerometers exposed to shocks: Numerical–experimental investigation. J. Micromech. Microeng. 2009, 19, 035023. [Google Scholar] [CrossRef]
- Mariani, S.; Ghisi, A.; Corigliano, A.; Zerbini, S. Multi-scale analysis of MEMS sensors subject to drop impacts. Sensors 2007, 7, 1817–1833. [Google Scholar] [CrossRef] [PubMed]
- Ratcliffe, C.; Heider, D.; Crane, R.; Krauthauser, C.; Yoon, M.K.; Gillespie, J.W. Investigation into the use of low cost MEMS accelerometers for vibration based damage detection. Compos. Struct. 2008, 82, 61–70. [Google Scholar] [CrossRef]
- Xiong, X.; Wu, Y.; Jone, W.B. Material Fatigue and Reliability of MEMS Accelerometers. In Proceedings of the 2008 IEEE International Symposium on Defect and Fault Tolerance of VLSI Systems, Boston, MA, USA, 1–3 Octber 2008; pp. 314–322. [Google Scholar]
- Mohd-Yasin, F.; Nagel, D.J.; Korman, C.E. Noise in MEMS. Meas. Sci. Technol. 2010, 21, 012001. [Google Scholar] [CrossRef]
- Tarabini, M.; Saggin, B.; Scaccabarozzi, D.; Moschioni, G. The potential of micro-electro-mechanical accelerometers in human vibration measurements. J. Sound Vib. 2012, 331, 487–499. [Google Scholar] [CrossRef]
- ISO 8041:2005. Human Response to Vibration—Measuring Instrumentation; ISO: Geneva, Switzerland, 2005. [Google Scholar]
- Brandt, A. Noise and Vibration Analysis: Signal Analysis and Experimental Procedures; Wiley: Chichester, UK, 2011. [Google Scholar]
- ISO 16063-21:2003. Methods for the Calibration of Vibration and Shock Transducers–Part 21: Vibration Calibration by Comparison to a Reference Transducer; ISO: Geneva, Switzerland, 2003. [Google Scholar]
- Sigcha, L. Soluciones Basadas en Tecnología Wearable Para la Valoración de Vibraciones en el Puesto de Trabajo Que Afectan Al Sistema Mano Brazo. Master’s Thesis, Universidad Politécnica de Madrid, Madrid, Spain, 2017. [Google Scholar]
- Smith, S.W. Digital Signal Processing: A Practical Guide for Engineers and Scientists; Newnes: Amsterdam, The Netherlands, 2003. [Google Scholar]
- ISO 266:1997. Acoustics—Preferred Frequencies; ISO: Geneva, Switzerland, 1997. [Google Scholar]
- ISO/IEC Guide 98-3:2008. Uncertainty of Measurement—Part 3: Guide to the Expression of Uncertainty in Measurement (GUM:1995); ISO: Geneva, Switzerland, 2008. [Google Scholar]
- Centro Español de Metrología AC-001 Procedimiento Para la Calibración de Acelerómetros 1999. Available online: http://www.cem.es/divulgacion/publicaciones/ac-001-procedimiento-para-la-calibración-de-acelerómetros (accessed on 1 July 2018).
- JCGM. Evaluation of Measurement Data—Supplement 1 to the “Guide to the Expression of Uncertainty in Measurement”—Propagation of Distributions Using a Monte Carlo Method. 2008. Available online: https://www.bipm.org/utils/common/documents/jcgm/JCGM_101_2008_E.pdf (accessed on 25 October 2018).
- Brannon, B.; Barlow, A. Aperture Uncertainty and ADC System Performance. Application Note AN 2006, 501. Available online: http://www.analog.com/media/en/technical-documentation/application-notes/an-501.pdf (accessed on 11 June 2018).
- Sensors Overview Sensor Coordinate System. Available online: https://developer.android.com/guide/topics/sensors/sensors_overview.html (accessed on 9 April 2018).
- Concettoni, E.; Griffin, M. The apparent mass and mechanical impedance of the hand and the transmission of vibration to the fingers, hand, and arm. J. Sound Vib. 2009, 325, 664–678. [Google Scholar] [CrossRef]
- Habib, M.; Mohktar, M.; Kamaruzzaman, S.; Lim, K.; Pin, T.; Ibrahim, F. Smartphone-Based Solutions for Fall Detection and Prevention: Challenges and Open Issues. Sensors 2014, 14, 7181–7208. [Google Scholar] [CrossRef] [PubMed] [Green Version]
- Mellone, S.; Tacconi, C.; Schwickert, L.; Klenk, J.; Becker, C.; Chiari, L. Smartphone-based solutions for fall detection and prevention: The FARSEEING approach. Zeitschrift für Gerontologie und Geriatrie 2012, 45, 722–727. [Google Scholar] [CrossRef] [PubMed]
- Abbate, S.; Avvenuti, M.; Bonatesta, F.; Cola, G.; Corsini, P.; Vecchio, A. A smartphone-based fall detection system. Pervasive Mob. Comput. 2012, 8, 883–899. [Google Scholar] [CrossRef]
- Fudickar, S.; Lindemann, A.; Schnor, B. Threshold-Based Fall Detection on Smart Phones. In Proceedings of the International Conference on Health Informatics, Angers, France, 3–6 March 2014; pp. 303–309. [Google Scholar]
- Moschioni, G.; Saggin, B.; Tarabini, M. Prediction of data variability in hand-arm vibration measurements. Measurement 2011, 44, 1679–1690. [Google Scholar] [CrossRef]
- Laput, G.; Xiao, R.; Harrison, C. ViBand: High-Fidelity Bio-Acoustic Sensing Using Commodity Smartwatch Accelerometers; ACM: New York, NY, USA, 2016; pp. 321–333. [Google Scholar]


| Smartwatch 1 | Smartwatch 2 | Smartwatch 3 | |
|---|---|---|---|
| Dimension (mm) | 36 × 10 × 51 | 45.5 × 52.2 × 10.9 | 45 × 45 × 11.5 |
| Weight (g) | 38 | 66.5 | 54 |
| Accelerometer amplitude range (standard acceleration due to gravity: g) | ±2, ±4, ±8, ±16 | ±2, ±4, ±8, ±16 | ±2, ±4, ±8, ±16 |
| Accelerometer maximum sample rate (Hz) | 2000 | 4000 | 1000 |
| Accelerometer maximum sample rate set in Android (Hz) | 250 | 200 | 50 |
| Analog-to-Digital Converter (ADC) (bit) | 12 | 16 | 16 |
| Variable | Estimator | Density Function | Type | Description |
|---|---|---|---|---|
| Ex | Y | Normal | A | Indication error |
| u accelref | X1 | Normal | A | Reference vibrometer RMS acceleration |
| u accelsw | X2 | Normal | A | Smartwatch RMS acceleration |
| u tempref | X3 | Rectangular | B | Reference vibrometer variation due to the temperature |
| u tempsw | X4 | Rectangular | B | Smartwatch based vibrometer variation due to the temperature |
| u resref | X5 | Rectangular | B | Reference vibrometer finite resolution |
| u ressw | X6 | Rectangular | B | Smartwatch vibrometer finite resolution |
| u calibref | X7 | Normal | B | Reference vibrometer uncertainty |
| u calibsw | X8 | Normal | B | Smartwatch calibration uncertainty |
| u crosssw | X9 | Rectangular | B | Smartwatch accelerometer cross sensitivity |
| u crossref | X10 | Rectangular | B | Reference accelerometer cross sensitivity |
| u swjitt | X11 | Normal | B | Smartwatch RMS uncertainty due to the sampling rate variation |
| Frequency (Hz) | ||||||||||||||
|---|---|---|---|---|---|---|---|---|---|---|---|---|---|---|
| Amplitude | 6.3 | 8 | 10 | 12.5 | 16 | 20 | 25 | 31.5 | 40 | 50 | 63 | 80 | 100 | |
| 10 m/s2 | ε (%) | −1.14 | 1.28 | 0.63 | 0.00 | 0.81 | −0.70 | −1.15 | −1.56 | −1.31 | −2.81 | −4.83 | −9.32 | −20.64 |
| Urel | ±3.0 | ±3.0 | ±3.0 | ±3.0 | ±3.0 | ±3.0 | ±3.0 | ±3.0 | ±3.0 | ±3.0 | ±3.0 | ±3.0 | ±3.1 | |
| 5 m/s2 | ε (%) | 1.10 | −0.37 | −0.20 | −0.29 | −0.30 | −0.65 | −1.28 | −1.65 | −1.12 | −2.45 | −4.54 | −9.13 | −20.68 |
| Urel | ±3.0 | ±3.0 | ±3.0 | ±3.0 | ±3.0 | ±3.0 | ±3.0 | ±3.0 | ±3.0 | ±3.0 | ±3.0 | ±3.0 | ±3.2 | |
| 1 m/s2 | ε (%) | 1.41 | 0.49 | 0.25 | 0.35 | −0.45 | −0.63 | −1.54 | −2.51 | −1.61 | −3.03 | −4.84 | −9.44 | −20.82 |
| Urel | ±3.1 | ±3.1 | ±3.1 | ±3.1 | ±3.1 | ±3.1 | ±3.1 | ±3.1 | ±3.1 | ±3.1 | ±3.1 | ±3.1 | ±3.8 | |
| Frequency (Hz) | |||||||||||||
|---|---|---|---|---|---|---|---|---|---|---|---|---|---|
| Amplitude | 6.3 | 8 | 10 | 12.5 | 16 | 20 | 25 | 31.5 | 40 | 50 | 63 | 80 | |
| 10 m/s2 | ε (%) | −0.74 | 1.21 | 0.73 | 0.02 | 0.50 | 0.24 | −0.21 | −0.14 | 1.35 | 1.56 | 3.89 | 8.41 |
| Urel | ±3.1 | ±3.0 | ±3.0 | ±3.0 | ±3.0 | ±3.0 | ±3.0 | ±3.0 | ±3.0 | ±3.0 | ±3.0 | ±3.1 | |
| 5 m/s2 | ε (%) | 0.89 | 0.23 | 0.31 | −0.49 | 0.15 | −0.10 | −0.59 | −0.26 | 1.20 | 1.29 | 3.63 | 7.71 |
| Urel | ±3.1 | ±3.0 | ±3.0 | ±3.0 | ±3.0 | ±3.0 | ±3.0 | ±3.0 | ±3.0 | ±3.0 | ±3.0 | ±3.0 | |
| 1 m/s2 | ε (%) | 2.18 | −0.74 | −0.57 | −0.08 | 0.17 | 0.06 | −0.85 | −0.38 | 1.50 | 0.94 | 3.51 | 7.06 |
| Urel | ±3.1 | ±3.1 | ±3.1 | ±3.1 | ±3.1 | ±3.1 | ±3.1 | ±3.1 | ±3.1 | ±3.1 | ±3.1 | ±3.1 | |
| Frequency (Hz) | ||||||||
|---|---|---|---|---|---|---|---|---|
| Amplitude | 6.3 | 8 | 10 | 12.5 | 16 | 20 | 25 | |
| 10 m/s2 | ε (%) | −0.88 | 0.71 | −0.17 | 0.03 | −0.12 | −0.29 | 11.90 |
| Urel | ±3.1 | ±3.1 | ±3.1 | ±3.2 | ±3.3 | ±3.4 | ±3.6 | |
| 5 m/s2 | ε (%) | 0.74 | −0.11 | 0.06 | 0.05 | −0.04 | −1.13 | 11.68 |
| Urel | ±3.2 | ±3.1 | ±3.1 | ±3.2 | ±3.3 | ±3.4 | ±3.6 | |
| 1 m/s2 | ε (%) | −0.42 | −1.50 | −1.53 | −1.84 | −1.43 | −1.41 | 7.41 |
| Urel | ±3.1 | ±3.1 | ±3.2 | ±3.2 | ±3.3 | ±3.4 | ±3.7 | |
© 2018 by the authors. Licensee MDPI, Basel, Switzerland. This article is an open access article distributed under the terms and conditions of the Creative Commons Attribution (CC BY) license (http://creativecommons.org/licenses/by/4.0/).
Share and Cite
Sigcha, L.; Pavón, I.; Arezes, P.; Costa, N.; De Arcas, G.; López, J.M. Occupational Risk Prevention through Smartwatches: Precision and Uncertainty Effects of the Built-In Accelerometer. Sensors 2018, 18, 3805. https://doi.org/10.3390/s18113805
Sigcha L, Pavón I, Arezes P, Costa N, De Arcas G, López JM. Occupational Risk Prevention through Smartwatches: Precision and Uncertainty Effects of the Built-In Accelerometer. Sensors. 2018; 18(11):3805. https://doi.org/10.3390/s18113805
Chicago/Turabian StyleSigcha, Luis, Ignacio Pavón, Pedro Arezes, Nélson Costa, Guillermo De Arcas, and Juan Manuel López. 2018. "Occupational Risk Prevention through Smartwatches: Precision and Uncertainty Effects of the Built-In Accelerometer" Sensors 18, no. 11: 3805. https://doi.org/10.3390/s18113805