Abstract
In this study, we demonstrated a highly sensitive detection method of 4-methylimidazole (4-MeI), a carcinogenic material, by using a terahertz (THz) metamaterial at a THz region. The THz metamaterials were fabricated with a metal array, using an electric-field-coupled inductor-capacitor (ELC) resonator structure, and a finite-difference time-domain (FDTD) simulation showed good agreement with the experimental results. We measured the THz spectra of the metamaterials to detect the 4-MeI concentrations of 0, 1, 2, 5, 10, 15, and 20 mg/L. The resonance frequency of the metamaterial was shifted by, approximately, 8 GHz and transmittance at the resonance frequency increased to 2 × 10⁻³, as the concentration was increased, up to 20 mg/L. Our study provides new insight into the application of metamaterials in detecting carcinogens, using a THz technique.
1. Introduction
Several soft drinks, including sodas, energy drinks, and diet drinks, contain a caramel color which is widely used as a coloring and flavoring agent [1,2]. Caramel-colored drinks, including colas, root beer, and black tea, are widely consumed across the world in large amounts. However, caramel color agents have attracted significant attention because it was found that caramel-colored drinks may contain 4-methylimidazole (4-MeI), which is known to be carcinogenic [1,3,4,5]. Caramel colors are usually classified into four types, Caramel I, II, III, and IV, and their production and choice of reagents are based on their applications [2,3]. The compound 4-MeI is formed during the production of caramel colors type III and IV, which contain ammonium compounds. Detecting 4-MeI in food products has been an ongoing challenge, with several studies directed at developing efficient methods. For example, high performance liquid chromatography (HPLC) [6], HPLC-mass spectroscopy [3,7], gas chromatography (GC) [8], and GC-mass spectroscopy [9,10], have been used to detect 4-MeI, in addition to 2-dimensional liquid chromatography [11,12]. Spectral properties of various imidazole compounds and characteristics of imidazole isomers can be investigated using nuclear magnetic resonance and mass spectroscopy [13,14]. However, new detection techniques using label-free technologies, with high sensitivity and ease of use, have been in high demand, especially, in cases of chemical or biological material testing.
Following recent reports that terahertz (THz) waves can be generated using a femtosecond laser, application of the THz frequency range has gained significant attention in various research areas, including biochemistry [15,16,17,18], electronics [19], photonics [20,21], astronomy [22], military science [23], food science [24,25], and medical diagnosis [26,27]. In particular, THz techniques such as THz time-domain spectroscopy, have emerged as attractive techniques that can enable label-free, non-contact, and non-destructive detection in biological and chemical materials [18,28,29]. The THz range can reveal several types of information in biological and chemical materials; for example, various conformational energies, such as rotation, vibration, and intermolecular interactions of chemical and biological molecules occur in the THz range [18,24,30]. Recent efforts to improve sensitivity of biochemical detection have involved the use of various artificial structures that are fabricated using metamaterials. Metamaterials have several significant advantages, including easy preparation, easy handling, high sensitivity, and material-selective procedures. Usually, artificial structures created using conductive materials, such as metals, are used for patterning metamaterials, and this provides an opportunity to control electromagnetic properties and functionalities of the materials. In addition, metamaterials have been designed to function in various frequency ranges, using their unique properties, including negative refractive index, and high absorbance at specific frequencies. In particular, THz metamaterials have been widely studied because they can be used to design artificial structures to enhance the detection of several chemical and biological materials in the THz range. THz metamaterials can be used to markedly enhance biochemical molecular energies in the THz region, and they have been investigated in various biological and chemical studies [31,32,33,34,35,36,37,38,39].
In the present study, we demonstrated the detection of 4-MeI, a possible carcinogenic component in caramel-colored drinks, using THz metamaterials. We measured the THz spectrum of 4-MeI, in the frequency range of 0.2 to 2 THz, using the THz transmission mode spectroscopy. Using a THz metamaterial at the resonance frequency of 4-MeI, we investigated its frequency shift enhancement for 4-MeI detection.
2. Materials and Experiment
2.1. Metamaterial Fabrication
The THz metamaterial was fabricated using an electric-field-coupled inductor-capacitor (ELC) resonator structure [40,41]. The metamaterial was based on a metallic array consisting of a square ring with a micro split gap structure. A polyimide (PI) solution was spin-coated onto the Si wafer, at a thickness of 500 μm, at 2500 rpm. The Si wafer with a coated PI solution was baked at 110 °C, for 3 min. To deposit an Au pattern on the PI/Si wafer, we adopted a lift-off process. The PI/Si wafer substrate was photoresist-coated at 3000 rpm for 40 s and soft baked at 95 °C for 90 s. Next, the substrate was exposed to UV for three seconds. Hard baking was performed at 110 °C, for 3 min, followed again by UV exposure for 30 s. Finally, the photoresist was developed. We deposited a Ti 30 nm/Au 100 nm layer on the PI/Si wafer. The schematic of the metamaterial is shown in Figure 1a. We simulated the metamaterial design using a finite-difference time-domain (FDTD) method, in the terahertz range.
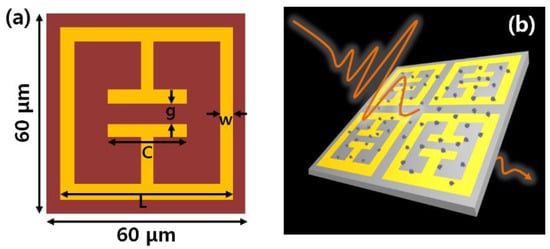
Figure 1.
Schematic of (a) the terahertz (THz) metamaterial and (b) THz measurement, using the metamaterial.
As can be seen in Figure 1b, a THz electric field passing through the metamaterial was scattered by the 4-MeI molecules in a vertical direction. The THz output signal throughout the metamaterial, was analyzed using a Fourier transformation-based method. A commercial THz time-domain spectroscopy system (TPS-3000, Teraview, Cambridge, UK) was used to obtain the THz spectra of the pellet sample and the metamaterial, in the frequency range of 0.2 to 2 THz. All of the experimental THz-TDS measurements were performed at room temperature and the humidity in the THz-TDS system was maintained at lower than 1%, using dried air, during the THz spectra measurement of the samples.
The output THz signal O(ω), passing through a sample, is related to the input signal I(ω) as follows [18]
where I(ω) is the complex input signal, α(ω) is the absorption coefficient, d is the thickness of the sample, λ is the wavelength, and n is the refractive index of the sample. Power absorption can be obtained from the difference between spectral amplitudes with and without the sample.
2.2. 4-MeI Sample Preparation
A commercially available 4-MeI product was obtained (Sigma-Aldrich, St. Louis, MO, USA). We crushed the dry 4-MeI into small particles of sizes less than the THz wavelength, to prevent scattering. To measure the THz spectrum, the 4-MeI (30 mg) was prepared as a pellet sample compounded with a polyethylene (PE) powder (270 mg). In addition, we prepared 4-MeI solutions to apply onto the THz metamaterial, at concentrations of 0, 1, 2, 5, 10, 15, and 20 mg/L of 4-MeI, in distilled water. Ten microliter of the 4-MeI solutions, at each concentration, were dropped onto the THz metamaterial and dried at 70 °C, for 10 min, until the water evaporated completely. Next, the THz metamaterial was cooled, at room temperature, for 30 min to maintain identical conditions for each measurement. A schematic of the process is shown in Figure 2.
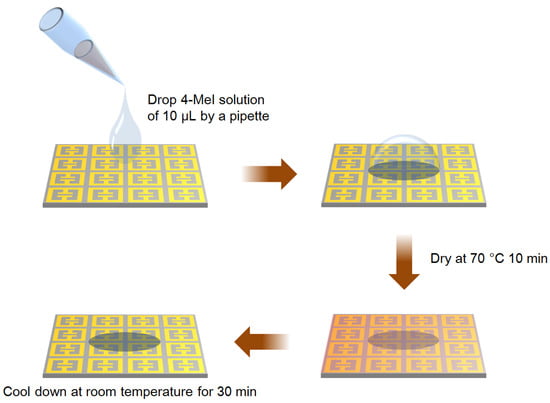
Figure 2.
Schematic of the drop coating deposition of the 4-methylimidazole (4-MeI) sample on the THz metamaterial.
3. Results and Discussion
3.1. THz Spectrum of a 4-MeI Pellet
We first described the THz spectral characteristics of the 4-MeI, using THz-TDS. We measured the THz spectra of a pellet composed of PE and 4-MeI, and the spectra are shown in Figure 3. As can be seen in the figure, the PE pellet showed a low absorption and had no resonance peak at the measured THz region. From the THz spectrum of the PE pellet, we obtained the THz spectrum of 4-MeI, by extracting the absorbance of the PE. The spectrum of the pellet composed of PE and the 4-MeI showed two significant 4-MeI resonance peaks at 0.56 and 0.82 THz. In particular, the spectrum of 4-MeI showed a more intense absorption peak at 0.82 THz than at 0.56 THz.
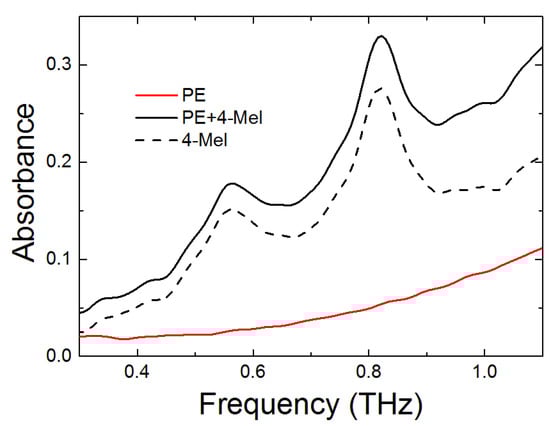
Figure 3.
The spectra of polyethylene and 4-methylimidazole pellets at the THz region of 0.2 to 1.1 THz.
3.2. 4-MeI Detection in the THz Metamaterial
To fabricate frequency-selective metamaterials for 4-MeI, as shown in Figure 1, the metamaterial was designed to encompass a resonance frequency of 0.82 THz, which was the resonance frequency of the 4-MeI. The resonant peak position of the transmittance was determined, based on the capacitor length and the gap of the metamaterial [31]. The capacitor length (C) and the gap (g) were designed to be 20 μm and 8 μm. The full length (L) of the metamaterial was 54 μm, as shown in Figure 1a. The simulation and experimental results are shown in Figure 4a. In the FDTD simulation, gold is considered to be a perfect electric conductor (PEC) and the relative permittivity of the PI layer was 2.88-0.09i. The normalized THz spectrum of the metamaterial illustrated a resonant feature at 0.82 THz. As can be seen in Figure 4a, the experimental spectrum of the THz metamaterial was in good agreement with the FDTD simulation. In addition, at the resonance frequency, we found that the localized THz electric field was strongly enhanced at the gap of the antenna, in the simulation, as shown in the inset, in Figure 4a. Figure 4b shows a scanning optical microscope image of the fabricated THz metamaterial. When the 4-MeI sample was dropped onto the THz metamaterial, the 4-MeI molecules significantly interacted with the localized strong THz field and the features of the metamaterial changed as the 4-MeI concentration increased. Consequently, the resonant peak position and the transmittance were changed.
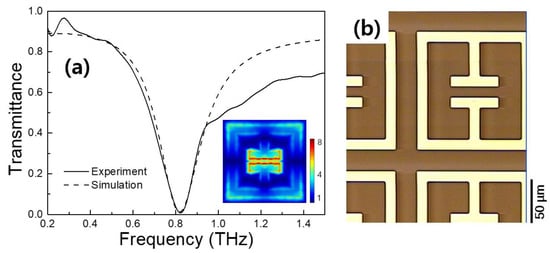
Figure 4.
(a) Transmittance curves obtained in the experiment and the simulation, using the THz metamaterial. (b) Optical microscope image of the THz metamaterial.
Figure 5 illustrates the full THz spectra of the metamaterial, at different 4-MeI concentrations of 0, 1, 2, 5, 10, 15, and 20 mg/L. The inset in Figure 5 shows a zoomed-in image of the resonant region. As seen in the figure, the resonant peak of the THz metamaterial shifted to a lower frequency as the 4-MeI concentration increased. In addition, the transmittance also increased slightly. The 4-MeI concentration-dependence of the resonance frequency and the transmittance of the THz metamaterial is shown in Figure 6. In Figure 6a, the resonance frequency was shifted to a lower frequency as the concentration of the 4-MeI increased. In addition, the transmittance increased as the concentration of the 4-MeI increased. The behavior of the resonance frequency and the transmittance could be explained by fitting to a linear equation. The resonance frequency shift-fitted to the linear equation Y = −0.31X + 820.56 and the transmittance change-fitted to Y = 8.1 × 10⁻³X + 7.8 × 10³, with increasing 4-MeI concentrations. As a result, the resonance frequency was shifted, by approximately 8 GHz, and the transmittance at the resonance frequency increased to 2 × 10⁻³ as the concentration increased to 20 mg/L. These results indicated that a few mg/L of the 4-MeI present in food materials, such as a beverage, can be detected using this metamaterial. However, the sensitivity of the metamaterial needs to be improved by using a higher sharp resonant peak or enhancing the interactions between the over-layered materials and an electric field near the metal structure, which would enable detection of 4-MeI of less than a few hundred mg/L.
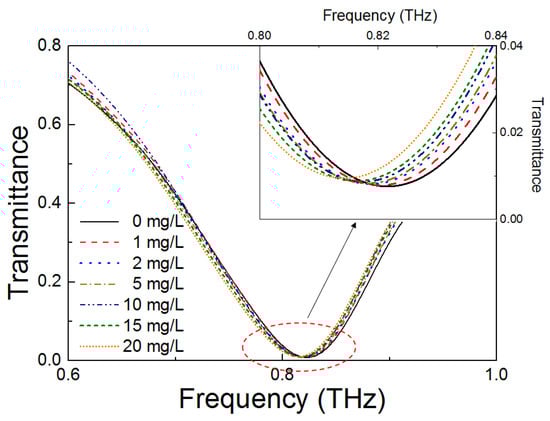
Figure 5.
Spectra of the 4-MeI detection, using the THz metamaterial, at concentrations of 0, 1, 2, 5, 10, 15, and 20 mg/L in the THz region of 0.6 to 1.0 THz.
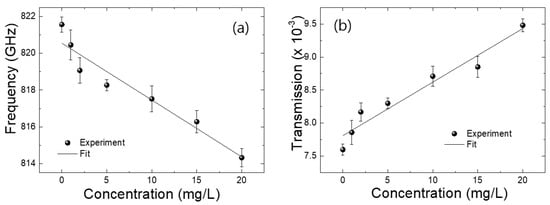
Figure 6.
(a) The resonance frequency and (b) transmittance of the THz metamaterial as the concentration of 4-MeI increases. Solid lines indicate linear fits of the experimental results. All experimental results have been obtained through four different times of measurement.
The present study provided experimental evidence supporting the fact that the application of metamaterials, combined with the THz technology, has a substantial potential in the detection of hazardous materials in food products. Further studies may involve fabrication of the THz metamaterials with sharp resonant peaks and a high sensitivity, with a nano-slit structure, to improve the sensitivity of the metamaterials in detecting 4-MeI, as well as other carcinogenic substances.
4. Conclusions
In conclusion, we reported a THz metamaterial-based detection of the carcinogenic substance 4-MeI, which may be present in caramel-colored food products. We measured the THz spectra of pellets containing 4-MeI and PE and observed the resonance peaks at 0.56 and 0.82 THz. We fabricated a THz metamaterial, with a resonance feature at 0.82 THz, and measured the THz spectra at 4-MeI concentrations ranging from 0 to 20 mg/L. We found that the resonance frequency decreased and the transmittance increased as the 4-MeI concentration increased. We were able to clearly detect 4-MeI, using the THz metamaterial, and the results demonstrated a highly sensitive detection. Thus, our findings provide new insight into 4-MeI detection and the potential applications of metamaterials-based technology, in food safety inspection.
Author Contributions
G.O. and H.J.S. conceived and designed the concept of the experiments. H.J.S. wrote the manuscript and analyzed the experimental results. 4-methylimidazole samples were prepared by H.W.J.. THz time-domain spectroscopy characteristics of 4-methylimidazole and metamaterials were carried out by H.J.S. All the authors participated in discussion and the results.
Funding
This work was supported financially by Main Research Program of the Korea Food Research Institute funded by the Ministry of Science, ICT & Future Planning (E0187301-01).
Conflicts of Interest
The authors declare no conflict of interest.
References
- Lee, K.G.; Jang, H.; Shibamoto, T. Formation of carcinogenic 4 (5)-methylimidazole in caramel model systems: A role of sulphite. Food Chem. 2013, 136, 1165–1168. [Google Scholar] [CrossRef] [PubMed]
- Chappel, C.I.; Howell, J.C. Caramel colours—A historical introduction. Food Chem. Toxicol. 1992, 30, 351–357. [Google Scholar] [CrossRef]
- Yamaguchi, H.; Masuda, T. Determination of 4-MI in soy sauce and other foods by LC-MS after solid-phase extraction. J. Agric. Food Chem. 2011, 59, 9770–9775. [Google Scholar] [CrossRef] [PubMed]
- Hengel, M.; Shibamoto, T. Carcinogenic 4 (5)-methylimidazole found in beverages, sauces, and caramel colors: Chemical properties, analysis, and biological activities. J. Agric. Food Chem. 2013, 61, 780–789. [Google Scholar] [CrossRef]
- Moon, J.K.; Shibamoto, T. Formation of carcinogenic 4 (5)-methylimidazole in Maillard reaction systems. J. Agric. Food Chem. 2010, 59, 615–618. [Google Scholar] [CrossRef] [PubMed]
- Lawrence, J.F.; Charbonneau, C.F. Direct method for the determination of 2-acetyl-4 (5)-tetrahydroxy-butylimidazole in caramel colours and beers by high-performance liquid chromatography. J. Chromatogr. A 1987, 407, 405–407. [Google Scholar] [CrossRef]
- Klejdus, B.; Moravcová, J.; Kubáň, V. Reversed-phase high-performance liquid chromatographic/mass spectrometric method for separation of 4-methylimidazole and 2-acetyl-4-(1,2,3,4-tetrahydroxybutyl) imidazole at pg levels. Anal. Chim. Acta 2003, 477, 49–58. [Google Scholar] [CrossRef]
- Cerny, M.; Blumenthal, A. 4-Methylimidazol in Caramel und caramelgefärbten Lebensmitteln. Z. Lebensm. Unters. Forsch. A 1979, 168, 87–90. [Google Scholar] [CrossRef]
- Fuchs, G.; Sundell, S. Quantitative determination of 4-methylimidazole as 1-acetyl derivative in caramel color by gas-liquid chromatography. J. Agric. Food Chem. 1975, 23, 120–122. [Google Scholar] [CrossRef]
- Pons, I.; Garrault, C.; Jaubert, J.N.; Morel, J.; Fenyo, J.C. Analysis of aromatic caramel. Food Chem. 1991, 39, 311–320. [Google Scholar] [CrossRef]
- Liu, J.; Sun, J.; Sui, X.; Wang, Y.; Hou, Y.; He, Z. Predicting blood–brain barrier penetration of drugs by microemulsion liquid chromatography with corrected retention factor. J. Chromatogr. A 2008, 1198, 164–172. [Google Scholar] [CrossRef] [PubMed]
- Moretton, C.; Crétier, G.; Nigay, H.; Rocca, J.L. Quantification of 4-methylimidazole in class III and IV caramel colors: Validation of a new method based on heart-cutting two-dimensional liquid chromatography (LC-LC). J. Agric. Food Chem. 2011, 59, 3544–3550. [Google Scholar] [CrossRef] [PubMed]
- Matthews, H.R.; Rapoport, H. Differentiation of 1, 4-and 1, 5-disubstituted imidazoles. J. Am. Chem. Soc. 1973, 95, 2297–2303. [Google Scholar] [CrossRef]
- Bowie, J.H.; Cooks, R.G.; Lawesson, S.; Schroll, G. Electron impact studies. XII. Mass spectra of substituted imidazoles. Aust. J. Chem. 1967, 20, 1613–1624. [Google Scholar] [CrossRef]
- Smye, S.W.; Chamberlain, J.M.; Fitzgerald, A.J.; Berry, E. The interaction between terahertz radiation and biological tissue. Phys. Med. Biol. 2001, 46, R101. [Google Scholar] [CrossRef] [PubMed]
- Upadhya, P.C.; Shen, Y.C.; Davies, A.G.; Linfield, E.H. Terahertz time-domain spectroscopy of glucose and uric acid. J. Biol. Phys. 2003, 29, 117–121. [Google Scholar] [CrossRef] [PubMed]
- Ajito, K.; Ueno, Y. THz chemical imaging for biological applications. IEEE Trans. Terahertz Sci. Technol. 2011, 1, 293–300. [Google Scholar] [CrossRef]
- Shin, H.J.; Oh, S.J.; Kim, S.I.; Won Kim, H.; Son, J.H. Conformational characteristics of β-glucan in laminarin probed by terahertz spectroscopy. Appl. Phys. Lett. 2009, 94, 111911. [Google Scholar] [CrossRef]
- Otsuji, T.; Popov, V.; Ryzhii, V. Active graphene plasmonics for terahertz device applications. J. Phys. D Appl. Phys. 2014, 47, 094006. [Google Scholar] [CrossRef]
- Shin, H.J.; Kim, J.; Kim, S.; Choi, H.; Lee, S.; Lee, Y.H.; Son, J.H.; Lim, S.C. Unsaturated drift velocity of monolayer graphene. Nano Lett. 2018, 18, 1575–1581. [Google Scholar] [CrossRef]
- Shin, H.J.; Kim, S.H.; Park, K.; Lim, M.C.; Choi, S.W.; Ok, G. Free-standing guided-mode resonance humidity sensor in terahertz. Sens. Actuators A Phys. 2017, 268, 27–31. [Google Scholar] [CrossRef]
- Mayorga, I.C.; Schmitz, A.; Klein, T.; Leinz, C.; Gusten, R. First in-field application of a full photonic local oscillator to terahertz astronomy. IEEE Trans. Terahertz Sci. Technol. 2012, 2, 393–399. [Google Scholar] [CrossRef]
- Ergün, S.; Sönmez, S. Terahertz technology for military applications. J. Manag. Inf. Sci. 2015, 3, 13–16. [Google Scholar] [CrossRef]
- Shin, H.J.; Choi, S.W.; Ok, G. Qualitative identification of food materials by complex refractive index mapping in the terahertz range. Food Chem. 2018, 245, 282–288. [Google Scholar] [CrossRef] [PubMed]
- Ok, G.; Park, K.; Lim, M.C.; Jang, H.J.; Choi, S.W. 140-GHz subwavelength transmission imaging for foreign body inspection in food products. J. Food Eng. 2018, 221, 124–131. [Google Scholar] [CrossRef]
- Ji, Y.B.; Moon, I.S.; Bark, H.S.; Kim, S.H.; Park, D.W.; Noh, S.K.; Jeon, T.I. Terahertz otoscope and potential for diagnosing otitis media. Biomed. Opt. Express 2016, 7, 1201. [Google Scholar] [CrossRef] [PubMed]
- Oh, S.J.; Kim, S.H.; Ji, Y.B.; Jeong, K.; Park, Y.; Yang, J.; Park, D.W.; Noh, S.K.; Kang, S.G.; Huh, Y.M.; et al. Study of freshly excised brain tissues using terahertz imaging. Biomed. Opt. Express 2014, 5, 2837–2842. [Google Scholar] [CrossRef]
- Zhong, H.; Redo-Sanchez, A.; Zhang, X.C. Identification and classification of chemicals using terahertz reflective spectroscopic focal-plane imaging system. Opt. Express 2006, 14, 9130–9141. [Google Scholar] [CrossRef]
- Walther, M.; Fischer, B.M.; Ortner, A.; Bitzer, A.; Thoman, A.; Helm, H. Chemical sensing and imaging with pulsed terahertz radiation. Anal. Bioanal. Chem. 2010, 397, 1009–1017. [Google Scholar] [CrossRef]
- Rungsawang, R.; Ueno, Y.; Tomita, I.; Ajito, K. Terahertz notch filter using intermolecular hydrogen bonds in a sucrose crystal. Opt. Express 2006, 14, 5765–5772. [Google Scholar] [CrossRef]
- Park, S.J.; Hong, J.T.; Choi, S.J.; Kim, H.S.; Park, W.K.; Han, S.T.; Park, J.Y.; Lee, S.; Kim, D.S.; Ahn, Y.H. Detection of microorganisms using terahertz metamaterials. Sci. Rep. 2014, 4, 1–7. [Google Scholar] [CrossRef] [PubMed]
- Reinhard, B.; Schmitt, K.M.; Wollrab, V.; Neu, J.; Beigang, R.; Rahm, M. Metamaterial near-field sensor for deep-subwavelength thickness measurements and sensitive refractometry in the terahertz frequency range. Appl. Phys. Lett. 2012, 100, 221101. [Google Scholar] [CrossRef]
- Tao, H.; Strikwerda, A.C.; Liu, M.; Mondia, J.P.; Ekmekci, E.; Fan, K.; Kaplan, D.L.; Padilla, W.J.; Zhang, X.; Averitt, R.D.; et al. Performance enhancement of terahertz metamaterials on ultrathin substrates for sensing applications. Appl. Phys. Lett. 2010, 97, 261909. [Google Scholar] [CrossRef]
- Xu, W.; Xie, L.; Zhu, J.; Wang, W.; Ye, Z.; Ma, Y.; Tsai, C.Y.; Chen, S.; Ying, Y. Terahertz sensing of chlorpyrifos-methyl using metamaterials. Food Chem. 2017, 218, 330–334. [Google Scholar] [CrossRef] [PubMed]
- Qin, J.; Xie, L.; Ying, Y. A high-sensitivity terahertz spectroscopy technology for tetracycline hydrochloride detection using metamaterials. Food Chem. 2016, 211, 300–305. [Google Scholar] [CrossRef] [PubMed]
- O’Hara, J.F.; Singh, R.; Brener, I.; Smirnova, E.; Han, J.; Taylor, A.J.; Zhang, W. Thin-film sensing with planar terahertz metamaterials: sensitivity and limitations. Opt. Express 2008, 16, 1786–1795. [Google Scholar] [CrossRef] [PubMed]
- Singh, R.; Cao, W.; Al-Naib, I.; Cong, L.; Withayachumnankul, W.; Zhang, W. Ultrasensitive terahertz sensing with high-Q Fano resonances in metasurfaces. Appl. Phys. Lett. 2014, 105, 171101. [Google Scholar] [CrossRef]
- Shih, K.; Pitchappa, P.; Manjappa, M.; Ho, C.P.; Singh, R.; Lee, C. Microfluidic metamaterial sensor: Selective trapping and remote sensing of microparticles. J. Appl. Phys. 2017, 121, 023102. [Google Scholar] [CrossRef]
- Serita, K.; Matsuda, E.; Okada, K.; Murakami, H.; Kawayama, I.; Tonouchi, M. Terahertz microfluidic chips sensitivity-enhanced with a few arrays of meta-atoms. APL Photonics 2018, 3, 051603. [Google Scholar] [CrossRef]
- Schurig, D.; Mock, J.J.; Smith, D.R. Electric-field-coupled resonators for negative permittivity metamaterials. Appl. Phys. Lett. 2016, 88, 041109. [Google Scholar] [CrossRef]
- Zhang, C.H.; Wu, J.B.; Jin, B.B.; Ji, Z.M.; Kang, L.; Xu, W.W.; Chen, J.; Tonouchi, M.; Wu, P.H. Low-loss terahertz metamaterial from superconducting niobium nitride films. Opt. Express 2012, 20, 42–47. [Google Scholar] [CrossRef] [PubMed]
© 2018 by the authors. Licensee MDPI, Basel, Switzerland. This article is an open access article distributed under the terms and conditions of the Creative Commons Attribution (CC BY) license (http://creativecommons.org/licenses/by/4.0/).