Article

Research on the Effects of Drying Temperature on Nitrogen Detection of Different Soil Types by Near Infrared Sensors

1
College of Biosystems Engineering and Food Science, Zhejiang University, Hangzhou 310058, China
2
Key Laboratory of Sensors Sensing, Ministry of Agriculture, Zhejiang University, Hangzhou 310058, China
3
State Key Laboratory of Modern Optical Instrumentation, Zhejiang University, Hangzhou 310058, China
*
Author to whom correspondence should be addressed.
Sensors 2018, 18(2), 391; https://doi.org/10.3390/s18020391
Submission received: 7 December 2017 / Revised: 5 January 2018 / Accepted: 22 January 2018 / Published: 29 January 2018
(This article belongs to the Special Issue Sensors in Agriculture)

Abstract

:
Soil is a complicated system whose components and mechanisms are complex and difficult to be fully excavated and comprehended. Nitrogen is the key parameter supporting plant growth and development, and is the material basis of plant growth as well. An accurate grasp of soil nitrogen information is the premise of scientific fertilization in precision agriculture, where near infrared sensors are widely used for rapid detection of nutrients in soil. However, soil texture, soil moisture content and drying temperature all affect soil nitrogen detection using near infrared sensors. In order to investigate the effects of drying temperature on the nitrogen detection in black soil, loess and calcium soil, three kinds of soils were detected by near infrared sensors after 25 °C placement (ambient temperature), 50 °C drying (medium temperature), 80 °C drying (medium-high temperature) and 95 °C drying (high temperature). The successive projections algorithm based on multiple linear regression (SPA-MLR), partial least squares (PLS) and competitive adaptive reweighted squares (CARS) were used to model and analyze the spectral information of different soil types. The predictive abilities were assessed using the prediction correlation coefficients (RP), the root mean squared error of prediction (RMSEP), and the residual predictive deviation (RPD). The results showed that the loess (RP = 0.9721, RMSEP = 0.067 g/kg, RPD = 4.34) and calcium soil (RP = 0.9588, RMSEP = 0.094 g/kg, RPD = 3.89) obtained the best prediction accuracy after 95 °C drying. The detection results of black soil (RP = 0.9486, RMSEP = 0.22 g/kg, RPD = 2.82) after 80 °C drying were the optimum. In conclusion, drying temperature does have an obvious influence on the detection of soil nitrogen by near infrared sensors, and the suitable drying temperature for different soil types was of great significance in enhancing the detection accuracy.

1. Introduction

Soil, which provides nutrients in the process of plant growth, is the foundation and plays an important role in agriculture. Thus, it is of great importance to obtain soil nutrient elements such as soil nitrogen quickly and accurately for precision fertilization and agricultural production [1,2]. Many conventional soil analytical techniques such as Dumas combustion are often complex, with multi-component interactions [3]. At present, near infrared sensors (NIR) have been successfully applied to the fields of agriculture, food, medicine, petroleum and chemistry, and are one of the most important analytical methods, indispensable in qualitative and quantitative analysis [4,5]. In recent years, many scholars have used near infrared sensors to detect soil nitrogen and improved the detection accuracy in the aspects of soil pretreatments, spectral data processing, characteristic band selection and algorithm optimization.
Dalal predicted soil nitrogen with the multiple linear regression method at the spectral bands of 1702 nm, 1870 nm and 2052 nm [6]. Lee et al. found that the sensitive bands of soil total nitrogen were not only affected by soil type, but also determined by sampling depth [7]. He et al. detected N, P, K, organic matter (OM) and pH content in a loamy mixed soil by NIR. The results showed that the correlation coefficient between measured and predicted values of N, OM and pH were 0.93, 0.93 and 0.91, respectively, but were not suitable for predicting P and K [8,9]. Stoner et al. described the spectral reflectance curves and their relationships with five soil types in detail according to the characteristics of the spectral reflectance of surface soil samples from the United States and Brazil [10]. Ramirez et al. analyzed the soil organic matter, total nitrogen, organic carbon, clay and calcium. The results suggested that the forecast equation spectrum of soil organic matter and total nitrogen performed better [11]. Brunet’s research pointed out that the grinding treatment of soil reduced the prediction accuracy of organic carbon, while grinding had no obvious effects on total nitrogen detection [12]. Barthès et al. studied how the NIR prediction of carbon and nitrogen content were affected by sample grinding, drying and replication. The results showed that the prediction accuracy was the highest with oven-dried, 0.2 mm ground soil samples [13]. Hernandez et al. found that the soil particle size and high water content would affect the accuracy of soil organic nitrogen prediction [14]. Nie’s research indicated that the soil with the strictest pretreatment (dried, ground, sieved and pressed) had the highest accuracy in predicting the soil nitrogen content [15]. Cozzolino et al. found that the prediction correlation coefficients among coarse sand (2–0.25 mm), fine sand (0.25–0.05 mm) and clay sand (<0.05 mm) were 0.90, 0.92 and 0.96 respectively based on NIR [16]. Nocita et al. used visible near infrared sensors to detect soil organic carbon content under different soil moisture gradients. The soil samples were collected and dried, and then 0.005 grams of water was added to each soil sample. It was found that water content could affect the detection accuracy, and the R2 of the optimum model was 0.74 [17,18,19].
However, there is little research about the influence of soil drying temperature on soil nitrogen detection by near infrared sensors. Soil texture, soil moisture content and external temperature all affect soil nitrogen detection [20,21]. Particularly, the temperature has an influence on the water removal and activity of urease [22]. Coarse samples were dried at 20 °C for 48 h for the prediction of C and N content using visible near infrared spectroscopy and the comparative method was used to detect their potential mineralization in heterogeneous soil samples [23]. The flat-dry samples were dried at 35 °C for 12 h to explore the effects of soil sample pretreatments and standardized rewetting [24]. Soil was subjected to oven drying at 60 °C for 24 h, after which they were ground and sieved with a 0.002 m sieve [25] or soil samples were dried at 95 °C for 24 h [26] and then sieved for estimating total nitrogen using NIR. Besides this, soil samples were dried at 80 °C for 8 h to detect soil nitrogen with different pretreatments using NIR on He’s research [27]. Moreover, soil samples were dried naturally, rolled and broken into pieces, then sieved with a 2-mm screen to estimate the organic matter or soil properties using NIR [28,29]. However, the impact of drying temperature on soil nitrogen detection has been studied little and the mechanism was not clear yet.
The objective of this study was to investigate the influence of temperature on soil nitrogen detection of loess, calcium soil and black soil as well as find the suitable drying temperature for different soil types to enhance the nitrogen detection accuracy by near infrared sensors. Besides this, this study compared the differences of the near infrared spectra of different soils and different temperatures, and the prediction models established by SPA-MLR, PLS and CARS were analyzed from the perspective of temperatures, soil properties and algorithms.

2. Materials and Methods

2.1. Experimental Materials and Sample Preparation

The experimental soils included black soil, loess and calcium soil, which were collected from different regions with different physical and chemical properties in China. Among them, black soil comes from the Greater Khingan region, whose pH value is neutral to slightly alkaline. Loess comes from Xi’an, Shanxi province, whose soil properties are loose and porous. Calcium soil with the features of loose and poor structure is from Jinan, Shandong province. The soil sample preparation process was as follows. First, the soil samples were sieved with a 40 mesh sieve (0.425 mm) and grinded; in addition, the urea solutions with different concentrations were prepared. Second, different nitrogen concentration gradients for three kinds of soils were prepared, that were, loess (0.09–0.93 g/kg, 0.1 g/kg per gradient), calcium soil (0.32–1.17 g/kg, 0.1 g/kg per gradient), black soil (0.46–2.15 g/kg, 0.2 g/kg per gradient). Meanwhile, the three kinds of soils without urea added were set as references. There were 16 samples for each concentration, and each soil type contained 11 nitrogen gradients. Third, the experiments were carried out in four groups, each group containing three soil types. Black soil, loess and calcium soil were dried after 50 °C for 24 h (group I), 80 °C for 18 h (group II) and 95 °C for 12 h (group III) respectively. Other soil samples were dried and then placed at 25 °C for 12 days (group IV).

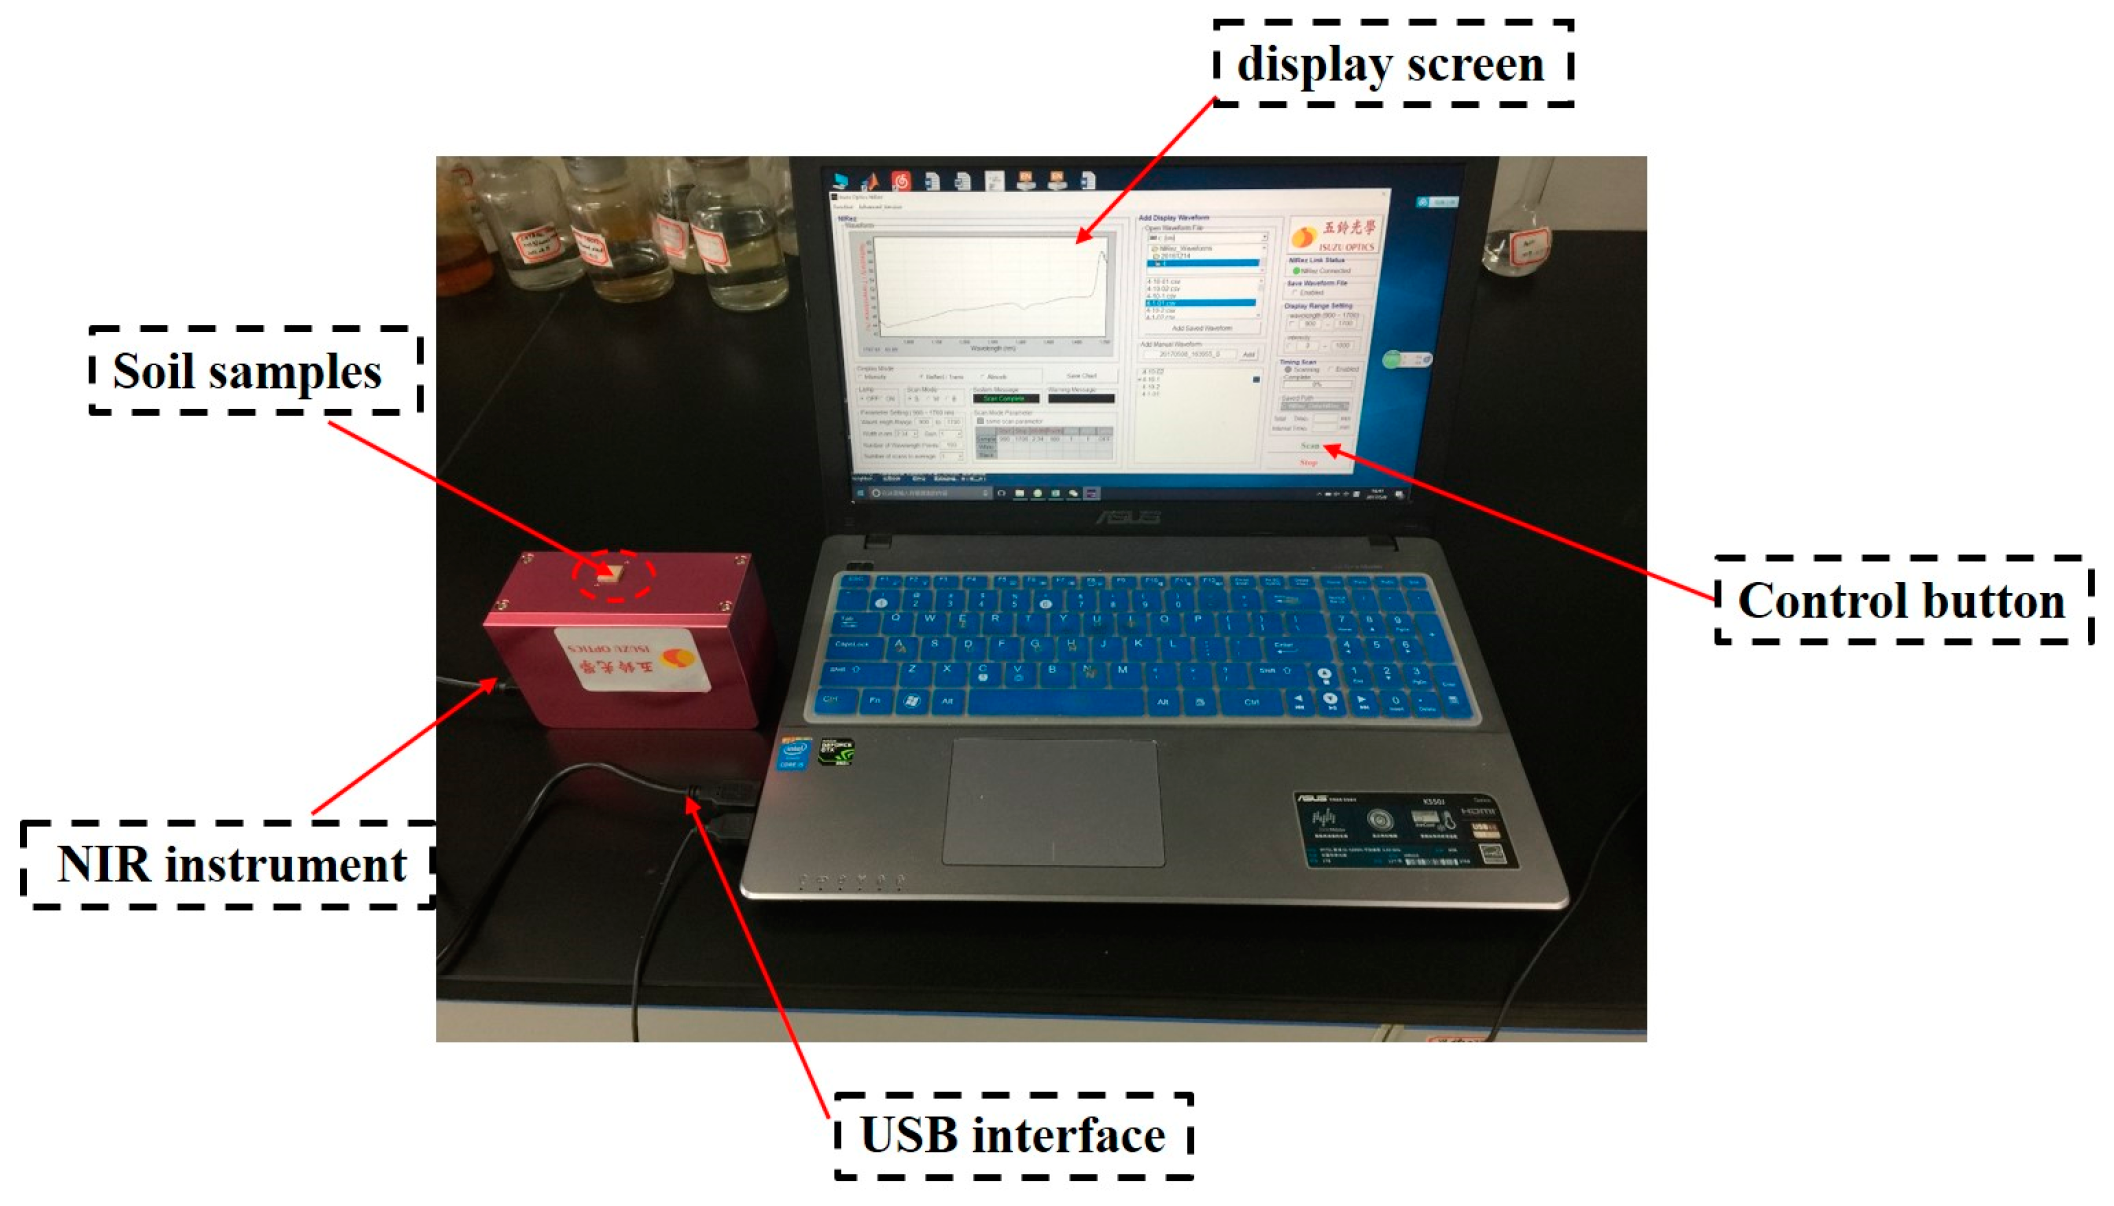
2.2. Spectrometric Determination

The portable near infrared optical instrument is from Isuzu Optics Corp (Shanghai, China). It is an interferometer instrument which is reflective with two integrated tungsten halogen lamps. The instrument collects spectral information in the range of 900–1700 nm, whose optical resolution is 10 nm and the signal-noise ratio is 5000:1 in a 1 s scan; the size is 120 × 85 × 54 mm and the weight is 900 g. The soil detection platform is shown in Figure 1.
When the spectrum of soil were measured, the samples were placed on the light source window, which avoided the phenomenon of light leakage since the size of the soil sample is larger than that of the light source window. Before performing the spectroscopic measurement, the instrument should be preheated for 15 min and be prepared with blackboard and whiteboard correction operation. In order to maintain the integrity of the original soil spectra and the rapidity of the detection process, the spectral acquisition parameter is set up as 400 points, and the spectrum is obtained by averaging three scans.

2.3. Data Analysis

Near infrared light is an electromagnetic wave between the infrared and visible light whose wavelength range is from 780 nm to 2526 nm [30]. The spectral information originates from the vibration of the O–H, C–H and N–H groups, which can reflect the variety of organic matter in the characteristic signal of the spectral region [31]. According to Lambert absorption law [32], the spectral characteristics would change as material composition or structure changes. However, at the same time, it can also be affected by the soil surface texture, density and uneven distribution of internal components, which is very difficult for all the redundant information of the spectral data to be eliminated, such as the overlap. Therefore, in order to achieve the purpose of qualitative or quantitative analysis of complex mixtures, it is necessary to extract and analyze the weak chemical information by chemometrics method in the spectral analysis.
In this paper, the original spectra were preprocessed by Savitzky–Golay (S-G) smoothing. Then three modeling methods were used to model and analyze the spectral information. The SPXY method [33] was used to divide the three soil samples into two groups according to the proportion of 2:1, among which 118 soil samples (N1) were calibrated and 58 soil samples (N2) were validated at different temperatures and different soils. All data analysis was based on MATAB R2014a (The Math-Works, Natick, MA, USA).

2.4. Spectral Preprocessing Method

Savitzky–Golay (S-G) smoothing [34], also known as polynomial smoothing, uses the weighted average method to quantize the data in the moving window by polynomial least squares fitting as well as emphasizing the central role of the center point. The formula of average wavelengths after S-G smoothing is
x k , s m o o t h = x i ¯ = 1 H i = w + w x k + 1 h i
where H is the normalization factor, h i is the smoothing coefficient and H = I = W + W h i . The measured value multiplied by the smoothing coefficient minimizes the smoothing influence on the useful information. In the experiment, the S-G was used to remove the background noise of the instrument and the noise of the spectrum.

2.5. SPXY Method

SPXY, the method of choosing the calibration sample, was put forward on the basis of KS methods by Galvao et al. [35]. The basic principle is that spectrum and concentration variables are considered at the same time to calculate the distance of the samples, the distance formula is as follows:
d x y = d x ( i , j ) m a x i , j ( 1 , z ) [ d x ( i , j ) ] + d y ( i , j ) m a x i , j ( 1 , z ) [ d y ( i , j ) ] , i , j [ 1 , z ]
In the formula, d x ( i , j ) is based on spectral characteristic parameters for the calculation of the distance between the samples, while d y ( i , j ) is based on concentration characteristic parameters for the calculation of the distance between the samples—which makes the sample in spectrum space and concentration space have the same weightiness—divided by their corresponding maximum standardizing, respectively. z is spectral space.

2.6. Modeling Method

2.6.1. Partial Least Squares Method

Partial least squares regression (PLSR) is one of the most widely used methods for quantitative correction in chemometrics. In the PLS model, the principal components of the matrix X and the matrix Y are decomposed in order to extract the most comprehensive variables with respect to the dependent variables and maximize the correlation between the principal component and the concentration, which overcomes the negative effects of the multiple correlation of variables and further improves the reliability of the model [36]. In this paper, the whole band spectral data are used as independent variable X, and the nitrogen content are considered as the dependent variable Y. The minimum cross validation is used to verify the root mean square error cross validation (RMSECV) to determine the optimum number of principal factors.

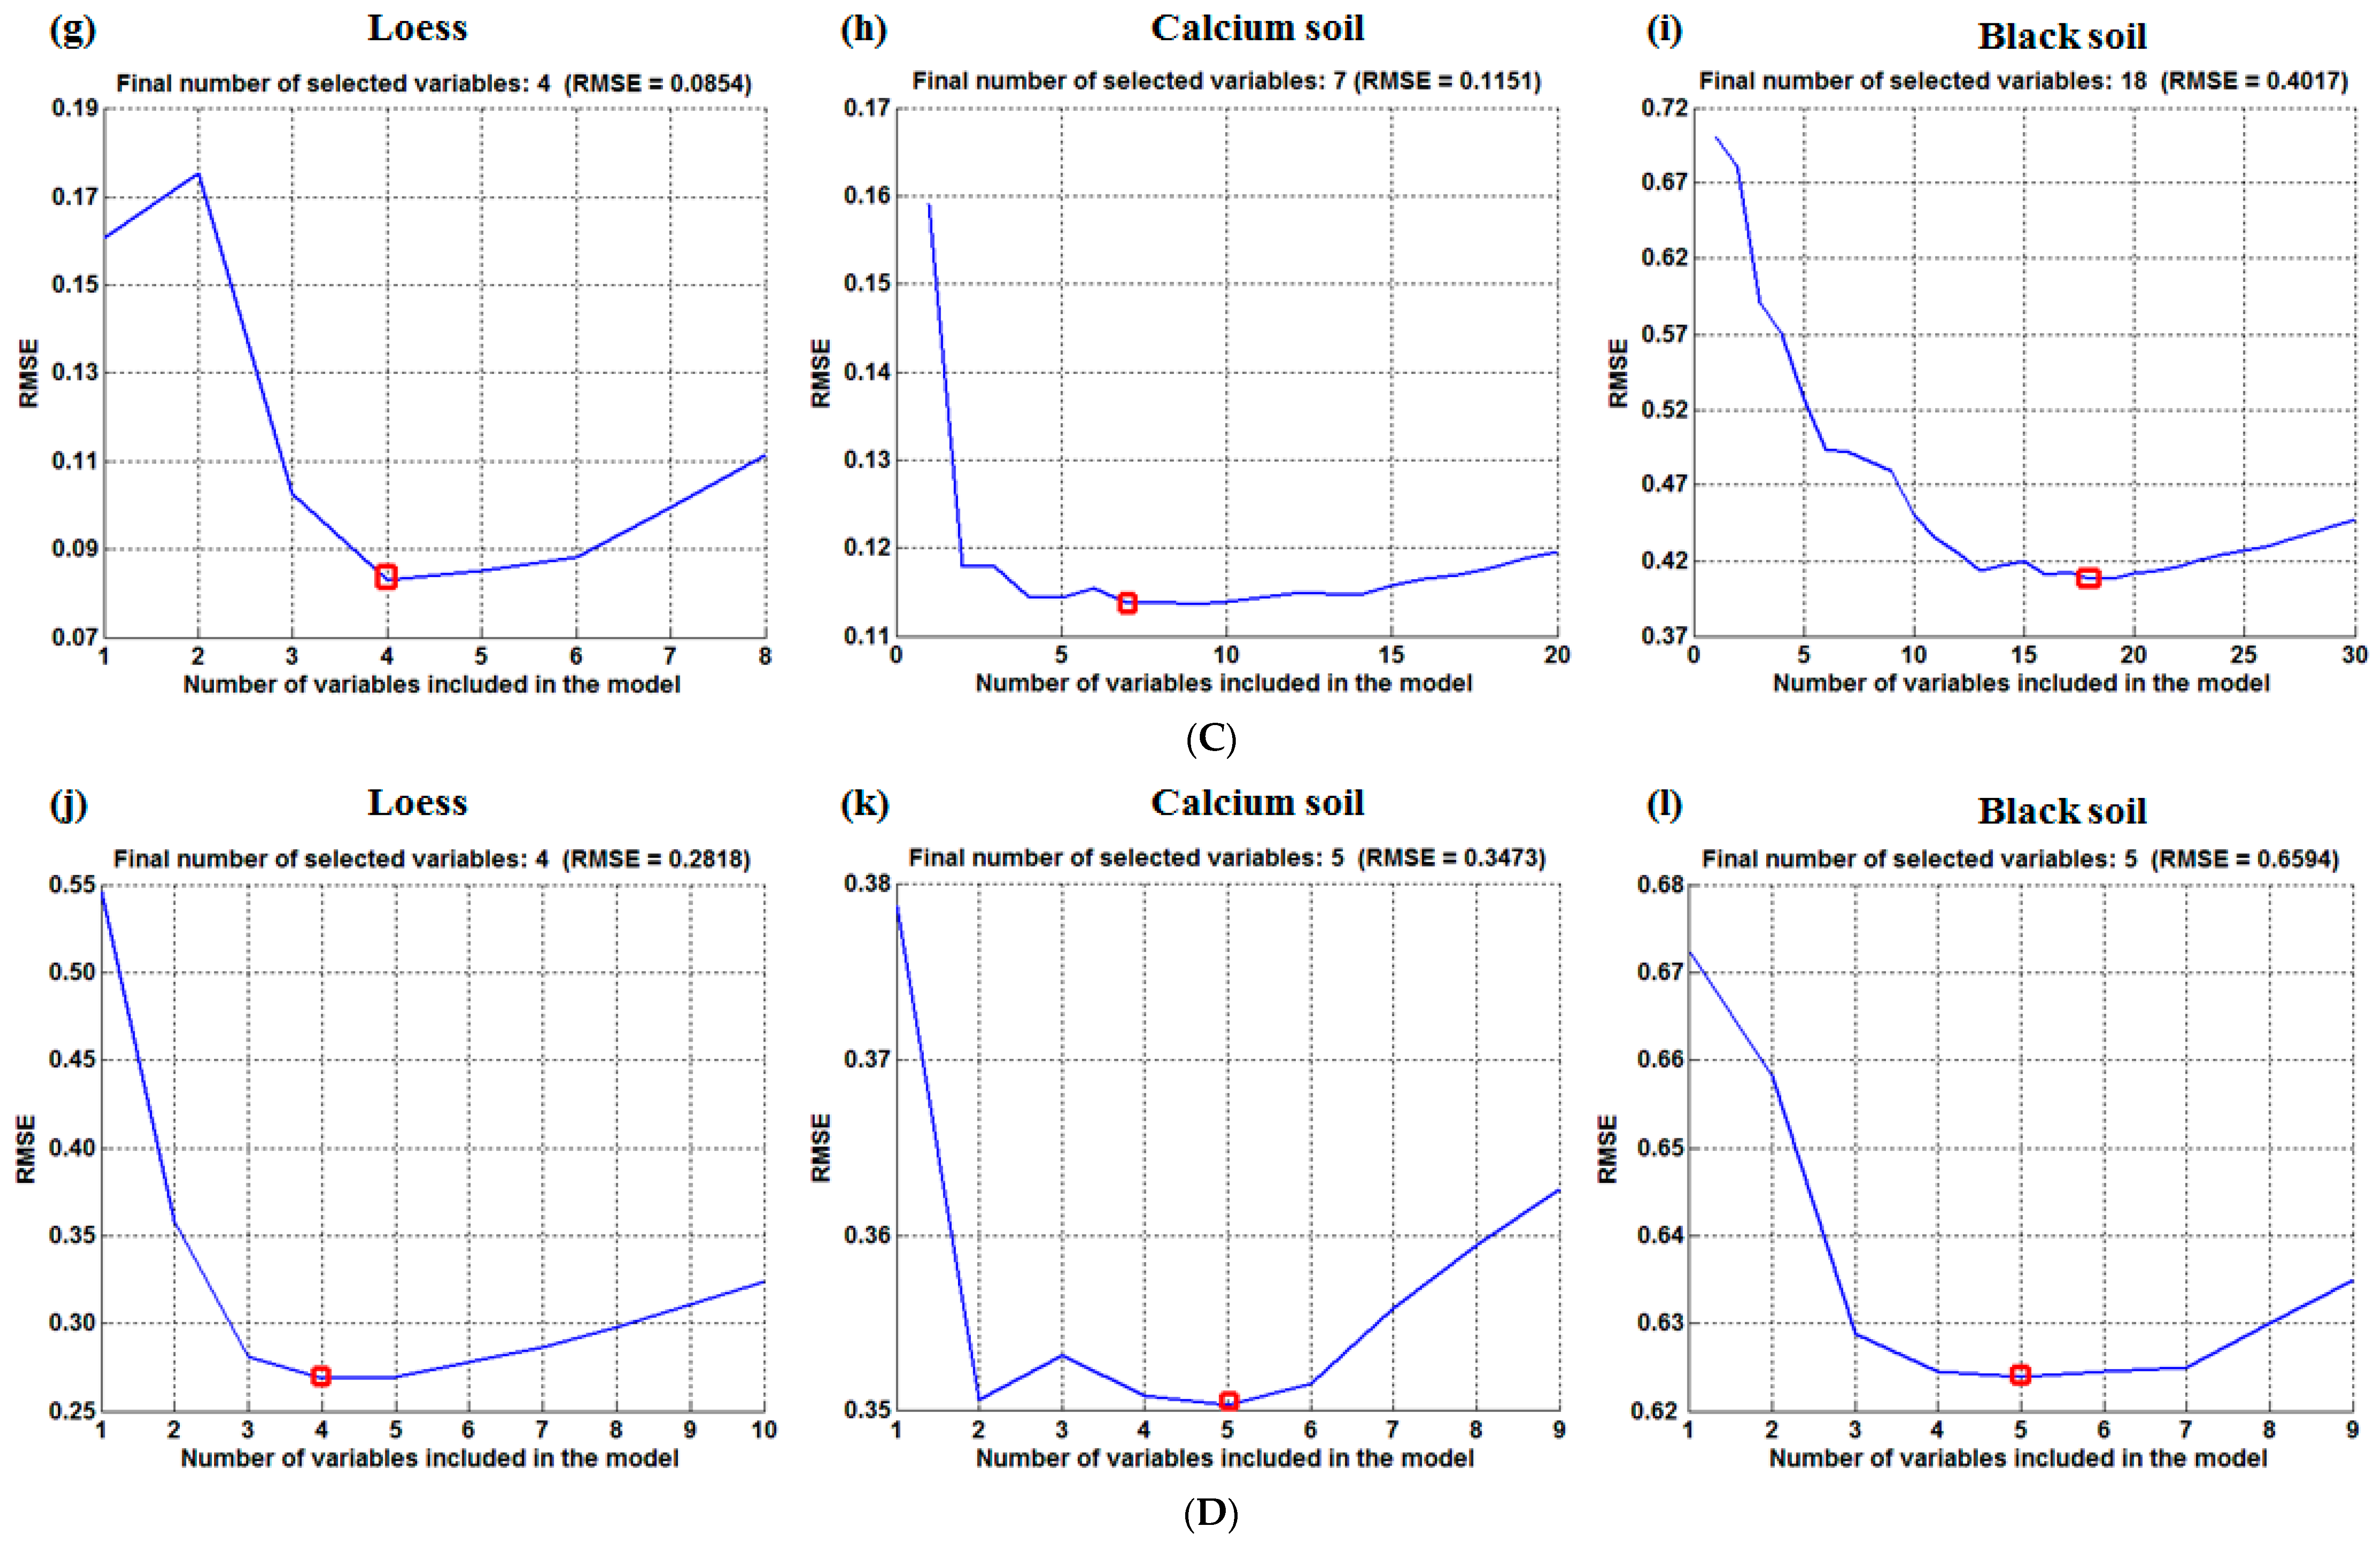
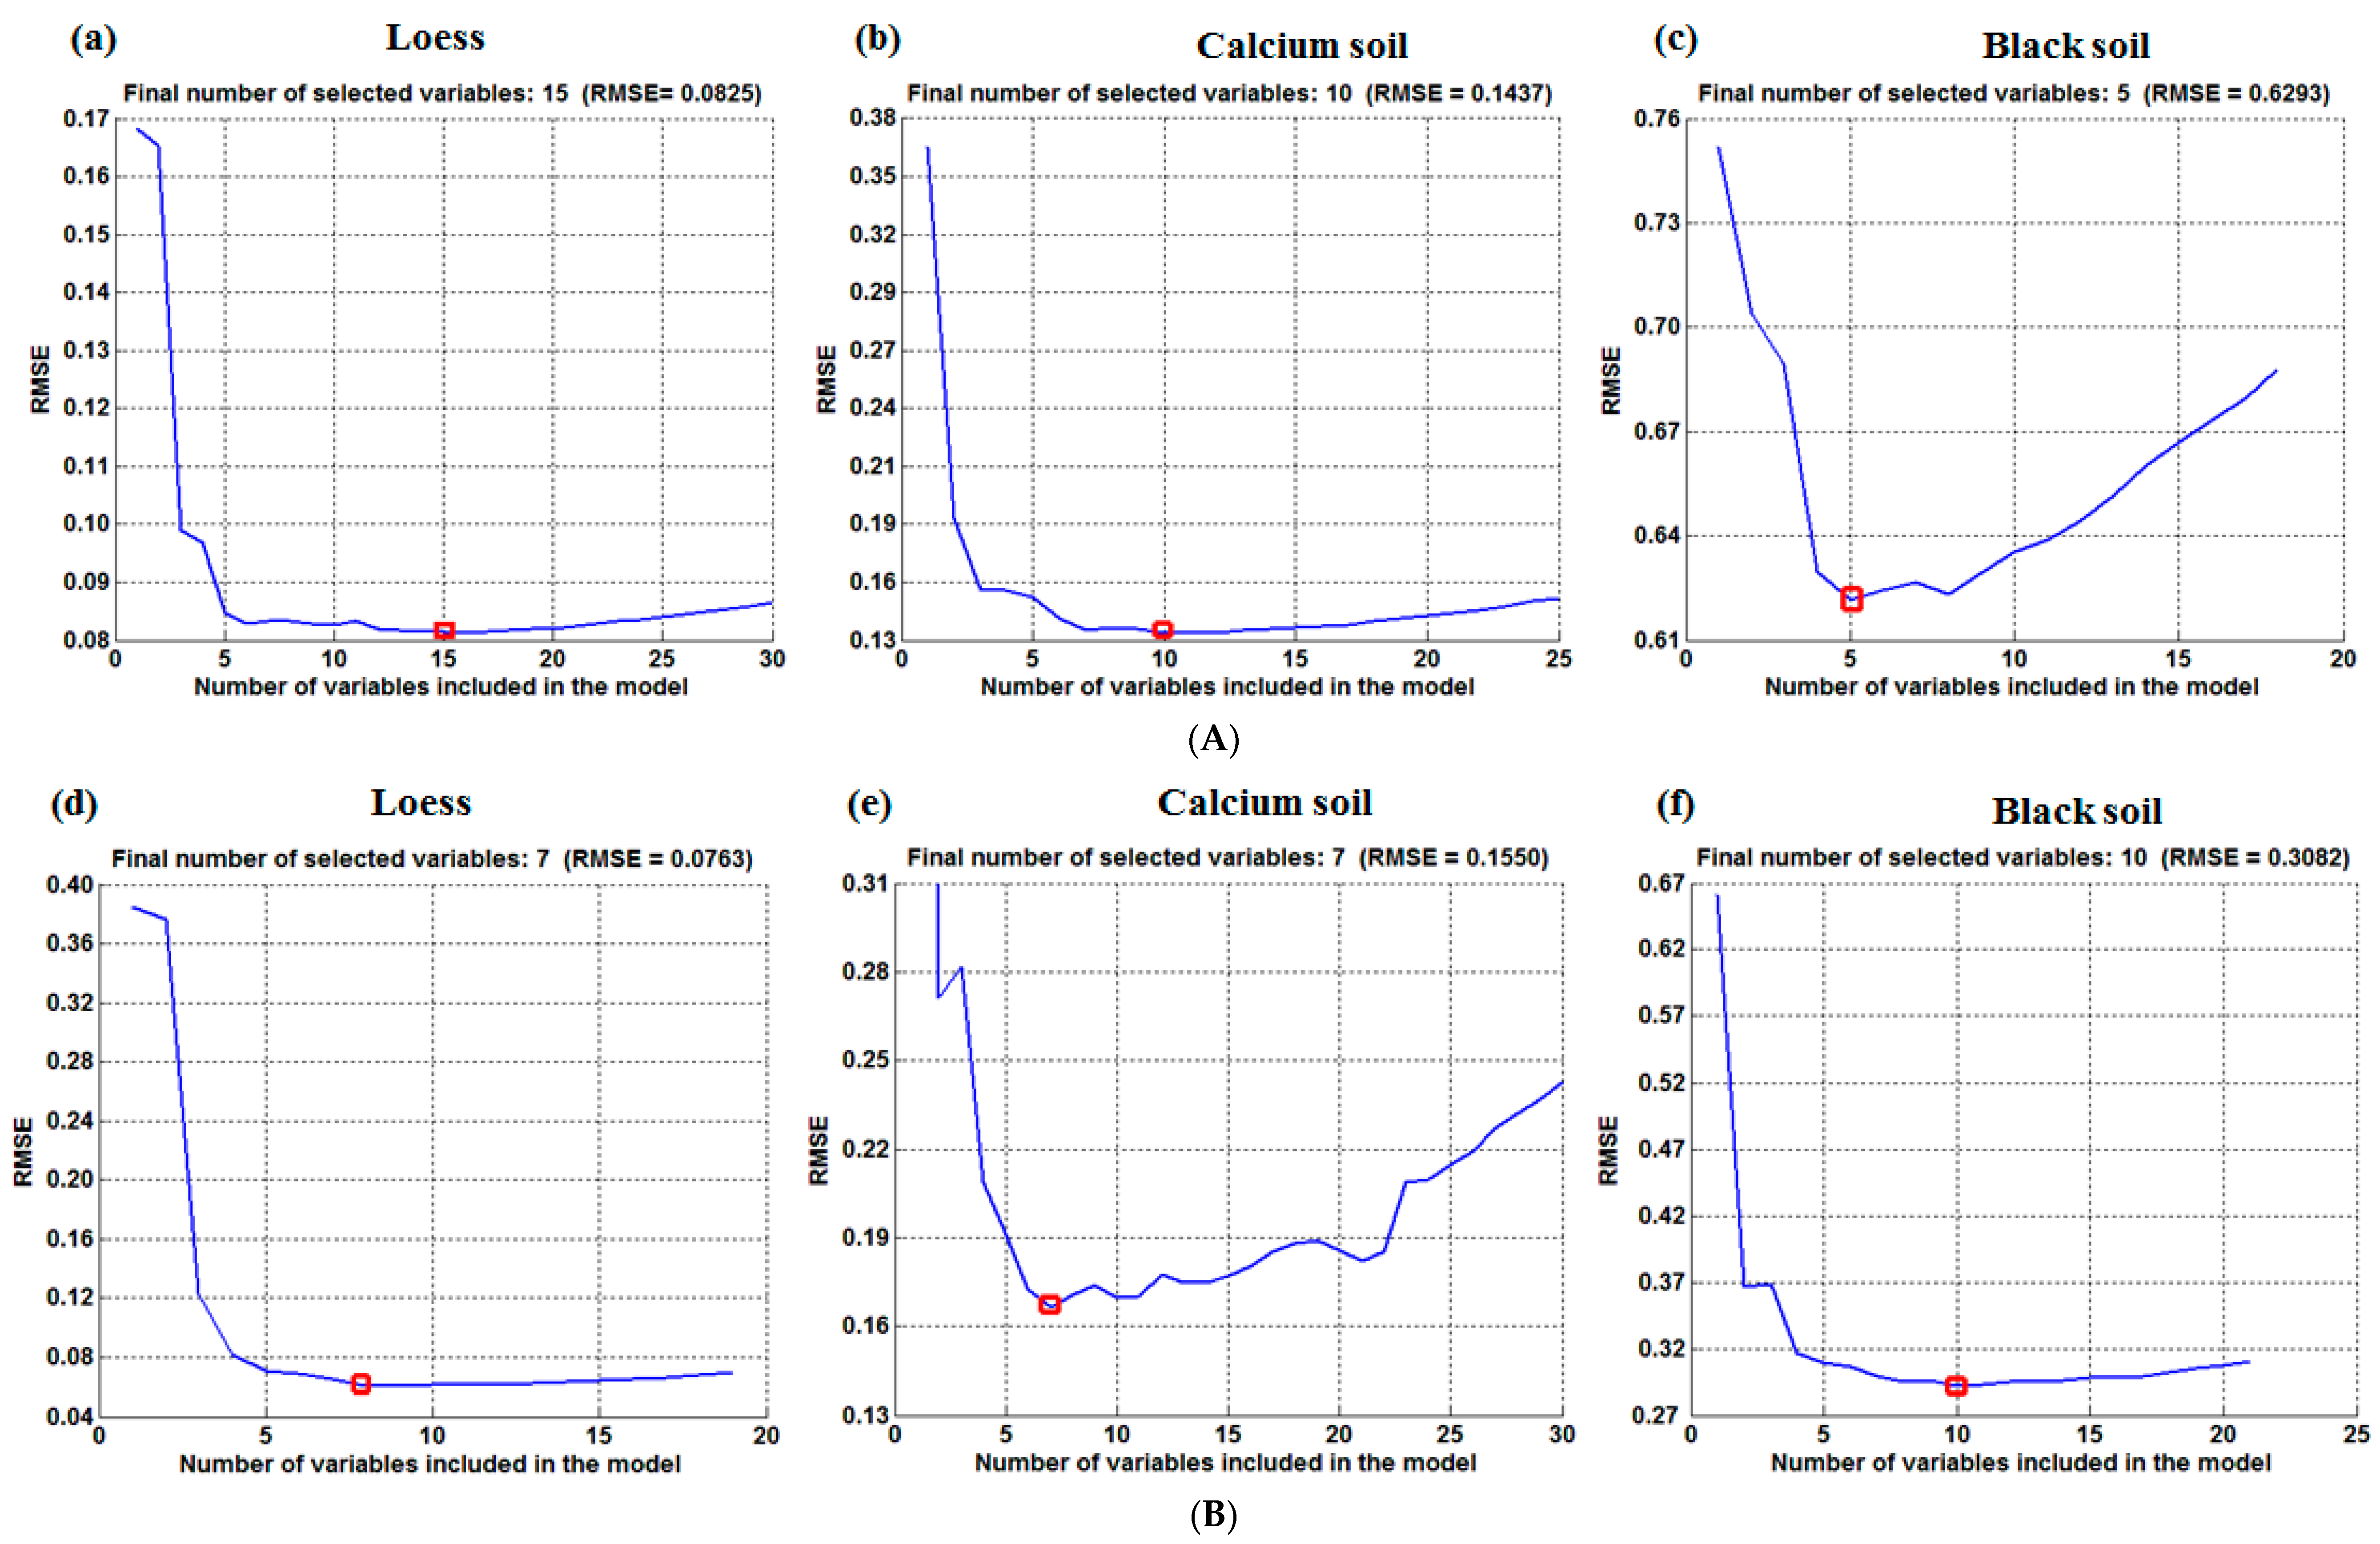
2.6.2. Successive Projections Algorithm-Multiple Linear Regression (SPA-MLR)

Araujo et al. [37] first proposed the selection of spectral variables by means of the successive projections algorithm (SPA). Soares [38] used SPA for cross-classification analysis. The SPA, a forward variable selection method, uses vector projection analysis to find the variable group with minimal redundancy information to effectively eliminate the collinear, singular and instable variables in the spectra. Since it reduces the number of variables used in the model and lowers the complexity of the model, the collinear between the vectors is minimized. The multiple liner regression (MLR) adopts the least squares method to estimate the coefficient matrix, resulting in the samples whose numbers are more than the number of spectral variables. Extracting feature wavelength modeling based on SPA-MLR has significance in actual detection because of the useful information for mining spectral data with latent variables [39].

2.6.3. Competitive Adaptive Weighting Method (CARS)

The competitive adaptive weighted algorithm method, imitating the evolution of “survival of the fittest” principle, phases out of the invariable wavelength [40]. It uses Monte Carlo sampling or random sampling method to select a part of the sample from the calibration set samples for PLS modeling and repeats this process for hundreds of iterations. In the process of wavelength variable selection, the adaptive weighted sampling method is used to preserve the wavelength variable with the absolute value of PLS regression coefficient, and the wavelength invariable with small absolute value of regression coefficient is removed. In order to obtain a series of wavelength variable subsets, each subset of wavelength variables is modeled by cross validation, and the optimal wavelength variable subset is selected according to the RMSECV value [41].

2.7. Model Evaluation Index

In this experiment, the modeling effect is evaluated by the correlation coefficient R, the root mean square error (RMSE) and the residual predictive deviation (RPD). The correlation coefficient R reflects the level of intimacy between variables, root mean square error (RMSE) reflects the accuracy of the model, and RPD reflects the prediction ability of the model. The higher the R and RPD and the lower the RMSE, the better the performance of the prediction model. In this paper, Rc and Rp represent the correlation coefficient of calibration set and prediction set, respectively, and RMSEC and RMSEP represent the root mean square error of the calibration set and prediction set respectively. Besides this, RPD was suggested to be at least 3 for agriculture applications; 2 < RPD < 3 indicates a model with a good prediction ability; 1.4 < RPD < 2 is an intermediate model needing some improvement; and the RPD < 1.4 indicates a poor prediction ability of the model [42].

3. Results and Discussion

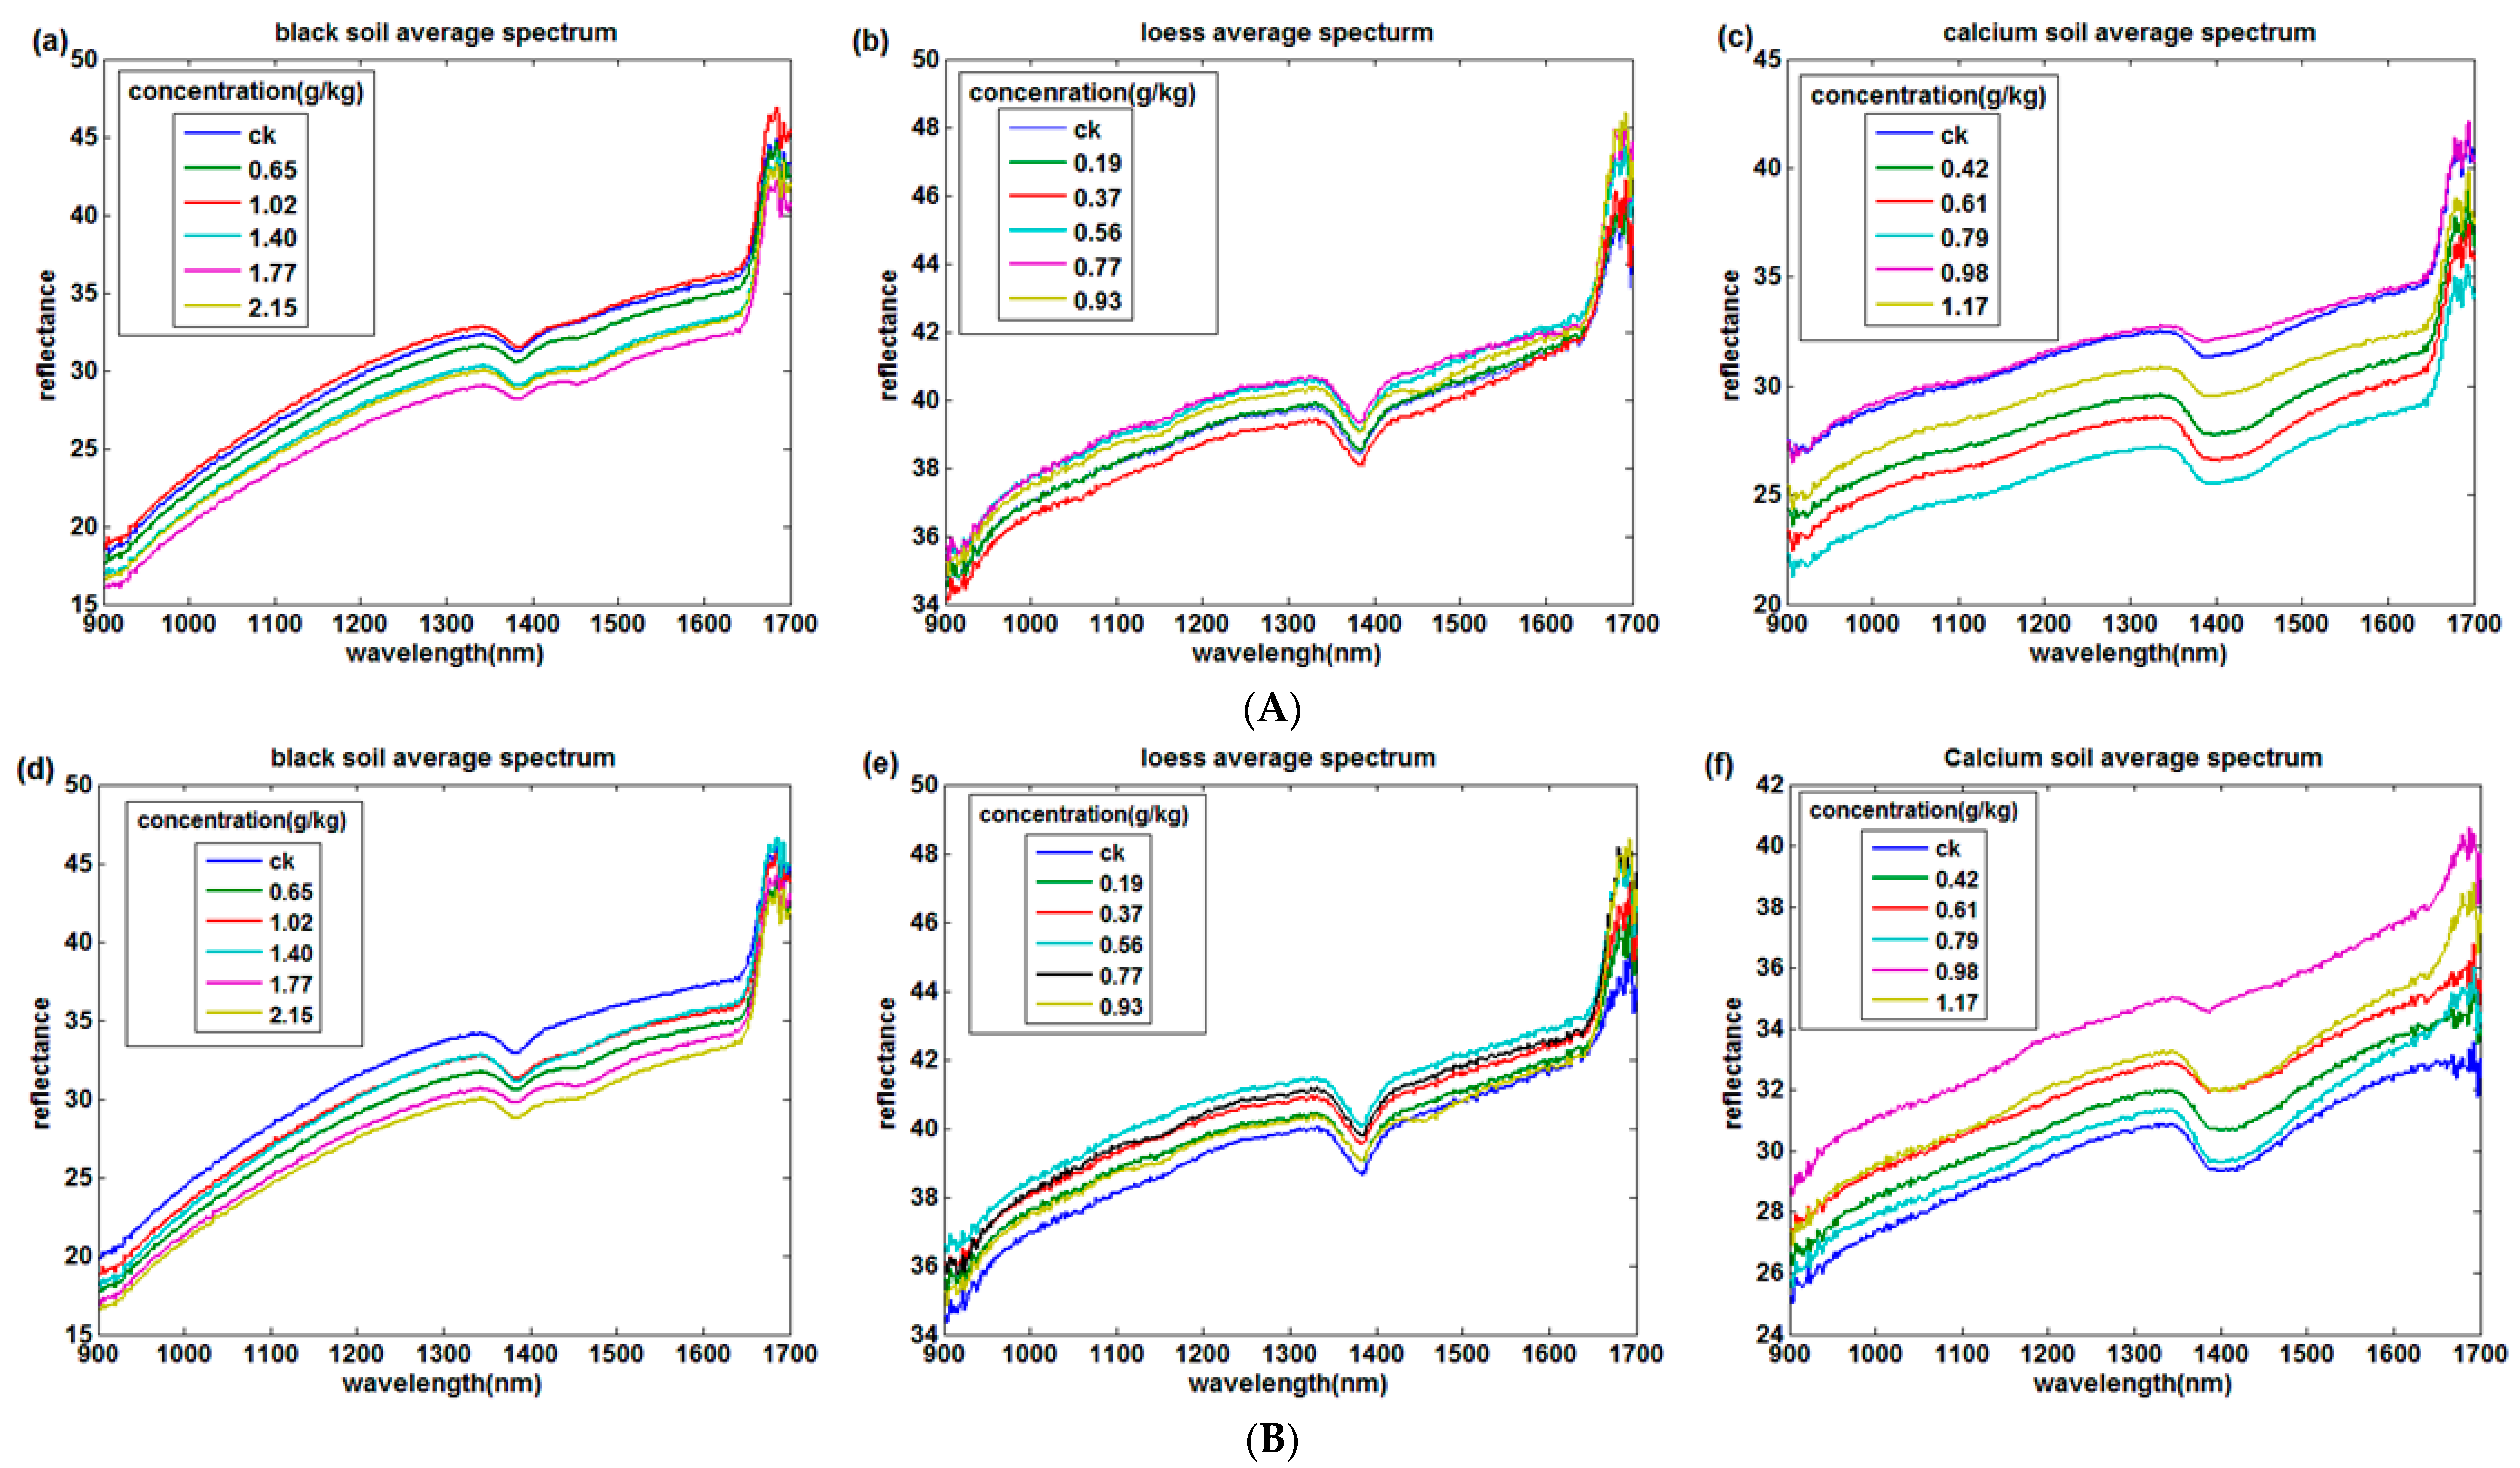
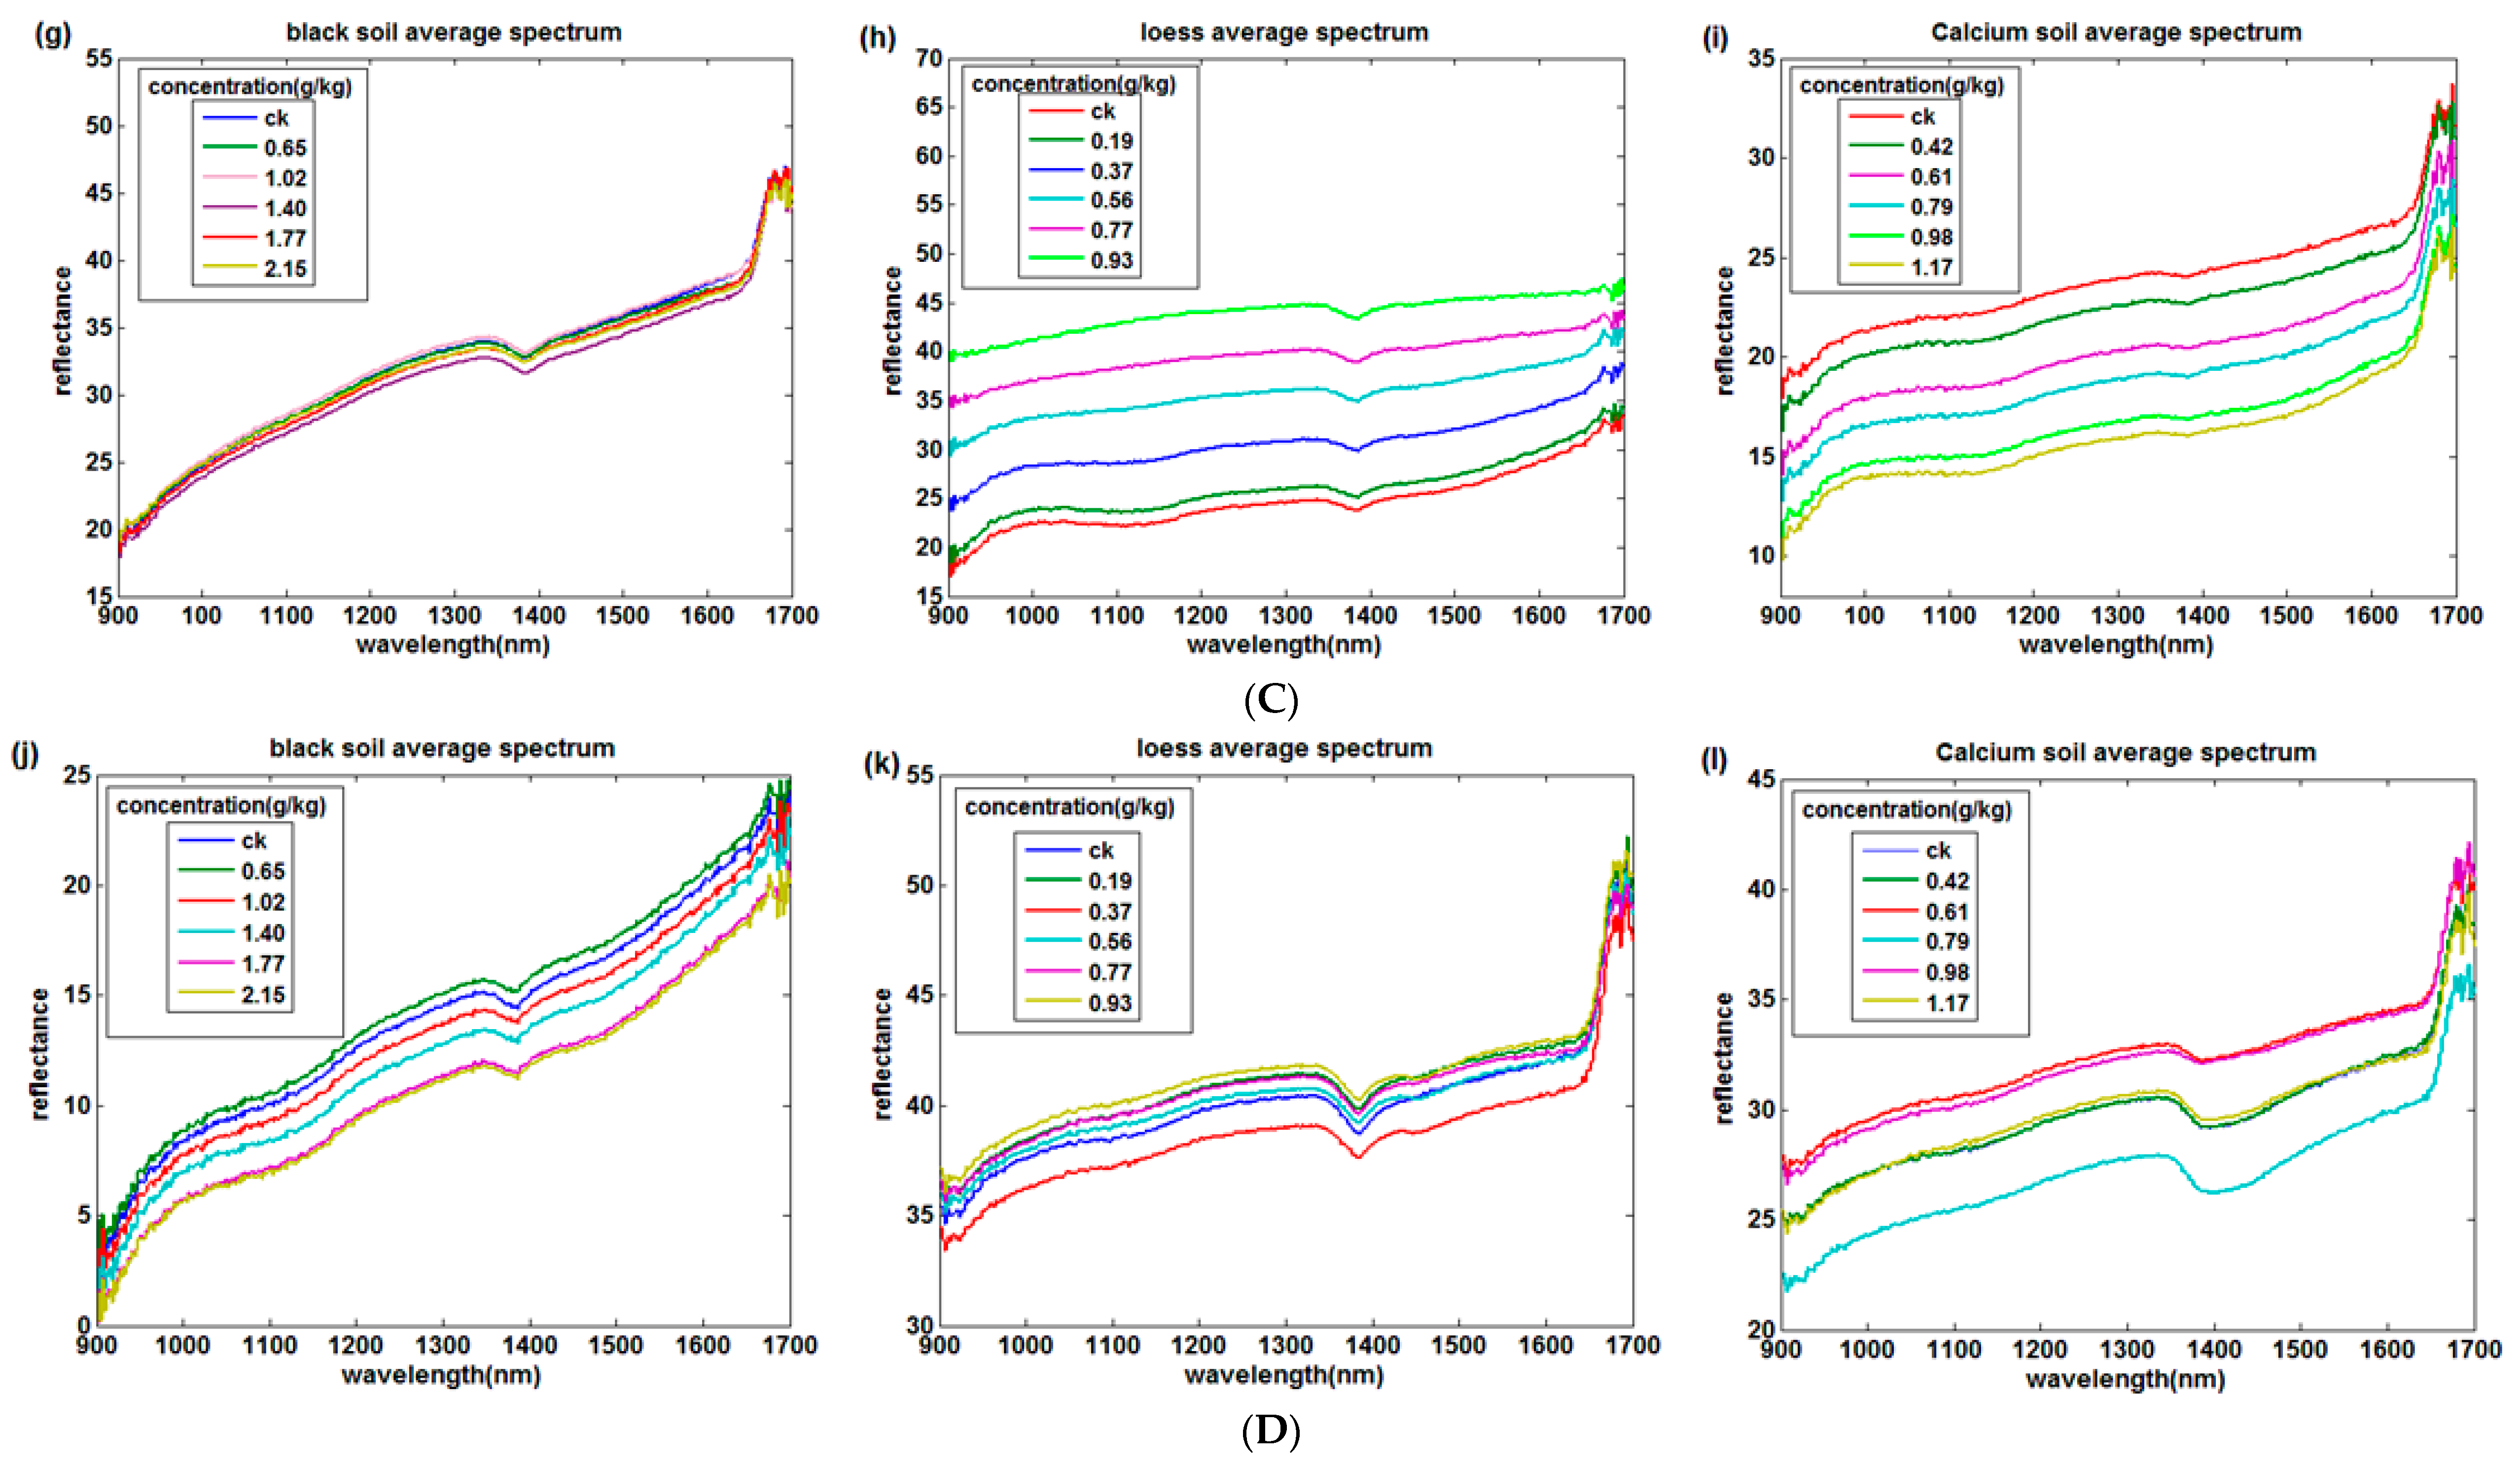
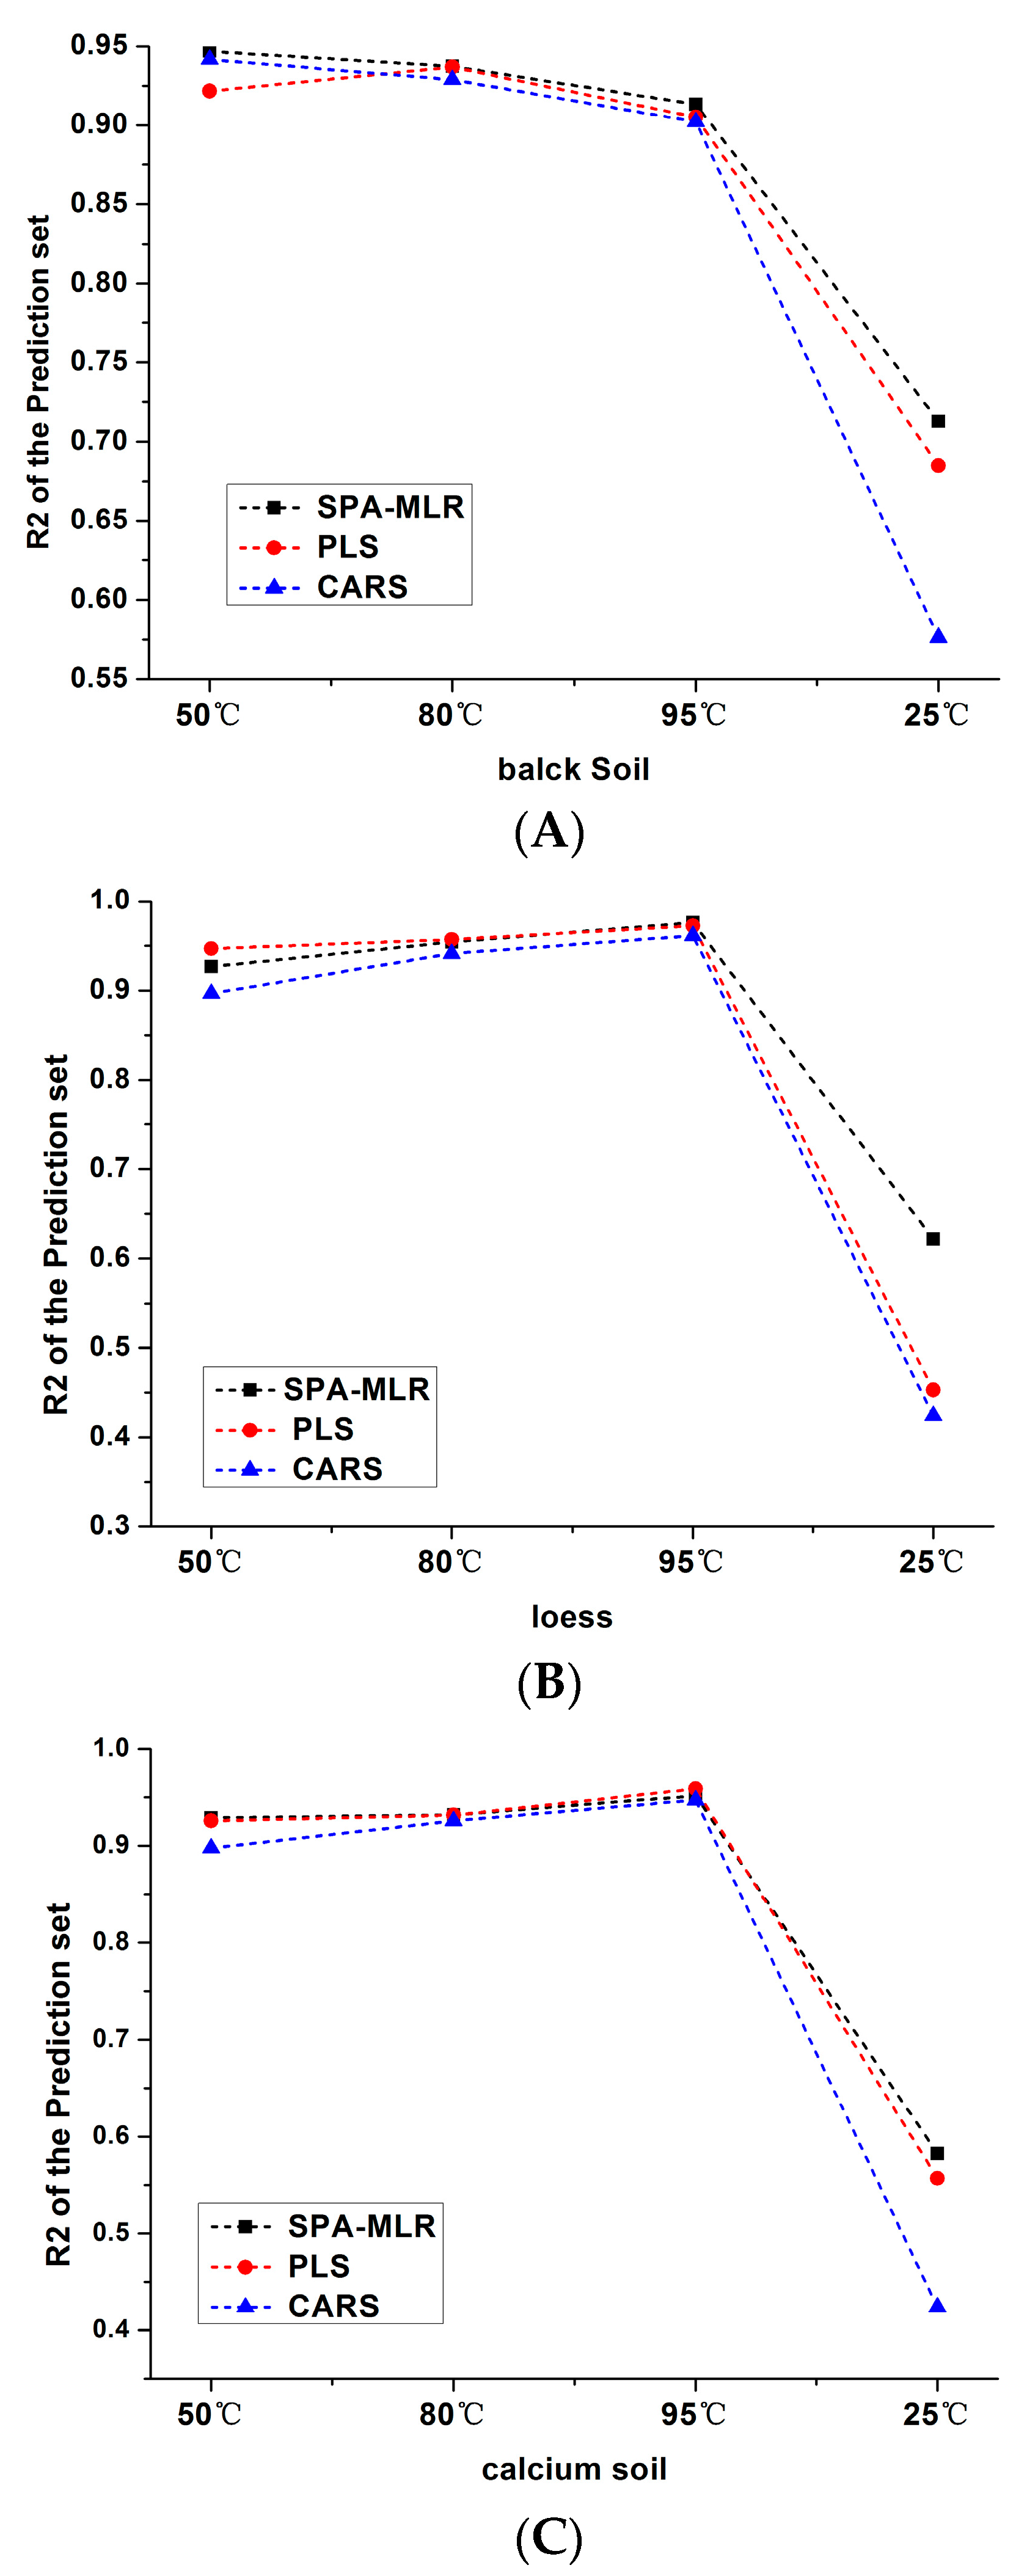
3.1. Temperature and Soil Reflectance

In this experiment, the spectral information of three kinds of soil samples at four temperatures were collected. According to Figure 2, the abscissa of the curve is the wavelength and the ordinate of the curve is the average spectral reflectance.
Figure 2A–D shows the near infrared reflectance curves of the four soils after 50 °C, 80 °C, 95 °C drying and 25 °C placement respectively. First, the near infrared spectra of different soils vary from each other, but the overall trends are similar. The physical properties, chemical properties and soil colors would have certain influence on the absorption of near infrared spectra [43], which results in the differences of spectral curves.
Second, the temperature does affect reflectance strength. The reflectance of the black soil spectral curve at 25 °C placement is significantly lower than other temperatures. The reason is that the water in the soil cannot be completely dried when soil was placed at 25 °C and the water absorption of near-infrared spectroscopy is very sensitive. The loess spectral curves are less affected by temperature because the loess are relatively loose, and porous, thus the water content in loess are easy to evaporate while drying.
Third, the spectral absorption characteristics of those three soils are different. There is an obvious decrease trend in the band 1385 nm among the black soil, loess and calcium soil, which is caused by the vibration of O–H [44]. However, different soils have different characteristic bands. It is suggested in Figure 2a that the spectral reflectance of black soil decreases gradually at 1470 nm with the increase of nitrogen concentration of soil. Figure 2h shows that the spectral reflectance of loess decreases weakly near the band 1160 nm and Figure 2i displays that calcium soil has a spectral absorption at band 1145 nm when the drying temperature is 95 °C. Those mentioned above might be the characteristic bands of soil total nitrogen in different kinds of soils.

3.2. Data Modeling Prediction and Analysis

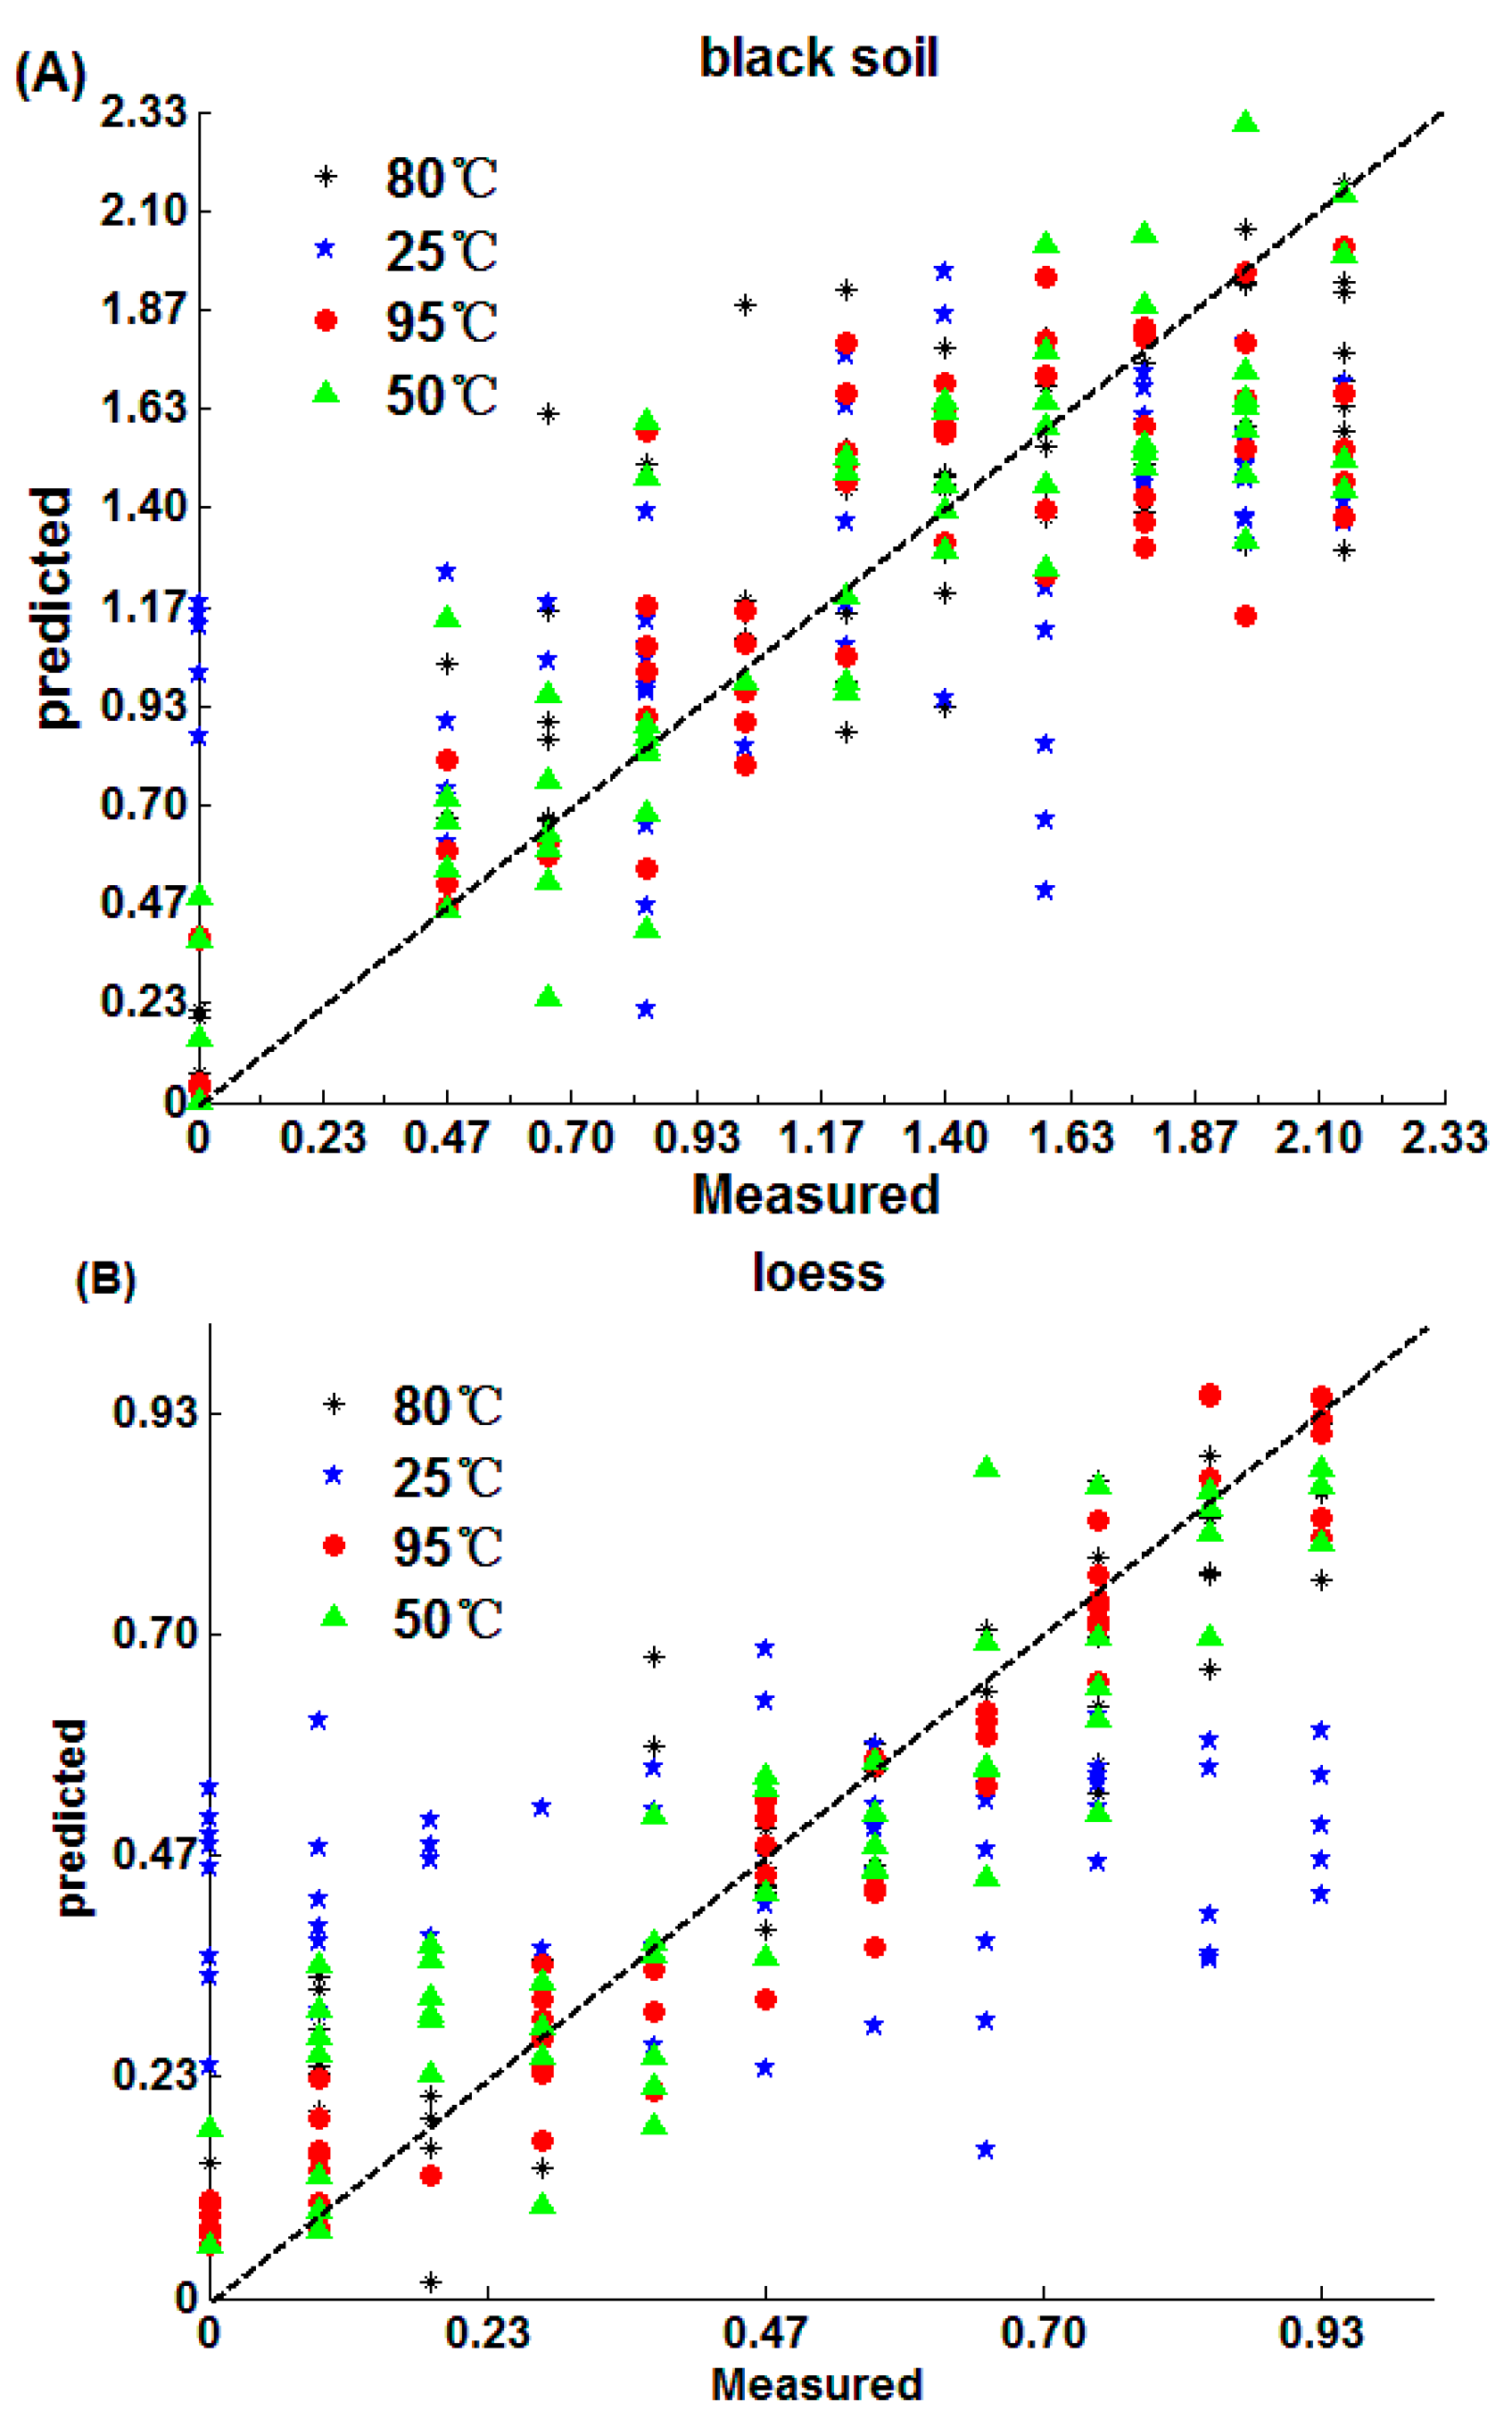
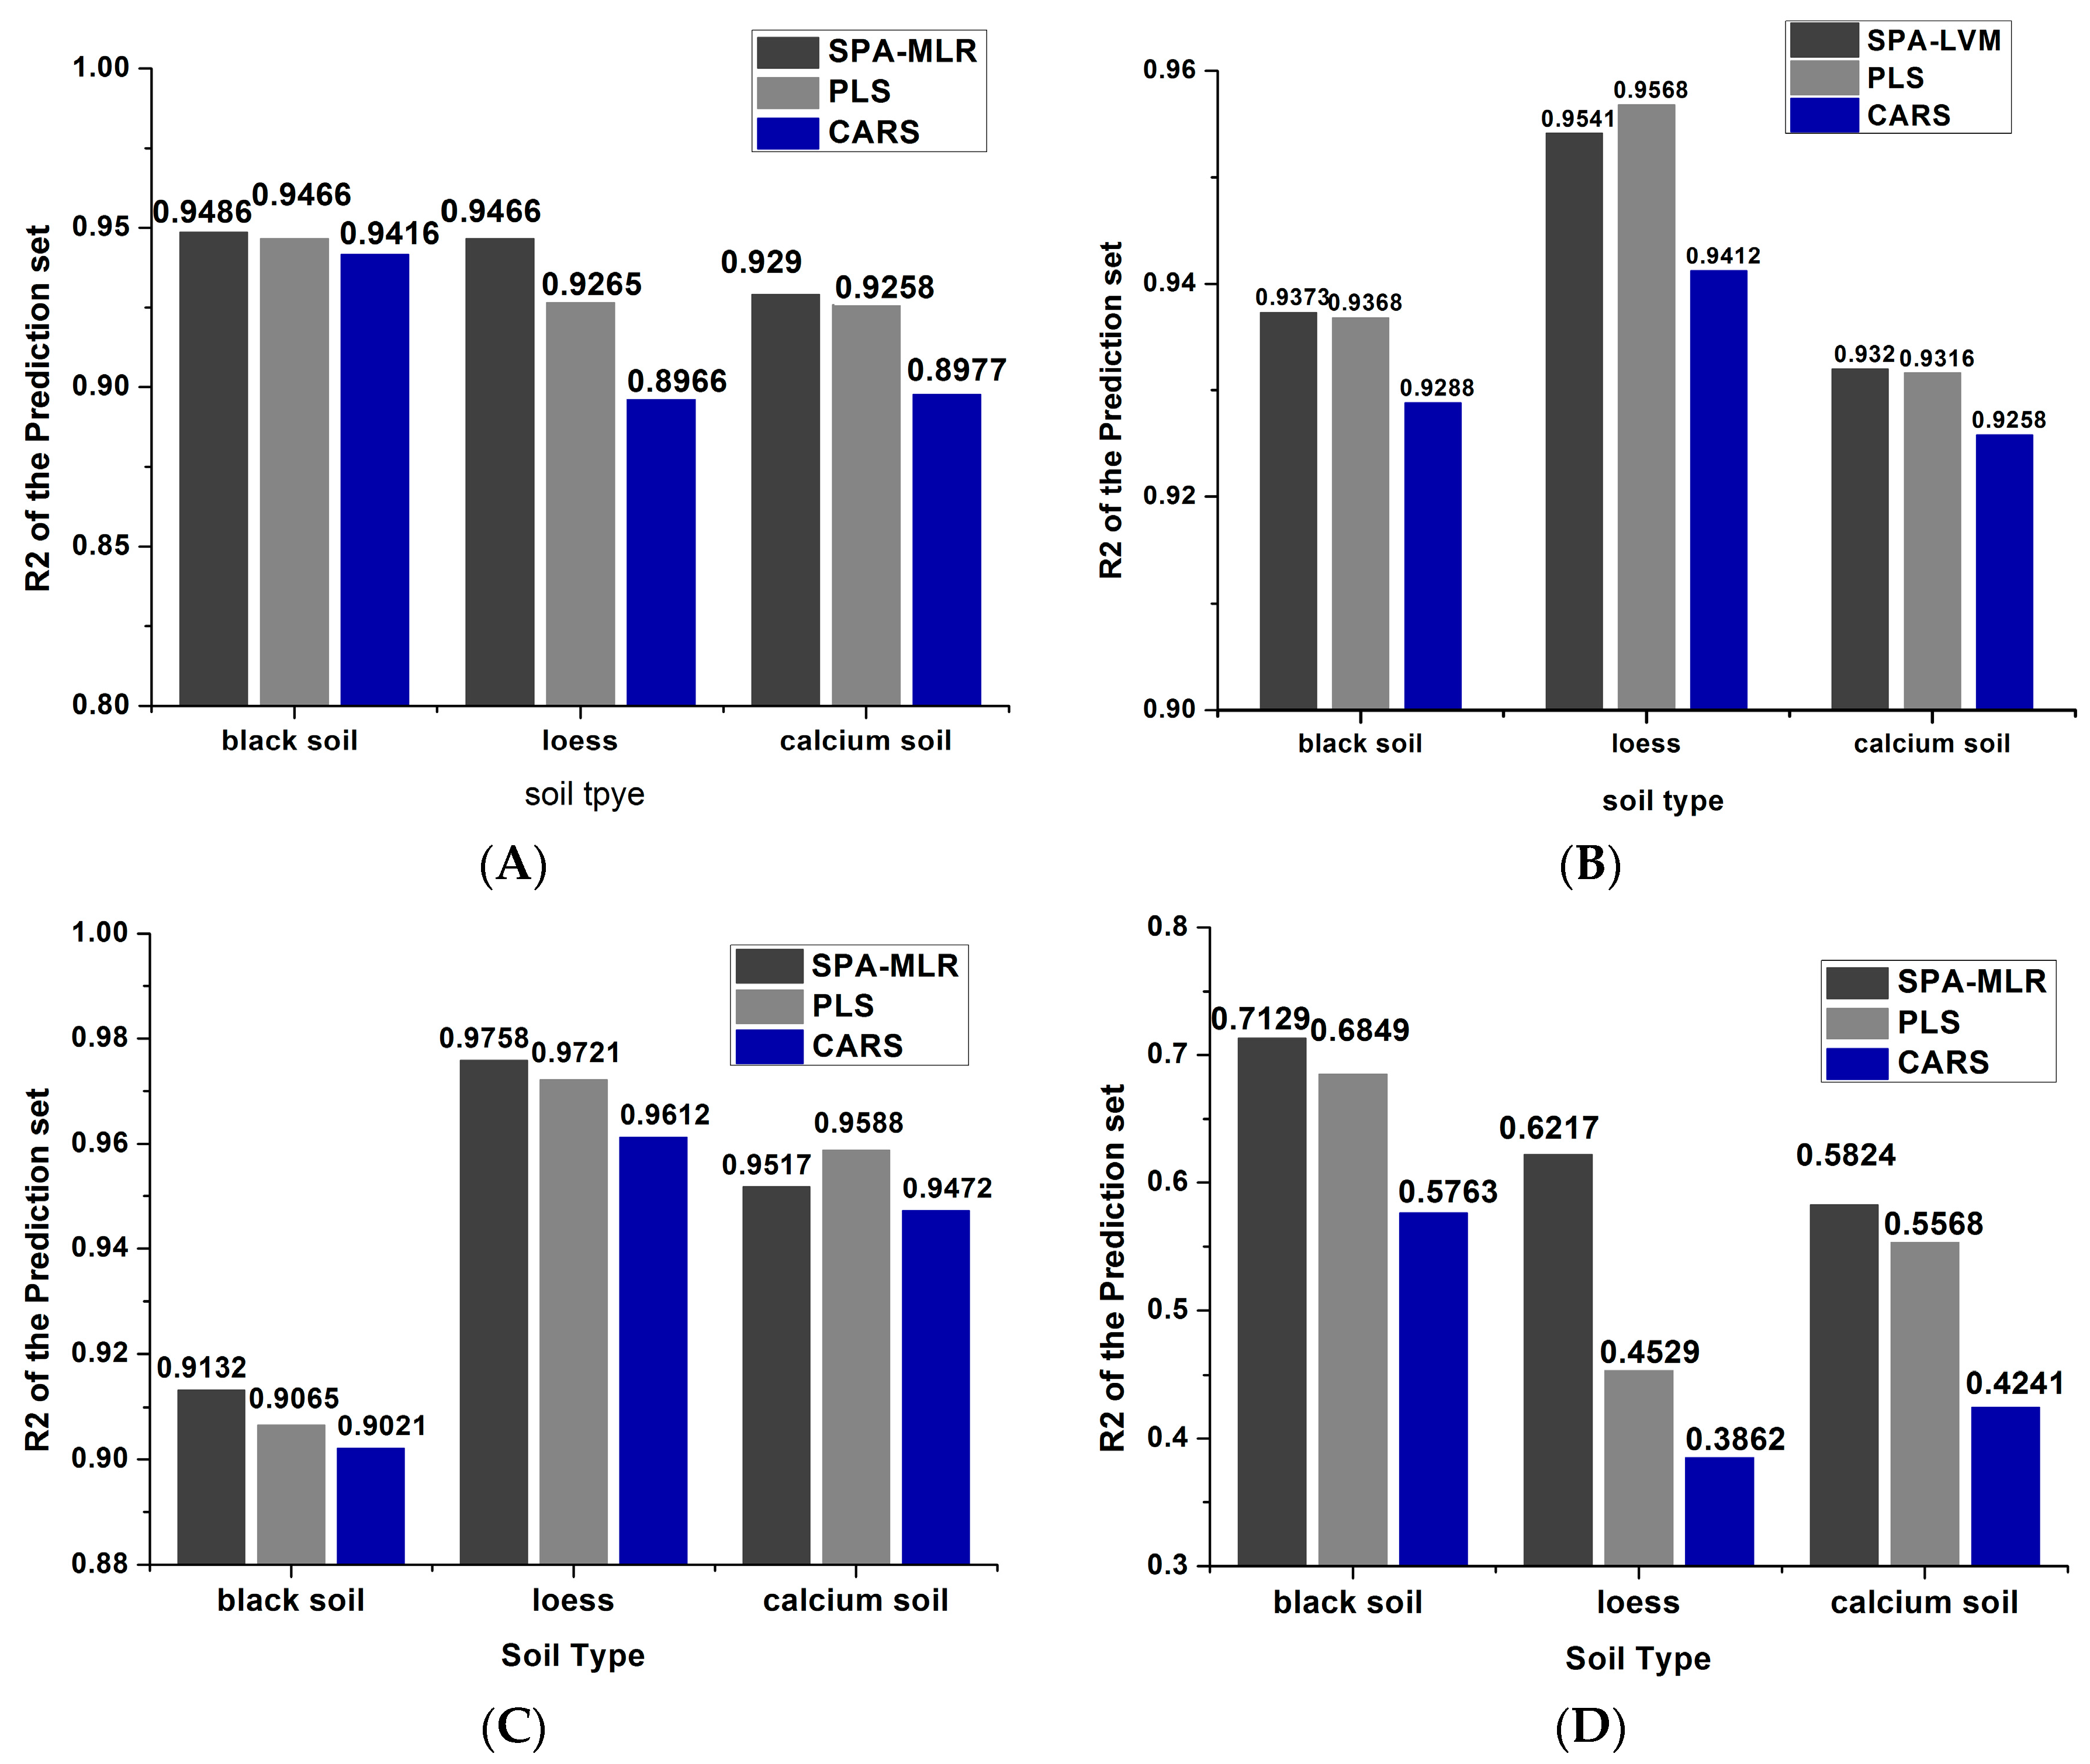
3.2.1. SPA-MLR Model

The maximum number of selected variables was set up to 30, and the wavelength variables were selected from the 400 spectral variables based on the minimum error, which are shown in Table 1. Figure 3 presents the SPA wavelength number of loess, calcium soil and black soil, where Figure 3A–D represents the variable number of SPA after soil 50 °C, 80 °C, 95 °C drying and 25 °C placement respectively. It is indicated that although the variable numbers and bands differed in the same soil at different temperatures after the variable selection, the characteristic bands are similar when the temperatures varied small. The variable numbers and bands for different soils on the same drying temperature are not the same, suggesting that both soil type and drying temperature have a great influence on wavelength variables selected by SPA-MLR.
The prediction results of SPA-MLR are shown in Table 2 and Figure 4. Both loess (RP = 0.9758, RMSEP = 0.07 g/kg, RPD = 4.35) and calcium soil (RP = 0.9517, RMSEP = 0.103 g/kg, RPD = 3.24) obtain the best detection effect after 95 °C drying, while black soil has a better detection effect after 50 °C (RP = 0.9486, RMSEP = 0.22 g/kg, RPD = 2.82) and 80 °C(RP = 0.9373, RMSEP = 0.234 g/kg, RPD = 2.55) drying, and the three kinds of soils have the worst effect when soils were placed in the 25 °C environment.
On the one hand, the reason might be that medium and high temperature could stimulate the activity of soil urease and remove fully water in soil [45]. Meanwhile, soil water content was preserved little when soils were placed at 25 °C during the long time. Compared with O–H bond, the N–H bond exists mostly in multiple frequency or combination frequency, which was relatively weak in soil spectra and affects the extraction of soil nitrogen information [46].
On the other hand, the information of physical and chemical properties, including iron oxides, particle size distribution and surface roughness vary dramatically in different soils, which reduce or even obscure the spectral effect of nitrogen in soil [43]. Among them, loess mainly contains SiO2, Al2O3 and CaO with the properties of being loose and porous, and calcium soil mainly consisted of CaCO3. Both loess and calcium soil have few O–H bonds when they were dried, which interferes with the NIR spectrum to a small extent [47].
Hence, the prediction accuracy of loess and calcium soil was the optimum among three kinds of soils. However, the black soil obtains relatively low prediction accuracy because the abundant organic matter and humus in black soil have a strong absorption in NIR, resulting in adverse interference for nitrogen detection [48].
Figure 4 indicates that black soil nitrogen detection ranges from 0.93 g/kg to 1.87 g/kg, and the detection of nitrogen in loess is concentrated in the vicinity of 0.47 g/kg, while the soil nitrogen calcium concentrates from 0.47 g/kg to 0.93 g/kg when soils were placed at 25 °C, which largely deviates from the true values of the nitrogen in soil. The reason might be that the water content in soil was relatively higher when it was placed at 25 °C than when drying at other medium and high temperatures, which affects the extraction of soil nitrogen information [49].

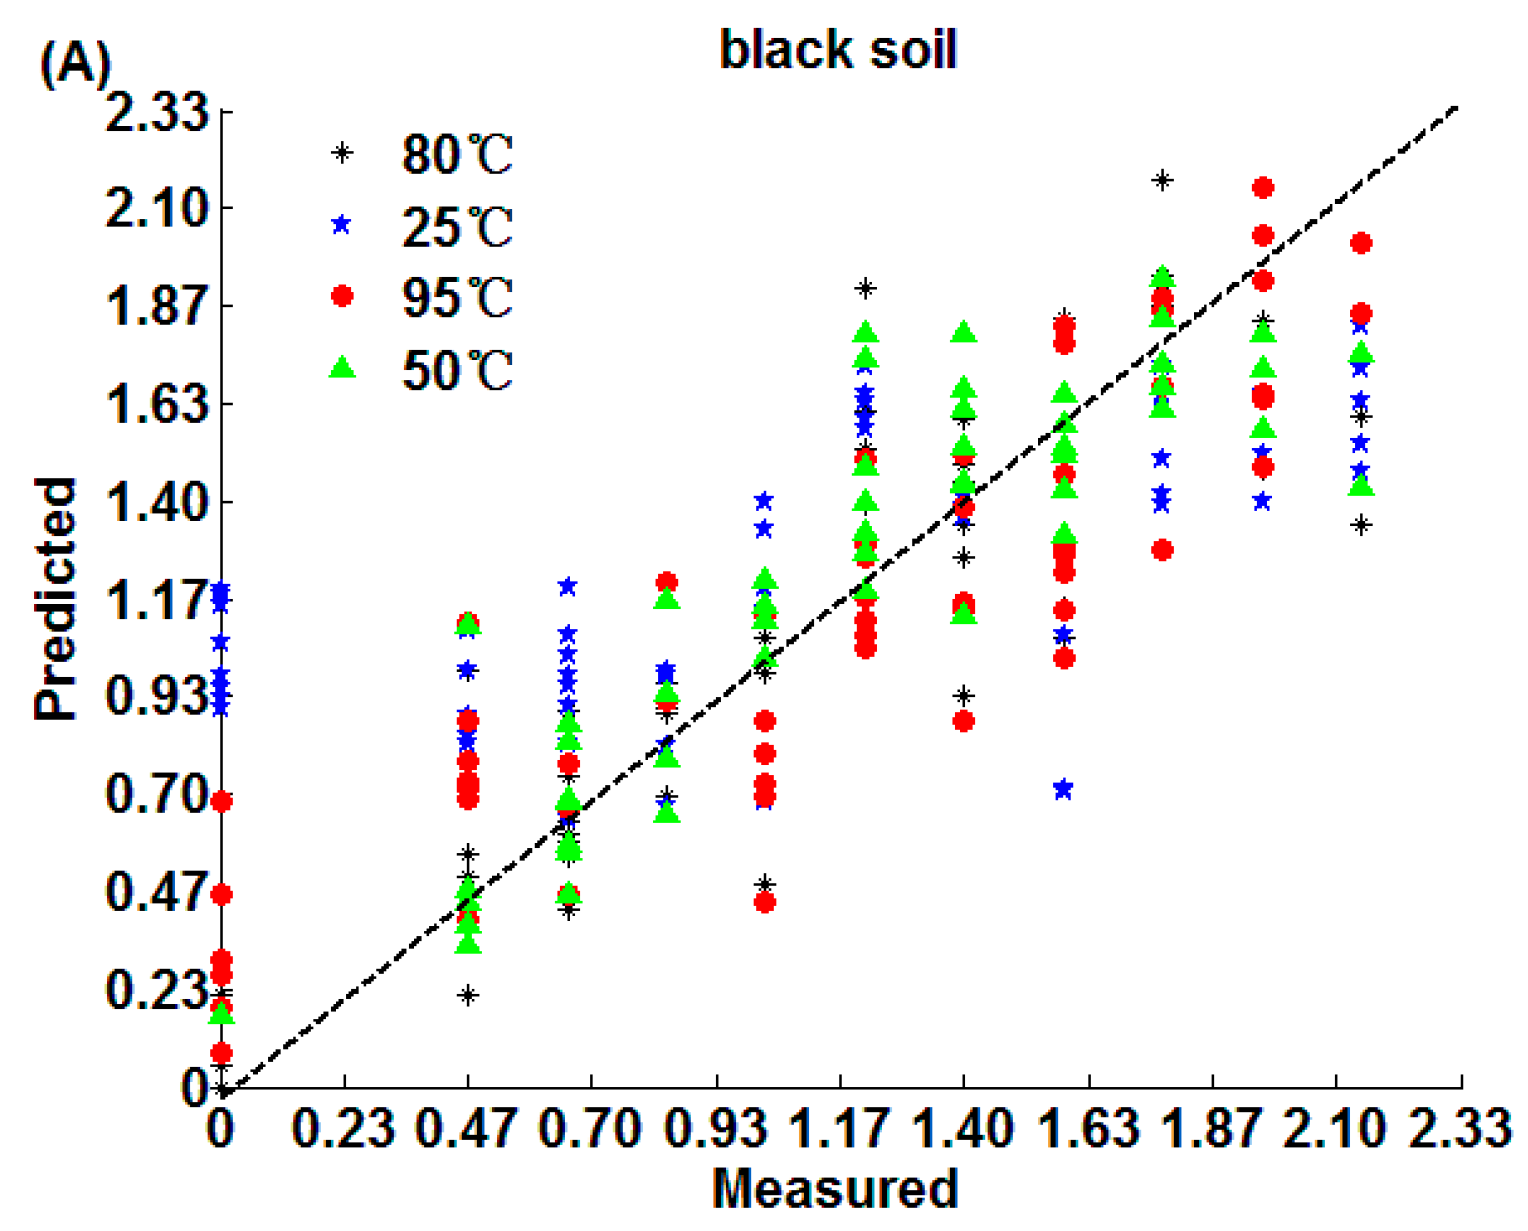
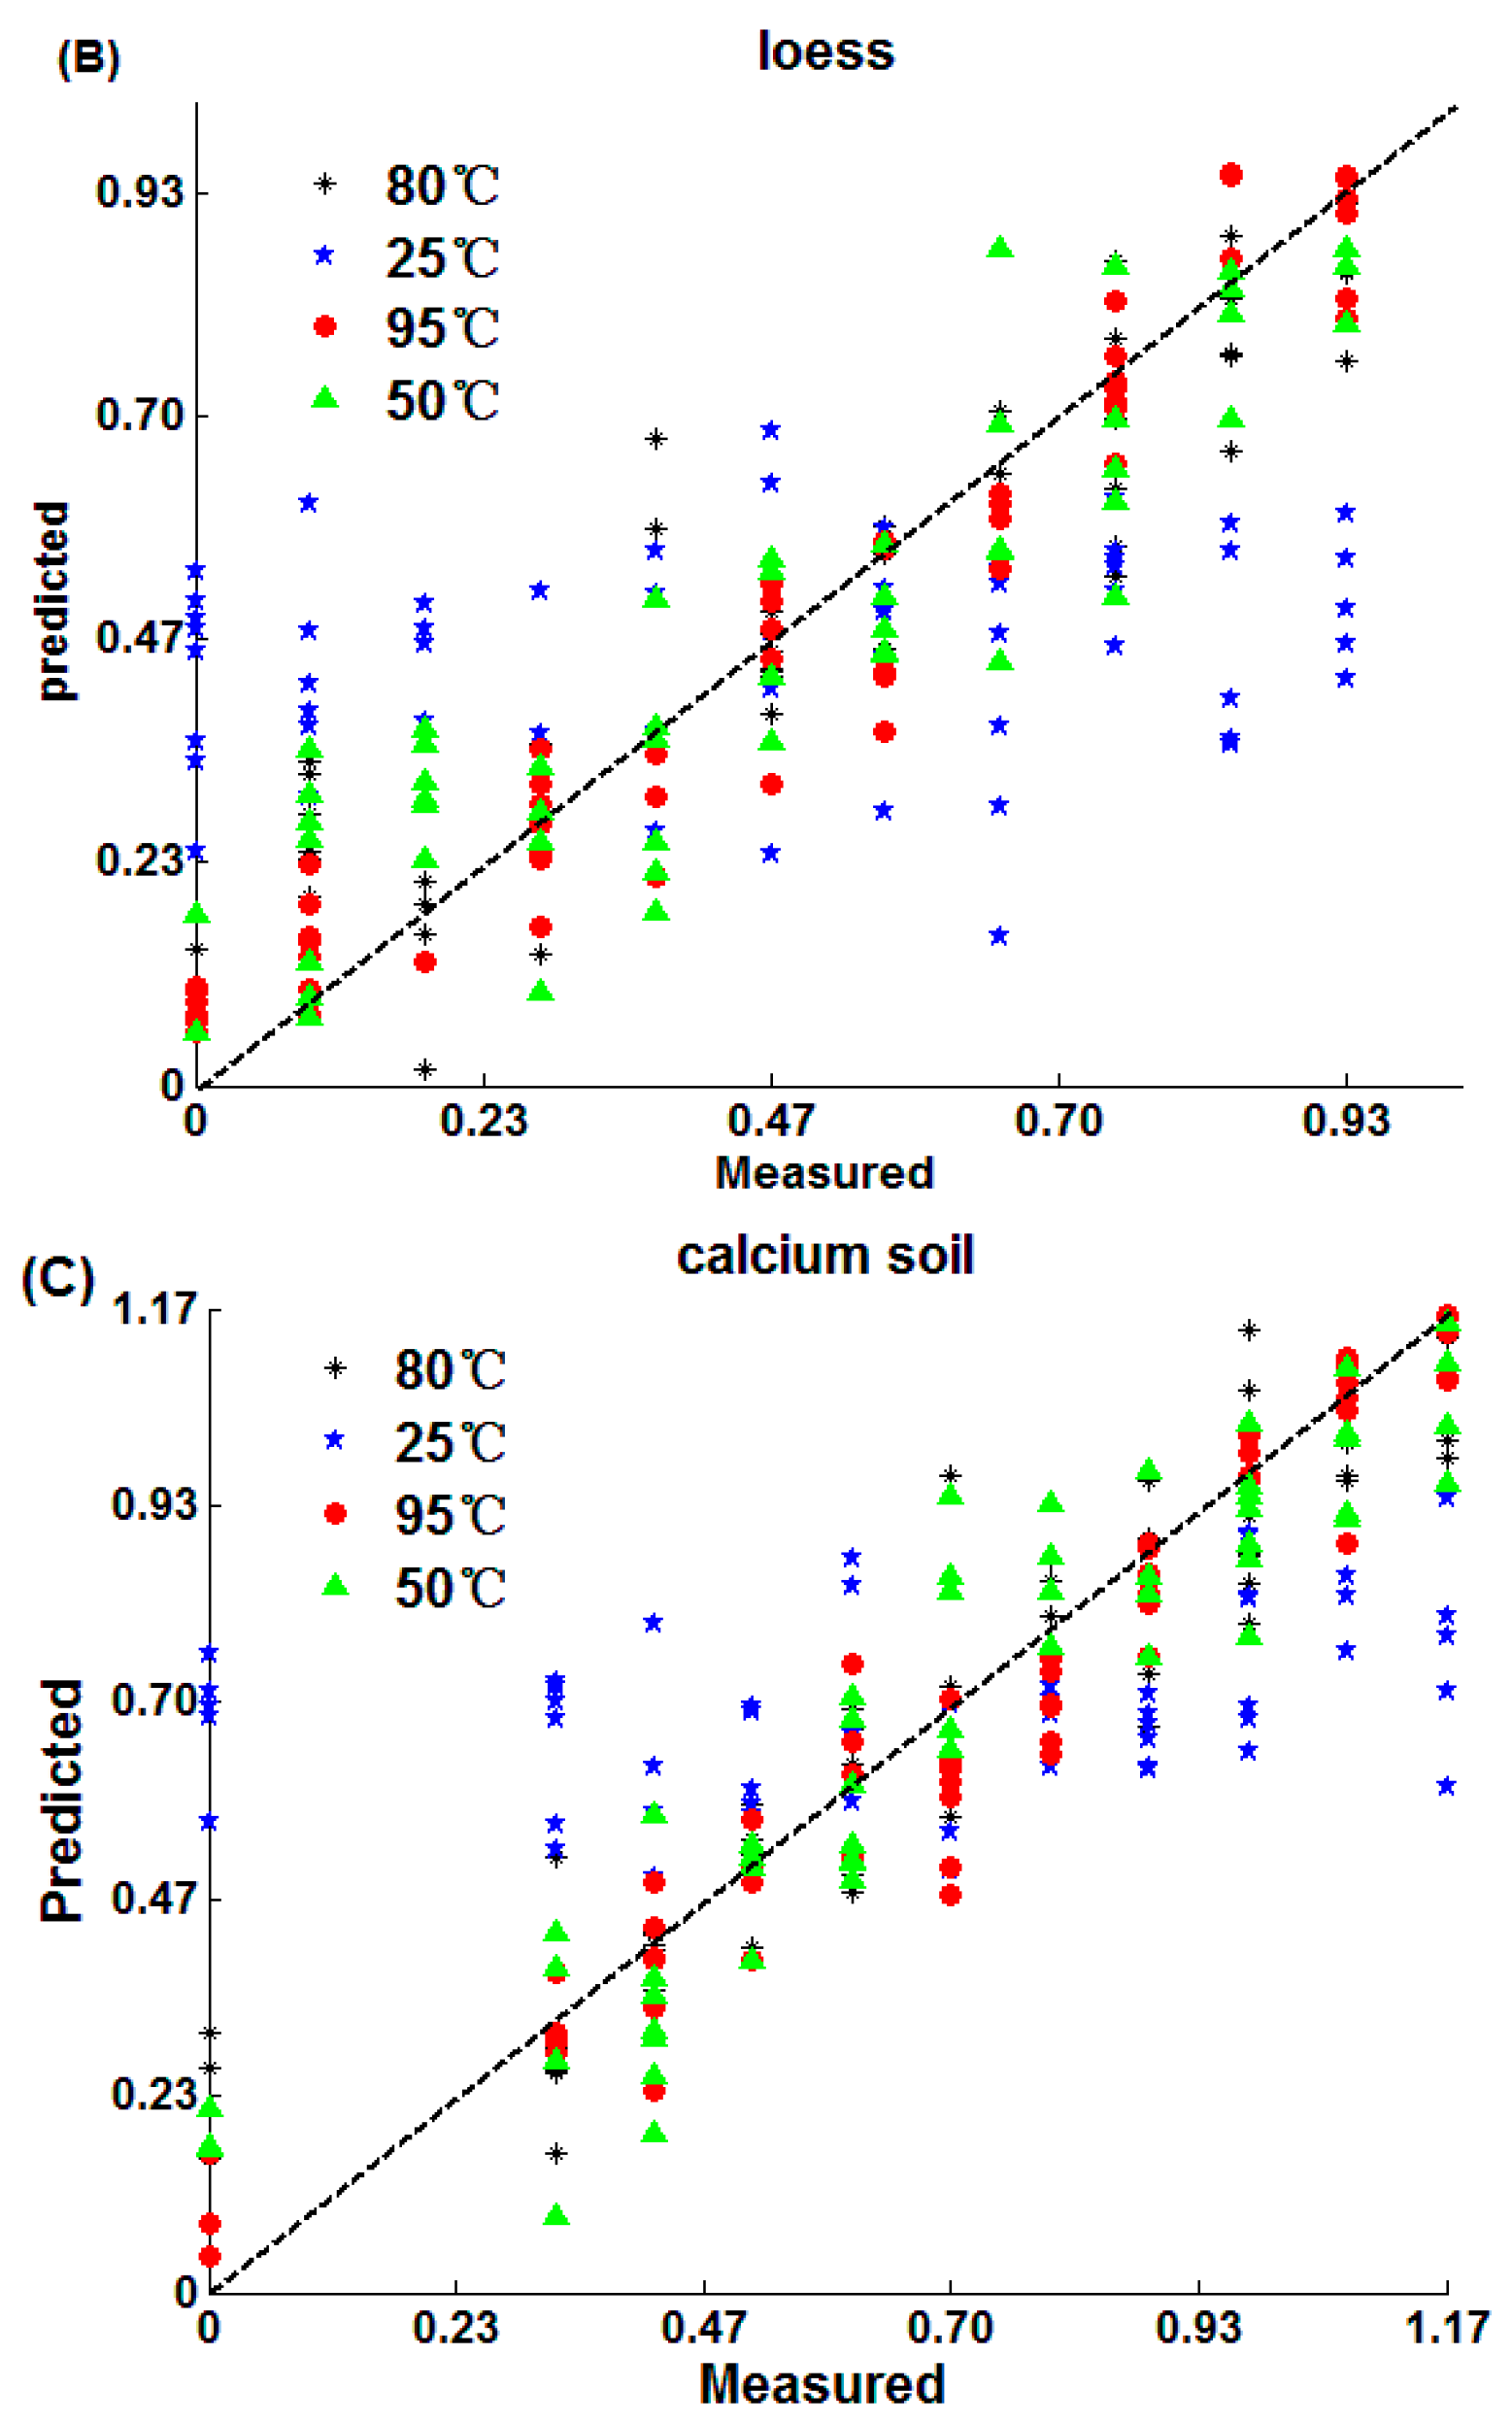
3.2.2. PLS Method Model

The prediction results of PLS are shown in Table 3 and Figure 5. The detection accuracy from high to low is loess, calcium soil and black soil, in that order. Moreover, both loess (RP = 0.9721, RMSEP = 0.067 g/kg, RPD = 4.34) and calcium soil (RP = 0.9588, RMSEP = 0.094 g/kg, RPD = 3.89) have the best detection accuracy after 95 °C drying. However, the black soil (RP = 0.9216, RMSEP = 0.228 g/kg, RPD = 2.72) after 50 °C drying achieves the best detection accuracy of black soil. Moreover, the results of PLS and SPA-MLR are similar, which indicates that medium and high temperatures are helpful for the soil nitrogen detection and the reasons have been discussed in Section 3.2.1.

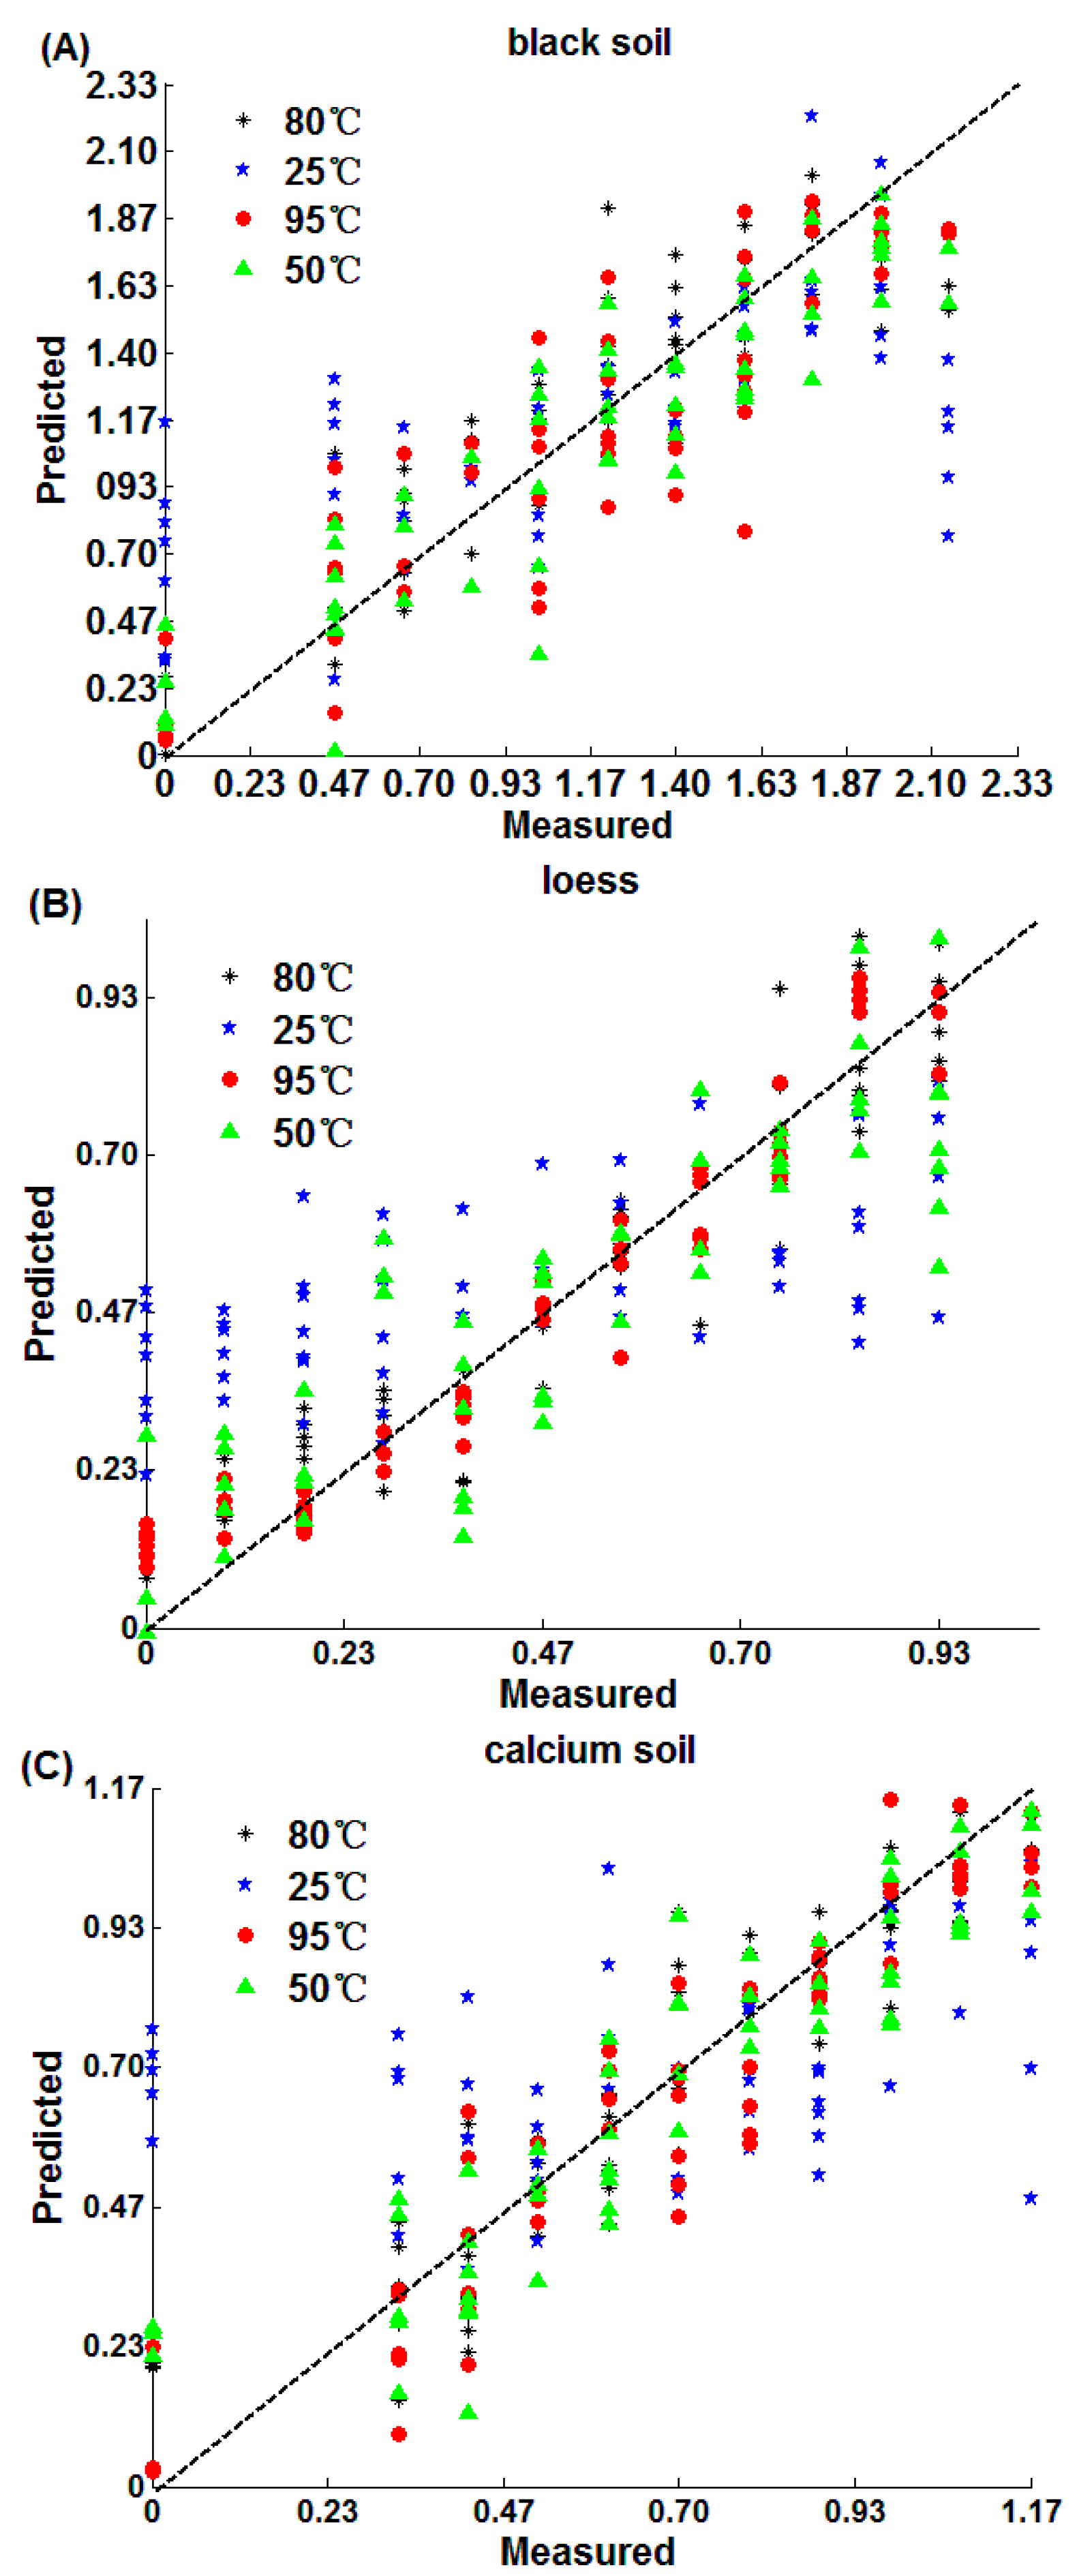
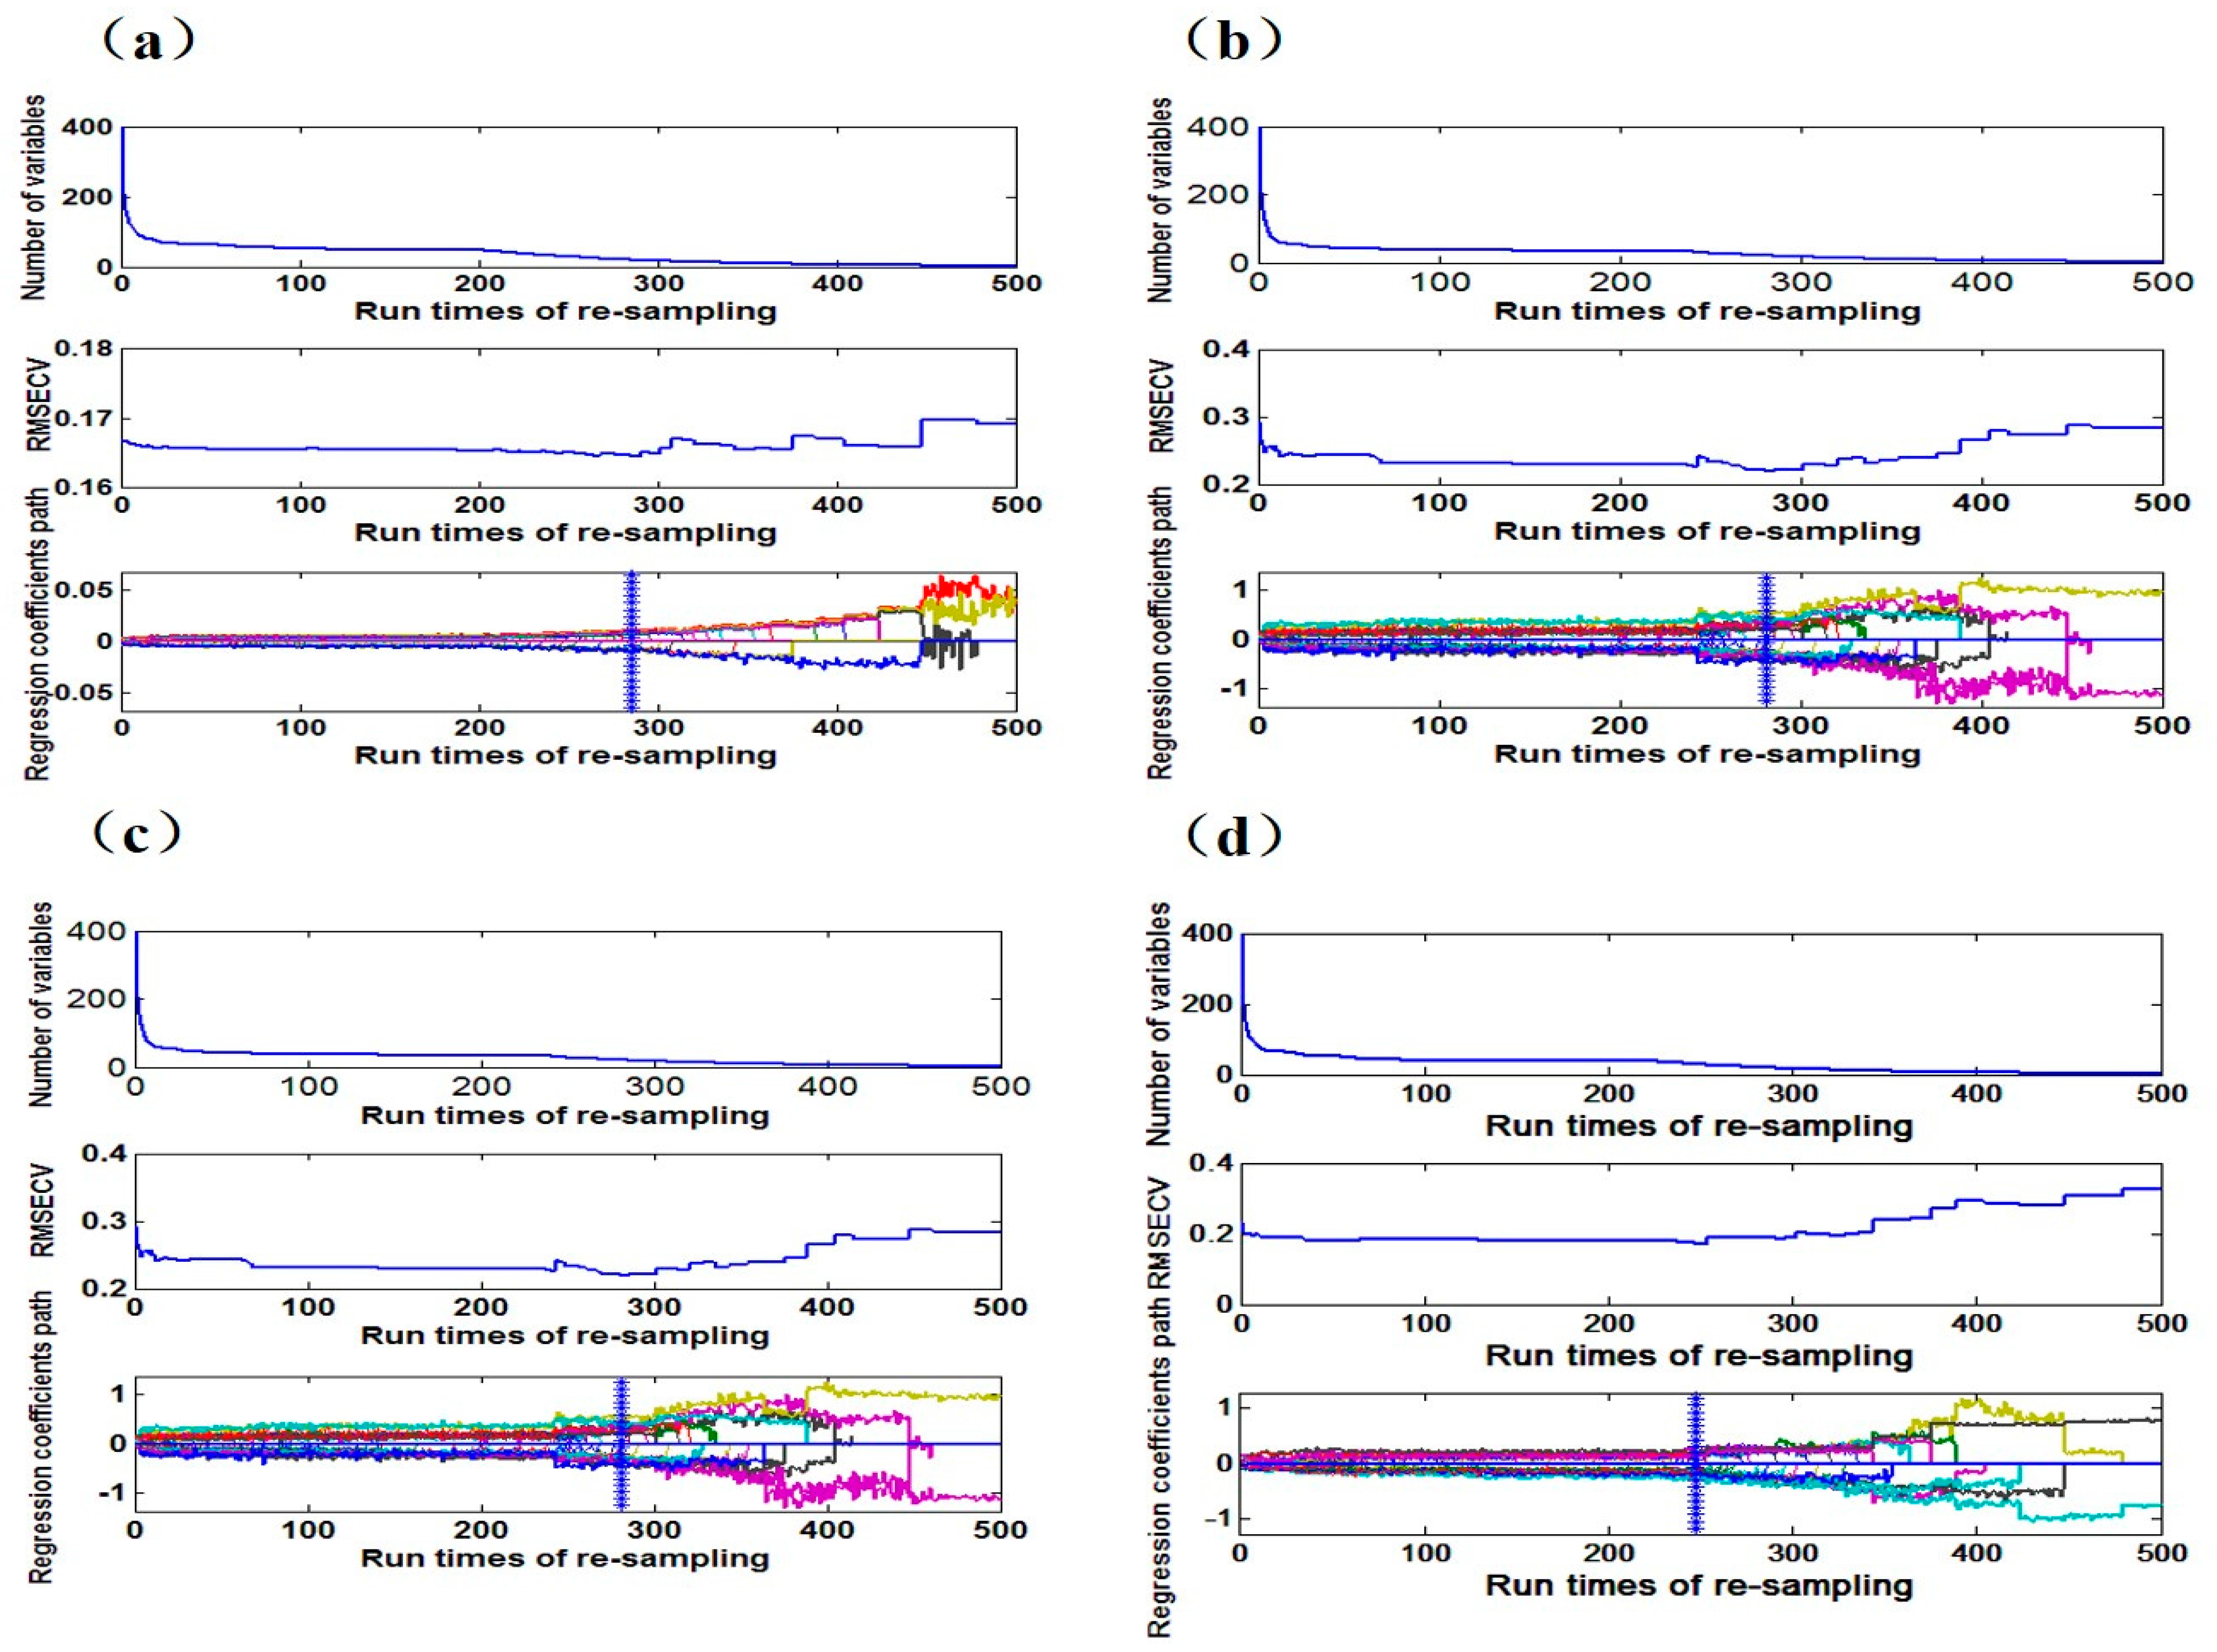
3.2.3. CARS Model Methods

The setting times of the CARS variable selection was 500, and the variable selection process are shown in Figure 6. Figure 6a–d show the variable selection process of loess after 50 °C, 80 °C and 95 °C drying and 25 °C placement, respectively. The number of final variable numbers and principal components are shown in Table 4. After the selection, the number of variables and bands differ in the same soil at different drying temperatures and the number of variables and bands in different soil types on the same drying temperature vary from each other as well, indicating that both soil type and soil drying temperature have a great influence on wavelength variables selected by CARS.
The prediction results of the CARS are shown in Figure 7 and Table 5. The results of nitrogen prediction of loess (RP = 0.9612, RMSEP = 0.079 g/kg, RPD = 3.92) and calcium soil (RP = 0.9472, RMSEP = 0.112 g/kg, RPD = 3.07) are the best after 95 °C drying. While the black nitrogen prediction was best after 80 °C drying. Also, the three kinds of soils have the worst effects when soils were placed at 25 °C. The results are similar to the SPA-MLR and PLS, which indicates that medium and high temperatures are beneficial to soil nitrogen detection and the reasons have been discussed in Section 3.2.1.

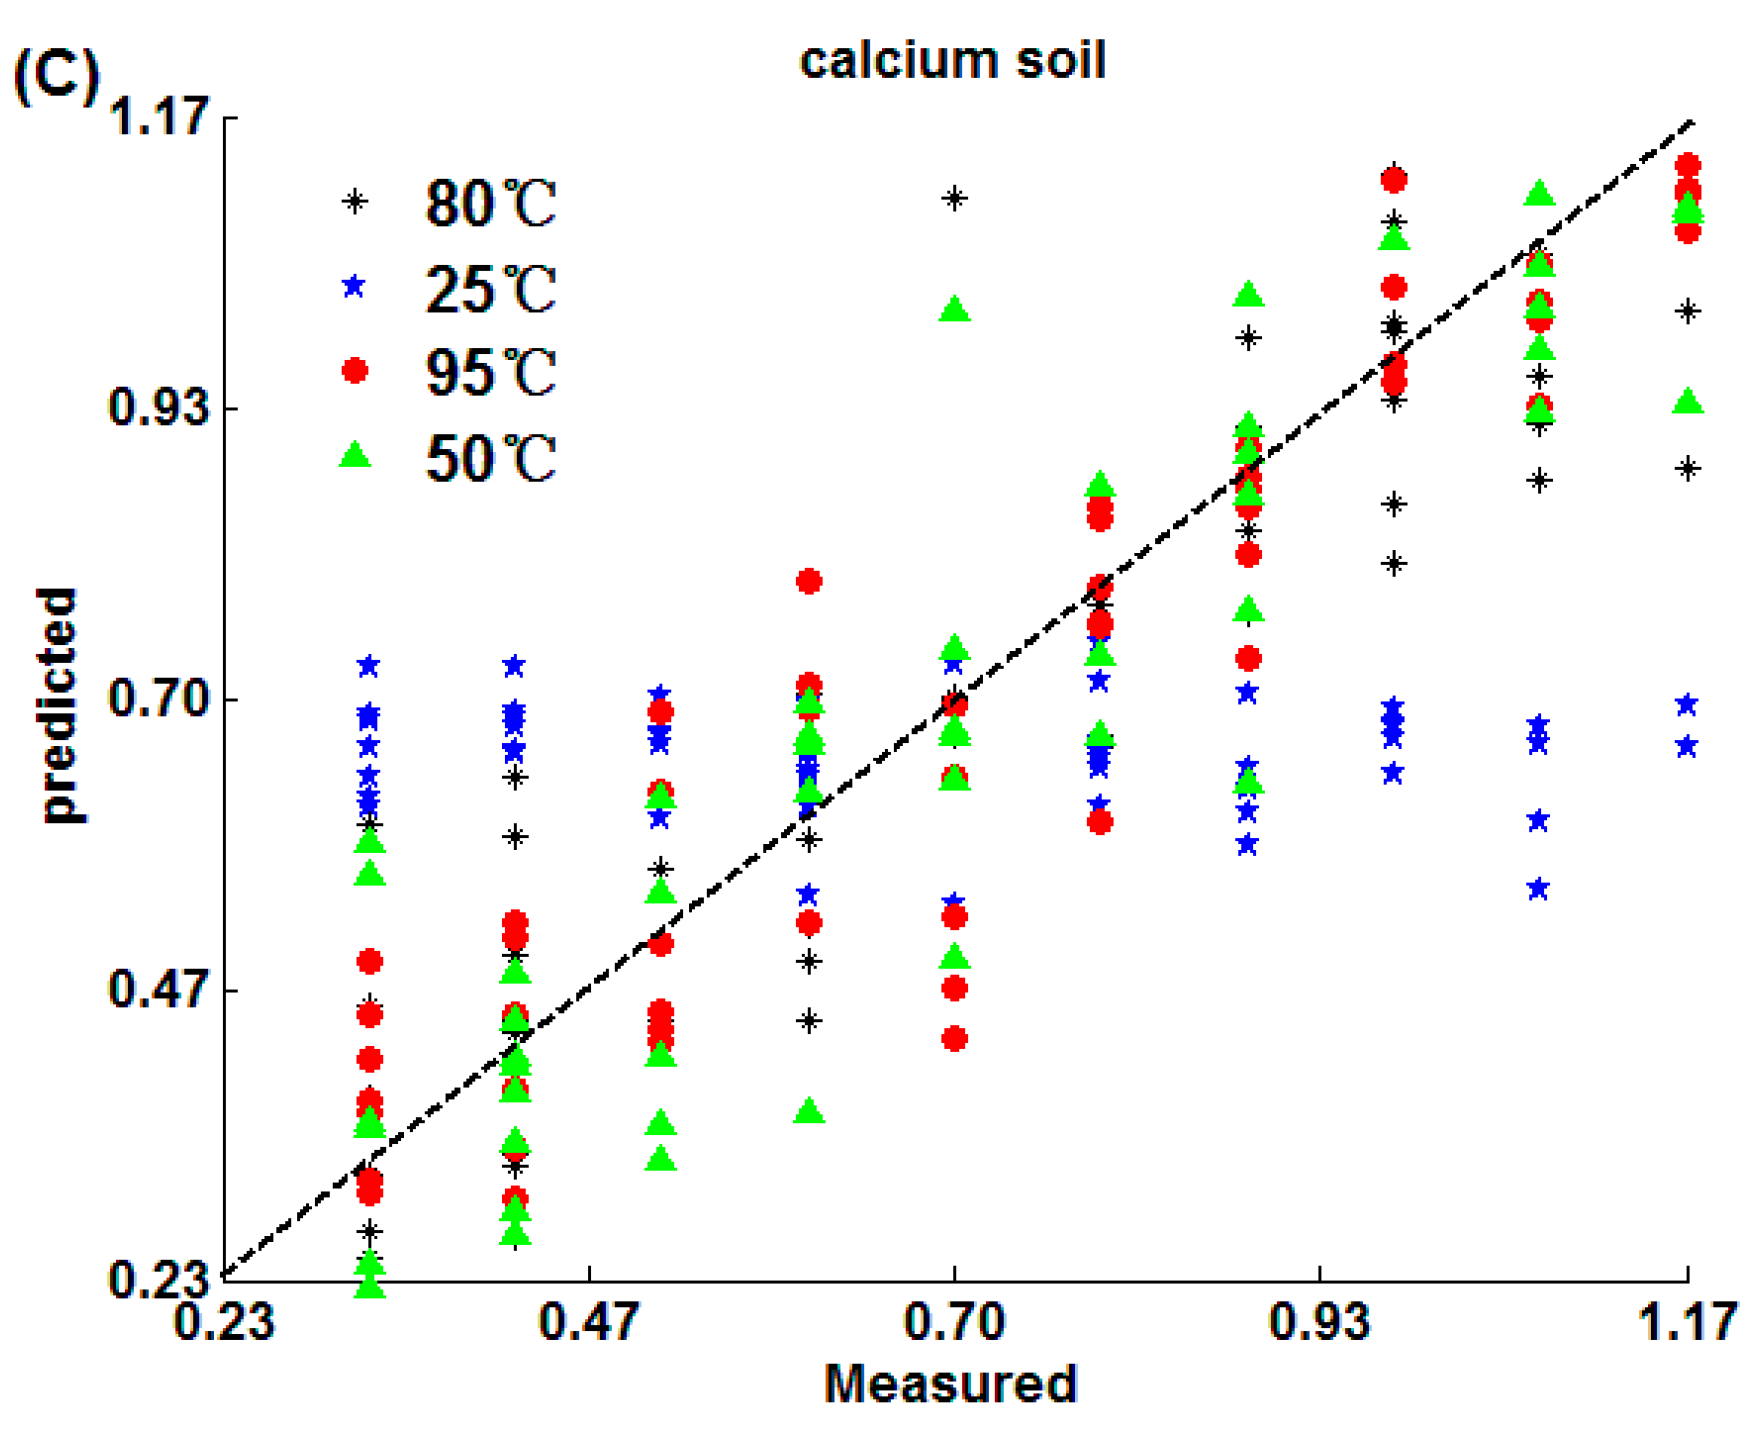
3.3. Analysis and Comparison of Results

Figure 8 shows the results of different models of three kinds of soils at different temperatures. First, the soil nitrogen detection effect ranking of loess and calcium soil was 95 °C, 80 °C, 50 °C and 25 °C, while in black soil, the effect of soil nitrogen detection was 50 °C, 80 °C, 95 °C and 25 °C, in that order.
This indicated that urease in soil was activated and the water content was easier to fully evaporate under medium and high drying temperatures, thus the detection effects were obviously better. However, the information of physical and chemical properties including iron oxides and particle size distribution were different in soil [43], which caused the different detection results when different soils were dried at the same temperature. Moreover, the prediction effects of black soil in 50 °C, 85 °C and 90 °C were worse than that of the loess and the calcium soil, but the results were better than those of other soils when soils were placed at 25 °C, which not only indicated that the physicochemical properties of the black soil caused the difference of the results, but also suggested that the little water preserved in the drying process had the least influence on the nitrogen detection in black soil than other soils.
Second, different algorithms had different effects on soil nitrogen detection based on the same temperature. The overall detection effect ranking from better to worse was SPA-MLR, PLS and CARS, and the prediction accuracy of SPA-MLR and PLS was similar. The reason might be that SPA-MLR could efficiently eliminate redundant variables, which made the results more accurate and the detection precision higher [39]. The comprehensive variables extracted by PLS performed well in summarizing the information of independent variables, explaining dependent variables and eliminating noise interference in the system, which effectively handled the variables multiple correlation problem [42]. In the CARS, it was difficult to find the best or optimal value of the noise threshold and select the randomness of the characteristic variables, which leaded to the poor prediction results [41].
Figure 9 shows the prediction effects of soils under different drying temperatures using different algorithms.
As can be seen from the Figure 9, no matter which algorithm was used, the prediction accuracy of black soil was better when the drying temperatures ranged from 50 °C to 80 °C. While the detection accuracy of loess and calcium soil nitrogen obtained better results when the temperatures were in the range of 80 °C to 90 °C.

4. Conclusions

In this paper, three kinds of soils were used to investigate the effects of drying temperature on soil nitrogen detection using near infrared sensors. The NIR spectra of different soils varied greatly and the spectra of the same soil type changed greatly under different drying temperatures.
The main conclusions are as follows: (1) The drying temperature does have an influence on soil nitrogen detection by near infrared sensors and the suitable drying temperatures for different soils were different, which indicated that it was necessary to find the suitable drying temperature for different soil types to enhance the detection accuracy; (2) the drying temperatures ranged from 50 °C to 80 °C for black soil nitrogen detection accuracy were better than other temperatures, while the loess and calcium soil nitrogen detection had better results when the drying temperature was 95 °C. The O–H bonds of water in soil might be the main factor influencing the prediction accuracy when soils were placed at 25 °C. Besides this, the suitable drying temperatures for more soil types should be further researched; (3) the SPA-MLR and PLS models obtained a better prediction effect for soils, while CARS performed worse. In conclusion, drying temperature had an obvious influence on the detection of soil nitrogen by near infrared sensors, and the suitable drying temperature for different soil types was of great significance in enhancing the detection accuracy.

Acknowledgments

This work is supported by National keypoint research and invention program of the thirteenth (2016YFD0700304) and Natural Science Foundations of China (Grant No. 61405175).

Author Contributions

This work presented here was carried out collaborations among all authors. Pengcheng Nie and Tao Dong conceived the idea. Pengcheng Nie, Tao Dong, Shupei Xiao worked together on associated data and carried out the experimental work. Pengcheng Nie and Tao Dong drafted the manuscript. Shupei Xiao and Yong He provided their experience and co-wrote the paper with Pengcheng Nie. All authors contributed, reviewed and improved the manuscript.

Conflicts of Interest

The authors declare no conflict of interest.

References

  1. Todorova, M.; Atanassova, S.; Lange, H.; Pavlov, D. Estimation of total N, total P, pH and electrical conductivity in soil by near-infrared reflectance sensors. Agric. Sci. Technol. 2011, 3, 50–54. [Google Scholar]
  2. Muñozhuerta, R.F.; Guevaragonzalez, R.G.; Contrerasmedina, L.M.; Torrespacheco, I.; Pradoolivarez, J.; Ocampovelazquez, R.V. A Review of Methods for Sensing the Nitrogen Status in Plants: Advantages, Disadvantages and Recent Advances. Sensors 2013, 13, 10823–10843. [Google Scholar] [CrossRef] [PubMed]
  3. Liu, Y.D.; Xiong, S.S.; Liu, D.L. Applications of near infrared reflectance sensors technique (NIRS) to soil attributes research. Sens. Spectr. Anal. 2014, 34, 2639–2644. [Google Scholar]
  4. Bevilacqua, M.; Bucci, R.; Materazzi, S.; Marini, F. Application of near infrared (NIR) sensors coupled to chemometrics for dried egg-pasta characterization and egg content quantification. Food Chem. 2013, 140, 726–734. [Google Scholar] [CrossRef] [PubMed]
  5. Filippi, J.J.; Belhassen, E.; Baldovini, N.; Brevard, H.; Meierhenrich, U.J. Qualitative and quantitative analysis of vetiver essential oils by comprehensive two-dimensional gas chromatography and comprehensive two-dimensional gas chromatography/mass spectrometry. J. Chromatogr. A 2013, 1288, 127–148. [Google Scholar] [CrossRef] [PubMed]
  6. Dalal, R.C. Simultaneous determination of moisture, organic carbon, and total nitrogen by near infrared reflectance spectrophotometry. Soil Sci. Soc. Am. J. 1986, 50, 120–123. [Google Scholar] [CrossRef]
  7. Lee, K.S.; Lee, D.H.; Sudduth, K.A.; Chung, S.O.; Kitchen, N.R.; Drummond, S.T. Wavelength identification and diffuse reflectance estimation for surface and profile soil properties. Trans. ASABE 2009, 52, 683–695. [Google Scholar] [CrossRef]
  8. Cen, Y.L.; Song, T.; He, Y.; Bao, Y.D. Rapid detection method of soil organic matter contents using visible/near infrared diffuse reflectance spectral data. J. Zhejiang Univ. 2011, 37, 300–306. [Google Scholar]
  9. He, Y.; Huang, M.; García, A.; Hernández, A.; Song, H. Prediction of soil macronutrients content using near-infrared sensors. Comput. Electron. Agric. 2007, 58, 144–153. [Google Scholar] [CrossRef]
  10. Stoner, E.R.; Baumgardner, M.F. Characteristic variations in reflectance of surface soils. Soil Sci. Soc. Am. J. 1981, 45, 1161–1165. [Google Scholar] [CrossRef]
  11. Ramirez-Lopez, L.; Behrens, T.; Schmidt, K.; Stevens, A.; Demattê, J.A.M.; Scholten, T. The spectrum-based learner: A new local approach for modeling soil vis–NIR spectra of complex datasets. Geoderma 2013, 195–196, 268–279. [Google Scholar] [CrossRef]
  12. Brunet, D.; Barthès, B.G.; Chotte, J.L.; Feller, C. Determination of carbon and nitrogen contents in alfisols, oxisols and ultisols from africa and brazil using NIRS analysis: Effects of sample grinding and set heterogeneity. Geoderma 2007, 139, 106–117. [Google Scholar] [CrossRef]
  13. Barthès, B.; Brunet, D.; Ferrer, H.; Chotte, J.L.; Feller, C. Determination of total carbon and nitrogen content in a range of tropical soils using near infrared sensors: Influence of replication and sample grinding and drying. J. Near Infrared Sens. 2006, 14, 341–348. [Google Scholar] [CrossRef]
  14. Hermamez, A.H.; He, Y.; Pereira, A.G. Non-destructive measurement of acidity, soluble solids and firmness of satsuma mandarin using Vis/NIR-sensors techniques. J. Food Eng. 2006, 77, 313–319. [Google Scholar]
  15. Nie, P.C.; Dong, T.; He, Y.; Qu, F.F. Detection of soil nitrogen using near infrared sensors based on soil pretreatment and algorithms. Sensors 2017, 17, 1102. [Google Scholar] [CrossRef] [PubMed]
  16. Cozzolino, D.; Morón, A. Potential of near-infrared reflectance sensors and chemometrics to predict soil organic carbon fractions. Soil Tillage Res. 2006, 85, 78–85. [Google Scholar] [CrossRef]
  17. Nocita, M.; Kooistra, L.; Bachmann, M.; Müller, A.; Powell, M.; Weel, S. Predictions of soil surface and topsoil organic carbon content through the use of laboratory and field sensors in the Albany Thicket Biome of Eastern Cape Province of South Africa. Geoderma 2011, 167, 295–302. [Google Scholar] [CrossRef] [Green Version]
  18. Nocita, M.; Stevens, A.; Noon, C.; Wesemael, B.V. Prediction of soil organic carbon for different levels of soil moisture using Vis-NIR sensors. Geoderma 2013, 199, 37–42. [Google Scholar] [CrossRef]
  19. Nocita, M.; Stevens, A.; Toth, G.; Panagos, P.; Wesemael, B.V.; Montanarella, L. Prediction of soil organic carbon content by diffuse reflectance sensors using a local partial least square regression approach. Soil Biol. Biochem. 2014, 68, 337–347. [Google Scholar] [CrossRef]
  20. Chen, S.K.; Subler, S.; Edwards, C.A. Effects of agricultural biostimulants on soil microbial activity and nitrogen dynamics. Appl. Soil Ecol. 2002, 19, 249–259. [Google Scholar] [CrossRef]
  21. Chen, S.K.; Edwards, C.A.; Subler, S. The influence of two agricultural biostimulants on nitrogen transformations, microbial activity, and plant growth in soil microcosms. Soil Biol. Biochem. 2003, 35, 9–19. [Google Scholar] [CrossRef]
  22. Cartes, P.; Jara, A.A.; Demanet, R.; de la Mora, M. Urease activity and nitrogen mineralization kinetics as affected by temperature and urea input rate in Southern Chilean Andisols. J. Soil Sci. Plant Nutr. 2009, 9, 69–82. [Google Scholar] [CrossRef]
  23. Fystro, G. The prediction of C and N content and their potential mineralisation in heterogeneous soil samples using Vis–NIR spectroscopy and comparative methods. Plant Soil 2002, 246, 139–149. [Google Scholar] [CrossRef]
  24. Bo, S. Effects of soil sample pretreatments and standardised rewetting as interacted with sand classes on Vis-NIR predictions of clay and soil organic carbon. Geoderma 2010, 158, 15–22. [Google Scholar]
  25. Mouazen, A.M.; Baerdemaeker, J.D.; Ramon, H. Towards development of on-line soil moisture content sensor using a fibre-type NIR spectrophotometer. Soil Tillage Res. 2005, 80, 171–183. [Google Scholar] [CrossRef]
  26. Kuang, B.; Mouazen, A.M. Non-biased prediction of soil organic carbon and inorganic nitrogen with Vis–NIR spectroscopy, as affected by soil moisture content and texture. Biosyst. Eng. 2013, 114, 249–258. [Google Scholar] [CrossRef] [Green Version]
  27. He, Y.; Xiao, S.; Nie, P.; Dong, T.; Qu, F.; Lin, L. Research on the optimum water content of detecting soil nitrogen using near infrared sensor. Sensors 2017, 17, 2045. [Google Scholar] [CrossRef] [PubMed]
  28. Tian, Y.; Zhang, J.; Yao, X.; Cao, W.; Zhu, Y. Laboratory assessment of three quantitative methods for estimating the organic matter content of soils in china based on visible/near-infrared reflectance spectra. Geoderma 2013, 202, 161–170. [Google Scholar] [CrossRef]
  29. Nduwamungu, C.; Ziadi, N.; Tremblay, G.F.; Parent, L.É. Near-infrared reflectance spectroscopy prediction of soil properties: Effects of sample cups and preparation. Soil Sci. Soc. Am. J. 2009, 73, 1896–1903. [Google Scholar] [CrossRef]
  30. Ntziachristos, V.; Bremer, C.; Weissleder, R. Fluorescence imaging with near-infrared light: New technological advances that enable in vivo molecular imaging. Eur. Radiol. 2003, 13, 195–208. [Google Scholar] [PubMed]
  31. Sarkhel, S.; Desiraju, G.R. N-H…O, O-H…O, and C-H…O hydrogen bonds in protein-ligand complexes: Strong and weak interactions in molecular recognition. Proteins 2004, 54, 247–259. [Google Scholar] [CrossRef] [PubMed]
  32. Fuwa, K.; Valle, B.L. The physical basis of analytical atomic absorption spectrometry. The pertinence of the beer-lambert law. Anal. Chem. 1963, 35, 942–946. [Google Scholar] [CrossRef]
  33. Zou, X.B.; Zhao, J.W.; Povey, M.J.; Holmes, M.; Mao, H.P. Variables selection methods in near-infrared spectroscopy. Anal. Chim. Acta 2010, 667, 14–32. [Google Scholar]
  34. Chen, J.; Jönsson, P.; Tamura, M.; Gu, Z.; Matsushita, B.; Eklundh, L. A simple method for reconstructing a high-quality NDVI time-series data set based on the Savitzky–Golay filter. Remote Sens. Environ. 2004, 91, 332–344. [Google Scholar] [CrossRef]
  35. Lindberg, W.; Persson, J.A.; Wold, S. Partial least-squares method for spectrofluorimetric analysis of mixtures of humic acid and lignin sulfonate. Anal. Chem. 1983, 55, 643–648. [Google Scholar] [CrossRef]
  36. Zhan, X.R.; Zhu, X.R.; Shi, X.Y.; Zhang, Z.Y.; Qiao, Y.J. Determination of hesperidin in tangerine leaf by near-infrared spectroscopy with SPXY algorithm for sample subset partitioning and Monte Carlo cross validation. Spectrosc. Spectr. Anal. 2009, 29, 964–968. [Google Scholar]
  37. Araújo, M.C.U.; Saldanha, T.C.B.; Galvão, R.K.H.; Yoneyama, T.; Chame, H.C.; Visani, V. The successive projections algorithm for variable selection in spectroscopic multicomponent analysis. Chemom. Intell. Lab. Syst. 2001, 57, 65–73. [Google Scholar] [CrossRef]
  38. Soares, S.F.C.; Galvão, R.K.H.; Araújo, M.C.U.; Silva, E.C.D.; Pereira, C.F.; Leite, F.C. A modification of the successive projections algorithm for spectral variable selection in the presence of unknown interferents. Anal. Chim. Acta 2011, 689, 22–28. [Google Scholar] [CrossRef] [PubMed]
  39. Diniz, P.H.G.D.; Gomes, A.A.; Pistonesi, M.F.; Band, B.S.F.; Araújo, M.C.U.D. Simultaneous classification of teas according to their varieties and geographical origins by using NIR sensors and SPA-LDA. Food Anal. Methods 2014, 7, 1712–1718. [Google Scholar]
  40. Yun, Y.H.; Wang, W.T.; Deng, B.C.; Lai, G.B.; Liu, X.B.; Ren, D.B.; Xu, Q.S. Using variable combination population analysis for variable selection in multivariate calibration. Anal. Chim. Acta 2015, 862, 14–23. [Google Scholar] [CrossRef] [PubMed]
  41. Krakowska, B.; Custers, D.; Deconinck, E.; Daszykowski, M. The Monte Carlo validation framework for the discriminant partial least squares model extended with variable selection methods applied to authenticity studies of Viagra® based on chromatographic impurity profiles. Analyst 2016, 141, 1060–1070. [Google Scholar] [CrossRef] [PubMed]
  42. D’Acqui, L.P.; Pucci, A.; Janik, L.J. Soil properties prediction of western mediterranean islands with similar climatic environments by means of mid-infrared diffuse reflectance spectroscopy. Eur. J. Soil Sci. 2010, 61, 865–876. [Google Scholar] [CrossRef]
  43. Sudduth, K.A.; Hummel, J.W. Soil Organic Matter, CEC, and Moisture Sensing with a Portable NIR Spectrophotometer. Trans. ASAE 1993, 36, 1571–1582. [Google Scholar]
  44. Libowitzky, E. Correlation of O-H stretching frequencies and O-H…O hydrogen bond lengths in minerals. Korrelation von O-H-Streckfrequenzen und O-R…O-Wasserstoffbrückenlängen in Mineralen. Monatshefte Für Chemie 1999, 130, 1047–1059. [Google Scholar]
  45. Dalton, D.A.; Evans, H.J.; Hanus, F.J. Stimulation by nickel of soil microbial urease activity and urease and hydrogenase activities in soybeans grown in a low-nickel soil. Plant Soil 1985, 88, 245–258. [Google Scholar] [CrossRef]
  46. Alahmadi, Y.J.; Gholami, A.; Fridgen, T.D. The protonated and sodiated dimers of proline studied by IRMPD spectroscopy in the N-H and O-H stretching region and computational methods. Phys. Chem. Chem. Phys. 2014, 16, 26855–26863. [Google Scholar] [CrossRef] [PubMed]
  47. Ketterings, Q.M.; Bigham, J.M. Soil color as an indicator of slash-and-burn fire severity and soil fertility in Sumatra, Indonesia. Soil Sci. Soc. Am. J. 2000, 64, 1826–1833. [Google Scholar] [CrossRef]
  48. Liu, D.; Wang, Z.; Zhang, B.; Song, K.; Li, X.; Li, J.; Li, F.; Duan, H. Spatial distribution of soil organic carbon and analysis of related factors in croplands of the black soil region, Northeast China. Agric. Ecosyst. Environ. 2006, 113, 73–81. [Google Scholar] [CrossRef]
  49. Knadel, M.; Deng, F.; Alinejadian, A.; Jonge, L.W.D.; Moldrup, P.; Greve, M.H. The effects of moisture conditions-from wet to hyper dry-on visible near-infrared spectra of Danish reference soils. Soil Sci. Soc. Am. J. 2014, 78, 422–433. [Google Scholar] [CrossRef]
Figure 1. Near infrared (NIR) spectrum soil detection platform.
Sensors 18 00391 g001
Figure 2. Near infrared spectra of three kinds of soils (A) 50 °C drying; (B) 80 °C drying; (C) 95 °C drying; (D) 25 °C placement. (a,d,g,j) are the black soil average spectrum at 50 °C, 80 °C, 95 °C drying and 25 °C placement respectively; (b,e,h,k) are the loess average spectrum at 50 °C, 80 °C, 95 °C drying and 25 °C placement respectively; (c,f,j,l) are the calcium soil average spectrum at 50 °C, 80 °C, 95 °C drying and 25 °C placement respectively.
Sensors 18 00391 g002aSensors 18 00391 g002b
Figure 3. The wavelength number of loess, calcium and black soil selected by SPA: (A) 50 °C drying; (B) 80 °C drying; (C) 95 °C drying; (D) 25 °C placement. (a,d,g,j) are the loess wavelength number at 50 °C, 80 °C, 95 °C drying and 25 °C placement respectively; (b,e,h,k) are the calcium wavelength number at 50 °C, 80 °C, 95 °C drying and 25 °C placement respectively; (c),(f),(j) and (l) are the black soil wavelength number at 50 °C, 80 °C, 95 °C drying and 25 °C placement respectively.
Sensors 18 00391 g003aSensors 18 00391 g003b
Figure 4. SPA-MLR algorithm prediction results: (A) black soil; (B) loess; (C) calcium soil.
Sensors 18 00391 g004aSensors 18 00391 g004b
Figure 5. The prediction effect by PLS: (A) black soil; (B) loess; (C) calcium soil.
Sensors 18 00391 g005aSensors 18 00391 g005b
Figure 6. The variable selection process by competitive adaptive reweighted squares (CARS): (a) 50 °C drying; (b) 80 °C drying; (c) 95 °C drying; (d) 25 °C placement.
Sensors 18 00391 g006
Figure 7. CARS prediction results: (A) black soil; (B) loess; (C) calcium soil.
Sensors 18 00391 g007
Figure 8. The prediction results of three kinds of soils at different drying temperatures based on three algorithms: (A) 50 °C drying; (B) 80 °C drying; (C) 95 °C drying; (D) 25 °C placement.
Sensors 18 00391 g008
Figure 9. Prediction results of three kinds of soil based on different temperatures algorithms: (A) black soil; (B) loess; (C) calcium soil.
Sensors 18 00391 g009
Table 1. Successive projections algorithm based on multiple linear regression (SPA-MLR) algorithm variable number and wavelength.
Soil TypeTemperatureVariable NumberWavelength (nm)
Loess50 °C15915, 1428, 1695, 1694, 1693, 1692, 1487, 1550, 1683, 1676, 1673, 1675, 1686, 1582, 1650
80 °C71160, 1660, 1582, 1682, 1675, 1489,1428
95 °C41160, 1428, 1675, 1486
25 °C41424, 1488, 1694, 1428
Calcium soil50 °C101651, 1154, 1438, 910,1301, 979, 1450, 1675, 1246, 1677
80 °C71651, 1675, 1678, 979, 1677, 1058, 1244
95 °C71552, 1675, 1487, 1491, 1673, 921, 1650
25 °C51651, 1675, 1146, 979, 1167
Black soil50 °C51423, 928, 1654, 1496, 1694
80 °C10928, 1654, 1681, 1682, 1694, 1496, 1423, 915, 1684, 1662
95 °C181650, 1680, 1682, 1694, 915, 1684, 1050, 1429, 1491, 1662, 928, 925, 910, 916, 918, 1662, 1675, 1690
25 °C51423, 925, 1681, 1496, 1694
Table 2. The modeling results of different soils and temperatures by SPA-MLR. RMSEC: root mean square error (RMSE) of the calibration set; RMSEP: RMSE of the prediction set; RPD: residual predictive deviation.
GroupSoil TypeCalibration SetPrediction Set
N1RcRMSEC (g/kg)N2RpRMSEP (g/kg)RPD
1 (50 °C)Black soil1180.97250.11580.94860.222.82
Loess1180.96490.072580.92650.132.34
Calcium soil1180.96810.039580.92900.1202.63
2 (80 °C)Black soil1180.92030.251580.93730.2342.55
Loess1180.97270.067580.95410.0903.20
Calcium soil1180.94920.108580.93200.1622.12
3 (95 °C)Black soil1180.96920.156580.91320.2822.16
Loess1180.96600.075580.97580.0704.35
Calcium soil1180.96700.087580.95170.1033.24
4 (25 °C)Black soil1180.60610.486580.71290.4181.25
Loess1180.54730.247580.62170.2461.20
Calcium soil1180.43910.302580.58240.3650.94
Table 3. The modeling results of different soil types and temperatures by partial least squares (PLS).
GroupSoil Type Calibration Set Prediction Set
N1RcRMSEC (g/kg)N2RpRMSEP (g/kg)RPD
1 (50 °C) Black soil1180.95250.198580.92160.2282.72
Loess1180.96090.077580.94660.1122.71
Calcium soil1180.98810.057580.92580.1282.69
2 (80 °C)Black soil1180.94170.216580.93680.2172.82
Loess1180.99350.033580.95680.0903.31
Calcium soil1180.91730.132580.93160.1192.75
3 (95 °C)Black soil1180.99060.086580.90650.2732.22
Loess1180.97390.066580.97210.0674.34
Calcium soil1180.92690.129580.95880.0943.89
4 (25 °C)Black soil1180.77730.391580.68490.4801.26
Loess1180.35070.267580.45290.2871.09
Calcium soil1180.53320.286580.55680.2581.34
Table 4. The selected variables and principal component number.
Soil TypeTemperatureSelected Variables NumberPrincipal Component Number
Loess50 °C205
80 °C406
95 °C193
25 °C293
Calcium soil50 °C183
80 °C265
95 °C205
25 °C143
Black soil50 °C215
80 °C115
95 °C426
25 °C325
Table 5. The modeling results of different soils and temperatures by CARS.
GroupSoil Type Calibration Set Prediction Set
N1RcRMSEC (g/kg)N2RpRMSEP (g/kg)RPD
1 (50 °C) Black soil1180.96250.163580.94160.1852.95
Loess1180.90090.1875580.89660.18851.61
Calcium soil1180.92810.1549580.89770.14142.43
2 (80 °C)Black soil1180.92050.25580.92880.2372.68
Loess1180.930.106580.94120.1052.90
Calcium soil1180.91170.136580.92580.1192.79
3 (95 °C)Black soil1180.97310.146580.90210.2772.24
Loess1180.96090.077580.96120.0793.92
Calcium soil1180.93810.118580.94720.1123.07
4 (25 °C)Black soil1180.54580.551580.57630.4761.31
Loess1180.56150.247580.38620.2651.15
Calcium soil1180.36980.322580.42410.3041.13

