Comparison between Electrocardiographic and Earlobe Pulse Photoplethysmographic Detection for Evaluating Heart Rate Variability in Healthy Subjects in Short- and Long-Term Recordings


Abstract
:
1. Introduction
2. Materials and Methods
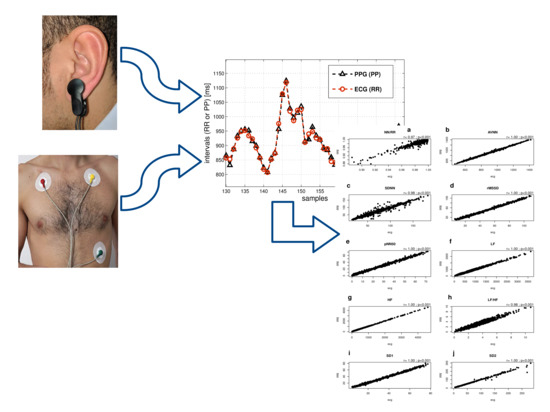
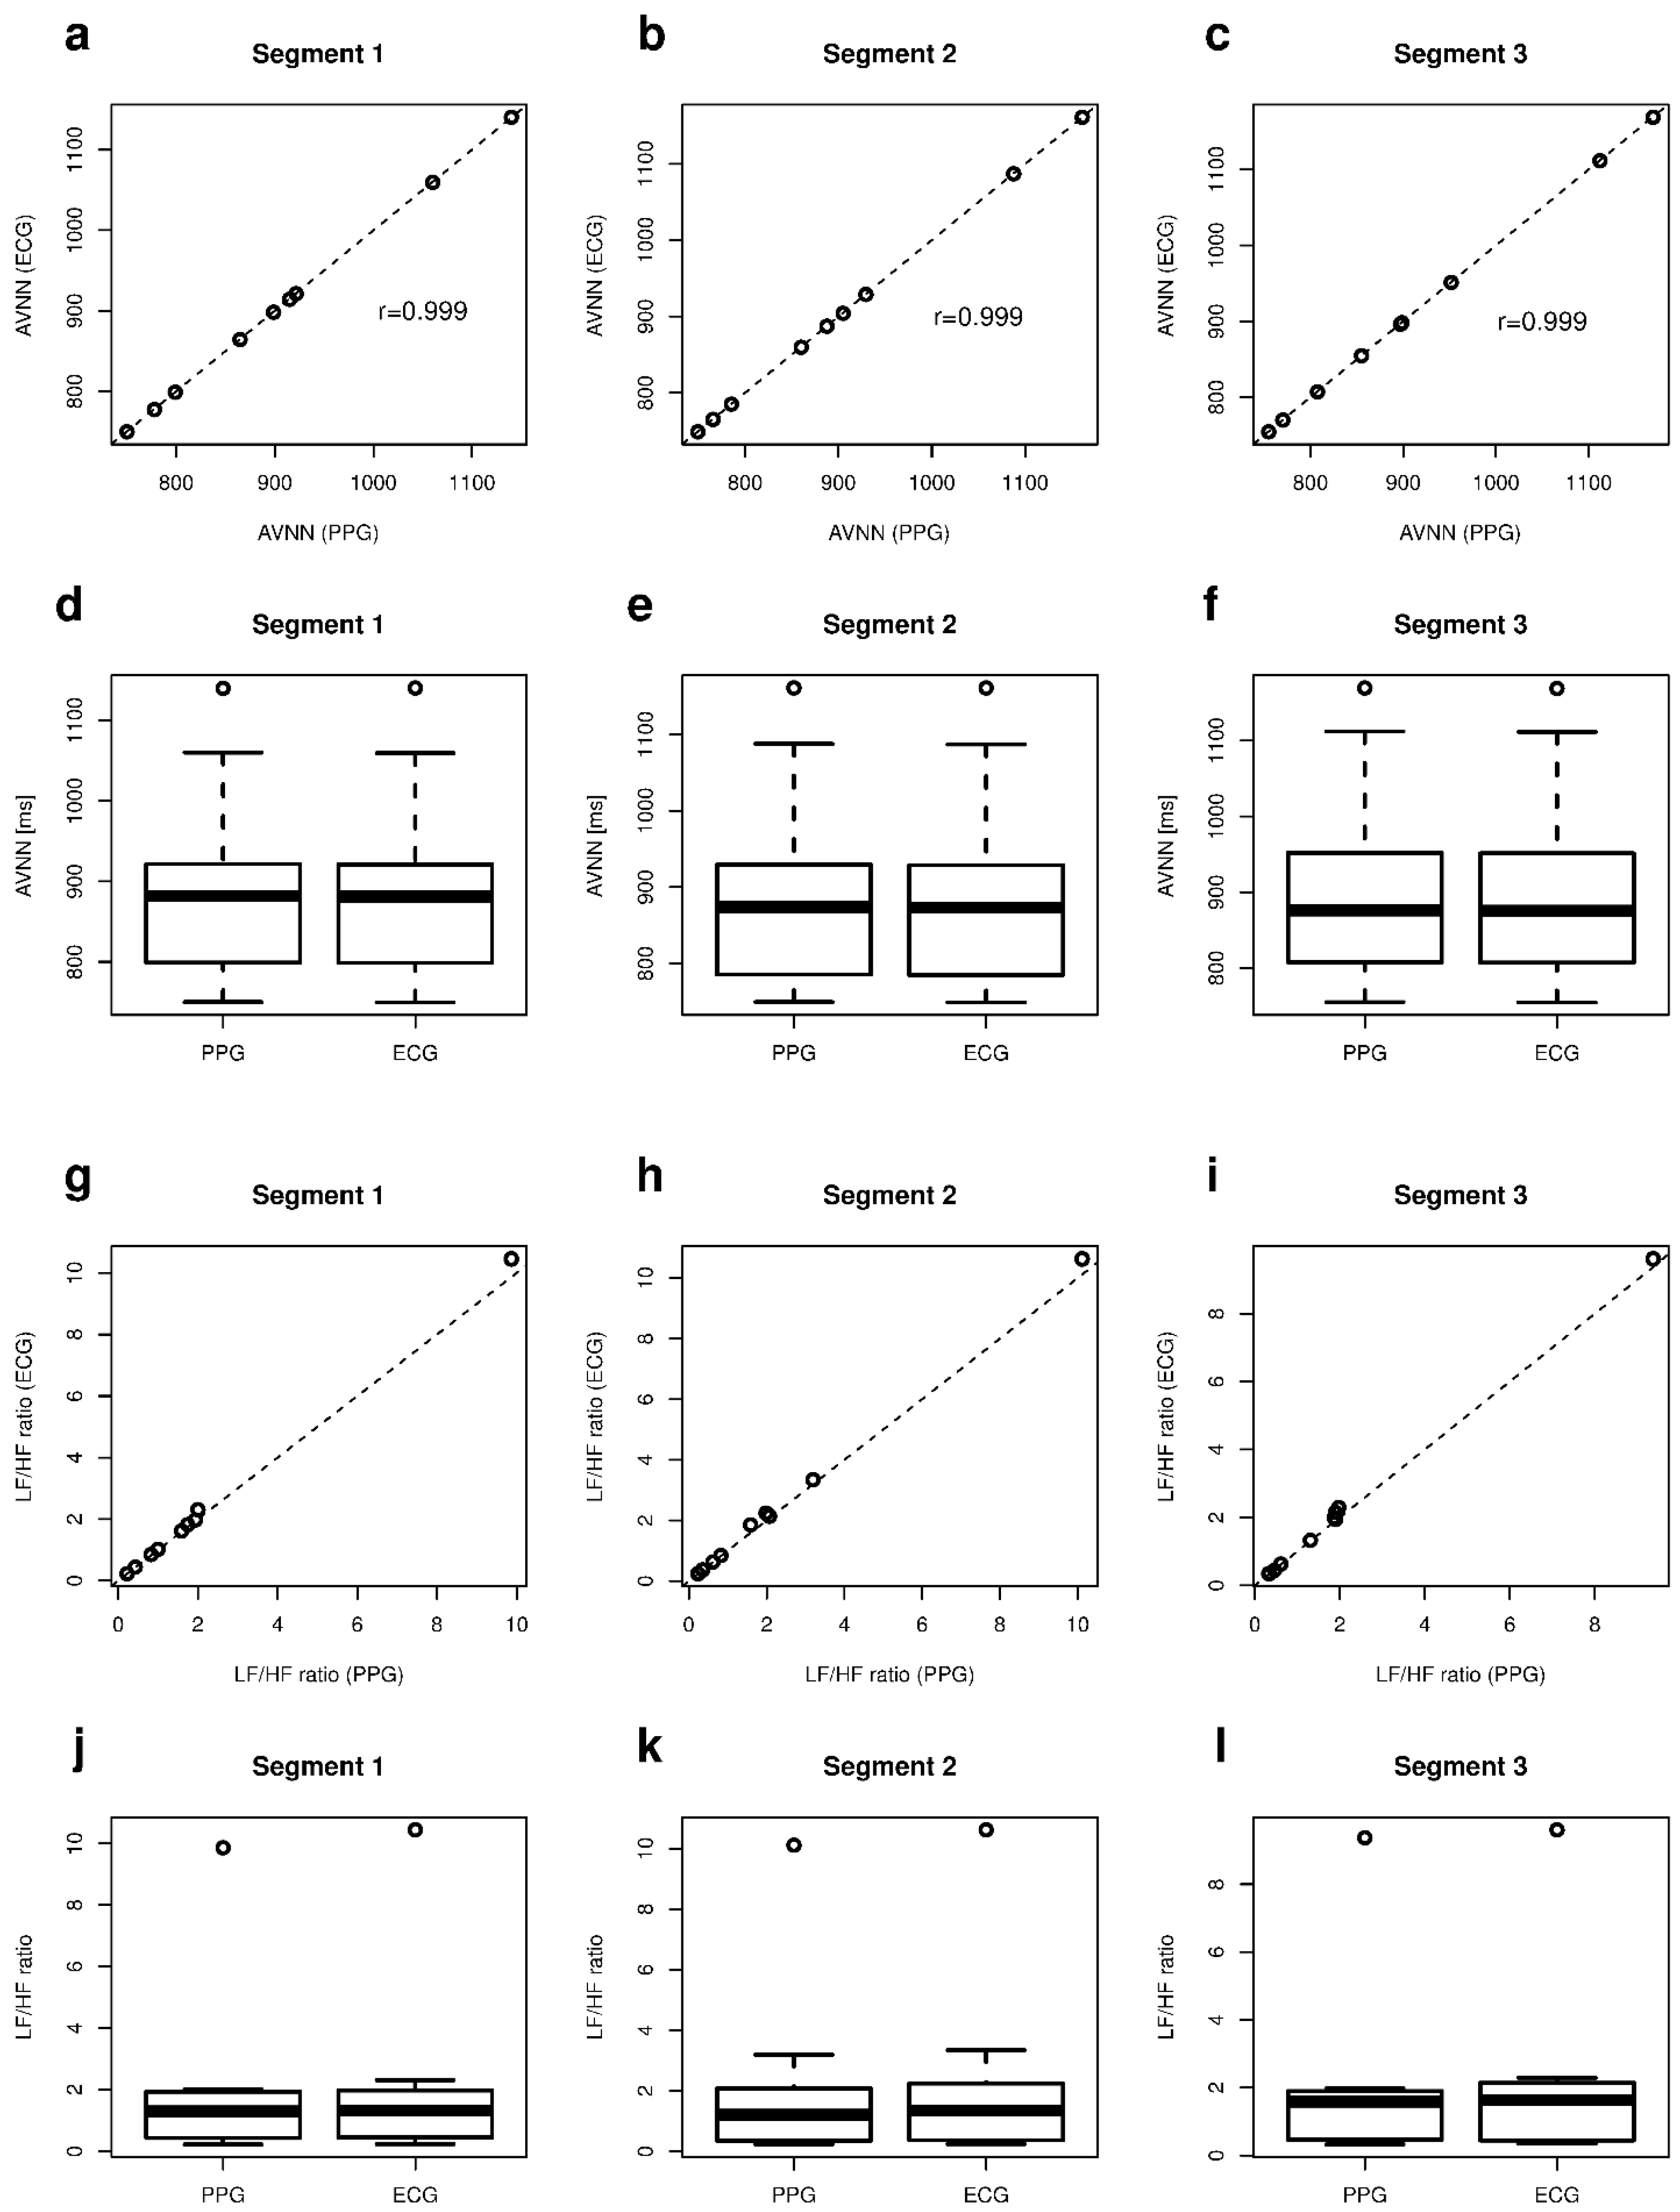
- AVNN: average of all NN intervals;
- SDNN: standard deviation of all NN intervals;
- rMSSD: square root of the mean of the squares of differences between adjacent NN intervals;
- pNN50: percentage differences between adjacent NN intervals greater than 50 ms;
- Low frequency (LF) power: the spectral power of all NN intervals between 0.04 and 0.15 Hz;
- High frequency (HF) power: the spectral power of all NN intervals between 0.15 and 0.4 Hz;
- LF/HF ratio: the ratio of low to high frequency power;
- SD1, SD2: dispersions (standard deviations) of points along orthogonal axes of a fitted ellipse on Poincaré maps. Poincaré plots are one of the most common techniques in nonlinear HRV analysis [6]. In a Poincaré diagram, each RR interval is plotted against the previous interval. Good quality RR signals produce plots with all data points clustered together. Corrupted RR signals will result in Poincaré maps with scattered data points [5].
3. Results
4. Discussion
5. Conclusions
Supplementary Materials
Author Contributions
Conflicts of Interest
References
- Task Force of the European Society of Cardiology and the North American Society of Pacing and Electrophysiology. Heart rate variability. Standards of measurement, physiological interpretation, and clinical use. Circulation 1996, 93, 1043–1065. [Google Scholar] [CrossRef]
- Tamura, T.; Maeda, Y.; Sekine, M.; Yoshida, M. Wearable Photoplethysmographic Sensors—Past and Present. Electronics 2014, 3, 282–302. [Google Scholar] [CrossRef]
- Lu, S.; Zhao, H.; Ju, K.; Shin, K.; Lee, M.; Shelley, K.; Chon, K.H. Can photoplethysmography variability serve as an alternative approach to obtain heart rate variability information? J. Clin. Monit. Comput. 2008, 22, 23–29. [Google Scholar] [CrossRef] [PubMed]
- Jeyhani, V.; Mahdiani, S.; Peltokangas, M.; Vehkaoja, A. Comparison of HRV parameters derived from photoplethysmography and electrocardiography signals. In Proceedings of the 37th Annual Conference of the IEEE Engineering in Medicine and Biology Society, Milan, Italy, 25–29 August 2015. [Google Scholar]
- Bolanos, M.; Nazeran, H.; Haltiwanger, E. Comparison of Heart Rate Variability Signal Features Derived from Electrocardiography and Photoplethysmography in Healthy Individuals. In Proceedings of the 28th Annual Conference of the IEEE Engineering in Medicine and Biology Society, New York, NY, USA, 30 August–3 September 2006. [Google Scholar]
- Selvaraj, N.; Jaryal, A.; Santhosh, J.; Deepak, K.K.; Anand, S. Assessment of heart rate variability derived from finger-tip photoplethysmography as compared to electrocardiography. J. Med. Eng. Technol. 2008, 32, 479–484. [Google Scholar] [CrossRef] [PubMed]
- Heart Rate Variability Analysis with the HRV Toolkit. Available online: https://www.physionet.org/tutorials/hrv-toolkit/ (accessed on 24 February 2018).
- Heathers, J.A.J. Everything Hertz: Methodological issues in short-term frequency-domain HRV. Front. Physiol. 2014, 5, 177. [Google Scholar] [CrossRef] [PubMed]
- Tarvainen, M.P.; Niskanen, J.P.; Lipponen, J.A.; Ranta-Aho, P.O.; Karjalainen, P.A. Kubios HRV—Heart rate variability analysis software. Comput. Methods Programs Biomed. 2014, 113, 210–220. [Google Scholar] [CrossRef] [PubMed]
- Kubios HRV (ver.3.0.2) User’s Guide. Available online: http://www.kubios.com/downloads/Kubios_HRV_Users_Guide.pdf (accessed on 24 February 2018).
- Goldberger, A.L.; Amaral, L.A.N.; Glass, L.; Hausdorff, J.M.; Ivanov, P.C.; Mark, R.G.; Mietus, J.E.; Moody, G.B.; Peng, C.K.; Stanley, H.E. PhysioBank, PhysioToolkit, and PhysioNet: Components of a New Research Resource for Complex Physiologic Signals. Circulation 2000, 101, e215–e220. [Google Scholar] [CrossRef] [PubMed]
- Weinschenk, S.W.; Beise, R.D.; Lorenz, J. Heart rate variability (HRV) in deep breathing tests and 5-min short-term recordings: Agreement of ear photoplethysmography with ECG measurements, in 343 subjects. Eur. J. Appl. Physiol. 2016, 116, 1527–1535. [Google Scholar] [CrossRef] [PubMed]
- Johnston, W.; Mendelson, Y. Extracting heart rate variability from a wearable reflectance pulse oximeter. In Proceedings of the IEEE 31st Annual Northeast Bioengineering Conference, Hoboken, NJ, USA, 2–3 April 2005. [Google Scholar]
- Murthy, V.S.; Ramamoorthy, S.; Srinivasan, N.; Rajagopal, S.; Rao, M.M. Analysis of photoplethysmographic signals of cardiovascular patients. In Proceedings of the 23rd Annual Conference of the IEEE Engineering in Medicine and Biology Society, Istanbul, Turkey, 25–28 October 2001. [Google Scholar]
- Teng, X.F.; Zhang, Y.T. Study on the peak interval variability of photoplethysmographic signals. In Proceedings of the IEEE EMBS Asian-Pacific Conference on Biomedical Engineering, Kyoto, Japan, 20–22 October 2003. [Google Scholar]
- Allen, J. Photoplethysmography and its application in clinical physiological measurement. Physiol. Meas. 2007, 28, R1–R39. [Google Scholar] [CrossRef] [PubMed]
- Gil, E.; Orini, M.; Bailòn, R.; Vergara, J.M.; Mainardi, L.; Laguna, P. Photoplethysmography pulse rate variability as a surrogate measurement of heart rate variability during non-stationary conditions. Physiol. Meas. 2010, 31, 1271–1290. [Google Scholar] [CrossRef] [PubMed]
- Lu, G.; Yang, F.; Taylor, J.A.; Stein, J.F. A comparison of photoplethysmography and ECG recording to analyse heart rate variability in healthy subjects. J. Med. Eng. Technol. 2009, 33, 634–641. [Google Scholar] [CrossRef] [PubMed]
- Schäfer, A.; Vagedes, J. How accurate is pulse rate variability as an estimate of heart rate variability? A review on studies comparing photoplethysmographic technology with an electrocardiogram. Int. J. Cardiol. 2013, 166, 15–29. [Google Scholar] [CrossRef] [PubMed]
- Vasconcellos, F.V.; Seabra, A.; Cunha, F.A.; Montenegro, R.A.; Bouskela, E.; Farinatti, P. Heart rate variability assessment with fingertip photoplethysmography and polar RS800cx as compared with electrocardiography in obese adolescents. Blood Press. Monit. 2015, 20, 351–660. [Google Scholar] [CrossRef] [PubMed]
- Chang, F.C.; Chang, C.K.; Chiu, C.C.; Hsu, S.F.; Lin, Y.D. Variations of HRV analysis in different approaches. In Proceedings of the IEEE Computers in Cardiology Conference, Durham, NC, USA, 30 September–3 October 2007. [Google Scholar]
- Constant, I.; Laude, D.; Murat, I.; Elghozi, J.L. Pulse rate variability is not a surrogate for heart rate variability. Clin. Sci. 1999, 97, 391–397. [Google Scholar] [CrossRef] [PubMed]
- Lu, G.; Yang, F. Limitations of Oximetry to Measure Heart Rate Variability Measures. Cardiovasc. Eng. 2009, 9, 119–125. [Google Scholar] [CrossRef] [PubMed]
- Wong, J.S.; Lu, W.A.; Wu, K.T.; Liu, M.; Chen, G.Y.; Kuo, C.D. A comparative study of pulse rate variability and heart rate variability in healthy subjects. J. Clin. Monit. Comput. 2012, 26, 107–114. [Google Scholar] [CrossRef] [PubMed]
- Zhang, X.Y.; Zhang, Y.T. The effect of local cold exposure on pulse transit time. In Proceedings of the 27th Annual Conference of the IEEE Engineering in Medicine and Biology Society, Shanghai, China, 17–18 January 2006. [Google Scholar]
- Renevey, P.; Sola, J.; Theurillat, P.; Bertschi, M.; Krauss, J.; Andries, D.; Sartori, C. Validation of a wrist monitor for accurate estimation of RR intervals during sleep. In Proceedings of the 35th Annual Conference of the IEEE Engineering in Medicine and Biology Society, Osaka, Japan, 3–7 July 2013. [Google Scholar]
- Bhowmik, T.; Dey, J.; Tiwari, V.N. A novel method for accurate estimation of HRV from smartwatch PPG signals. In Proceedings of the 39th Annual Conference of the IEEE Engineering in Medicine and Biology Society, Jeju Island, Korea, 11–15 July 2017. [Google Scholar]


| Segment 1 | Segment 2 | Segment 3 | |
|---|---|---|---|
| correlation coefficients | 0.996 ± 0.003 | 0.996 ± 0.003 | 0.996 ± 0.005 |
| RMSE [ms] | 4.405 ± 1.877 | 4.173 ± 1.604 | 4.331 ± 1.670 |
| Error% | Segment 1 | Segment 2 | Segment 3 |
|---|---|---|---|
| Mean ± std.dev. | Mean ± std.dev. | Mean ± std.dev. | |
| NN/RR ratio | 0.10 ± 0.16 | −0.01 ± 0.12 | −0.03 ± 0.09 |
| AVNN | 0.06 ± 0.04 | 0.06 ± 0.02 | 0.06 ± 0.02 |
| SDNN | 0.23 ± 0.57 | 0.16 ± 0.55 | 0.19 ± 0.88 |
| rMSSD | 0.23 ± 3.00 | 0.41 ± 3.15 | 0.27 ± 2.81 |
| pNN50 | 0.22 ± 9.98 | 6.05 ± 15.57 | 4.89 ± 12.85 |
| LF power | −0.76 ± 2.83 | −1.74 ± 2.74 | −0.86 ± 2.16 |
| HF power | 3.37 ± 5.64 | 3.82 ± 4.68 | 3.84 ± 5.56 |
| LF/HF ratio | −3.85 ± 3.55 | −5.22 ± 4.25 | −4.30 ± 5.21 |
| SD1 | −1.07 ± 2.58 | 0.44 ± 3.20 | 0.34 ± 2.72 |
| SD2 | −0.00 ± 0.41 | 0.06 ± 0.46 | 0.17 ± 0.39 |
| PPG, Mean ± std.dev. | Reference, Mean ± std.dev. | p Value | |
|---|---|---|---|
| Segment 1 | |||
| NN/RR ratio | 0.994 ± 0.007 | 0.993 ± 0.008 | 0.181 * |
| AVNN [ms] | 899.144 ± 122.069 | 898.662 ± 122.258 | 0.011 * |
| SDNN [ms] | 48.677 ± 19.09 | 48.576 ± 19.083 | 0.336 † |
| rMSSD [ms] | 37.753 ± 17.667 | 38.003 ± 18.768 | 0.569 † |
| pNN50 [%] | 17.44 ± 14.876 | 17.741 ± 15.345 | 0.29 † |
| LF power [ms2] | 654.396 ± 560.816 | 662.423 ± 576.355 | 0.378 † |
| HF power [ms2] | 746.437 ± 731.819 | 740.884 ± 745.707 | 0.381 † |
| LF/HF ratio | 1.984 ± 2.852 | 2.093 ± 3.028 | 0.002 |
| SD1 [ms] | 30.264 ± 16.947 | 30.89 ± 17.984 | 0.322 * |
| SD2 [ms] | 65.722 ± 28.181 | 65.792 ± 28.435 | 0.495 † |
| Segment 2 | |||
| NN/RR ratio | 0.996 ± 0.003 | 0.996 ± 0.003 | 1 * |
| AVNN [ms] | 899.109 ± 134.005 | 898.624 ± 134.072 | <0.001 † |
| SDNN [ms] | 47.964 ± 16.901 | 47.921 ± 16.997 | 0.601 † |
| rMSSD [ms] | 37.201 ± 17.662 | 37.377 ± 18.721 | 0.685 † |
| pNN50 [%] | 16.345 ± 14.372 | 16.139 ± 14.766 | 0.546 † |
| LF power [ms2] | 659.338 ± 556.892 | 672.83 ± 564.52 | 0.064 * |
| HF power [ms2] | 726.809 ± 811.377 | 717.345 ± 829.483 | 0.242 † |
| LF/HF ratio | 2.122 ± 2.974 | 2.252 ± 3.121 | 0.002 * |
| SD1 [ms] | 28.939 ± 16.707 | 29.169 ± 17.744 | 0.77 * |
| SD2 [ms] | 63.831 ± 23.963 | 63.851 ± 24.204 | 0.86 † |
| Segment 3 | |||
| NN/RR ratio | 0.996 ± 0.004 | 0.997 ± 0.003 | 1 * |
| AVNN [ms] | 907.195 ± 137.581 | 906.637 ± 137.495 | <0.001 † |
| SDNN [ms] | 52.471 ± 18.432 | 52.444 ± 18.698 | 0.863 † |
| rMSSD [ms] | 38.606 ± 16.339 | 38.737 ± 17.256 | 0.767 † |
| pNN50 [%] | 17.736 ± 13.687 | 17.371 ± 13.859 | 0.259 † |
| LF power [ms2] | 767.526 ± 583.003 | 774.654 ± 585.287 | 0.375 * |
| HF power [ms2] | 734.273 ± 657.889 | 728.607 ± 704.71 | 0.084 * |
| LF/HF ratio | 2.006 ± 2.682 | 2.106 ± 2.75 | 0.02 * |
| SD1 [ms] | 30.004 ± 15.936 | 30.181 ± 16.885 | 0.635 † |
| SD2 [ms] | 70.733 ± 26.226 | 70.653 ± 26.352 | 0.443 † |
| Segment 1 | Segment 2 | Segment 3 | |
|---|---|---|---|
| Coeff. (p Value) | Coeff. (p Value) | Coeff. (p Value) | |
| NN/RR ratio | 0.992 (<10−6) | 0.928 (0.0001) | 0.976 (10−6) |
| AVNN | 0.999 (<10−6) | 0.999 (<10−6) | 0.999 (<10−6) |
| SDNN | 0.999 (<10−6) | 0.999 (<10−6) | 0.999 (<10−6) |
| rMSSD | 0.999 (<10−6) | 0.999 (<10−6) | 0.998 (<10−6) |
| pNN50 | 0.999 (<10−6) | 0.998 (<10−6) | 0.998 (<10−6) |
| LF power | 0.999 (<10−6) | 0.999 (<10−6) | 0.999 (<10−6) |
| HF power | 0.999 (<10−6) | 0.999 (<10−6) | 0.999 (<10−6) |
| LF/HF ratio | 0.999 (<10−6) | 0.999 (<10−6) | 0.999 (<10−6) |
| SD1 | 0.999 (<10−6) | 0.999 (<10−6) | 0.999 (<10−6) |
| SD2 | 0.999 (<10−6) | 0.999 (<10−6) | 0.999 (<10−6) |
| No. = 10 Subjects | RMSE | Slope Test (H0: Slope = 1) | Coefficient of Agreement |
|---|---|---|---|
| Mean ± std. | p Value | ||
| RR values | 5.80 ± 1.06 | 0.514 | 0.014 |
| NN/RR ratio | 0.004 ± 0.0005 | 0.088 | 0.008 |
| AVNN | 8.21 ± 0.53 | 0.243 | 0.019 |
| SDNN | 6.42 ± 0.46 | <0.001 | 0.173 |
| rMSSD | 2.01 ± 0.13 | <0.001 | 0.088 |
| pNN50 | 1.46 ± 0.11 | <0.001 | 0.174 |
| LF power | 120.33 ± 10.83 | 0.098 | 0.138 |
| HF power | 109.14 ± 21.31 | 0.085 | 0.111 |
| LF/HF ratio | 0.60 ± 0.17 | <0.001 | 0.259 |
| SD1 | 1.46 ± 0.08 | <0.001 | 0.091 |
| SD2 | 4.51 ± 2.88 | <0.001 | 0.171 |
© 2018 by the authors. Licensee MDPI, Basel, Switzerland. This article is an open access article distributed under the terms and conditions of the Creative Commons Attribution (CC BY) license (http://creativecommons.org/licenses/by/4.0/).
Share and Cite
Vescio, B.; Salsone, M.; Gambardella, A.; Quattrone, A. Comparison between Electrocardiographic and Earlobe Pulse Photoplethysmographic Detection for Evaluating Heart Rate Variability in Healthy Subjects in Short- and Long-Term Recordings. Sensors 2018, 18, 844. https://doi.org/10.3390/s18030844
Vescio B, Salsone M, Gambardella A, Quattrone A. Comparison between Electrocardiographic and Earlobe Pulse Photoplethysmographic Detection for Evaluating Heart Rate Variability in Healthy Subjects in Short- and Long-Term Recordings. Sensors. 2018; 18(3):844. https://doi.org/10.3390/s18030844
Chicago/Turabian StyleVescio, Basilio, Maria Salsone, Antonio Gambardella, and Aldo Quattrone. 2018. "Comparison between Electrocardiographic and Earlobe Pulse Photoplethysmographic Detection for Evaluating Heart Rate Variability in Healthy Subjects in Short- and Long-Term Recordings" Sensors 18, no. 3: 844. https://doi.org/10.3390/s18030844