Article

Social Sentiment Sensor in Twitter for Predicting Cyber-Attacks Using 1 Regularization

by
Aldo Hernandez-Suarez
1,
Gabriel Sanchez-Perez
1,
Karina Toscano-Medina
1,
Victor Martinez-Hernandez
1,
Hector Perez-Meana
1,*,
Jesus Olivares-Mercado
1 and
Victor Sanchez
2
1
Instituto Politecnico Nacional, ESIME Culhuacan, Mexico City 04440, Mexico
2
Department of Computer Science, University of Warwick, Coventry CV4 7AL, UK
*
Author to whom correspondence should be addressed.
Sensors 2018, 18(5), 1380; https://doi.org/10.3390/s18051380
Submission received: 29 March 2018 / Revised: 20 April 2018 / Accepted: 26 April 2018 / Published: 29 April 2018
(This article belongs to the Special Issue Social Sensing)

Abstract

:
In recent years, online social media information has been the subject of study in several data science fields due to its impact on users as a communication and expression channel. Data gathered from online platforms such as Twitter has the potential to facilitate research over social phenomena based on sentiment analysis, which usually employs Natural Language Processing and Machine Learning techniques to interpret sentimental tendencies related to users’ opinions and make predictions about real events. Cyber-attacks are not isolated from opinion subjectivity on online social networks. Various security attacks are performed by hacker activists motivated by reactions from polemic social events. In this paper, a methodology for tracking social data that can trigger cyber-attacks is developed. Our main contribution lies in the monthly prediction of tweets with content related to security attacks and the incidents detected based on 1 regularization.

1. Introduction

Online Social Networks (OSNs) are platforms designed as communication channels for information exchange in real time. These platforms may generate over 1 billon posts per month around the world. For example, Twitter statistics [1,2] report the generation of 313 million posts monthly, better known as tweets, over different countries.
Different topics in Twitter may reflect polarized opinions from celebrities, corporations, and regular users about daily life aspects [3], some of them with well defined geographic embedded data (e.g., assisted GPS coordinates). Streams of tweets generate valuable information that can be modeled as a social sentiment sensor for real-world event prediction [4] by analyzing clustered topics, such as in rumour spreading analysis [5], human mobility sensing [6], spam & botnet detection [7], and disaster response [8].
Within the context of cyber-security, the large volumes of data that can be collected over different time intervals from Twitter have the potential to facilitate the understanding of the motivation behind cyber-attacks by sentiment analysis of tweets. Specifically, any underlying correlation among the sentimental polarity of various groups of Twitter users can be interpreted by probabilistic and classification models [9], whose results are predictive by nature and can be used as a social behavior warning tool. For example, in [10], an early warning process related to abnormal behavior is developed relating intrusion techniques and terrorist attacks.
Regional language and lexical variations derived from tweets are key factors in searching patterns related to sentimental tendencies. Natural language processing has shown that negative-oriented textual features [11] related to information security lexicons used by hacktivists groups can be used as warning alarms to mitigate possible cyber-attacks. Therefore, important political, religious, and cultural events can serve as targets for data extraction in Twitter to predict such attacks [12].
This paper focuses on sentiment analysis extracted from tweets, which are processed with probabilistic techniques [13] in order to measure the correlation between the sentiment of user groups and possible cyber-attacks. Specifically, we propose a methodology for predicting possible cyber-attacks based on scraping and classifying Twitter data. This is done by employing a supervised learning algorithm [14,15,16,17] on a daily corpora of tweets. The methodology classifies tweets in order to obtain monthly sentimental scores that are fitted into an 1 regression algorithm to predict potential cyber-attacks.
Although current advances on information security have improved the trust on information handling mechanisms by means of e.g., cryptographic and data protection algorithms [18,19,20], cyber-attacks are still an important issue to tackle. Our methodology has the potential to aide in the prevention of cyber-attacks based on sentiment analysis of tweets.
The rest of the paper is organized as follows. Section 2 provides a review of the related work. Section 3 describes the proposed methodology. Section 4 describes the data gathering and pre-processing mechanisms used. Section 5, Section 6 and Section 7 detail the supervised classification used in this work. Section 8 describes the statistical analysis. Section 9 provides the experimental results. Finally, Section 10 concludes this work.

2. Related Work

According to [21], cyber-attacks are increasing as a result of global insurgency given geopolitical contexts. These attacks pose major concerns due to their potential effects on denial-of-service, data leaking, and application compromising. Alternative security measures, like forecasting threatening security events, are thus gaining credibility.
Data from OSNs are useful for extending capabilities from intrusion detection systems (IDSs) and intrusion prevention systems (IPSs) from outer-level networks. In [22], a Latent Dirichlet Allocation (LDA)-based model is proposed to discover semantically related concepts to analyze cyber-crime forensics. More recently, a bipartite and monopartite network analysis is achieved by crawling hackers forums to identify members by specific malicious tool usage [23]. A list of anti-threat strategies is proposed in [24] to prevent and visualize common practices regarding privacy, spamming and malicious attacks. In [25], the authors present a relationship of social unrest between countries and directed cyber-attacks. These works prove that Arbor Network data are useful to determine if attacks such as Distributed Denial-of-Service (DDoS) attacks are expected to grow if radical or extremist sentiments from users are perceived in streams of OSN posts.
Predictive analysis is particularly advantageous in Twitter due to the fact that certain functionalities, such as retweets, favorites, and replies, can be characterized and, together with the polarity of the text, can provide data that increase the forecasting of events such as political elections and product outcomes [26]. According to [27], the predictive power of social networks can be exploited by the inspection of published data and statistical modelling, which may result in the detection of a statistical relationship between a social media-based measure (e.g., number of re-tweets or sentiment analysis scores) and the outcome of interest (e.g., economic growth or presidential approval rates). For example, in [28], an 1 regularized regression model is presented in order to predict influenza-like illness by training data from Twitter and comparing outcomes with official health reports.

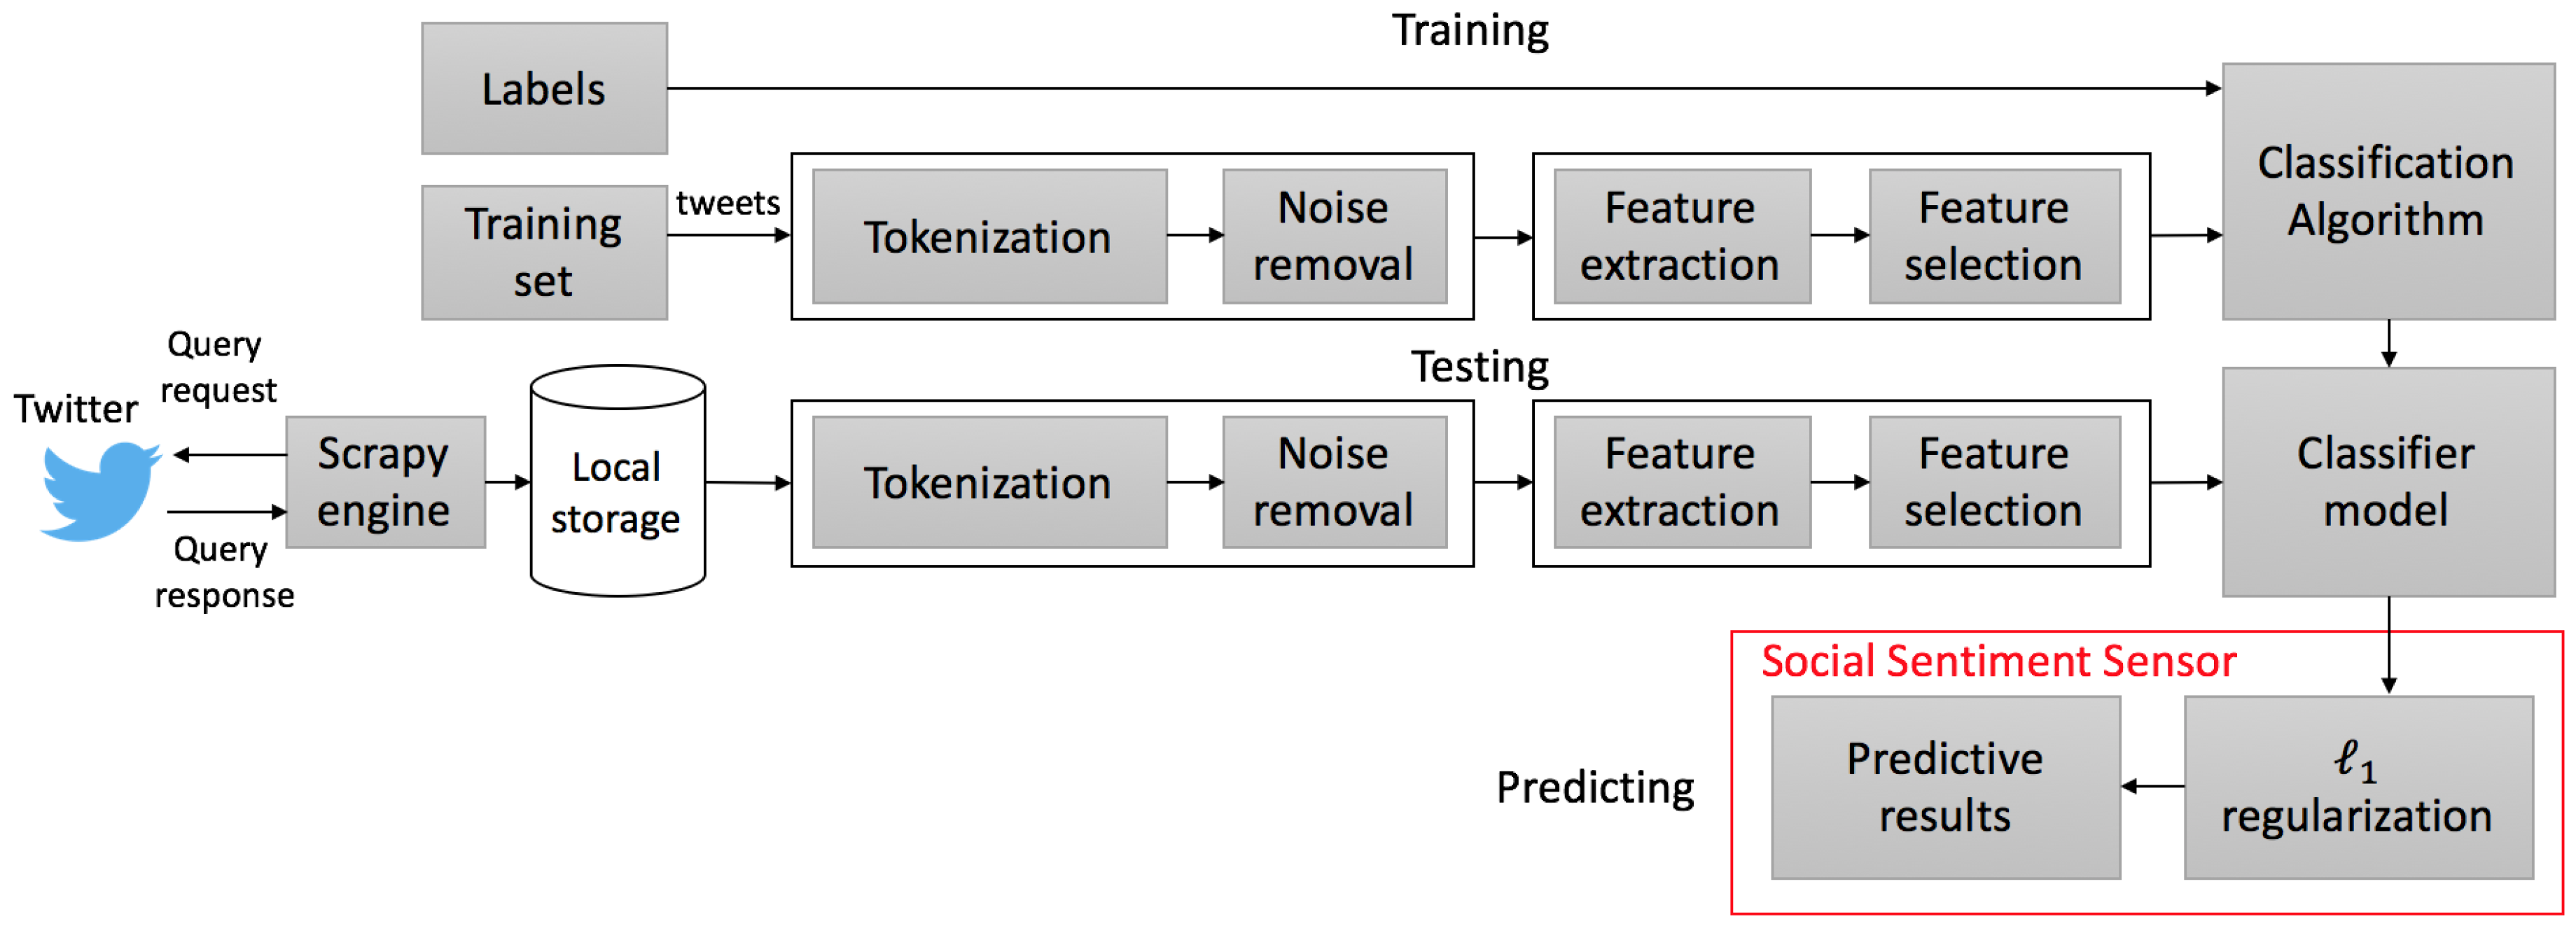
3. Proposed Methodology

The work flow of the proposed methodology is depicted in Figure 1. First, a query is requested from the Twitter search endpoint. The resulting response containing blocks of tweets is then processed by a web scrapping engine and stored on a local database. A set of pre-selected tweets is prepared for training a classifier using supervised learning [14,15,16,17]. Finally, sentimental scores of the classified tweets are fed to an 1 regularization algorithm to obtain predictive results.

4. Data Gathering and Pre-Processing

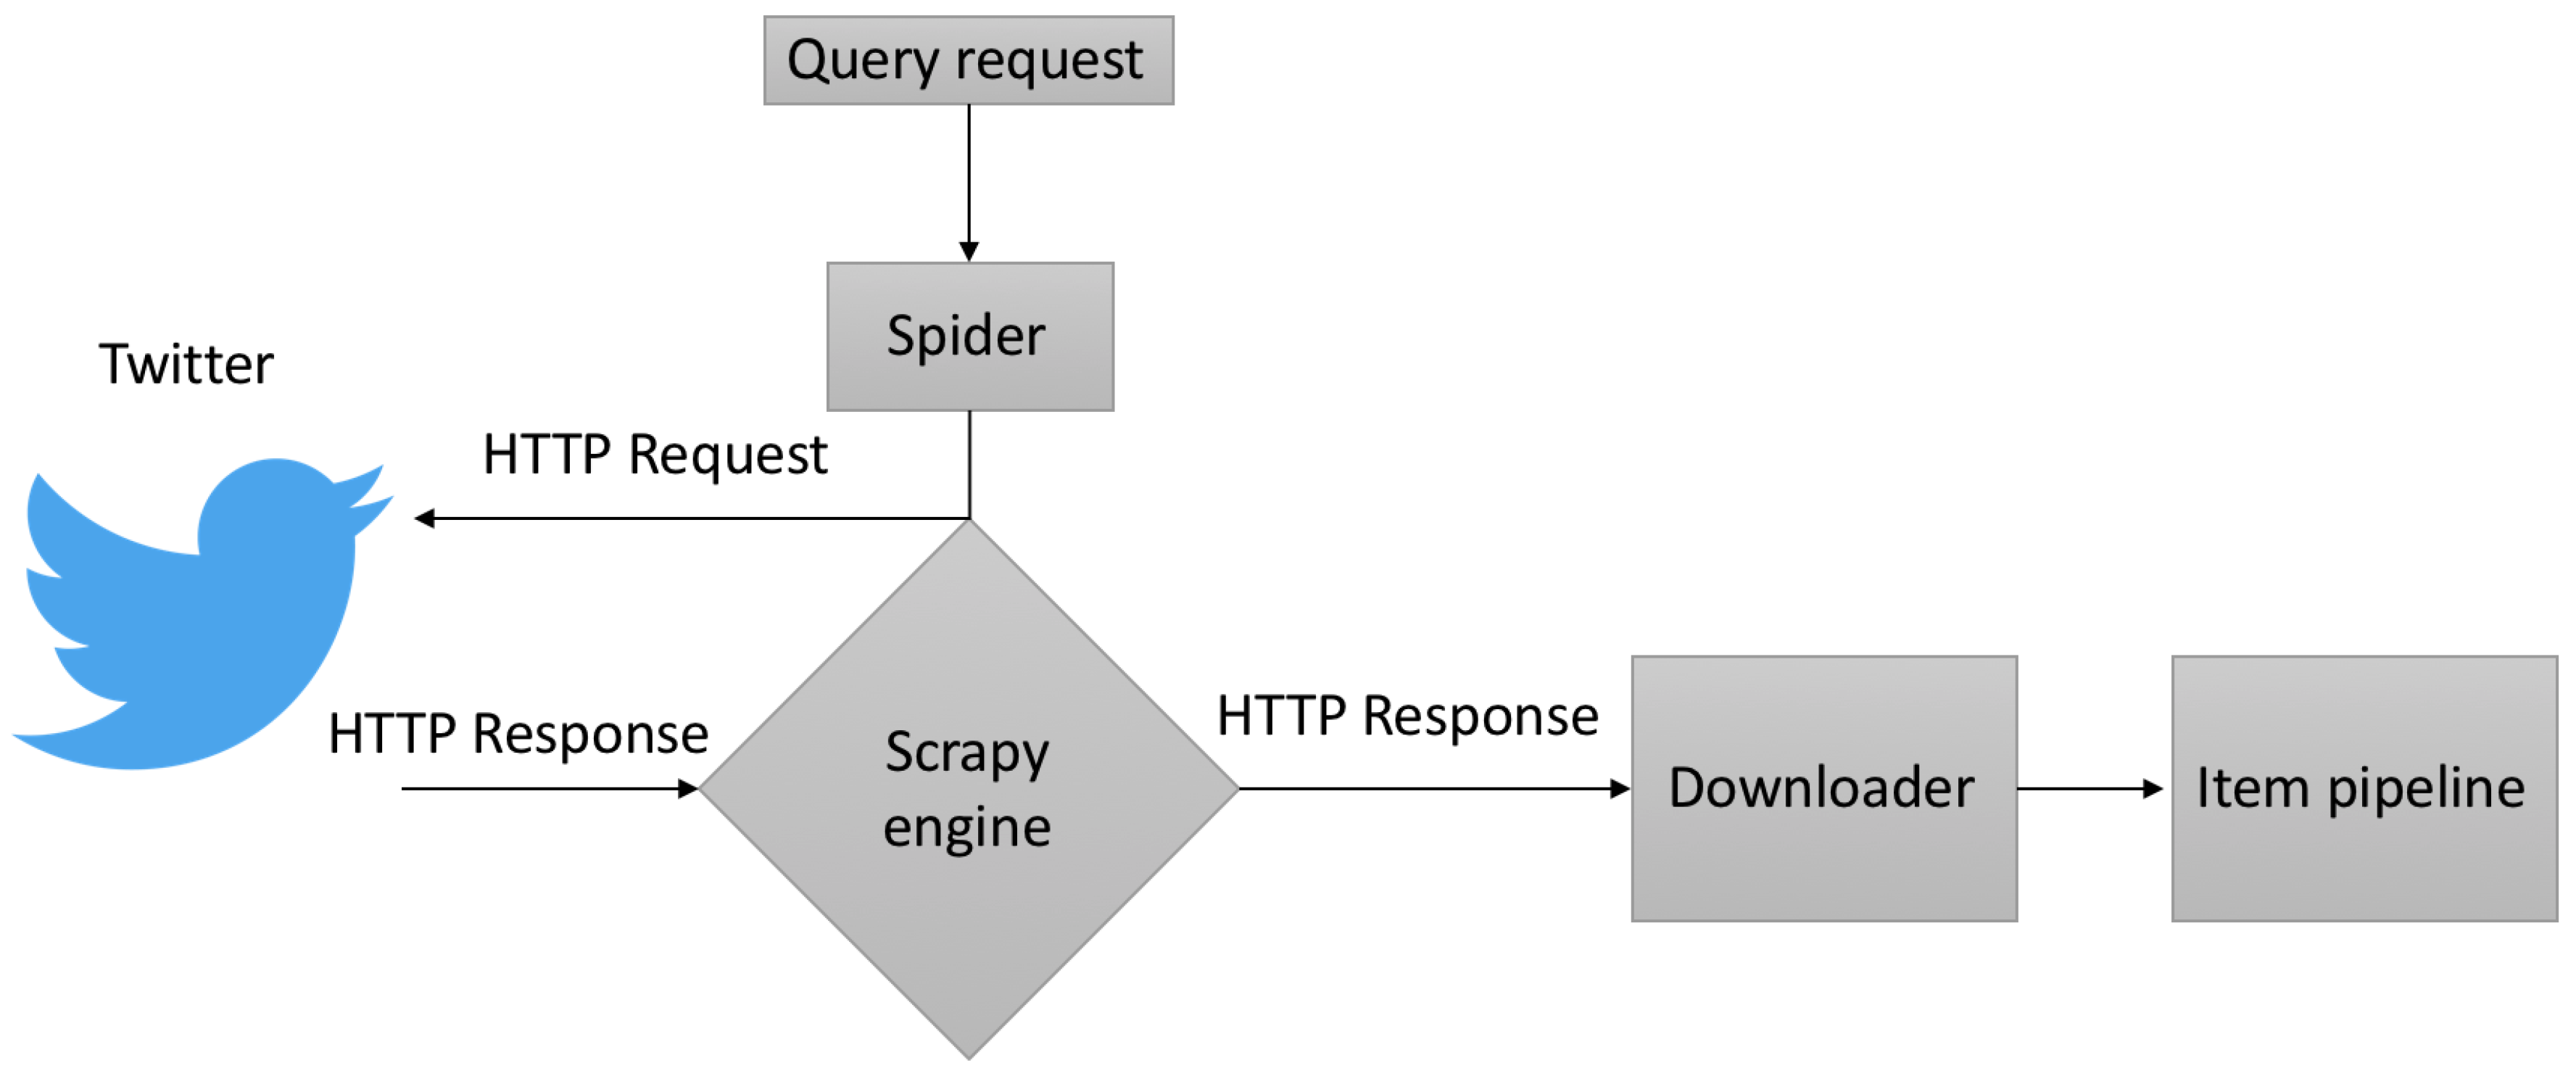
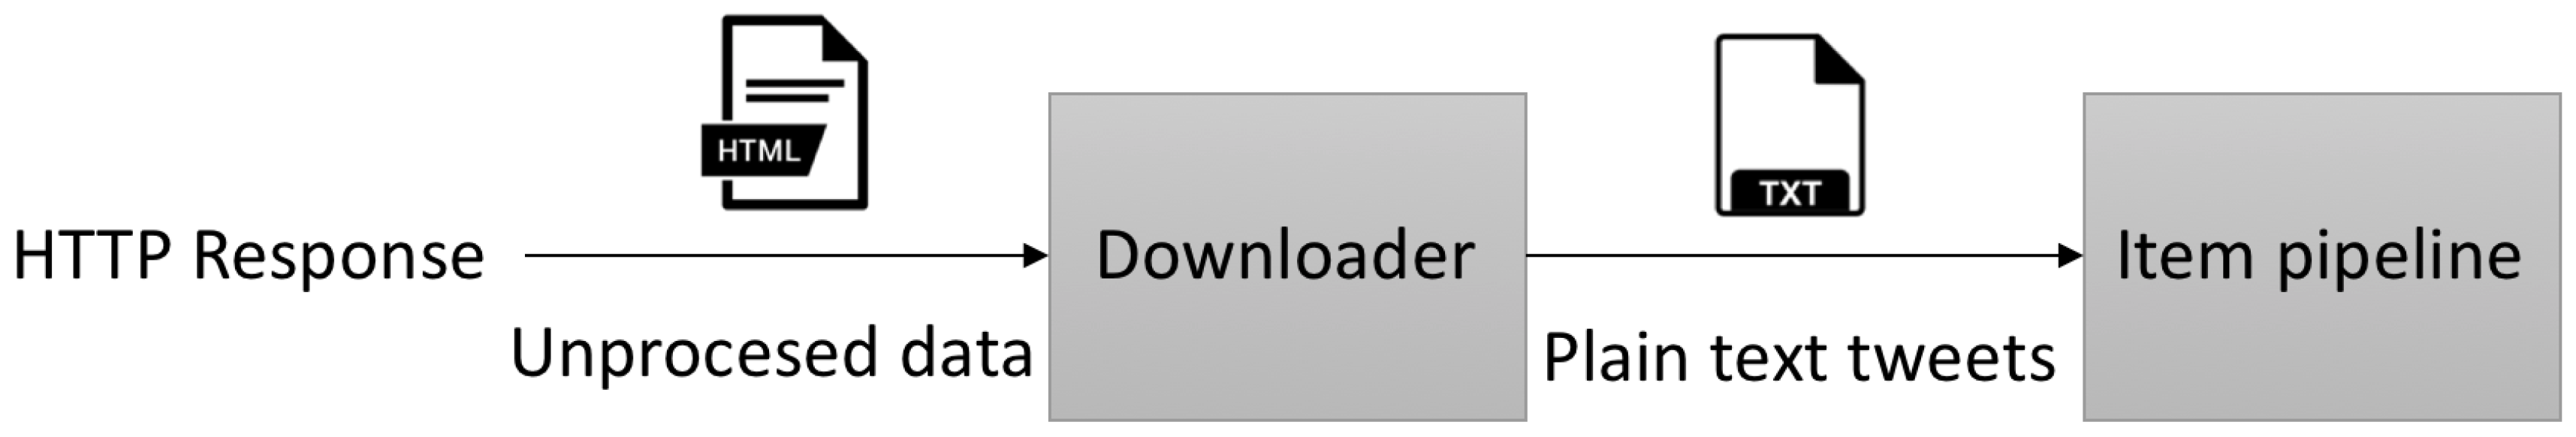
4.1. Data Acquisition

Data gathering schemes are designed for querying Twitter endpoints to obtain chronological tweets. Recent works on sentiment analysis [29,30,31] use a public information streaming platform known as Twitter Standard Search API, which is an interface that has capabilities for information retrieval in chronological order for no longer than seven days [32]. In this paper, we use an approach proposed in [33] for historical retrieval by querying Twitter search endpoints. The web crawling tasks are done with web spiders’ engines designed for document scraping in an automated and efficient manner. Information is processed by Scrapy, a Python Web Scraping Framework that extracts embedded text in HTML tags and simultaneously uses recursive functions to analyze each link to follow other tweets. This data gathering scheme is depicted in Figure 2.
Collecting data is achieved by querying the endpoints in time intervals sorted by days. Each query q is based on n-grams (set of co-occurring words within a given text) bags-of-words related to specific events defined as q = [{1-gram, 2-gram, 3-gram, …, n-gram}, {date}].
Queries responses are processed by a web spider towards the endpoint and redirected to a Scrapy download layer. Unprocessed data are then fed into the Scrapy engine in order to strip hypertext tags and retrieve each tweet in plain text. As depicted in Figure 3, the retrieved text is processed independently in Scrapy pipes that handle data streams into objects to be stored on a relational database.
The set of retrieved queries is the corpus of tweets, C , and its size is directly proportional to the daily number of tweets stored for the query. Each tweet can be represented as a structure comprising fundamental attributes, as tabulated in Table 1.
Each tweet t is stored with its own i d as a primary key that is used to sort them in a sequentially and non-repeatable way. Each tweet in set C is then denoted by C ( q ) = t i { t i d , t t e x t , t d a t e } i = 1 n .

4.2. Tokenization and Noise Removal

A cleaning task is applied on C to generate individual arrays of words (i.e., tokens) for each tweet. A normalization step is required to transform each token into lower case words; a dimensionality reduction [34] of C is important to reduce textual noise. Noise is considered as frequent uni-grams or stop-words (very commonly used words) that do not provide valuable information as candidate textual markers. In the case of the English language, sets of stop-words widely applied in Natural Language Processing are used in text cleaning tasks. This work uses the publicly-available English stop-words set published in [35], and each word is weighted by textual and lexical functions in a sentence [36]. URL patterns are removed from the corpus. Other non-informative expressions, such as retweets RT and appearances of @username, are also deleted.

4.3. Lexical Derivations

Textual markers have lexical derivations as part of ungrammatical text structures written by most users. Grammatical restriction is performed to stem each token, thus avoiding repeated samples from the same grammatical root and bias in the training step for classification. An example of stemming is shown in Table 2.
We use a Snowball Stemmer for lexicographical lemmatisation, which is a set of probabilistic algorithms based on Porter stemmer [37] of Indo-European languages and has been shown to attain high capabilities for searching pattern inflections into roots from composed words [38].

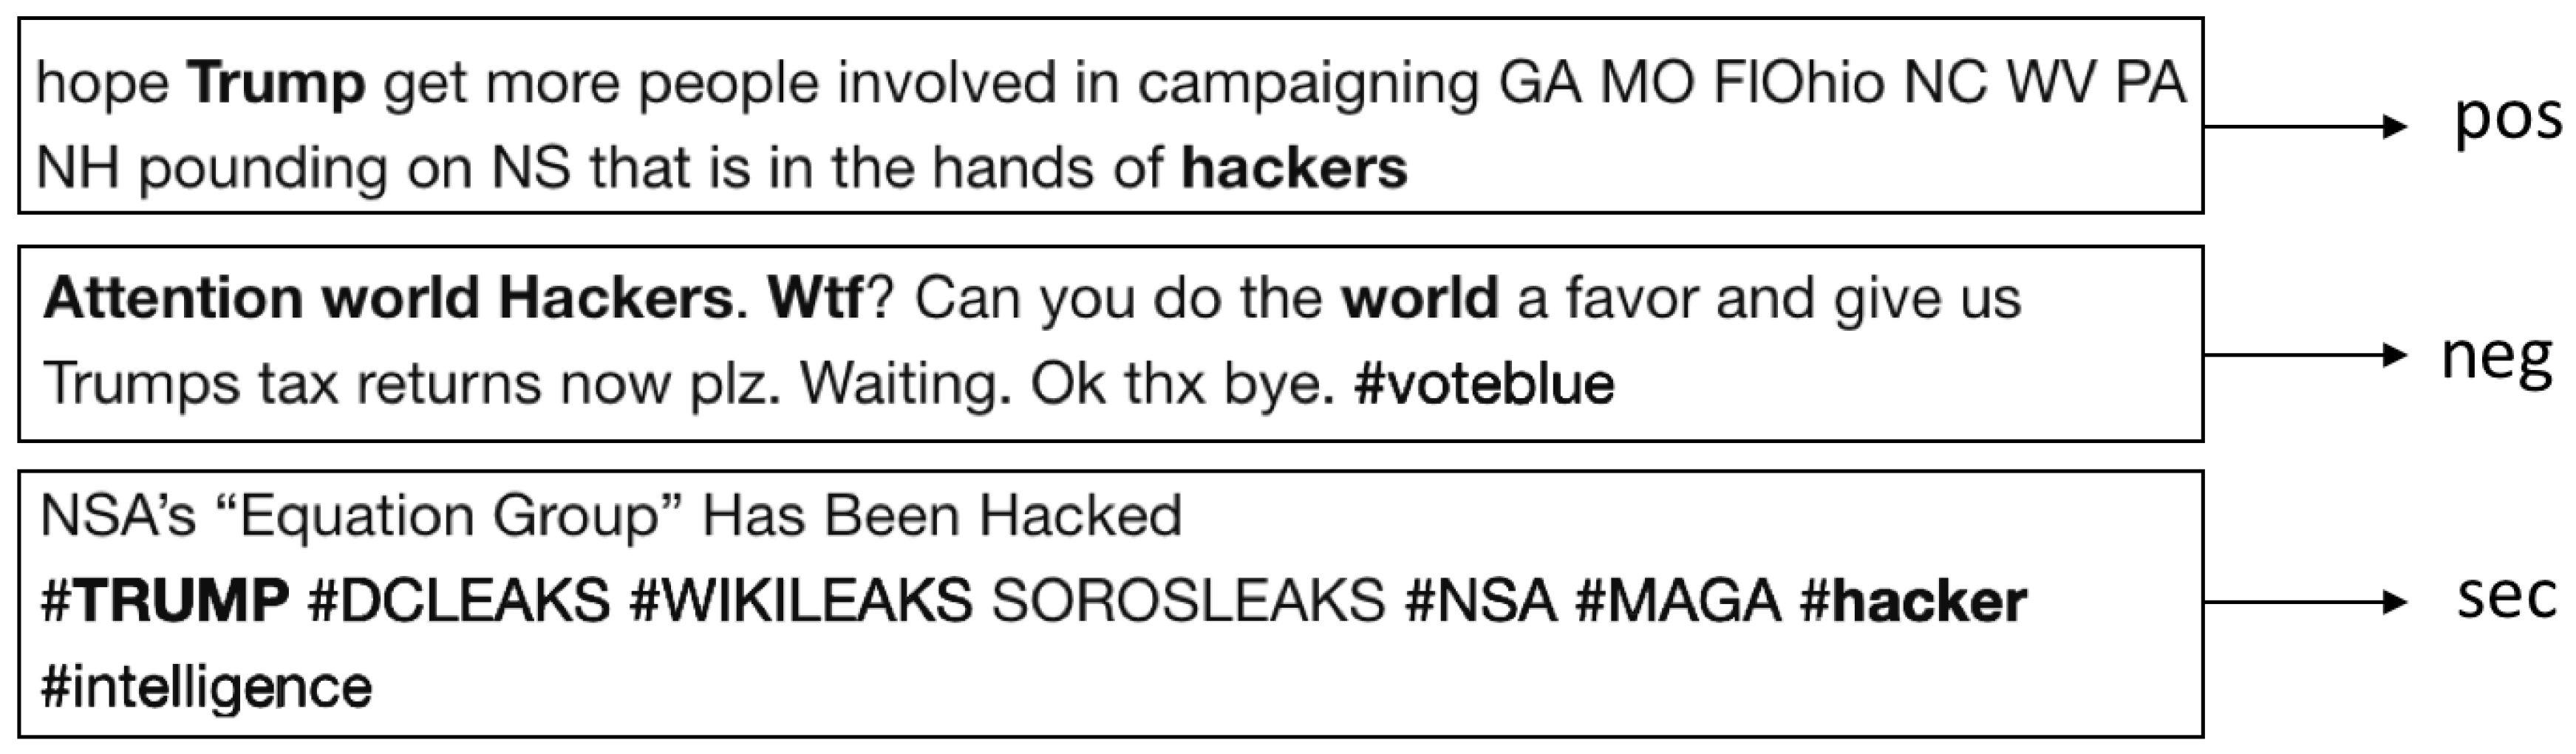
5. Pre-Classification and Class Labeling

Supervised classification provides predefined class labels given specific inputs, where each class must be independent from the others. Selecting relevant and high impact tweets are important for good training performance due to the fact that some words give most information about a particular context. We use The Stanford sentiment corpus [39] along with tweets crawled by our own scraping approach, tweets are labeled as negative ( n e g ) or positive ( p o s ) based on the user’s emotions.
A second set of tweets related to cyber-security and cyber-attacks topics is scraped by querying terms contained in The Glossary of Common Cybersecurity Terminology [40], and other manually annotated hacker-activists terms [11]. It is important to mention that hacktivism, according to [41], is a type of activity among hackers with specific political motivations and ideologies, such as religion or jigonism. In general, there are four motivations, i.e., revenge, financial, notoriety and curiosity, [42] related to hacktivism. This work considers all of these motivations.
Crawled tweets are labeled by a s e c ( s e c u r i t y o r i e n t e d ) tag. The set of labels is then denoted by l a b e l = { p o s , n e g , s e c } and the corpus for training is denoted by T = τ i { t w e e t t e x t l a b e l } i = 1 n , where τ i is the i t h tweet text and label in the training set. Figure 4 depicts some examples regarding class labeling.

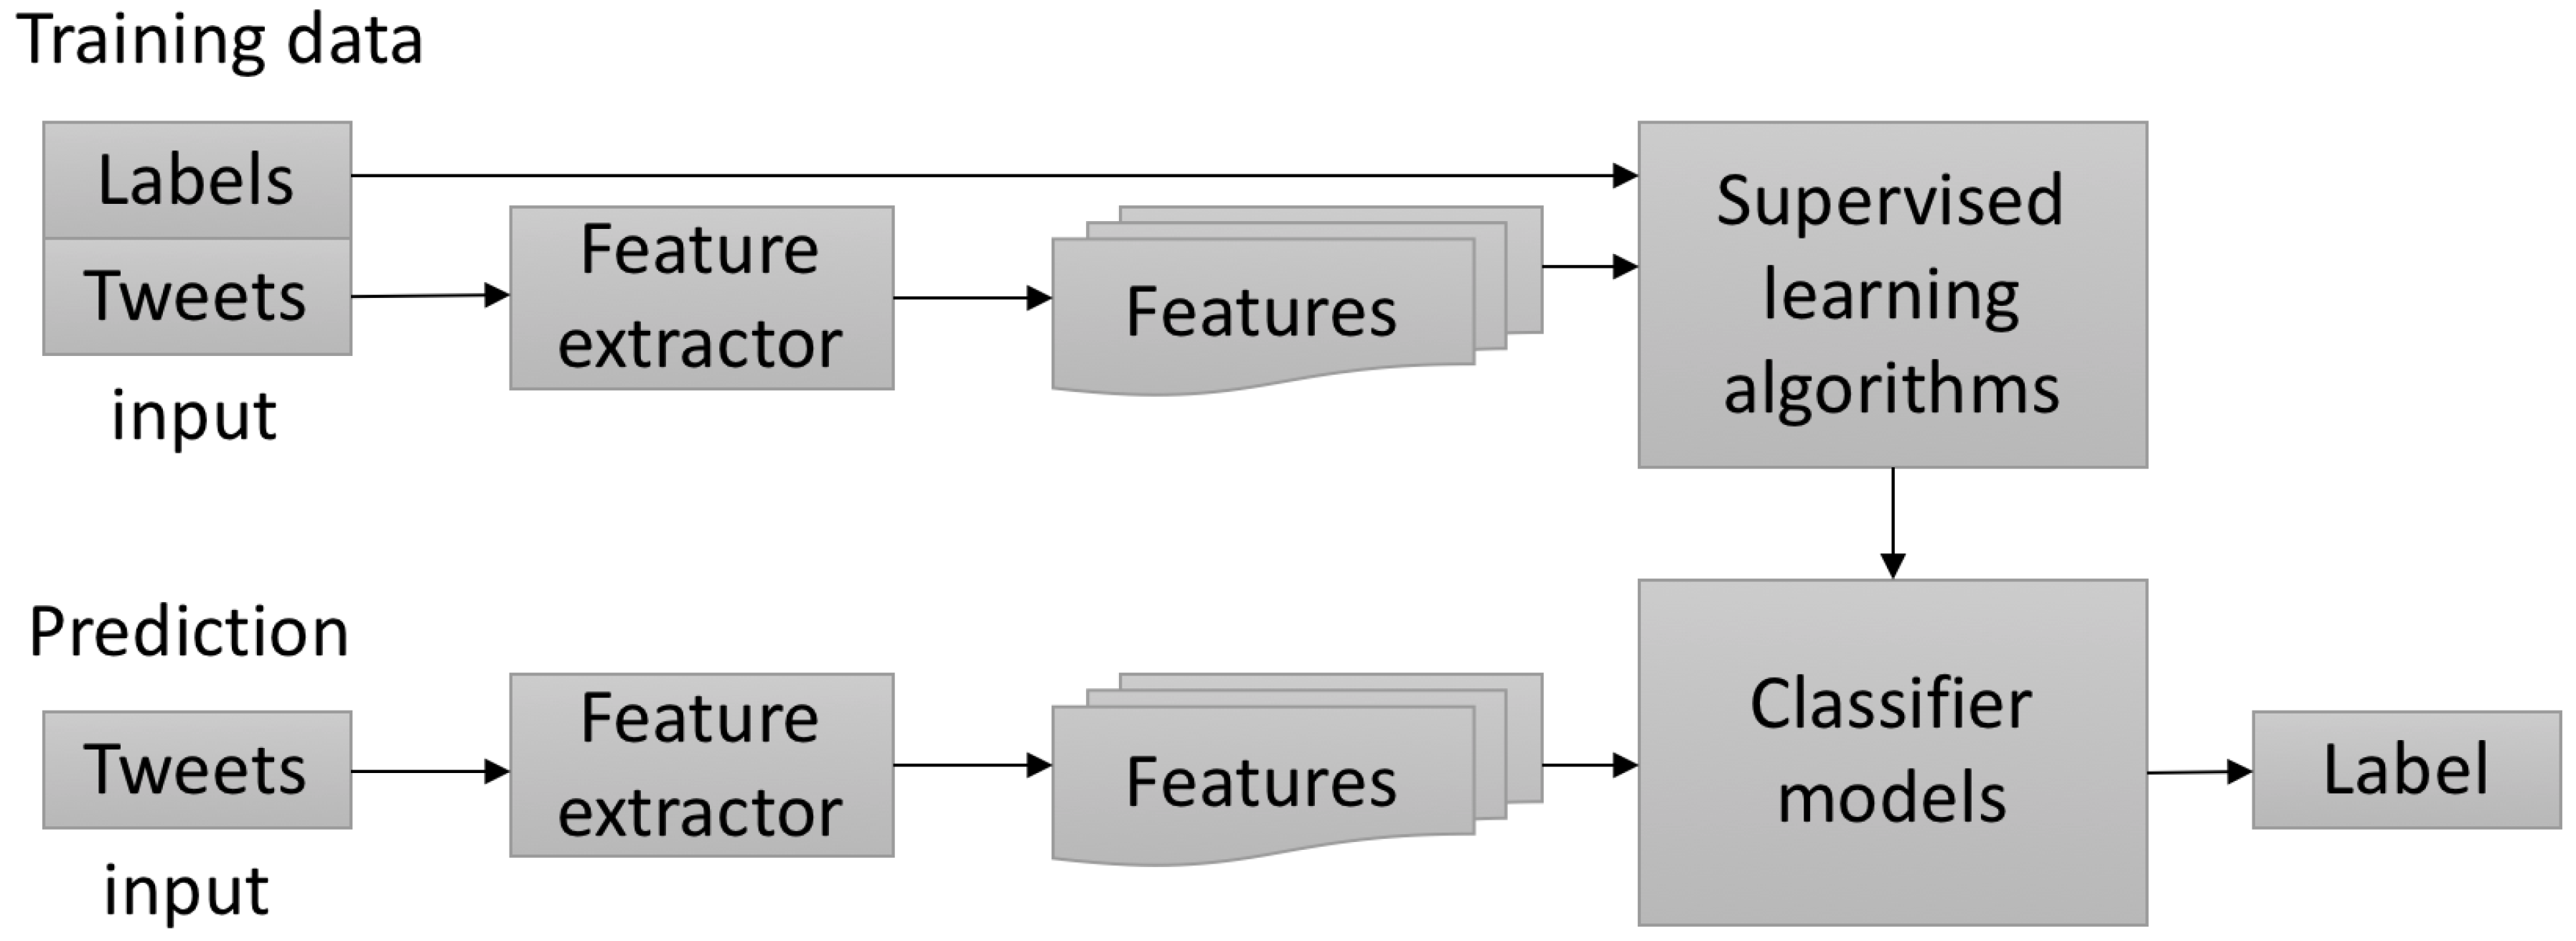
6. Supervised Classifier

Building a supervised classifier is achieved by first transforming each input of textual markers into features, followed by a training step with labels. Features extracted from T contain basic information that allows for C to be successfully classified. The work flow is graphically depicted in Figure 5.
Features and labels from T are processed by the supervised learning algorithms [14,15,16,17] to generate a classifier model. A feature extractor computes features based on words by the term frequency-inverse document frequency (Tf-idf) algorithm [43]. A label for each tweet of C is then predicted.

Feature Extraction and Selection

Features are based on sentimental relevance; i.e., words that better describe a user’s sentiment towards a specific context are selected. As proposed in [44], identifying raw n-grams is more useful for feature extraction than using speech tagging because supervised classifiers tend to attain a higher accuracy with grammatical and positional independence in sentences.
In order to avoid over-fitting, we perform a model selection procedure to split data into random matrices for training and testing. By performing a train–test selection procedure with Python sklearn library, we divide T into 80 % training and 20 % validation subsets. Training and validation tweets from regular users merged with security oriented users are denoted by X T , which contains pre-processed text from tweets, while y denotes their respective labels. Resulting subsets from T are denoted by X T , y T , which are the training subset tuples, and X V , y V , the validation subsets tuples selected to evaluate the classifier model. Word particles contained in tweets from the training set are extracted and transformed into Tf-idf term weights [45] by using a sklearn Tf-idf vectorizer; then, each resulting vector is normalized by an 2 norm.

7. Classification Baseline

Choosing a good classifier is an important task to generate a robust model for testing corpus C . In other words, results must be accurate enough to eventually find relationships between the users sentiments and cyber-attacks. In [39,46,47], different classifiers such as Naive Bayes, Maximum Entropy and Support Vector Machines are proposed and evaluated; results show that, for noisy labels and the case of emotions in tweets, Support Vector Machines attain better results than those of other text classifiers.

7.1. Naive Bayes Classifier

Classifiers based on the Bayes theorem are widely used in text classification [14] for short messages like tweets because of the simplicity in computing probabilistic evidence for class prediction given independent text features. This method contrasts with those that employ Bernoulli models [48], which are based on document counts for each class. Having a label set for C classes, we can define parameters to calculate the probability of a class c given a tweet by:
P N B ( c | t ) = ( P ( c ) ) i = 1 m p ( f i | c ) n i ( t ) P ( t ) ,
where t is a tweet, c a class (label), f i f ( X T ) is the feature, and n i ( t ) is a word presence given t and m is the number of features.

7.2. Support Vector Machines

Support Vector Machines [15] are suitable for bounding data in linear and non-linear ways. Inherently, SVM is a binary classifier, meaning that data are separated into two labeled classes. For a multi-class approach for the training set ( X T , y T ) with labels y T { 0 , 1 , 2 } , an optimization approach is proposed by solving:
ϕ ( w , ξ ) = 1 2 w 2 + C i = 1 m y i ξ I m .
Constrained to ( w y · t i ) + b y i ( w m · t i ) + b m + 2 ξ i m , ξ i m 0 , i = 1 , , , m { 1 , , k } , thus we can find an optimized decision function by finding the saddle point of the Lagrangian:
f ( x , α ) = arg max n [ i = 1 ( c i n A i α i n ) ( t i · t ) + b n ] ,
where w is the hyper plane, α i is the non-negative Variable Lagrange Multiplier, y i is the ith input class (label) from the label set, t are input tweets, b denotes the hyper-plane parameters (bias), ξ is a slack variable ( 0 < ξ i is the point between the margin and the correct side of the hyper-plane with ξ > 1 denoting a misclassified point) and C is the regularization parameter.

7.3. Maximum Entropy Classifier

Maximum Entropy classifiers are widely used for learning from input features in a weighted manner to generate a discriminative model that evaluates possible values from possible classes [16,17]. The model is represented by:
P M E ( c | t ) = 1 Z ( t ) e x p ( i = 1 n λ i , c F i , c ( t , c ) ) ,
where c denotes the class (label), t is a tweet, λ is the weight vector (considering that a higher weight assumes a strong indicator about the class), Z ( t ) is the normalization function given t, and F i , c is the feature-class function for a feature f i f ( X T ) .

8. Prediction—Statistical Analysis

1 Regularized Regression

Regression is suitable for predicting events given multiple inputs, better known as observations, that are linearly independent from each other [49]. A linear model is interpreted as:
f ( X C ) = y C ^ s e c u r i t y _ o r i e n t e d = β 0 + β 1 X C p o s + β 2 X C n e g + ε ,
where:
  • X C is the observation matrix of all classified tweets from corpus C
  • X C p o s and X C n e g are the observations with positive and negative scores, respectively,
    (a)
    X C p o s = i = 1 n C i ( p o s i t i v e ) ,
    (b)
    X C n e g = i = 1 n C i ( n e g a t i v e ) .
  • y C ^ s e c u r i t y _ o r i e n t e d is the fitted security-oriented response from regression coefficients [ β 1 , β 2 ] extracted from y C s e c u r i t y _ o r i e n t e d = i = 1 n C i ( s e c u r i t y _ o r i e n t e d ) .
Because of the negative effect on computing regression by ordinary least squares over highly correlated observations and an increase of variance, a regularized regression using selection and reduction is proposed. Regression based on vector norm 1 can adjust the linear model by making some coefficients zero, which is suitable for large multivariate observation matrices. LASSO (Least Absolute Shrinkage and Selection Operator) is an adaptation to linear models that minimizes the error in the limit of absolute values from prediction coefficients:
β ^ l a s s o = arg min β R P X C β y C 2 2 + λ β 1 ,
where λ is the tuning parameter for shrinking coefficients [ β ] . To solve the 1 penalization problem, the Forward Stagewise algorithm [50] is computed. The proposed solution of Equation (6) is given by tacking the subgradient:
i = 1 ( y C i X C i β ) ( X C i , j ) + λ g j ,
where g j is the subbgradient of the 1 norm, g j = s i g n ( β j )   if   β j 0 , g j [ 1 , 1 ] ,   otherwise . The algorithms for the proposed system are shown in Algorithms 1–4.
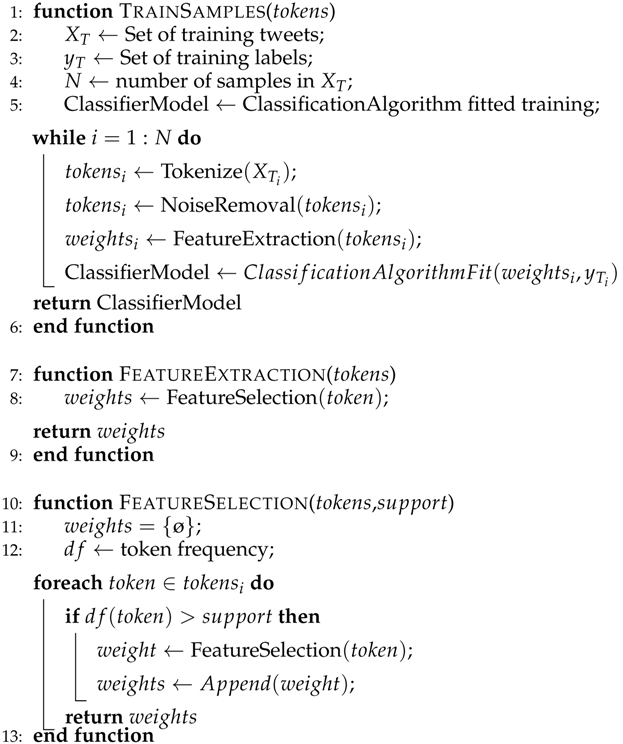
Algorithm 1: Training Samples
Sensors 18 01380 i001
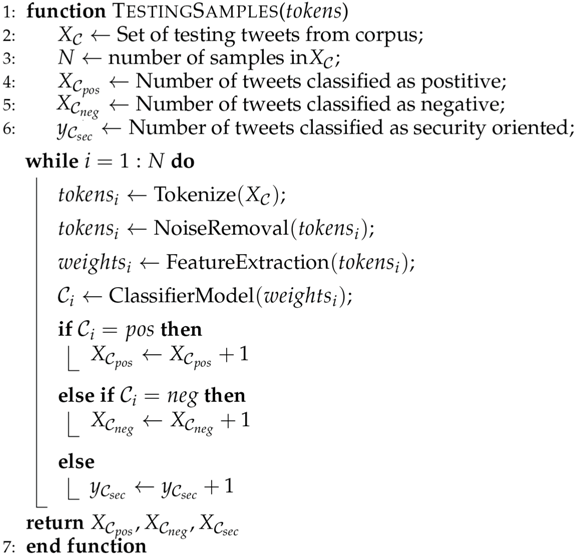
Algorithm 2: Testing Samples
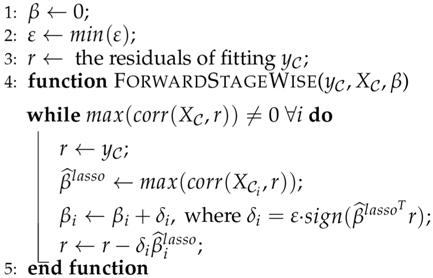
Sensors 18 01380 i002
Algorithm 3: Computing the 1 solution by Forward Stagewise
Sensors 18 01380 i003
Algorithm 4: Predictions with regularized coefficients
1: function Predict( X C n e g , X C p o s , β i )
2:  β ← [β0, β1, β2];
3:   y C ^ s e c u r i t y _ o r i e n t e d β 0 + β 1 X C p o s + β 2 X C n e g + ε ;
return y C ^ s e c u r i t y _ o r i e n t e d
4: end function

9. Experimental Results

This section shows the evaluation of the proposed sensor for sentiment analysis using a total of 1,800,000 tweets in English. One million tweets are extracted using the method proposed in [33] from regular and cyber-security related accounts and 800,000 belonging to the Stanford dataset [51]. In Table 3, some well identified Twitter accounts related to hacktivists, cyber-security feeds, researchers, and enthusiasts users are tabulated.
Table 4 tabulates the classification results attained by the Support Vector Machine (SVM), Naive Bayes (NB), and Maximum Entropy (ME) classifiers. Bold rows represent the best classification results. These results are obtained using parameters related to document frequency (df), which is a threshold for support applied to weight terms where the minimum and maximum support are in the interval [0.5, 0.95].

9.1. A Case Study

During the 2016 United States of America (USA) presidential campaigns and post election time, an important set of polarized opinions was generated by Donald Trump polemic speeches. Speculations about the winning candidate increased by adding financial, political, immigration, religious, and sexist comments towards his opponent, Hillary Clinton, during the campaign. Hacktivists generated public threats towards Donald Trump using hash-tags like # O p T r u m p and # O p D r u m p f . In addition, rumors about hackers manipulating electoral campaigns increased users’ negative reactions towards both candidates. Table 5 tabulates classification results of the three classifiers used in this work for a number of tweets generated by users who tweet regularly and hacktivists. These tweets are contained in C . As specified before, we denote by X C the testing set to perform this case study. In order to better appreciate the sentimental average scores, i.e., X C n e g , X C p o s and y C s e c u r i t y _ o r i e n t e d , the 486 tracked days between 9 January 2016 and 1 May 2017 are divided into six time-intervals.

9.2. Regularized Regression

Prediction over high volumes of scores can be difficult with ordinary regression due to unbiassed coefficients. By employing LASSO [52], we can shrink coefficients in order to optimize our prediction model. Moreover, regularized regression tasks can be only implemented in multivariate sets. As tabulated in Table 4, the ME classifier attains the best accuracy results, so we use 1 normalization on ME [53]. We divide the normalized scores from X C into monthly prediction tasks to precisely analyse the presidential campaign period. A statistical report containing the following measures is tabulated in Table 6:
  • Mean Squared Error ( M . S . E . ): shows the difference or loss of the predicted scores with the inputs, i.e., between the actual scores, y C s e c u r i t y _ o r i e n t e d , and the predictions, y C ^ s e c u r i t y _ o r i e n t e d .
  • p-value (probability value): determines how well the observations ( X C n e g , X C p o s ) are adjusted in the predictive model, thus rejecting the null hypothesis that relates to the low effectiveness of the samples. The lower the probability value (p-value ≈ 0), the greater the adjustment in the model.
  • R 2 (coefficient of determination): explains the proportion of adjustment from the observations, ( X C n e g , X C p o s ), with respect to the outputs, y C ^ s e c u r i t y _ o r i e n t e d .
  • Detected Attacks : the total number of cyber-attacks detected.
Bold rows represent the maximum correlation between users sentiment and a security oriented response given by R 2 . Historical data extracted from Google News can help to determine if R 2 values related to users’ sentiments are correlated with cyber-attacks. During mid-March 2016, Trump’s comments and behavior regarding abortion, the violence on his rallies, and his declarations about the Brussels terrorist attacks, increase users’ negative opinions towards him and, in retaliation, hacktivists started a raid under the banner of O p T r u m p threatening election sites, voice-mails, and public information. June 2016 was also a hard month during the election; rumors about hackers hijacking elections by cyber-intrusions increase people’s reaction by posting DNC compromised servers revealing Hillary Clinton’s private emails. The observations obtained in these time series show that there is a correlation between the negative opinions expressed in tweets of hacktivists and cyber-attacks. A chronological time-line of tweets classified by ME as negative, positive, and security-oriented, as well as the index of important security related incidents, as reported by Google News (see Table 7), is presented in Figure 6. Based on the results, note that it is possible to define thresholds for predicting possible cyber-attacks, for example when the coefficient of determination, R 2 , increases above 80%. Figure 7 depicts a PoC (Proof of Concept) of this idea. Specifically, this figure depicts the cyber-attacks perpetrated from January to April 2016 when the coefficient of determination, R 2 , is greater than or equal to 80%. At the end of February 2016, the hacktivist Anonymous made the following statement: Suspend campaign…or face consequences. Anonymous also created sites like www.optrump2016.com (now redirected to www.donaldjdrumpf.com) with a counter for the time left before hacking sites related to the presidential campaign. Simultaneously, the number of tweets with an associated sentiment increased considerably from February to March, 2016, approximately 78% for negative tweets, 87% for positives tweets, and 37% for security-related tweets. This confirms that the correlation computed by Equation (6) is useful to predict possible cyber-attacks.

10. Conclusions

This paper presented a methodology to predict cyber-attacks by using a Social Sentiment Sensor in Twitter. The methodology collects historical tweets and classifies them as negative, positive and security-oriented. By using 1 regularization on the classified tweets, cyber-attacks can be predicted when the corresponding coefficient of determination reaches a certain value. The methodology is evaluated within the context of the 2016 USA presidential campaigns, during which politicians appear to have influenced the sentiment of Tweeter users and in response, hacktivists reacted as part of the opposition by threatening public information. Specifically, we have shown that the proposed methodology can serve as a warning mechanism to detect possible cyber-attacks.
The proposed methodology is not limited to cyber-attacks. Our future work includes testing and tailoring the proposed methodology to predict other real-life events such as pandemics, political alignment, and market events.

Author Contributions

A.H.-S., V.S., G.S.-P. and H.P.-M. developed the proposed algorithm and carried out the analysis of the final results. V.M.-H. and K.T.-M. developed the computer program used to evaluate the performance of the proposed algorithm. J.O.-M. developed the computer programs for classifying Twitter data, whose results are presented in the evaluation results’ sections. All authors participated in the write-up and review of the paper.

Acknowledgments

The authors thank the National Science and Technology Council of Mexico (CONACyT), and the Instituto Politécnico Nacional for the financial support for this research.

Conflicts of Interest

The authors declare no conflict of interest.

References

  1. Twitter. Available online: https://twitter.com/ (accessed on 11 March 2018).
  2. Twitter Company. Available online: https://about.twitter.com/en_us/company.html (accessed on 11 March 2018).
  3. Pak, A.; Paroubek, P. Twitter as a Corpus for Sentiment Analysis and Opinion Mining. LREc 2010, 10, 19–21. [Google Scholar]
  4. Becker, H.; Naaman, M.; Gravano, L. Beyond Trending Topics: Real-World Event Identification on Twitter. In Proceedings of the International Conference on Weblogs and Social Media, Barcelona, Spain, 17–21 July 2011; pp. 438–441. [Google Scholar]
  5. Zubiaga, A.; Liakata, M.; Procter, R.; Hoi, G.W.S.; Tolmie, P. Analysing how people orient to and spread rumours in social media by looking at conversational threads. PLoS ONE 2016, 11, e0150989. [Google Scholar] [CrossRef] [PubMed]
  6. Cuenca-Jara, J.; Terroso-Saenz, F.; Valdes-Vela, M.; Skarmeta, A.F. Fuzzy Modelling for Human Dynamics Based on Online Social Networks. Sensors 2017, 11, 1949. [Google Scholar] [CrossRef] [PubMed]
  7. Haustein, S.; Bowman, T.D.; Holmberg, K.; Tsou, A.; Sugimoto, C.R.; Larivière, V. Tweets as impact indicators: Examining the implications of automated “bot” accounts on Twitter. J. Assoc. Inf. Sci. Technol. 2016, 67, 232–238. [Google Scholar] [CrossRef]
  8. Ashktorab, Z.; Brown, C.; Nandi, M.; Culotta, A. Tweedr: Mining twitter to inform disaster response. In Proceedings of the Eleventh International Conference on Information Systems for Crisis Response and Management, University Park, PA, USA, 18–21 May 2014; pp. 354–358. [Google Scholar]
  9. Barnaghi, P.; Ghaffari, P.; Breslin, J.G. Opinion Mining and Sentiment Polarity on Twitter and Correlation Between Events and Sentiment. In Proceedings of the International Conference on Big Data Computing Service and Applications, Oxford, UK, 29 March–1 April 2016; pp. 52–57. [Google Scholar]
  10. Amato, F.; Cozzolino, G.; Mazzeo, A.; Romano, S. Detecting anomalies in Twitter stream for Public Security Issues. In Proceedings of the 2nd International Forum in Research and Technologies for Society and Industry Leveraging a Better Tomorrow, Bologna, Italy, 17–21 September 2016; pp. 1–4. [Google Scholar]
  11. Hernández, A.; Sanchez, V.; Sánchez, G.; Pérez, H.; Olivares, J.; Toscano, K.; Nakano, M.; Martinez, V. Security attack prediction based on user sentiment analysis of Twitter data. In Proceedings of the International Conference on Industrial Technology, Taipei, Taiwan, 14–17 March 2016; pp. 610–617. [Google Scholar]
  12. Zhang, Y.; Ruan, X.; Wang, H.; Wang, H.; He, S. Twitter Trends Manipulation: A First Look Inside the Security of Twitter Trending. IEEE Trans. Inf. Forensics Secur. 2017, 12, 144–156. [Google Scholar] [CrossRef]
  13. Bifet, A.; Frank, E. Sentiment knowledge discovery in twitter streaming data. In Proceedings of the International Conference on Discovery Science, Canberra, Australia, 6–8 October 2010; pp. 1–15. [Google Scholar]
  14. Prasad, S. Micro-Blogging Sentiment Analysis Using Bayesian Classification Methods; Technical Report; Stanford University: Stanford, CA, USA, 2010. [Google Scholar]
  15. Christianini, N.; Shawe-Taylor, J. An Introduction to Support Vector Machines and Other Kernel-Based Learning Methods; Cambridge University Press: Cambridge, UK, 2000. [Google Scholar]
  16. Nigam, K.; Lafferty, J.; McCallum, A. Using maximum entropy for text classification. In Proceedings of the IJCAI-99 Workshop on Machine Learning for Information Filtering, Stockholm, Sweden, 1 August 1999; Volume 1, pp. 61–67. [Google Scholar]
  17. Indra, S.T.; Wikarsa, L.; Turang, R. Using logistic regression method to classify tweets into the selected topics. In Proceedings of the International Conference on Advanced Computer Science and Information Systems, Malang, Indonesia, 15–16 October 2016; pp. 385–390. [Google Scholar]
  18. Gai, K.; Qiu, M.; Sun, X. A survey on FinTech. J. Netw. Comput. Appl. 2018, 103, 262–273. [Google Scholar] [CrossRef]
  19. Gai, K.; Qiu, M. Blend arithmetic operations on tensor-based fully homomorphic encryption over real numbers. IEEE Trans Ind. Informat. 2017. [Google Scholar] [CrossRef]
  20. Gai, K.; Qiu, M.; Ming, Z.; Zhao, H.; Qiu, L. Spoofing-jamming attack strategy using optimal power distributions in wireless smart grid networks. IEEE Trans. Smart Grid 2017, 8, 2431–2439. [Google Scholar] [CrossRef]
  21. Kirichenko, L.; Radivilova, T.; Carlsson, A. Detecting Cyber Threats Through Social Network Analysis: Short Survey; SocioEconomic Challenges: Sumy, Ukraine, 2017. [Google Scholar]
  22. Lau, R.Y.; Xia, Y.; Li, C. Social media analytics for cyber attack forensic. Int. Res. J. Eng. Technol. 2012, 1, 217–220. [Google Scholar]
  23. Samtani, S.; Chen, H. Using social network analysis to identify key hackers for keylogging tools in hacker forums. In Proceedings of the Conference on Intelligence and Security Informatics, Tucson, AZ, USA, 27–30 September 2016; pp. 319–321. [Google Scholar]
  24. Gharibi, W.; Shaabi, M. Cyber threats in social networking websites. arXiv, 2012; arXiv:1202.2420. [Google Scholar]
  25. Kumar, S.; Carley, K.M. Understanding DDoS cyber-attacks using social media analytics. In Proceedings of the Conference on Intelligence and Security Informatics, Tucson, AZ, USA, 28–30 September 2016; pp. 231–236. [Google Scholar]
  26. Gayo-Avello, D. A meta-analysis of state-of-the-art electoral prediction from Twitter data. Soc. Sci. Comput. Rev. 2013, 31, 649–679. [Google Scholar] [CrossRef]
  27. Schoen, H.; Gayo-Avello, D.; Takis Metaxas, P.; Mustafaraj, E.; Strohmaier, M.; Gloor, P. The power of prediction with social media. Intern. Res. 2013, 23, 528–543. [Google Scholar] [CrossRef]
  28. Lampos, V.; De Bie, T.; Cristianini, N. Flu detector-tracking epidemics on Twitter. In Joint European Conference on Machine Learning and Knowledge Discovery in Databases; Springer: Berlin/Heidelberg, Germany, 2010; pp. 599–602. [Google Scholar]
  29. Yin, J.; Karimi, S.; Lampert, A.; Cameron, M.; Robinson, B.; Power, R. Using social media to enhance emergency situation awareness. IEEE Intell. Syst. 2012, 27, 52–59. [Google Scholar] [CrossRef]
  30. Achrekar, H.; Gandhe, A.; Lazarus, R.; Yu, S.H.; Liu, B. Predicting flu trends using twitter data. In Proceedings of the Computer Communications Workshops, Shangai, China, 10–15 April 2011; pp. 702–707. [Google Scholar]
  31. Asur, S.; Huberman, B.A. Predicting the future with social media. In Proceedings of the International Conference on Web Intelligence and Intelligent Agent Technology, Toronto, ON, Canada, 31 August–3 September 2010; pp. 492–499. [Google Scholar]
  32. API Reference—Twitter Developers. Available online: https://developer.twitter.com/en/docs/tweets/search/api-reference (accessed on 11 March 2018).
  33. Hernandez-Suarez, A.; Sanchez-Perez, G.; Toscano-Medina, K.; Martinez-Hernandez, V.; Sanchez, V.; Perez-Meana, H. A Web Scraping Methodology for Bypassing Twitter API Restrictions. arXiv, 2018; arXiv:1803.09875. [Google Scholar]
  34. Godfrey, D.; Johns, C.; Sadek, C. Interpreting Clusters of World Cup Tweets. arXiv, 2014; arXiv:1408.5427. [Google Scholar]
  35. Ranks, N.L. Stop Words. Available online: http://www.ranks.nl/stopwords (accessed on 11 March 2018).
  36. Saini, J.R.; Rakholia, R.M. On Continent and Script-Wise Divisions-Based Statistical Measures for Stop-words Lists of International Languages. Procedia Comput. Sci. 2016, 89, 313–319. [Google Scholar] [CrossRef]
  37. Porter, M.F. A Language for Stemming Algorithms. 2001. Available online: https://snowball.tartarus.org/texts/introduction.html (accessed on 11 March 2018).
  38. Balakrishnan, V.; Lloyd-Yemoh, E. Stemming and lemmatization: A comparison of retrieval performances. Lect. Notes Softw. Eng. 2014, 2, 262. [Google Scholar] [CrossRef]
  39. Go, A.; Bhayani, R.; Huang, L. Twitter Sentiment Classification Using Distant Supervision; CS224N Project Report; Stanford University: Stanford, CA, USA, 2009. [Google Scholar]
  40. A Glossary of Common Cybersecurity Terminology. Available online: https://niccs.us-cert.gov/glossary (accessed on 11 March 2018).
  41. Rogers, M.K. The psyche of cybercriminals: A psycho-social perspective. In Cybercrimes: A Multidisciplinary Analysis; Springer: Berlin/Heidelberg, Germany, 2010. [Google Scholar]
  42. Rogers, M.K. A two-dimensional circumplex approach to the development of a hacker taxonomy. Digit. Investig. 2006, 3, 97–102. [Google Scholar] [CrossRef]
  43. Wang, Y.; Liu, Y.; Feng, L.; Zhu, X. Novel feature selection method based on harmony search for email classification. Knowl. Based Syst. 2015, 73, 311–323. [Google Scholar] [CrossRef]
  44. Pang, B.; Lee, L. Opinion mining and sentiment analysis. Found. Trends Inf. Retr. 2008, 2, 1–135. [Google Scholar] [CrossRef]
  45. Maas, A.L.; Daly, R.E.; Pham, P.T.; Huang, D.; Ng, A.Y.; Potts, C. Learning word vectors for sentiment analysis. In Proceedings of the 49th Annual Meeting of the Association for Computational Linguistics: Human Language Technologies, Portland, OR, USA, 19–24 June 2011; pp. 142–150. [Google Scholar]
  46. Jiang, L.; Yu, M.; Zhou, M.; Liu, X.; Zhao, T. Target-dependent twitter sentiment classification. In Proceedings of the 49th Annual Meeting of the Association for Computational Linguistics: Human Language Technologies, Portland, OR, USA, 19–24 June 2011; Volume 1, pp. 151–160. [Google Scholar]
  47. Collier, N.; Doan, S. Syndromic classification of twitter messages. In International Conference on Electronic Healthcare; Springer: Berlin/Heidelberg, Germany, 2011; pp. 186–195. [Google Scholar]
  48. McCallum, A.; Nigam, K. A comparison of event models for naive bayes text classification. In Proceedings of the AAAI-98 Workshop on Learning for Text Categorization, Madison, WI, USA, 26–27 July 1998; pp. 41–48. [Google Scholar]
  49. Böhme, R.; Moore, T. How do consumers react to cybercrime? In Crime Researchers Summit (eCrime); IEEE: Piscataway, NJ, USA, 2012. [Google Scholar]
  50. Hastie, T.; Efron, B. Lars: Least Angle Regression. Ann. Stat. 2007, 32, 407–499. [Google Scholar]
  51. Saif, H.; Fernandez, M.; He, Y.; Alani, H. Evaluation datasets for Twitter sentiment analysis: A survey and a new dataset, the STS-Gold. In Proceedings of the 1st Interantional Workshop on Emotion and Sentiment in Social and Expressive Media: Approaches and Perspectives from AI (ESSEM 2013), At Turin, Italy, 3 December 2013. [Google Scholar]
  52. Tibshirani, R. Regression shrinkage and selection via the lasso. J. R. Stat. Soc. Ser. B Methodol. 1996, 58, 267–288. [Google Scholar]
  53. Singhal, A.; Buckley, C.; Mitra, M. Pivoted document length normalization. In Proceedings of the 19th Annual International ACM SIGIR Conference on Research and Development in Information Retrieval, Zurich, Switzerland, 18–22 August 1996; pp. 21–29. [Google Scholar]
Figure 1. Work flow of the proposed methodology.
Sensors 18 01380 g001
Figure 2. Data gathering scheme.
Sensors 18 01380 g002
Figure 3. Embedded text in HTML.
Sensors 18 01380 g003
Figure 4. Example of labeling for the three observed classes.
Sensors 18 01380 g004
Figure 5. Training and label prediction.
Sensors 18 01380 g005
Figure 6. Chronological user’s sentiments and reported security-related incidents.
Sensors 18 01380 g006
Figure 7. Proposed proof of concept.
Sensors 18 01380 g007
Table 1. Tweet object.
AttributeDescription
idthe integer representation of the unique identifier for this Tweet
created_atUTC time when a tweet was created
textThe actual UTF-8 text of the status update
Table 2. Stemmed lexical variations.
PrefixRootSufix
nonecorrputtion
nonecorrupted
noneincorruptibility
Table 3. Identified Twitter accounts related to hacking and cyber-security.
Account TypeIdentified Accounts
hacktivismanonymouspress, youranonglobal, wapoanon, werallanonymous, observingsentin, theanonmovement, freeanons, global_hackers, anonymousvideo, anonrrd
cyber-security feeds and sensorsnitdefender, malwarebytes, oinionid, moixec, uscert_gov, nakedsecurity, kaspersky, fsecure, nortononline, nsc
researchers and enthusiastspeerlyst, cyber, mikko, briankrebs, nieljrubenking, dangoodin001, gcluley, campuscodi, peterkruse, e_kaspersky, troyhunt, swiftonsecurity, icheylus
Table 4. Classification results of NB, SVM and ME.
ClassifierClassPrecisionRecall F 1 Score
NBnegative0.770.800.79
positive0.760.760.76
security-oriented0.940.910.93
SVMnegative0.800.800.80
positive0.780.800.79
security-oriented0.950.940.95
MEnegative0.810.800.80
positive0.780.800.79
security-oriented0.960.940.95
Table 5. Classified tweets over 486 days.
DatesClassifierposnegsec
9 January 2016 to 23 March 2016NB1,858,3292,143,213535,449
ME26,451,3602,920,311450,793
SVM2,792,0882,346,357540,059
24 March 2016 to 12 June 2016NB1,909,0281,969,2111,969,211
ME24,294,7802,384,148569,337
SVM2,564,4492,347,377682,077
13 June 2016 to 1 September 2016NB1,957,3512,428,5571,208,306
ME24,017,22027,840,391,013,131
SVM2,535,1512,740,4851,213,509
2 September 2016 to 21 November 2016NB2,290,5962,966,951951,907
ME28,019,7003,308,982802,142
SVM2,957,6353,257,319961,466
22 November 2016 to 10 February 2017NB2,456,0033,217,832985,666
ME30,309,1203,480,291827,089
SVM3,199,2963,420,468923,691
11 February 2017 to 1 May 2017NB2,436,7533,464,375237,160
ME29,392,2003,703,008198,667
SVM3,102,5103,626,100238,128
Table 6. Regularized regression measures report.
MonthsMSE β 1 β 2 p-Value R 2 y C security _ oriented y C ^ security _ oriented Detected Attacks
January (2016)0.002431609.36845.540.00.61116,91070,1462
February (2016)0.002231609.36845.540.00.63210,874132,8501
March (2016)0.000011609.36845.540.00.81317,625257,2766
April (2016)0.003141609.36845.540.00.54372,438249,5332
May (2016)0.001411609.36845.540.00.67122,67483,5312
June (2016)0.000021609.36845.540.00.89223,674199,0696
July (2016)0.000081609.36845.540.00.86230,655198,3631
August (2016)0.000091609.36845.540.00.85410,874349,2423
September (2016)0.000151609.36845.540.00.77291,643224,5652
October (2016)0.00041609.36845.540.00.71241,438188,3212
November (2016)0.000541609.36845.540.00.79230,123181,7972
December (2016)0.003121609.36845.540.00.53229,451121,6092
January (2017)0.001441609.36845.540.00.69378,286261,0171
February (2017)0.003341609.36845.540.00.52107,93356,1251
March (2017)0.003391609.36845.540.00.5196,97349,4561
April (2017)0.003301609.36845.540.00.5694,96153,1781
Table 7. News reporting security-related incidents.
IndexDateNewsSourceNegative SampleSecurity-Oriented Sample
12 January 2016’Anti-IS group’ claims BBC website attackBBC News56,7121573
22 January 2016Hackers Shut Down Donald Trump Election Campaign WebsiteHack Read56,7121573
329 February 2016US Cyber Command launches hacking offensive against Islamic StateWashington Times24,3785929
44 March 2016Donald Trump’s voicemails hacked by AnonymousThe Independent30,1417744
515 March 2016Anonymous Declares ‘Total War’ On Donald Trump With Cyber Attacks Planned For 1 AprilHuffington Post UK31,97716,940
615 March 2016Anonymous Just Declared War on Donald Trump With a Massive CyberattackMIC31,97716,940
717 March 2016ANONYMOUS OPTRUMP: HACKERS LAUNCH ‘TOTAL WAR’ ON DONALD TRUMP IN REVENGE FOR ‘HATEFUL’ CAMPAIGNThe Independent43,40129,282
818 March 2016Trump Under Attack: The Donald Is Hacked by Anonymous and Son Eric Receives Threatening Letter Containing White PowderPeople Magazine45,59414,762
923 March 2016Anti-Trump campaign sparks civil war among Anonymous hackersThe Guardian41,9228107
101 April 2016Anonymous Will Begin Latest War on Donald Trump Friday, April Fools’ DayInverse40,1887623
115 April 2016Donald Trump’s hotel chain HACKED for second time in six monthsMirror.co.uk35,54716,577
128 May 2016Presidential candidates may be vulnerable to foreign hackers, US saysThe Guardian26,4696534
1331 May 2016Hacked construction signs call Trump a ‘shape shifting lizard’FOX 4 News26,9796538
1414 June 2016Russian Spies Hacked Into the DNC’s Donald Trump filesCNN23,35813,794
1514 June 2016Russian Gov Hacks DNC, Steal Trump OppoThe Weekly Standard23,35813,794
1615 June 2016Donald Trump Lone Hacker Claim Responsability for Stealing Democratic Party’s DataABC34,22114,762
1721 June 2016Russian hackers reportedly access Clinton FoundationThe Sidney Morning Herald33,60917,908
1823 June 2016Russian Hackers Targeted Hillary Clinton Campaign Google AccountsForbes31,46716,456
1930 June 2016Hacker Reveals New Trove of DNC Documents and Answers a Few Personal QuestionsMother Jones32,48718,388
2025 July 2016FBI Suspects Russia Hacked DNC; U.S. Officials Say It Was to Elect Donald TrumpDaily Beast29,42712,826
214 August 2016Hackers for Hillary: event attendance ‘through the roof’ after Trump remarksThe Guardian38,5058954
2218 August 2016Is Russia hacking the US election?BBC News40,4949075
2324 August 2016No proof, but ‘Russian hackers’: CNN blunders with report on ‘breach’ at NYT–not even asking NYTInternational RT44,0138833
242 September 2016Putin on DNC hack: Let’s talk content, not hackers’ identityInternational RT28,5609438
256 September 2016Hillary Clinton Suggests Alleged Russian Hacking Is Designed to Help TrumpNBCNews.com35,39410,890
2611 September 2016CIA Director John Brennan warns of Russian hackingNewsHour33,7629075
2714 September 2016Trump a ‘National Disgrace,’ Colin Powell Wrote in Hacked EmailsABC News36,4657865
2817 October 2016Could Russian hackers change the U.S. election result?Aljazeera50,18411,374
2931 October 2016Was a Trump Server Communicating With Russia?Slate Magazine53,19311,253
3010 November 2016Russian hackers throw Trump victory party with new spear phishing campaignArs Technica45,84911,011
3111 November 2016Russia-linked DNC hackers launched wave of cyberattacks hours after Trump victoryArs Technica34,17011,737
332 December 2016Trump condemns CIA Russia hacking reportBBC News31,97712,463
329 December 2016Russian Hackers Acted to Aid Trump in Election, U.S. SaysNew York Times41,05512,705
349 January 2017Surprise! WikiLeaks’ Assange Backs Trump on Russia Hacking ReportNY Times36,77111,132
3522 February 2017U.S. CyberCorps, ROTC For Hackers, In Disarray in Trump AdminVocativ50,0825929
365 March 2017DeepStateGate: Democrats’ ‘Russian Hacking’ Conspiracy Theory BackfiresBig Government43,60513,331
3710 March 2017Trump adviser admits to contact with DNC hackerThe Hill42,8911089
384 April 2017Russian Hackers Are Working To Amplify Donald Trump’s Wiretapping Claim, Expert WarnsHuffPost47,4811089
3910 April 2017Russian hacker arrested in Spain over ‘links to Trump victory’The Local50,8983388

