Automated Field-of-View, Illumination, and Recognition Algorithm Design of a Vision System for Pick-and-Place Considering Colour Information in Illumination and Images

Abstract
:1. Introduction
2. Problem Formulation
2.1. Preconditions
2.2. Design Variables
2.3. Inputs and Outputs
2.3.1. Inputs
- Preparation Data for Scenes:here, Si denotes the i-th coordinate on the work plane of the position where the corresponding scene was set, and n the total number of scenes. The number of images required to capture one scene depends on the camera distance.Each Si contains the locations of x, y, and z directions such that the manipulator can hold the camera and capture images of the existing scene. zi describes the distance from the camera to the plane where the recognition targets are arranged.
- Preparation Data for Templates:where nT represents the total number of recognition target kinds.the l-th template is prepared by automatically cutting the object image from the original image which was obtained by holding the camera at the position (x, y, z). By using the position of the objects in the acquired image, namely xl and yl, as well as the predetermined width and height, wl and hl, the template could be obtained.
- Ground Truth Data:where denotes the ground truth data for the i-th scene.however, the scene contains many recognition targets; the ground truth data always include information on each recognition target, from the 1st to the mi-th.the ground truth data for each object includes the object type, the x and y position in captured images and the orientation angle.
- Camera Calibration Data:where Ci denotes the i-th image for calibration and n the total number of images required for a calibration.
2.3.2. Outputs
- Optimal solution:where R, G, and B denote the light strength of red, green and blue, and Precognition the set of parameters related to the chosen recognition algorithm. Especially, Precognition consists of:the entire number of parameters n is determined by the chosen recognition algorithm.
2.4. Evaluation Function and Constraints
2.4.1. Evaluation Function
2.4.2. Constraints
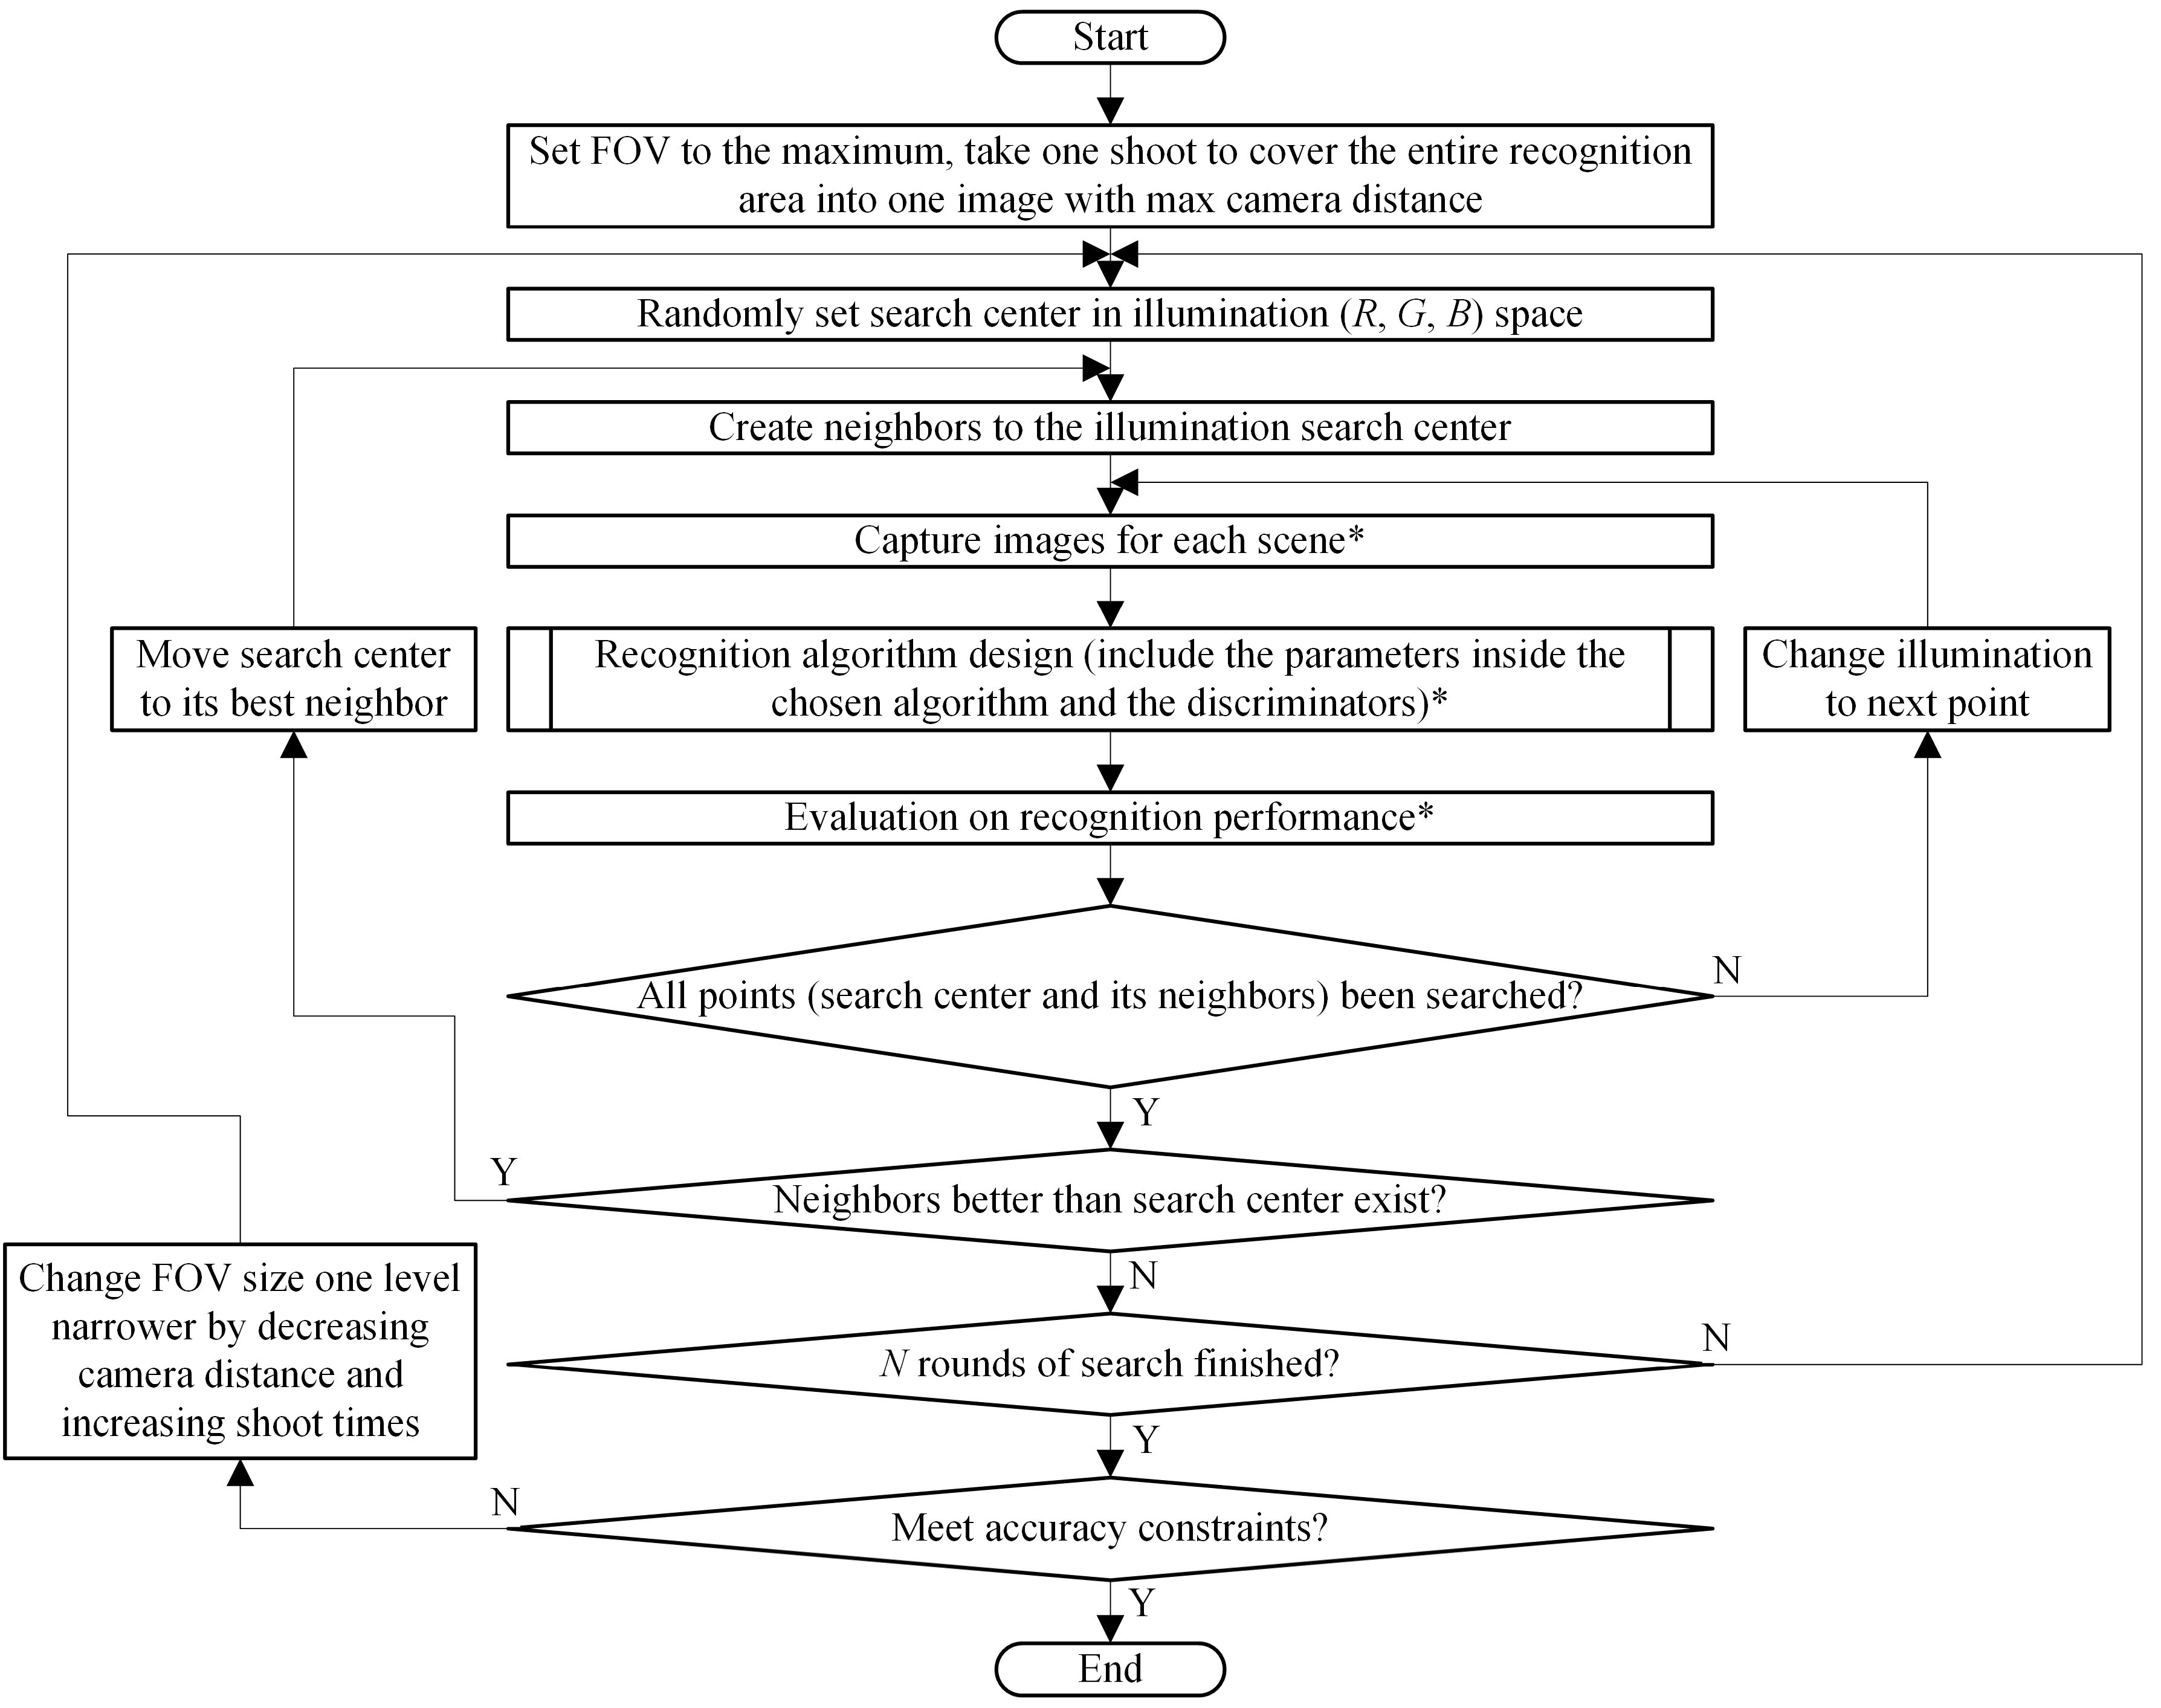
3. Methodology
3.1. Algorithm Overview
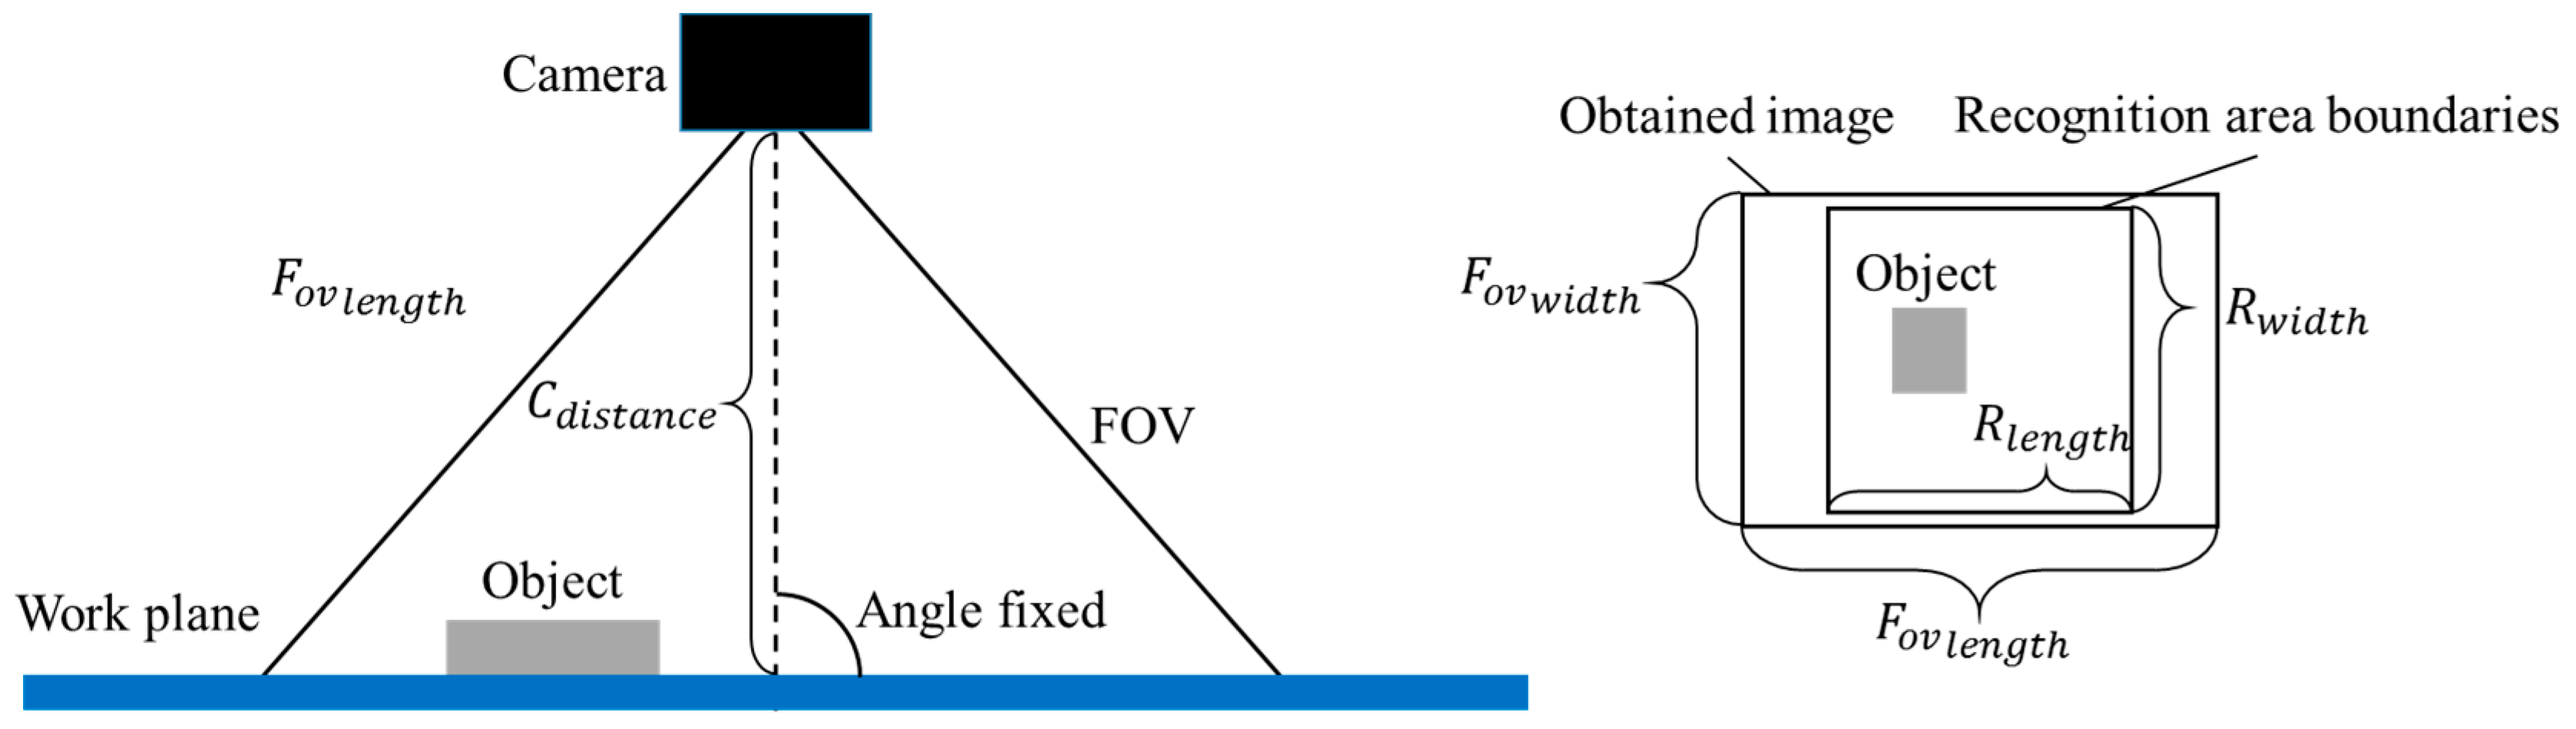
3.2. FOV Design
3.3. Illumination Design
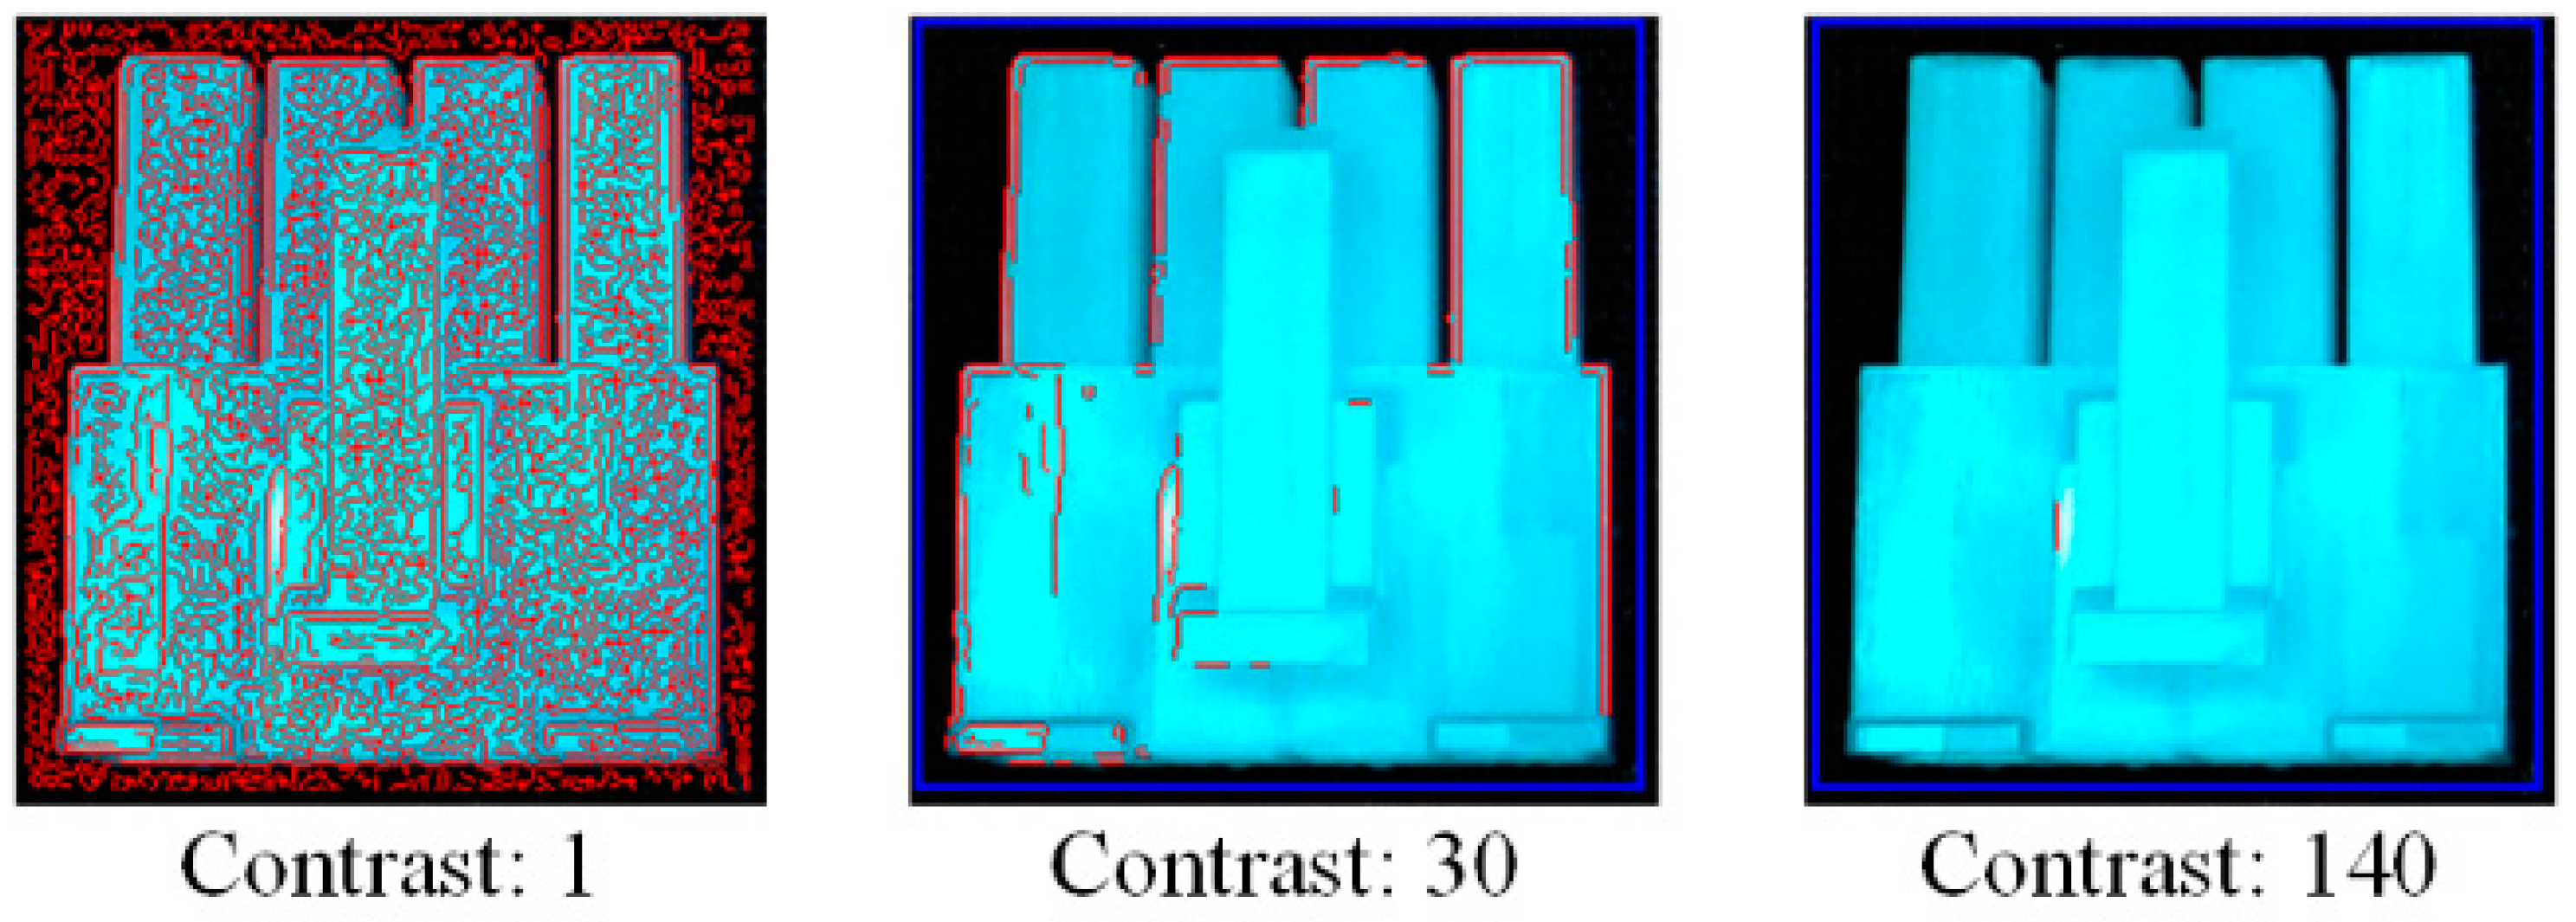
3.4. Recognition Algorithm Design
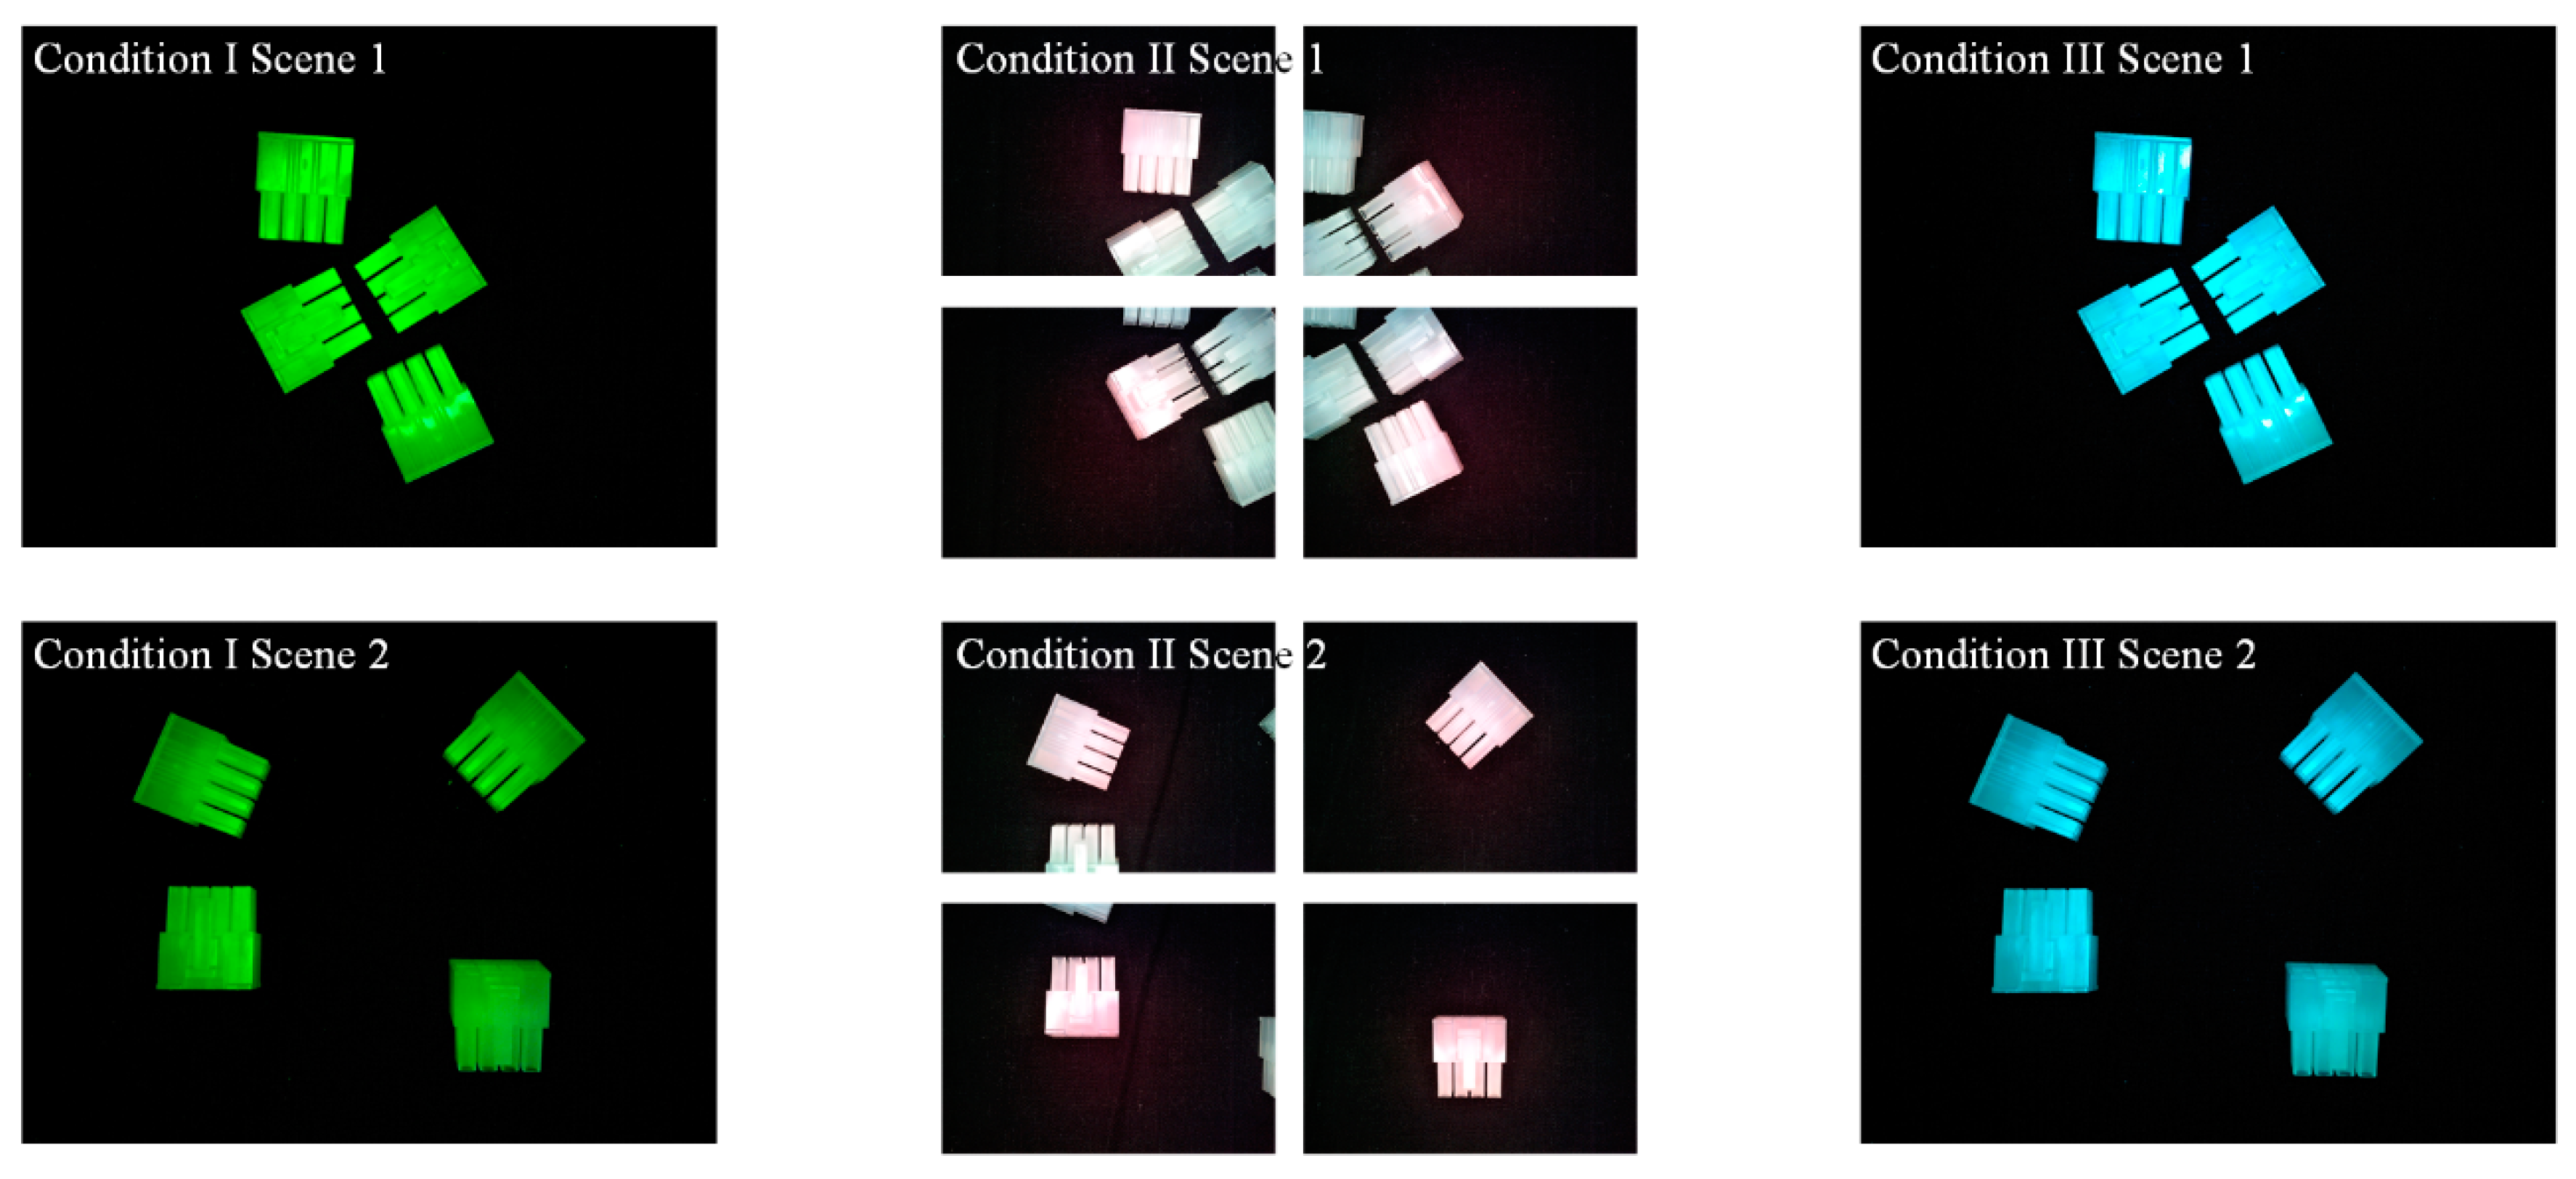
4. Evaluation Experiment
4.1. Experimental Setup
4.2. Results
5. Discussion
6. Conclusions
Author Contributions
Conflicts of Interest
References
- Newman, T.S.; Jain, A.K. A survey of automated visual inspection. Comput. Vis. Image Underst. 1995, 61, 231–262. [Google Scholar] [CrossRef]
- Golnabi, H.; Asadpour, A. Design and application of industrial machine vision systems. Robot. Comput. Integr. Manuf. 2007, 23, 630–637. [Google Scholar] [CrossRef]
- Malamas, E.N.; Petrakis, E.G.M.; Zervakis, M.; Petit, L.; Legat, J.D. A survey on industrial vision systems, applications and tools. Image Vis. Comput. 2003, 21, 171–188. [Google Scholar] [CrossRef]
- Cowan, C.K.; Kovesi, P.D. Automatic sensor placement from vision task requirements. IEEE Trans. Pattern Anal. Mach. Intell. 1988, 10, 407–416. [Google Scholar] [CrossRef]
- Tarabanis, K.; Tsai, R.Y.; Allen, P.K. Automated sensor planning for robotic vision tasks. In Proceedings of the IEEE International Conference on Robotics and Automation, Sacramento, CA, USA, 9–11 April 1991; pp. 76–82. [Google Scholar]
- Tarabanis, K.; Tsai, R.Y. Computing viewpoints that satisfy optical constraints. In Proceedings of the Computer Vision and Pattern Recognition, Maui, HI, USA, 3–6 June 1991; pp. 152–158. [Google Scholar]
- Hutchinson, S.A.; Kak, A.C. Planning sensing strategies in a robot work cell with multi-sensor capabilities. IEEE Trans. Robot. Autom. 1989, 5, 407–416. [Google Scholar] [CrossRef]
- Cameron, A.; Wu, H.L. Identifying and localizing electrical components: A case study of adaptive goal-directed sensing. In Proceedings of the IEEE International Symposium on Intelligent Control, Arlington, VA, USA, 13–15 August 1991; pp. 495–500. [Google Scholar]
- Thuilot, B.; Martinet, P.; Cordesses, L.; Gallice, J. Position based visual servoing: Keeping the object in the field of vision. In Proceedings of the IEEE International Conference on Robotics and Automation, Washington, DC, USA, 11–15 May 2002. [Google Scholar]
- Rahimian, P.; Kearney, K.J. Optimal camera placement for motion capture systems. IEEE Trans. Vis. Comput. Graph. 2017, 3, 1209–1221. [Google Scholar] [CrossRef] [PubMed]
- Ito, A.; Tsujiuchi, N.; Okada, Y. Multipurpose optimization of camera placement and application to random bin-picking. In Proceedings of the 41st Annual Conference of the Industrial Electronics Society, Yokohama, Japan, 9–12 November 2015; pp. 528–533. [Google Scholar]
- Foix, S.; Alenyà, G.; Torras, C. 3D Sensor planning framework for leaf probing. In Proceedings of the Intelligent Robots and Systems (IROS), Hamburg, Germany, 28 September–2 October 2015; pp. 6501–6506. [Google Scholar]
- Murase, H.; Nayar, S.K. Illumination planning for object recognition using parametric eigenspaces. IEEE Trans. Pattern Anal. Mach. Intell. 1994, 6, 1219–1227. [Google Scholar] [CrossRef]
- Pfeifer, T.; Wiegers, L. Reliable tool wear monitoring by optimized image and illumination control in machine vision. Measurement 2000, 28, 209–218. [Google Scholar] [CrossRef]
- Yi, S.; Haralick, R.M.; Shapiro, L.G. Automatic sensor and light source positioning for machine vision. In Proceedings of the 10th International Conference on Pattern Recognition, Atlantic City, NJ, USA, 16–21 June 1990; pp. 55–59. [Google Scholar]
- Eltoft, T.; deFigueiredo, R.J.P. Illumination control as a means of enhancing image features in active vision systems. IEEE Trans. Pattern Anal. Mach. Intell. 1995, 4, 1520–1530. [Google Scholar] [CrossRef] [PubMed]
- Slusallek, P.; Seidel, H.P. Vision—An architecture for global illumination calculations. IEEE Trans. Vis. Comput. Graph. 1995, 1, 77–96. [Google Scholar] [CrossRef]
- Cang, N.Y.C.; Wu, C.C. Automatic optimal lighting adjustment and control for vision recognition. In Proceedings of the 14th IFToMM World Congress, Taipei, Taiwan, 25–30 October 2015. [Google Scholar]
- Aoki, S.; Nagao, T. Automatic construction of tree-structural image transformation using genetic programming. In Proceedings of the IEEE 10th International Conference on Image Analysis and Processing, Venice, Italy, 27–29 September 1999. [Google Scholar]
- Shirakawa, S.; Nagao, T. Genetic Image Network (GIN): Automatically construction of image processing algorithm. In Proceedings of the International Workshop on Advanced Image Technology (IWAIT), Bangkok, Thailand, 8–9 January 2007. [Google Scholar]
- Bai, H.; Yata, N.; Nagao, T. Automatic finding of optimal image processing for extracting concrete image cracks using features ACTIT. IEEJ Trans. Electr. Electron. 2012, 7, 308–315. [Google Scholar] [CrossRef]
- Lillywhite, K.; Tippetts, B.; Lee, D. Self-tuned evolution-constructed features for general object recognition. Pattern Recognit. 2012, 45, 241–251. [Google Scholar] [CrossRef]
- Lillywhite, K.; Lee, D.; Tippetts, B.; Archibald, J. A feature construction method for general object recognition. Pattern Recognit. 2013, 46, 3300–3314. [Google Scholar] [CrossRef]
- Kumar, R.; Lal, S.; Kumar, S.; Chand, P. Object detection and recognition for a pick and place robot. In Proceedings of the 2014 Asia-Pacific World Congress on Computer Science and Engineering (APWC on CSE), Nadi, Fiji, 4–5 November 2014. [Google Scholar]
- Ogata, T.; Tsujimoto, K.; Yukisawa, T.; Huang, Y.J.; Arai, T.; Ueyama, T.; Takada, T.; Ota, J. Automated design of image recognition process for picking system. Int. J. Autom. Technol. 2016, 10, 737–752. [Google Scholar] [CrossRef]
- Ogata, T.; Yukisawa, T.; Arai, T.; Ueyama, T.; Takada, T.; Ota, J. Automated design of image recognition in capturing environment. IEEJ Trans. Electr. Electron. 2017, 12, S49–S55. [Google Scholar] [CrossRef]
- Chen, Y.; Ogata, T.; Ueyama, T.; Takada, T.; Ota, J. Automated design of the field-of-view, illumination, and image pre-processing parameters of an image recognition system. In Proceedings of the 13th IEEE Conference on Automation Science and Engineering (CASE), Xi’an, China, 20–23 August 2017; pp. 1079–1084. [Google Scholar]
- Gevers, T.; Smeulders, A.W.M. Color-based object recognition. Pattern Recognit. 1999, 32, 453–464. [Google Scholar] [CrossRef]
- Drew, M.S.; Wei, J.; Li, Z.N. Illumination-invariant color object recognition via compressed chromaticity histograms of color-channel-normalized images. In Proceedings of the 6th International Conference on Computer Vision, Bombay, India, 4–7 January 1998; pp. 533–540. [Google Scholar]
- Alferez, R.; Wang, Y.F. Geometric and illumination invariants for object recognition. IEEE Trans. Pattern Anal. Mach. Intell. 1999, 21, 505–536. [Google Scholar] [CrossRef]
- Diplaros, A.; Gevers, T.; Patras, I. Combining color and shape information for illumination-viewpoint invariant object recognition. IEEE Trans. Image Process. 2006, 15, 1–11. [Google Scholar] [CrossRef] [PubMed]
- Bala, R.; Eschbach, R. Spatial color-to-grayscale transform preserving chrominance edge information. In Proceedings of the 12th Color and Imaging Conference, Scottsdale, AZ, USA, 9–12 November 2004; pp. 82–86. [Google Scholar]
- Grundland, M.; Dodgson, N. Decolorize: Fast, contrast enhancing, color to grayscale conversion. Pattern Recognit. 2007, 40, 2891–2896. [Google Scholar] [CrossRef]
- Gooch, A.A.; Olsen, S.C.; Tumblin, J.; Gooch, B. Color2Gray: Salience-preserving color removal. ACM Trans. Graph. 2005, 24, 634–639. [Google Scholar] [CrossRef]
- Kanan, C.; Cottrell, G.W. Color-to-grayscale: Does the method matter in image recognition? PLoS ONE 2012, 7, e29740. [Google Scholar] [CrossRef] [PubMed]


| Design Factor | Name | Description | Range |
|---|---|---|---|
| FOV | Shoot time | Number of images required in one recognition for the entire area | 1, 4, …, n2 |
| Camera distance | Represents FOV size | Determined by shoot time | |
| Illumination | Light strength (Red) | Strength of red component in illumination | [0, 255] |
| Light strength (Green) | Strength of green component in illumination | [0, 255] | |
| Light strength (Blue) | Strength of blue component in illumination | [0, 255] | |
| Recognition algorithm | Discriminator | Thresholds for classifying different kinds of recognition objects | (0, 1) |
| Contrast | Contrast value to extract contour model from template | [0, 255] |
| Condition | Illumination Channel(s) | Increment of Illumination Parameter(s) | Recognition Image(s) |
|---|---|---|---|
| I | G only | 1 | Greyscale |
| II | RGB | 15 | Greyscale |
| III | RGB | 15 | R-channel |
| Rank | R | G | B | FOV | Contrast | Fmeasure | Positional Error (mm) | Angular Error (°) |
|---|---|---|---|---|---|---|---|---|
| 1 | 0 | 232 | 0 | wide | 1 | 0.93 | 0.64 | 2.1 |
| 2 | 0 | 79 | 0 | narrow | 3 | 0.93 | 0.58 | 3.4 |
| 3 | 0 | 84 | 0 | narrow | 3 | 0.86 | 0.35 | 3.6 |
| Rank | R | G | B | FOV | Contrast | Fmeasure | Positional Error (mm) | Angular Error (°) |
|---|---|---|---|---|---|---|---|---|
| 1 | 195 | 120 | 75 | narrow | 4 | 1.00 | 0.60 | 3.1 |
| 2 | 240 | 45 | 75 | narrow | 3 | 1.00 | 0.92 | 3.0 |
| 3 | 105 | 30 | 150 | narrow | 4 | 1.00 | 1.15 | 2.9 |
| Rank | R | G | B | FOV | Contrast | Fmeasure | Positional Error (mm) | Angular Error (°) |
|---|---|---|---|---|---|---|---|---|
| 1 | 15 | 225 | 240 | wide | 11 | 1.00 | 0.32 | 0.4 |
| 2 | 0 | 225 | 150 | wide | 11 | 1.00 | 0.50 | 0.4 |
| 3 | 45 | 225 | 210 | wide | 9 | 1.00 | 0.62 | 0.4 |
© 2018 by the authors. Licensee MDPI, Basel, Switzerland. This article is an open access article distributed under the terms and conditions of the Creative Commons Attribution (CC BY) license (http://creativecommons.org/licenses/by/4.0/).
Share and Cite
Chen, Y.; Ogata, T.; Ueyama, T.; Takada, T.; Ota, J. Automated Field-of-View, Illumination, and Recognition Algorithm Design of a Vision System for Pick-and-Place Considering Colour Information in Illumination and Images. Sensors 2018, 18, 1656. https://doi.org/10.3390/s18051656
Chen Y, Ogata T, Ueyama T, Takada T, Ota J. Automated Field-of-View, Illumination, and Recognition Algorithm Design of a Vision System for Pick-and-Place Considering Colour Information in Illumination and Images. Sensors. 2018; 18(5):1656. https://doi.org/10.3390/s18051656
Chicago/Turabian StyleChen, Yibing, Taiki Ogata, Tsuyoshi Ueyama, Toshiyuki Takada, and Jun Ota. 2018. "Automated Field-of-View, Illumination, and Recognition Algorithm Design of a Vision System for Pick-and-Place Considering Colour Information in Illumination and Images" Sensors 18, no. 5: 1656. https://doi.org/10.3390/s18051656