Article

UV-Vis Spectroscopy: A New Approach for Assessing the Color Index of Transformer Insulating Oil

1
Institute of Power Engineering, College of Engineering, Universiti Tenaga Nasional, Kajang 43000, Selangor, Malaysia
2
Tenaga Nasional Berhad (TNB) Research Sdn. Bhd., Bandar Baru Bangi, Kajang 43000, Selangor, Malaysia
*
Author to whom correspondence should be addressed.
Sensors 2018, 18(7), 2175; https://doi.org/10.3390/s18072175
Submission received: 30 April 2018 / Revised: 8 June 2018 / Accepted: 15 June 2018 / Published: 6 July 2018
(This article belongs to the Special Issue Sensors for Fault Detection)

Abstract

:
Monitoring the condition of transformer oil is considered to be one of the preventive maintenance measures and it is very critical in ensuring the safety as well as optimal performance of the equipment. Various oil properties and contents in oil can be monitored such as acidity, furanic compounds and color. The current method is used to determine the color index (CI) of transformer oil produces an error of 0.5 in measurement, has high risk of human handling error, additional expense such as sampling and transportations, and limited samples can be measured per day due to safety and health reasons. Therefore, this work proposes the determination of CI of transformer oil using ultraviolet-to-visible (UV-Vis) spectroscopy. Results show a good correlation between the CI of transformer oil and the absorbance spectral responses of oils from 300 nm to 700 nm. Modeled equations were developed to relate the CI of the oil with the cutoff wavelength and absorbance, and with the area under the curve from 360 nm to 600 nm. These equations were verified with another set of oil samples. The equation that describes the relationship between cutoff wavelength, absorbance and CI of the oil shows higher accuracy with root mean square error (RMSE) of 0.1961.

1. Introduction

Power transformer is one of the main components in any transmission networks and they are responsible for transmitting electric power over long distances with minimal power loss. It is essential for power transformer to operate optimally in order to provide continuous and stable electricity supply in assuring homes and businesses run smoothly with minimum disruptions. Any failures in power transformers could lead to huge problems to both consumers and the power utilities. Therefore, it is important to carefully maintain, inspect, and monitor the power transformer over times.
The lifetime of power transformer is generally related to the degradation of insulating materials in power transformer. Although various sensors such as temperature sensor, pressure sensor, and humidity sensor are installed for online monitoring, the output of these sensors cannot provide clear indication on the conditions of the power transformer. One of the insulating materials is the transformer oil which acts as an electrical insulator and also a coolant for the power transformer. After years of services, the transformer oil is subjected to thermal and electrical stresses [1,2,3], hence causing oxidative stress on the oil. With the presence of oxygen and moisture [4], polar compounds and oil sludge are formed [5], and these oxidative by-products affect the quality of the transformer oil. The quality of the oil can be reflected on the properties of the oil and its content, such as acidity, dielectric breakdown voltage, dissolved gases, and furanic compounds [6]. Thus, many diagnostic methods were introduced and are capable of providing reliable assessment on the condition of power transformer in order to detect early faults and avoid potential failures [7].
Conventionally, the quality of the transformer oil is assessed based on its properties using IEC 60422 standard [6]. Various properties are tested with different techniques. For instance, dissolved gases are conventionally measured using gas chromatography (GC) [8], and interfacial tension of the oil is typically measured using the Ring method [9]. Generally, these techniques involve complex sample preparation, tedious measurement procedures, expensive instruments, and require trained experts to conduct the measurements. Thus, researchers are proposing alternative solution to assess the quality of the oil. Differential Scanning Calorimetry (DSC) method [10], dielectric dissipation factor measurements [11], infrared (IR) spectroscopy [11], capacitance measurement [12], and photoluminescence spectroscopy [13] have been proposed recently to evaluate the degradation of the transformer oil. Recently, as an attractive and promising analytical tool, the optical spectroscopy technique starts to emerge in assessing the degradation of transformer oil.
Optical spectroscopy studies the interaction of light by matter [14]. It is a non-destructive test, which provides rapid result analysis, and it can be used for qualitative and quantitative analysis [15]. The technique also gives high sensitivity measurements and does not require complex sample preparation and calibration. For instance, Deepa et al. [16] uses multidimensional fluorescence techniques like synchronous fluorescence spectroscopy (SFS) and excitation emission matrix fluorescence (EEMF) to determine the unique characteristic of degraded transformer oil in the spectrum. Kamenchuk et al. [17] have also applied nuclear magnetic resonance (NMR) in determining the chemical composition of the degraded oils. To provide complementary interpretations and full product description, Godinho et al. [18] combined data from three different optical sensing techniques, which are the near-infrared (NIR), EEMF, and NMR spectroscopy, to evaluate the quality of the transformer oil. Bakar et al. [9] have also proposed to measure the interfacial tension of transformer oil using ultraviolet-to-visible (UV-Vis) spectroscopy which reflects the insulation aging activity in the power transformer. Hussain et al. [19] have also made an evaluation of the state of the transformer oil using the combination of UV-Vis, Fourier transformed infrared (FTIR), and NMR spectroscopy techniques. Results show that each sensing technique is able to provide different analysis in determining the degradation level of the transformer oil.
To assess the degradation level of transformer oil using optical sensing techniques, researchers either determines the special characteristic of degraded transformer oil in the spectrum [16], or the change in concentration of certain content in transformer oil, such as inhibitor content [17] and furanic compounds [18], or the change in properties of transformer oil such as interfacial tension [20]. The color of the transformer oil can also be used to assess the degradation level of the transformer oil [7,21]. Conventionally, using the American Society for Testing and Materials (ASTM) D 1500 standard (Standard test method for ASTM Color of Petroleum Product (ASTM Color Scale) ) [22], the color of the transformer oil is determined using a color comparator, and represented by a color index (CI) from a scale. The scale contains 16 ASTM CI, with increment in steps of 0.5, starting from 0.5 for the lightest color to 8.0 for the darkest color. However, this method has its disadvantages. Firstly, the step size of 0.5 CI is fairly large. If an exact match is not found for the sample, the darker of the two ASTM colors is reported instead. In many cases, the sample does not fall exactly on the 16 values used in the ASTM D 1500. Secondly, this method relies on the manual visual inspection by an operator and the results may also be affected by the quality of standard light source. Different operators working on an identical oil sample could report a different CI. Likewise, in color measurement of palm oil, an operator is also required to manually operate Lovibond® Tintometer [23] to determine the right color index of the palm oil. Subsequently, operators that carry out this measurement also need to go for eye checking every 3–6 months due to safety and health issues. According to occupational safety and health guideline, long exposure time with high intensity of visible light on the eye could pose health issues such as headache and eye-related problems. Finally, this issue leads to limited number of samples per day for color index analysis as the operator is required to rest their eyes after testing each sample.
Hence, a more accurate, scientific and automated method in observing the color of the oil is needed. Therefore, this paper proposes to use UV-Vis spectroscopy as an optical sensing technique to determine the color index of transformer oil. The application of UV-Vis spectroscopy in sensing the color of oil dated as early as 1999 where Chantrapornchai et al [24] studied on the spectral reflectance and color of oil-in-water emulsions. Tan et al. [23] have proposed a prototype colorimeter that utilizes UV-Vis spectroscopy to determine the color of palm oil and made comparison between their propose method and the conventional method. UV-Vis spectroscopy also has been widely used in evaluating olive oil since the components within such as chlorophyll and lutein are responsible for the color of olive oil [25,26]. Besides palm oil and olive oil, researchers have also applied the UV-Vis spectroscopy in determining the color in crude petroleum oil [27], hydraulic oil [28], automotive lubricating oil [29], essential oil [30], pumpkin seed oil [31], and edible oils (sunflower oil, soya oil, corn oil, canola oil, and olive oil) [32]. Moreover, Hadjadj et al. [21] have proposed the determination of the correlation between proposed parameters, which are turbidity and dissolved decay product (DDP) value, and the traditional parameters such as interfacial tension, acidity and color index of transformer oil using UV-Vis spectroscopy. Results show a good correlation between the parameters, but the color index is instead based on the 18 Gardner color scale in accordance with ASTM D 1544 [21]. We have also demonstrated the possibility of determining the CI of transformer oil based on ASTM D 1500 using UV-Vis spectroscopy [33]. In this work, the utilization of UV-Vis spectroscopy to determine the CI of transformer oil is fully established through a detailed study on the optical spectral response of oil samples with different CI. Furthermore, mathematical models that describe the relationship between the optical response of the oil sample and its respective CI were formulated and verified.

2. Materials and Methods

2.1. Sampling and Sample Design

For the purpose of this study, transformer oil samples were sampled from different operating transformers. The transformer oil used in these power transformers are generally naphthenic-based transformer oil without additives (uninhibited), produced by Hyrax, Petronas or Shell. The transformer oil product typically contains 55% naphthenic carbons, 38% paraffinic carbons and 7% aromatic carbons, and it fulfills the performance requirement set by the (International Electrotechnical Commission) IEC 60296 standard. The procedure of collecting and transporting these samples adhere strictly to the IEC 60475 standard [34]. This is to ensure that there was no contamination and mislabeled of the oil samples that would affect the analysis. By taking this into account, two 1 litre amber glass bottles were prepared for transformer oil sampling. One bottle of the sample was sent to an accredited lab for conventional analysis, while the other bottle was used for the purpose of this study. This was done to guarantee that there was minimal time gap between the conventional lab analysis and the experiment of this study. In accordance to the ASTM D 1500 standard, the conventional analysis involves a color comparator to measure the color index of oil samples and report them with one of the 16 ASTM color index. Throughout this paper, the color index measurement carried out at the accredited lab in accordance to the ASTM D 1500 standard will be referred to as conventional analysis or conventional measurement.

2.2. Optical Measurement Setup

The samples sent for the purpose of this study were measured for their absorbance spectrum to the range of 200 nm to 800 nm. The measurements were carried out using Agilent Cary 5000 Ultraviolet-to-Visible-to-Near-Infrared (UV-Vis-NIR) spectrophotometer (Agilent Technologies, Petaling Jaya, Malaysia). The Cary 5000 is a double beam spectrophotometer that can operate in the range of 200 nm to 3300 nm. The general operation of a double spectrophotometer can be found in [35]. Approximately 3 mL of oil sample and clean uninhibited transformer oil are transferred using a 5-mL disposable plastic pipette into quartz cuvette which has an outer cell dimension of 12 mm × 12 mm × 44 mm, with an optical path-length of 10 mm. The clean oil serves as the reference for the measurement. For each oil sample, the optical spectrum measurements were repeated 3 times to ensure its consistency and repeatability. During the spectrum scan, the light beam passes through both oil sample and reference sequentially and optical transmittance was recorded. The absorbance values were calculated by applying the Beer-Lambert Law [36] as in Equation (1).
Abs = −log10(SλBλ / RλBλ) = ελcl,
where, Abs is the absorbance, Sλ is the transmittance of light passing through the sample in sampling slot, Rλ is the transmittance of light passing through the sample in reference slot, Bλ is the baseline, ελ is the absorbance coefficient of the absorbing sample at a certain wavelength, c is the concentration of the absorbing sample, and l is the path-length traversed by the light.

2.3. Initial Results and Modification

Figure 1 shows the absorbance spectral response together with the noise of oil samples with CI of 1.5, 3.0, 5.0 and 6.5.
Initial results show that noises can be observed at the peak absorbance of the oil samples with CI of 3.0 or higher, and the spectral response saturates at Abs > 5. Referring to Equation (1), if the ratio of Sλ to Rλ is extremely low, Abs will be extremely high, resulting in noises due to the fluctuation of Sλ. In order to increase the ratio of Sλ to Rλ, Sλ has to be increased or Rλ has to be decreased. Sλ cannot be increased further as the brightness of the light source in the spectrometer affects both sample and reference sides. Therefore, Rλ needs to be decreased to remove the noises. To reduce Rλ, a neutral density (ND) filter (model: FNDU-20C02-0.1), which provides significant optical attenuation (Transmittance = 1%–3%) in the UV-Vis region, was applied at the reference slot of the spectrometer. The noises can also be reduced by decreasing l, which means a shorter path-length cuvette is used. However this method reduces the interaction of light with the oil samples, thus reducing the sensitivity of the measurement. Due to the shortcomings of a shorter path-length, the ND filter was chosen to reduce the measurement noise. The outcome is shown in Figure 2, where the noises at the peaks (top) of absorbance spectral response of the same four oil samples in Figure 1, are eliminated and clear smooth optical absorbance spectrum can be observed.

3. Final Results and Data Analysis

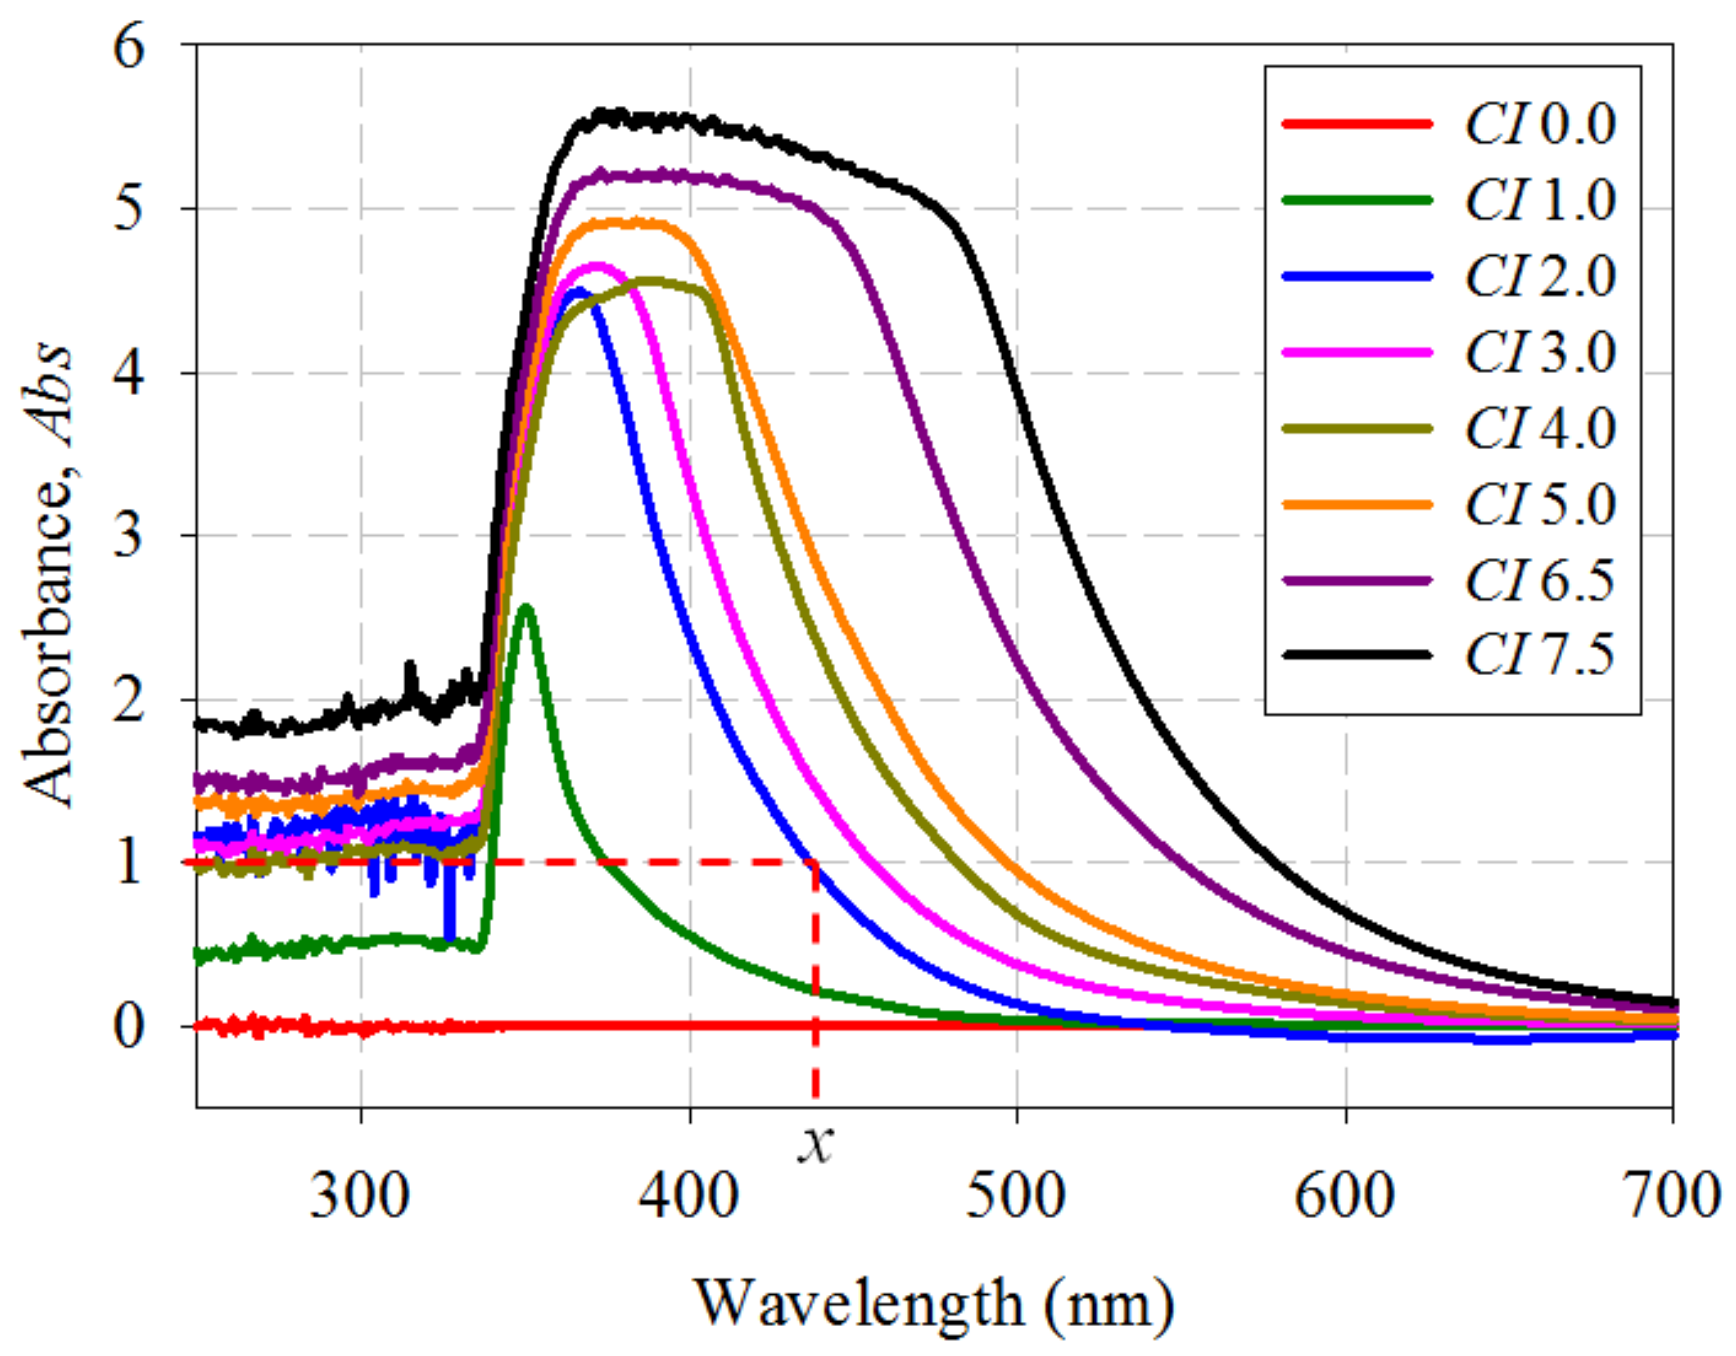
3.1. Absorbance Spectra of Transformer Oil Samples

The oil samples were re-measured with the application of the ND filter. Figure 3 shows the absorbance spectral response of several oil samples with increasing CI.
Figure 3 shows clearly that there is a direct relationship between the absorbance spectral response of the oil samples and their CI. The optical bandwidth of the spectrum at a certain Abs will be referred as the cutoff wavelength (CW) throughout the paper. For instance, the dotted line across the graph and marker x represents the cutoff wavelength (CW) at Abs = 1.0, for oil sample with CI of 2.0, which is 437 nm. It can be observed that the lowest CI of 1.0 shows the lowest peak absorbance and the shortest CW at Abs = 1.0, while the highest CI of 7.5 shows the highest peak absorbance and the longest CW at Abs = 1.0. It is worth noting that the sample with CI of 0.0 represents the new uninhibited transformer oil and it is used as a reference only.

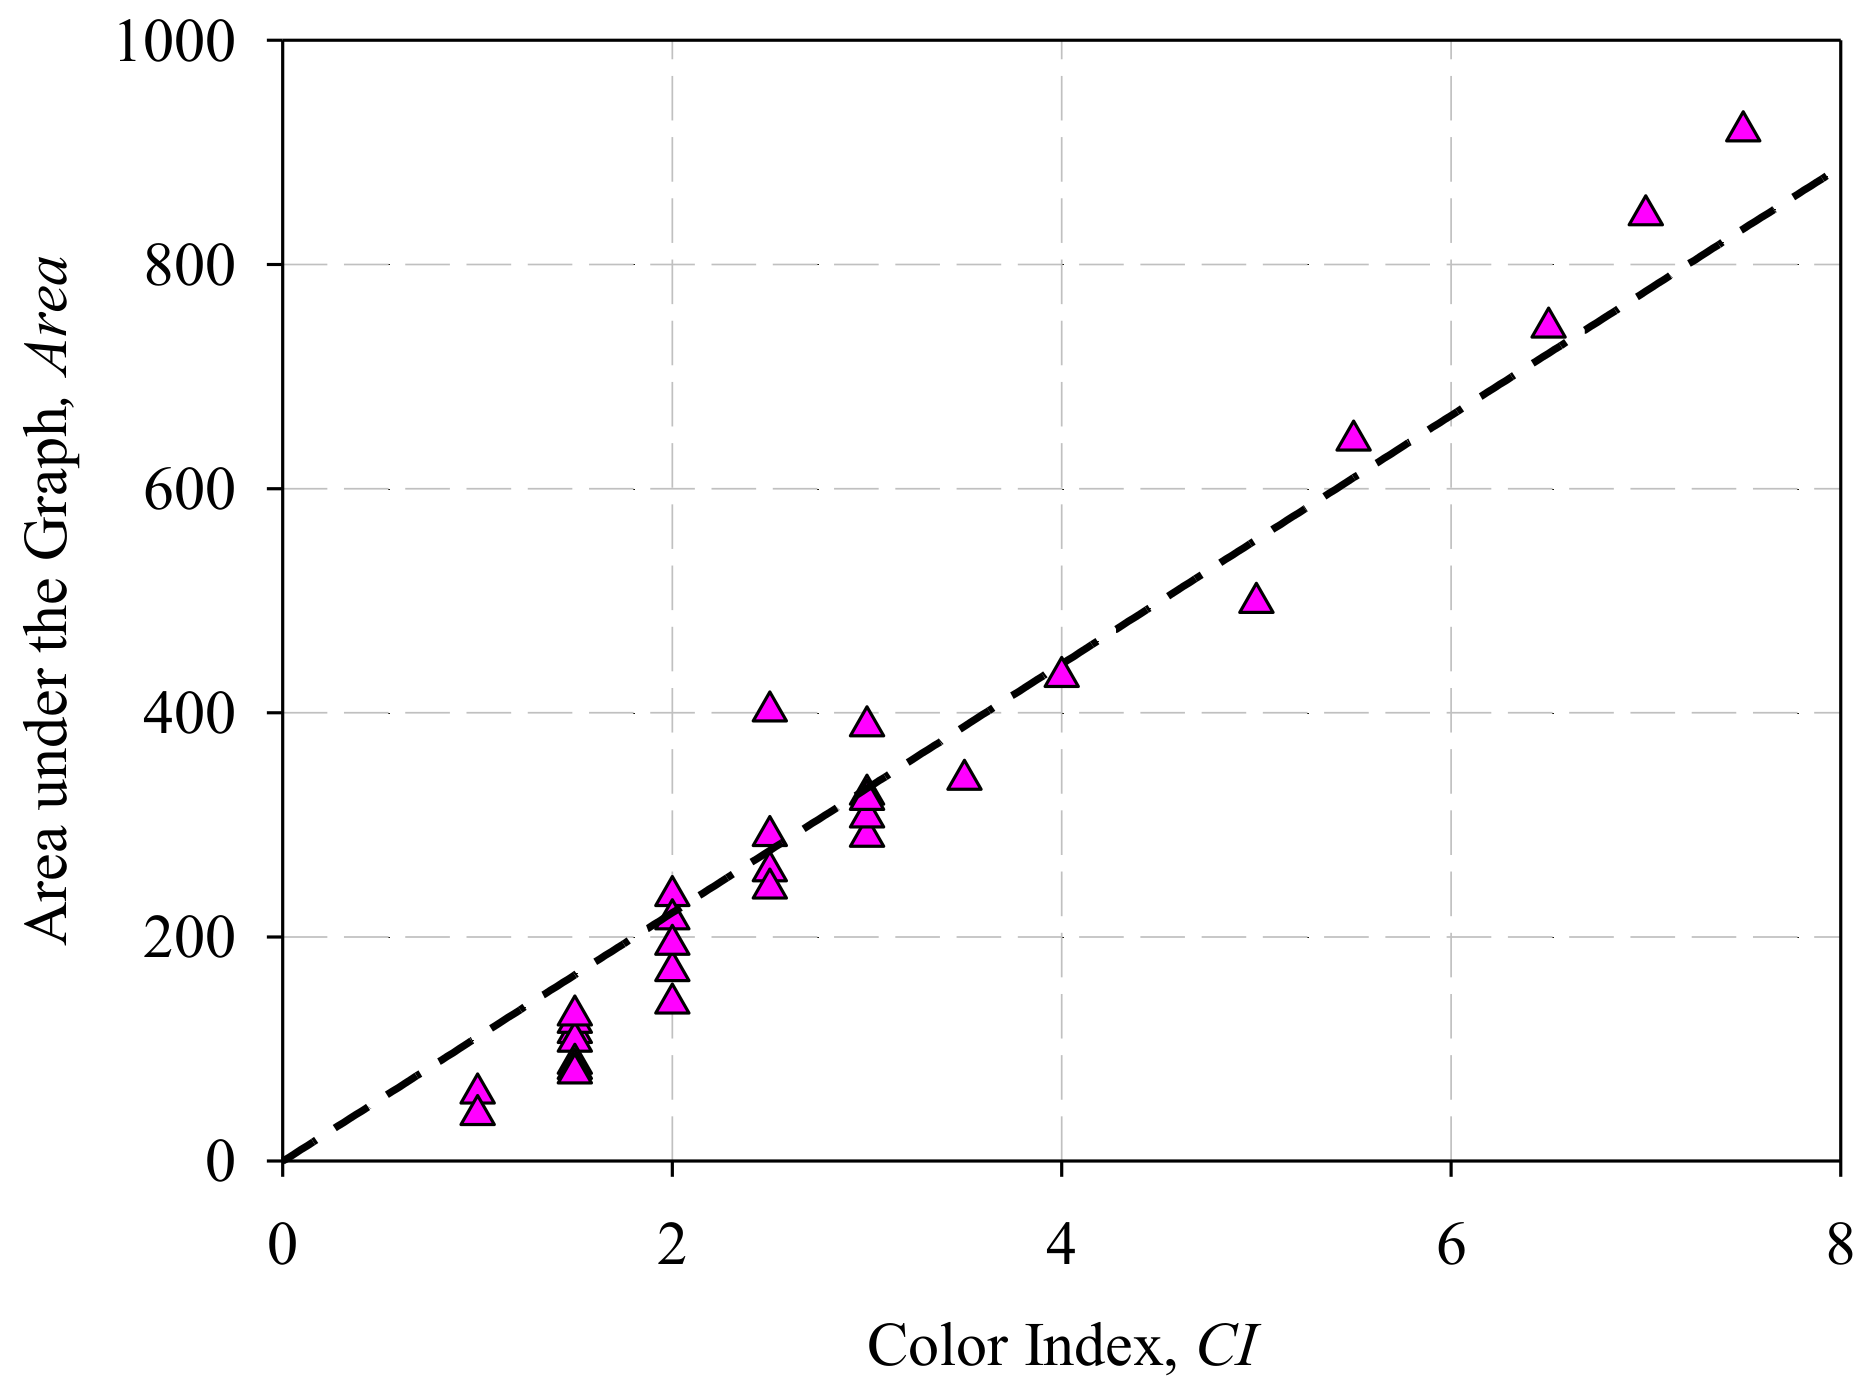
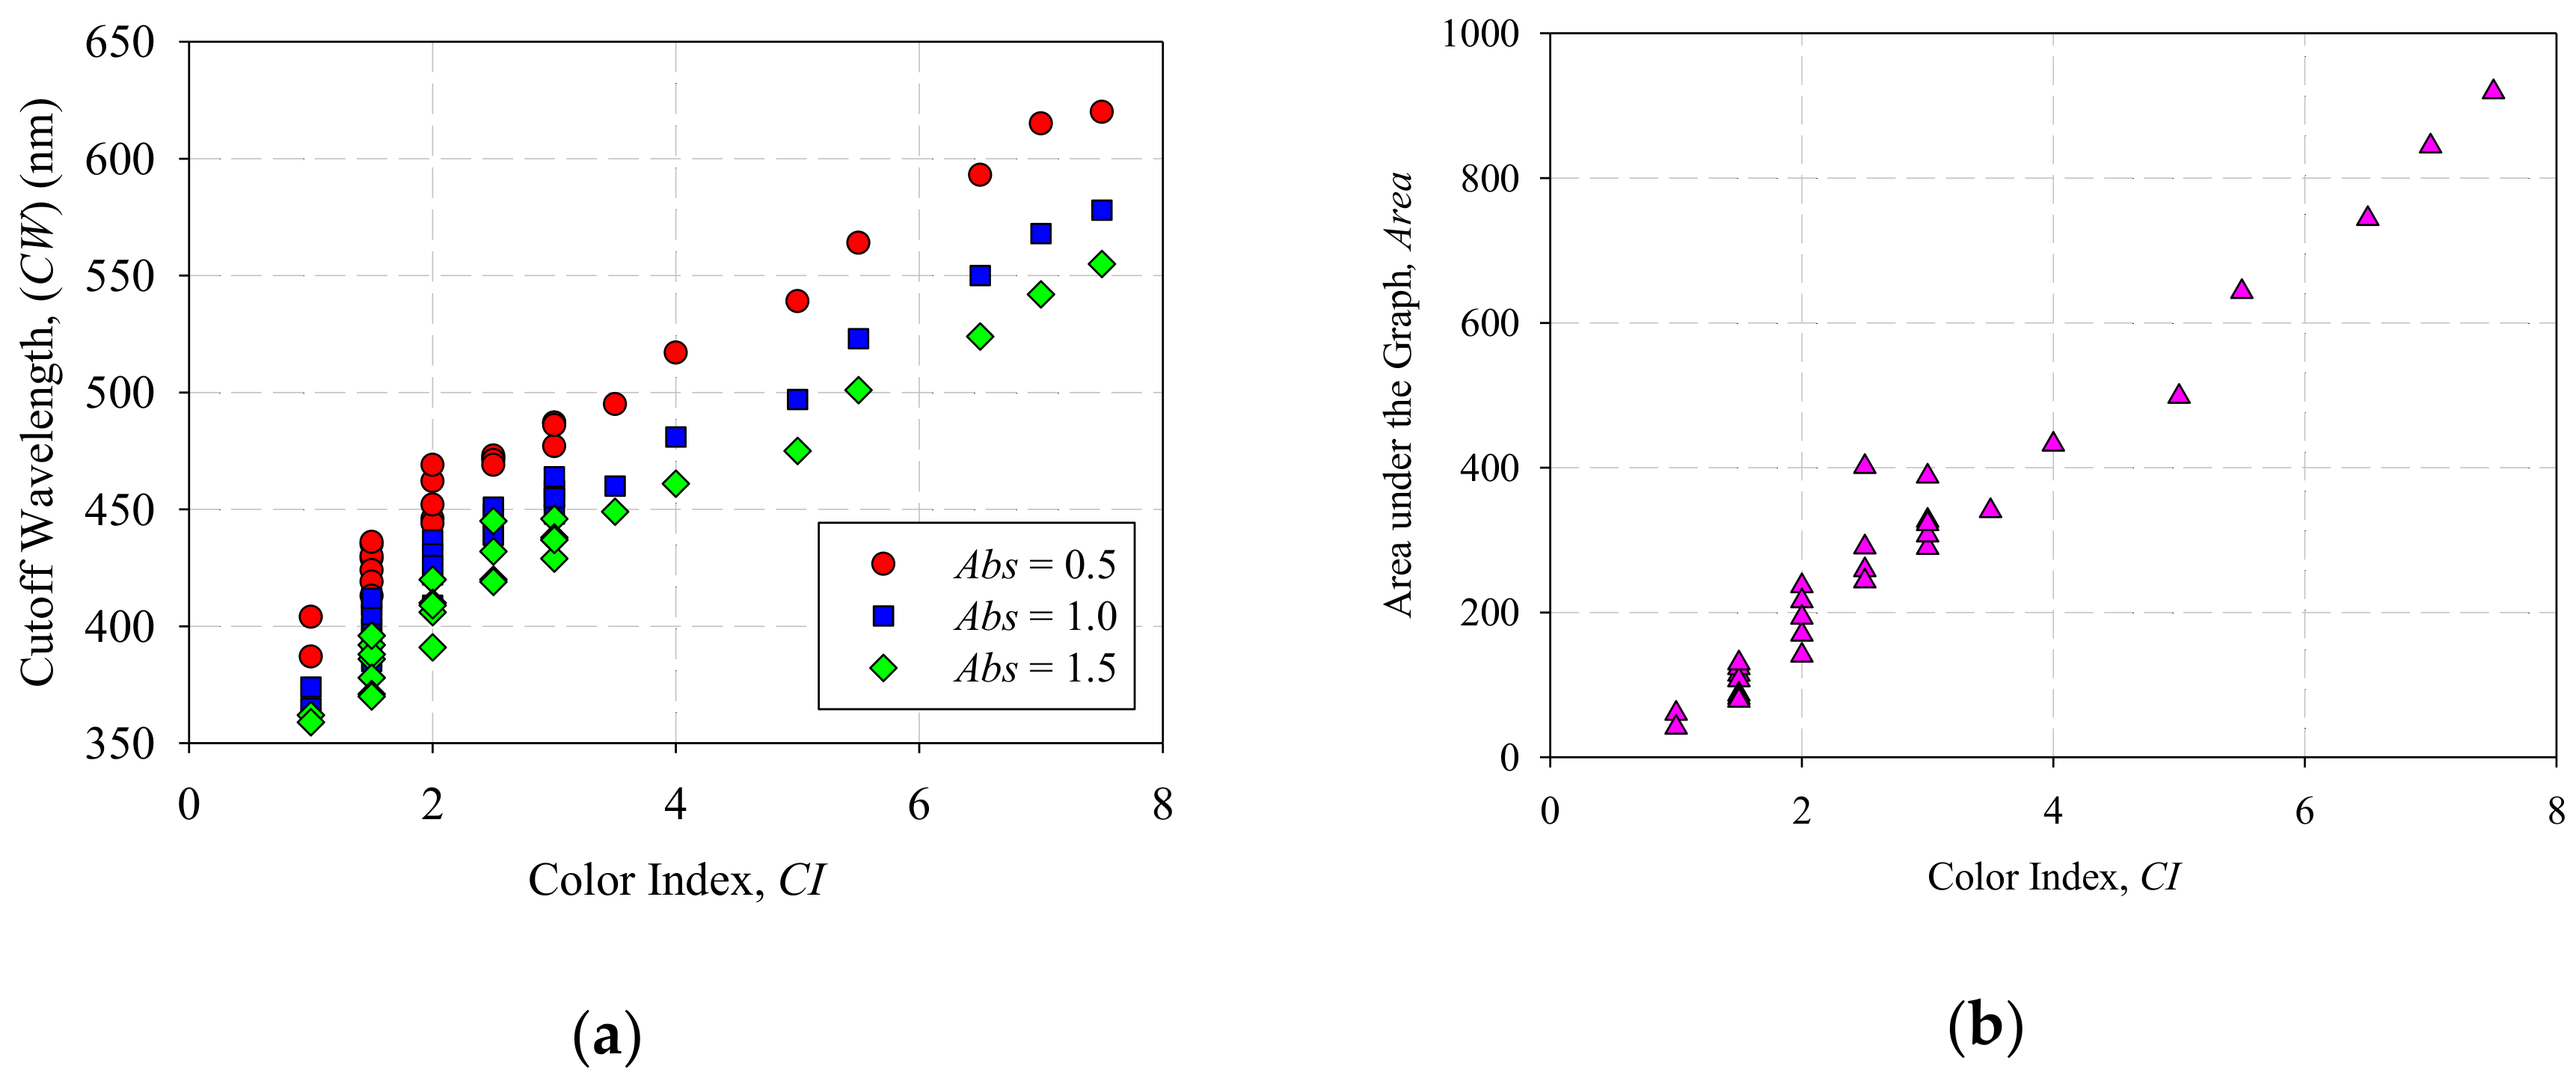
3.2. Mathematical Modeling

Further analysis on Figure 3 shows that different variables can be used to correlate with CI. If a different Abs is chosen, the CW value will change accordingly. Figure 4a shows the plot of CI against CW for Abs = 0.5, 1.0 and 1.5 respectively. Referring to [21], Hadjadj et al. calculates the integration of the area under the graph (Area) from 360 nm to 600 nm to determine the DDP value in accordance to the ASTM D 6802 [37], and then relating it with the 18 Gardner color index in accordance with ASTM D 1544 [21]. Similarly, the same method can also be applied to correlate Area with 16 ASTM CI based on ASTM D 1500. Figure 4b shows the plot of CI against Area.
Based on Figure 4a, a linear relationship can be observed between the CI and CW at Abs = 0.5, 1.0 and 1.5. Likewise, a linear relationship can also be observed between CI and Area in Figure 4b. In order to measure the strength of the correlation between the variables, Pearson product-moment correlation coefficient (r) of the data was calculated. The r value determines the strength and direction of the linear relationship between two variables [38]. Generally, r > 0 indicates a positive relationship while r < 0 indicates a negative relationship. Table 1 shows a guideline in determining the strength of relationship for absolute value of r [39].
The calculated r values between CI and CW in Figure 4a are 0.9867, 0.9799 and 0.9772 for Abs = 0.5, 1.0 and 1.5 respectively. Based on Figure 4b, the calculated r between CI and Area is 0.9835. All four correlation coefficients are very close to 1 and it shows a very strong positive linear correlation. Thus, linear regression models can be formed based on the data in Figure 4a,b. However, it is worth noting that different linear models could be formed if different Abs is chosen for data in Figure 4a. Therefore a model that describes the relationship between CI, CW and Abs was formulated.
A 3-dimentional plot was generated to study the relationship between CI, CW and Abs. Three regression methods, which were Linear, Paraboloid and Gaussian regressions, were applied to the collected data to determine the method that provides the best fit. To evaluate the performance of the regression methods, the coefficient of determination (R2), adjusted R2, and standard error of estimate (S) were calculated. R2 provides a descriptive measure of how well the regression line makes the prediction [38] while the adjusted R2 is a modified version of R2 that has been adjusted for the number of predictors in the model [40]. The range of both R2 and adjusted R2 are between 0 and 1, where 0 indicates that the measured data is far from the regression line while 1 indicates that all measured data is on the regression line. S measures the average distance that the measured data fall from the regression line. A smaller S value generally indicates that the data are closer to the regression line. Table 2 shows the analysis results of the three regression methods used.
Based on Table 2, Gaussian regression shows the highest R2 and adjusted R2, and the lowest S value compared to linear and paraboloid regressions. Therefore, Gaussian regression was chosen for the mathematical model. Figure 5 shows a 3-dimentional plot of CW vs. CI vs. Abs of the transformer oil with the Gaussian regression plane.
According to the results of the Gaussian regression analysis, the mathematical model that describes the relationship between the CW, CI and Abs of transformer oil is as Equation (2).
C I = 14.4682 e 0.5 [ ( A b s     2.1818 1.642 ) 2   + ( C W     714.2849 157.9937 ) 2 ] .
Furthermore, linear regression was applied to the collected data in Figure 4b to describe the relationship between CI and Area, and it is plotted in Figure 6.
According to the results of the linear regression analysis, the regression is able to produce a R2 value of 0.9412, adjusted R2 value of 0.9412, and S value of 55.8578. The mathematical model that describes the relationship between the Area and CI of transformer oil is as Equation (3).
C I = ( 9.017   ×   10 3 )   A r e a ,

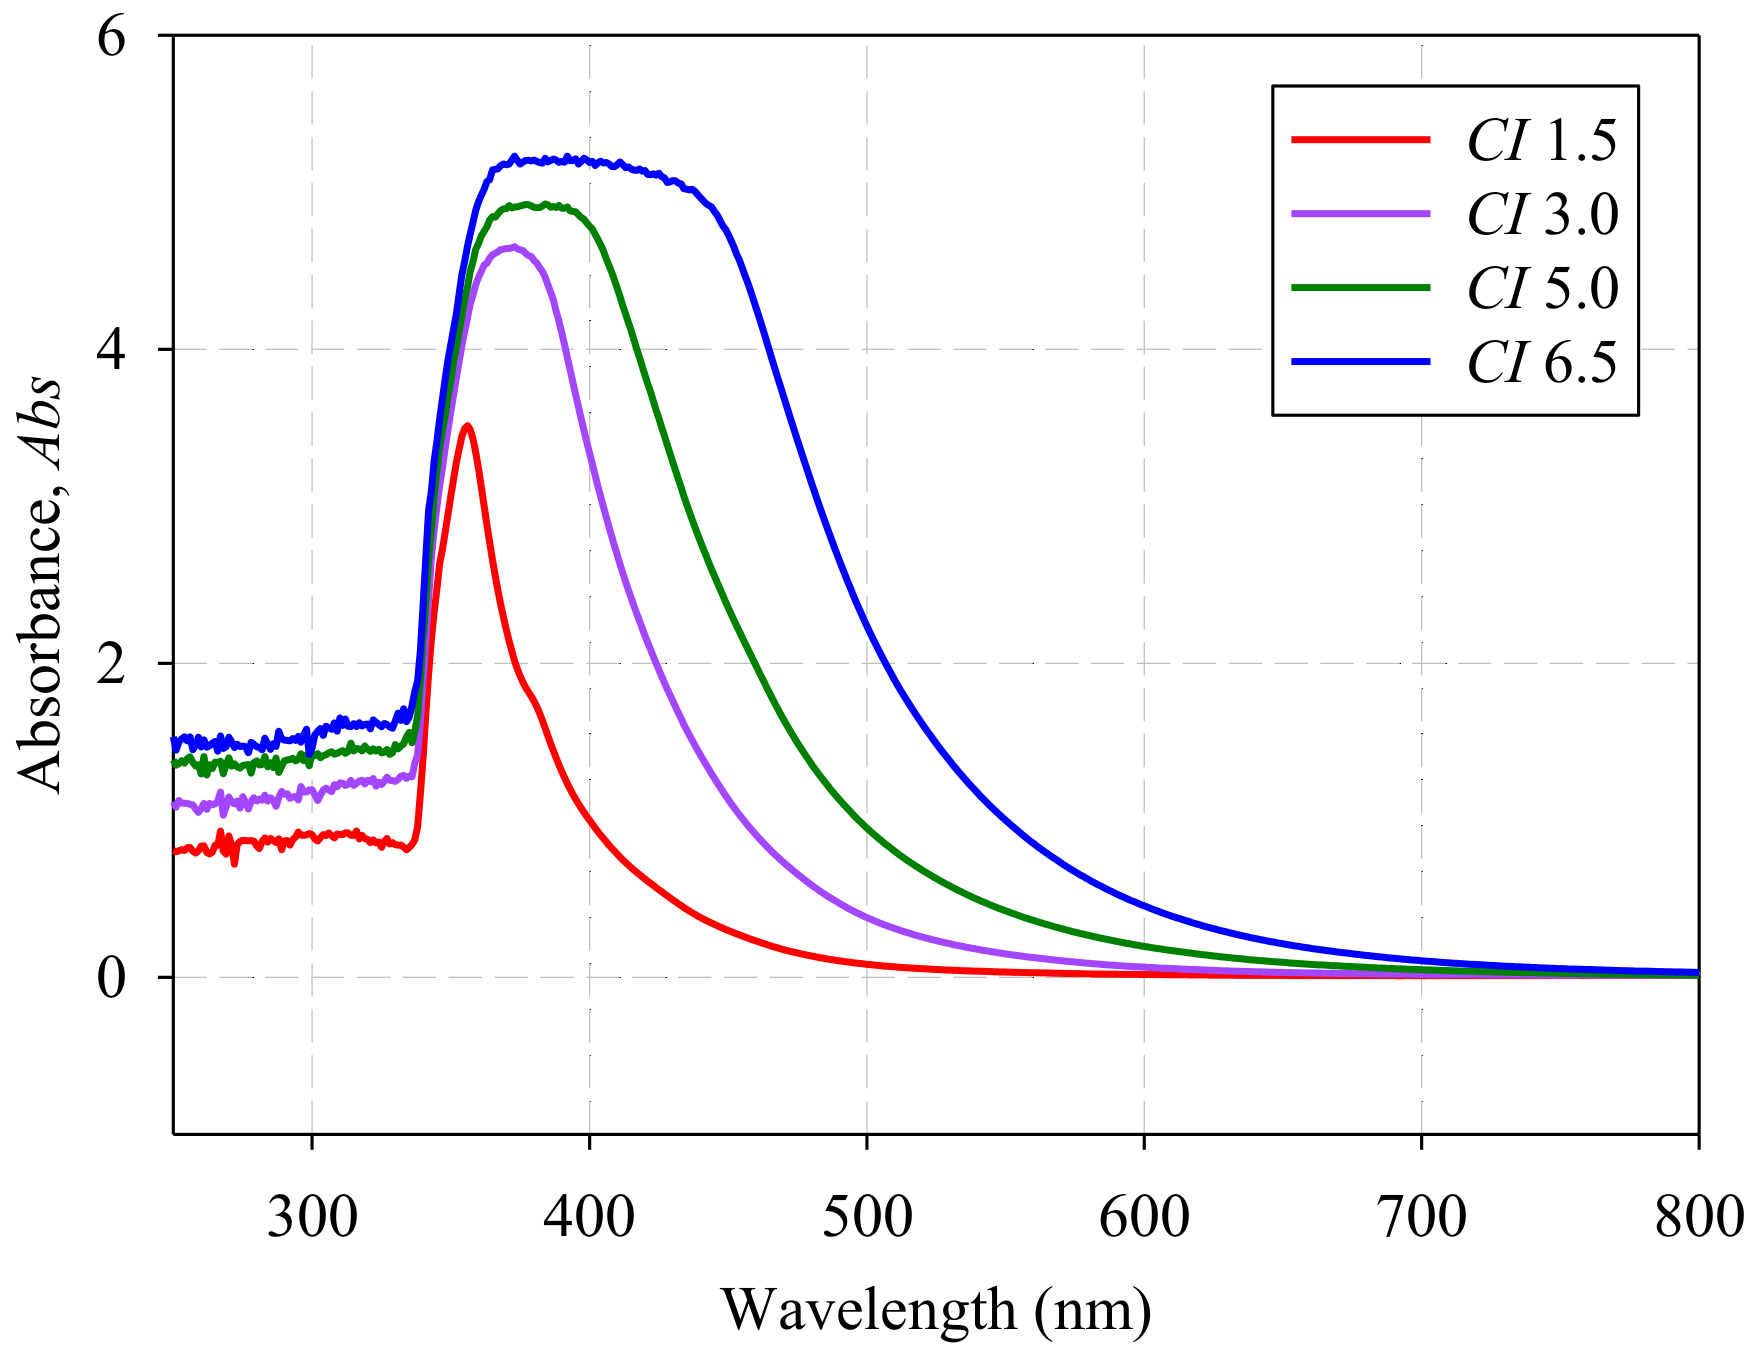
3.3. Verification of Mathematical Modeling

To validate the mathematical models of Equations (2) and (3), a second set of transformer oil samples were sampled. The oil samples were then sent for conventional lab analysis to determine the color index in accordance to ASTM D 1500 standard. The optical absorbance of the oil samples was also measured using Cary 5000.
For the verification of Equation (2), the CW of each absorbance spectral response of the oil samples at Abs values of 0.25, 0.5, 0.75, 1.0, 1.25, 1.5, 1.75 and 2.0 were collected, and the estimated CI were calculated using Equation (2). The difference between the measured CI and the calculated CI were then calculated and analyzed to determine the average difference and maximum absolute difference at different Abs values. Table 3 shows an example of the calculated CI using Equation (2), CI measured using ASTM D 1500 and their differences for each sample at Abs = 0.75.
Based on Table 3, the results show that the calculated CI is close to the measured CI value for each sample. The standard deviation and standard error for CI = 0.5, 1.0, 1.5, 2.0, 2.5 and 3.0 were calculated. The maximum absolute difference between the calculated and measured CI is 0.4 and the average absolute difference is 0.1632. The maximum absolute difference between the calculated and measured CI, and the average absolute difference at different Abs values were calculated and plotted in Figure 7.
Based on Figure 7, Abs of 0.75 produced the least average absolute difference (0.1632), and the Abs of 0.75, and 1.0 produced the lowest maximum absolute difference (0.4).
For the verification of Equation (3), the area under the graph from 360 nm to 600 nm for the second set of oil samples were recorded and the estimated CI were calculated using Equation (3). Likewise, the difference between the measured CI and the calculated CI were then calculated and analyzed to determine the average difference and maximum absolute difference. Table 4 shows the calculated CI using Equation (3), CI measured using ASTM D 1500 and their differences for each sample.
Based on Table 4, the results show that the calculated CI is close to the measured CI value for each sample. The standard deviation and standard error were also calculated for CI = 0.5, 1.0, 1.5, 2.0, 2.5 and 3.0. The maximum absolute difference between the calculated and measured CI is 1.8 and the average absolute difference is 0.4647.
For further verification, the Root Mean Square Error (RMSE) for results in Table 3 and Table 4 are calculated and compared. Generally, RMSE is the standard deviation of the difference between the actual value, y and the estimated value, ŷ as shown in Equation (4) [41]. RMSE is able to measure how much the actual data varies around the regression line.
R M S E = 1 n i   =   1 n ( y i ŷ i ) 2 ,
where n is the total number of samples.
In this analysis, y represents the measured CI value, and ŷ represents the calculated CI value. RMSE values were calculated for both verification data in Table 3 and Table 4. Table 5 summarizes the maximum absolute differences, average absolute differences and RMSE values for both Equations (2) and (3).

4. Discussion

As described in Section 2.2, the oil samples were measured for at least 3 times to ensure that the spectrophotometer can produce consistent and repeatable results. Based on the obtained optical absorbance spectrum, the standard deviation among the calculated CI for each oil sample was computed. For all the samples that were measured for their repeatability, it was found that the standard deviation was in the range of 0 to 0.013.
In addition, for a particular CI, five different oil samples were measured and the standard deviation and standard error were calculated, as shown in Table 3 and Table 4. Due to the lack of oil samples with CI > 3.0 from operating power transformers, only one or two samples with CI > 3.0 were measured. The difficulty in getting oil samples with CI > 3.0 was because oil samples with CI > 3.0 indicate a critical level in other properties such as acidity and interfacial tension, thus the oil will be sent for oil reclamation to restore the quality of the transformer oil. Nevertheless, for CI ≤ 3.0, the standard deviation and standard error were calculated. Based on Table 3, the standard deviation ranges from 0.0733 to 0.2238, with the maximum percentage of standard deviation from the average value of 13%. It is important to note that not all the oil samples for this experiment were chosen such that their CI were determined with direct matching to the color disk. This means that the color of the oil samples could be intermediate between two standard ASTM colors. Moreover, considering that the conventional method could also cause an error of 0.5 due to its large step size, the measured CI also has an error of 0.5. Even with a large error, the regression is able to produce a maximum absolute difference of 0.4, and an average absolute difference of 0.1632. However, the modeled equation can be further improved by inputting more training samples with wider range of CI.
Results from Table 5 suggested that the determination of CI using Equation (2) should be done using the CW at Abs of 0.75 in order to obtain the lowest maximum absolute difference of 0.4, the least average absolute difference of 0.1632, and the smallest RMSE value of 0.1961. On the other hand, the results show that Equation (3) produces CI with a maximum absolute difference of 1.8, an average absolute difference of 0.4647 and RMSE value of 0.6274.
It is clear that using optical spectroscopy to determine the CI of the transformer oil will provide significant advantages over the conventional method. It is able to provide a smaller error due to higher resolution while the conventional method produces an error of 0.5. Moreover, the proposed technique does not require a human observer to measure the CI, and thus human error is eliminated.
In addition, there is also a possibility that this technique can be applied and developed into a small portable handheld measuring device for on-site measurement or online monitoring. Since the interested range of wavelength is within the visible light region, a miniature UV-Vis spectrometer with a visible light source can be easily obtained at a reasonably low price. With a sample holder, a simple measuring prototype can be built. A microcontroller can also be incorporated for data processing and users interface. Figure 8 shows a simple block diagram of the measuring prototype. This prototype can be readily used by a maintenance operator for on-site CI measurement by extracting 3 mL of oil sample, inserting it in a cuvette, and placing the cuvette in the prototype. Besides transformer oil, the prototype can also be used for quick color measurement of other oils such as engine oil, biodiesel oil, and olive oil.

5. Conclusions

This work was carried out to explore the optical properties of transformer oil using optical detection. It focuses on the determination of CI of the transformer oil using optical spectroscopy. The existing method of determining CI of the transformer oil was first researched and it was found that the technique has accuracy issues, and relies on manual observations. The existing technique has the disadvantages of causing an error of 0.5 during measurement due to its large measurement step size, and the requirement of a human observer. Therefore, this paper proposes a new optical technique to quantify the CI of transformer oil.
Results have shown that there is a strong, positive linear correlation between the CW of the spectral response at a certain Abs and the CI of the transformer oil, and also between area under the curve from 360 nm to 600 nm and the CI of the transformer oil. Two mathematical models were formed and verified using a second set of oil samples. It was found that the equation that describes the relationship between CW of the spectral response at a certain Abs and the CI of the transformer oil shows smaller maximum absolute difference of 0.4, average absolute difference of 0.1632, and RMSE value of 0.1961 at Abs = 0.75.
This proposed new technique of determining the color index of transformer oil has several advantages over the current method as it has the possibility to be performed on-site, and has a higher accuracy by minimizing the risk of human error and having a higher resolution. It also has the potential to be applied to other products such as engine oil, biodiesel fuel and olive oil.

Author Contributions

This research work was mainly conducted by Y.S.L. and he composed the manuscript. P.J.K. and M.Z.J. contributed their effort in designing the experimental setup, result analysis and manuscript revising. S.M.N., A.I. and F.A. have contributed in results analysis. H.M.L. and C.K.L. provided access to the laboratory equipment, facilities and oil samples from power transformers.

Funding

This research was funded by the UNITEN-TNBR research grant U-SN-CR-17-07 and the UNITEN BOLD Grant 10289176/B/9/2017/41.

Acknowledgments

The authors gratefully acknowledge TNB Research Sdn. Bhd. and TNBR QATS Sdn. Bhd. Transformer Oil Lab for the access to the laboratory equipment and facilities, and supplying transformer oil samples.

Conflicts of Interest

The authors declare no conflict of interest.

References

  1. Kelly, J.J. Transformer fault diagnosis by dissolved-gas analysis. IEEE Trans. Ind. Appl. 1980, IA-16, 777–782. [Google Scholar] [CrossRef]
  2. Wang, M.; Vandermaar, A.J.; Srivastava, K.D. Review of condition assessment of power transformers in service. IEEE Electr. Insul. Mag. 2002, 18, 12–25. [Google Scholar] [CrossRef]
  3. Gray, I. A Guide to Transformer Oil Analysis. 2009. Available online: https://www.satcs.co.za/Transformer_Oil_Analysis.pdf (accessed on 7 November 2017).
  4. Saha, T.K. Review of modern diagnostic techniques for assessing insulation condition in aged transformers. IEEE Trans. Dielectr. Electr. Insul. 2003, 10, 903–917. [Google Scholar] [CrossRef] [Green Version]
  5. Zhou, Z.; Bing, F.; Tao, W.; Song, X. Alternative method for the determination of the antioxidant content in transformer oil by electrochemical techniques. IEEE Trans. Dielectr. Electr. Insul. 2012, 19, 1498–1501. [Google Scholar] [CrossRef]
  6. Mineral Insulating Oils in Electrical Equipment—Supervision and Maintenance Guidance; International Electrotechnical Commision: London, UK, 2013; IEC 60422.
  7. N’cho, J.; Fofana, I.; Hadjadj, Y.; Beroual, A. Review of physicochemical-based diagnostic techniques for assessing insulation condition in aged transformers. Energies 2016, 9, 367. [Google Scholar] [CrossRef]
  8. Bakar, N.A.; Abu-Siada, A.; Islam, S. A review of dissolved gas analysis measurement and interpretation techniques. IEEE Electr. Insul. Mag. 2014, 30, 39–49. [Google Scholar] [CrossRef]
  9. Bakar, N.A.; Abu-Siada, A.; Islam, S.; El-Naggar, M.F. A new technique to measure interfacial tension of transformer oil using UV-vis spectroscopy. IEEE Trans. Dielectr. Electr. Insul. 2015, 22, 1275–1282. [Google Scholar] [CrossRef]
  10. Dumitran, L.M.; Setnescu, R.; Notingher, P.V.; Badicu, L.V.; Setnescu, T. Method for lifetime estimation of power transformer mineral oil. Fuel 2014, 117, 756–762. [Google Scholar] [CrossRef]
  11. Polansky, R.; Prosr, P.; Vik, R.; Moravcova, D.; Pihera, J. Comparison of the mineral oil lifetime estimates obtained by differential scanning calorimetry, infrared spectroscopy, and dielectric dissipation factor measurements. Thermochim. Acta 2017, 647, 86–93. [Google Scholar] [CrossRef]
  12. Habib, S.; Ahsan, Q. Development of a transformer oil tester: Capacitance a testing criterion, Informatics, Electronics & Vision (ICIEV). In Proceedings of the 2012 International Conference on Informatics, Electronics & Vision (ICIEV), Dhaka, Bangladesh, 18–19 May 2012; pp. 108–112. [Google Scholar]
  13. Alshehawy, A.M.; Mansour, D.E.A.; Ghali, M. Photoluminescence-based condition assessment of aged transformer oil. In Proceedings of the 2017 Nineteenth International Middle East Power Systems Conference (MEPCON), Cairo, Egypt, 19–21 December 2017; pp. 999–1003. [Google Scholar]
  14. Tkachenko, N.V. Chapter 1 Introduction. In Optical Spectroscopy; Elsevier Science: Amsterdam, The Netherlands, 2006; pp. 1–14. [Google Scholar]
  15. Baeten, V.; Dardenne, P. Spectroscopy: Developments in instrumentation and analysis. Grasas Aceites 2002, 53, 45–63. [Google Scholar] [CrossRef]
  16. Deepa, S.; Sarathi, R.; Mishra, A.K. Synchronous fluorescence and excitation emission characteristics of transformer oil ageing. Talanta 2006, 70, 811–817. [Google Scholar] [CrossRef] [PubMed]
  17. Kamenchuk, Y.A.; Pisareva, S.I. Change in concentrations of antioxidants and paramagnetic centers during aging of petroleum transformer oils. Pet. Chem. 2006, 46, 367–370. [Google Scholar] [CrossRef]
  18. Godinho, M.S.; Blanco, M.R.; Gambarra Neto, F.F.; Lião, L.M.; Sena, M.M.; Tauler, R.; de Oliveira, A.E. Evaluation of transformer insulating oil quality using nir, fluorescence, and nmr spectroscopic data fusion. Talanta 2014, 129, 143–149. [Google Scholar] [CrossRef] [PubMed]
  19. Hussain, K.; Subrata, K. Analysis of transformer oil degradation due to thermal stress using optical spectroscopic techniques. Int. Trans. Electr. Energy Syst. 2017, 27. [Google Scholar] [CrossRef]
  20. Godinho, M.S.; Oliveira, A.E.; Sena, M.M. Development and validation of a multivariate calibration method for determining interfacial tension of transformers insulating oils by near infrared spectroscopy. J. Near Infrared Spectrosc. 2011, 19, 243–251. [Google Scholar] [CrossRef]
  21. Hadjadj, Y.; Fofana, I.; Sabau, J.; Briosso, E. Assessing insulating oil degradation by means of turbidity and UV/Vis spectrophotometry measurements. IEEE Trans. Dielectr. Electr. Insul. 2015, 22, 2653–2660. [Google Scholar] [CrossRef]
  22. Standard Test Method for Astm Color of Petroleum Products (ASTM color scale); American Section of the International Association for Testing Materials: West Conshohocken, PA, USA, 2012; ASTM D 1500-12.
  23. Tan, Y.-A.; Kuntom, A.; Lee, C.K.; Low, K.S. Comparative evaluation of palm oil color measurement using a prototype palm oil colorimeter. J. Am. Oil Chem. Soc. 2004, 81, 733–736. [Google Scholar] [CrossRef]
  24. Chantrapornchai, W.; Clydesdale, F.; McClements, D.J. Theoretical and experimental study of spectral reflectance and color of concentrated oil-in-water emulsions. J. Colloid Interf. Sci. 1999, 218, 324–330. [Google Scholar] [CrossRef] [PubMed]
  25. Giuffrida, D.; Salvo, F.; Salvo, A.; Pera, L.L.; Dugo, G. Pigments composition in monovarietal virgin olive oils from various sicilian olive varieties. Food Chem. 2007, 101, 833–837. [Google Scholar] [CrossRef]
  26. Alves, F.C.G.B.S.; Coqueiro, A.; Março, P.H.; Valderrama, P. Evaluation of olive oils from the mediterranean region by UV–Vis spectroscopy and independent component analysis. Food Chem. 2018. [Google Scholar] [CrossRef]
  27. Evdokimov, I.N.; Losev, A.P. Potential of UV-visible absorption spectroscopy for characterizing crude petroleum oils. Oil Gas Bus. 2007, 1. Available online: http://ogbus.com/article/primenenie-uf-vidimoj-absorbcionnoj-spektroskopii-dlya-opisaniya-prirodnyx-neftej/ (accessed on 8 December 2017).
  28. Ossia, C.V.; Kong, H. Novel chromatic technique based on optical absorbance in characterizing mineral hydraulic oil degradation. Adv. Tribol. 2012, 2012, 8. [Google Scholar] [CrossRef]
  29. Scapin, M.A.; Duarte, C.L.; Bustillos, J.O.W.V.; Sato, I.M. Assessment of gamma radiolytic degradation in waste lubricating oil by GC/MS and UV/Vis. Radiat. Phys. Chem. 2009, 78, 733–735. [Google Scholar] [CrossRef]
  30. Monteiro, O.S.; Souza, A.G.; Soledade, L.E.B.; Queiroz, N.; Souza, A.L.; Mouchrek Filho, V.E.; Vasconcelos, A.F.F. Chemical evaluation and thermal analysis of the essential oil from the fruits of the vegetable species pimenta dioica lindl. J. Thermal Anal. Calorim. 2011, 106, 595–600. [Google Scholar] [CrossRef]
  31. Lankmayr, E.; Mocak, J.; Serdt, K.; Balla, B.; Wenzl, T.; Bandoniene, D.; Gfrerer, M.; Wagner, S. Chemometrical classification of pumpkin seed oils using UV–Vis, NIR and FTIR spectra. J. Biochem. Biophys. Methods 2004, 61, 95–106. [Google Scholar] [CrossRef] [PubMed]
  32. Gonçalves, R.P.; Março, P.H.; Valderrama, P. Thermal edible oil evaluation by UV–Vis spectroscopy and chemometrics. Food Chem. 2014, 163, 83–86. [Google Scholar] [CrossRef] [PubMed]
  33. Sing, L.Y.; Ker, P.J.; Jamaludin, M.Z.; Ismail, A.; Abdullah, F.; Mun, L.H.; Shukri, C.N.S.M. Determining the color index of transformer insulating oil using UV-Vis spectroscopy. In Proceedings of the 2016 IEEE International Conference on Power and Energy (PECon), Melaka, Malaysia, 28–29 November 2016; pp. 234–238. [Google Scholar]
  34. Method of Sampling Insulating Liquids; International Electrotechnical Commision: London, UK, 2011; IEC 60475.
  35. Sing, L.Y.; Ker, P.J.; Jamaludin, M.Z.; Nomanbhay, S.M.; Ismail, A.; Abdullah, F.; Mun, L.H.; Shukri, C.N.S.M. New near-infrared absorbance peak for inhibitor content detection in transformer insulating oil. Sens. Actuators B Chem. 2018, 266, 577–582. [Google Scholar]
  36. Swinehart, D.F. The beer-lambert law. J. Chem. Educ. 1962, 39, 333–334. [Google Scholar] [CrossRef]
  37. Test Method for Determination of the Relative Content of Dissolved Decay Products in Mineral Insulating Oils by Spectrophotometry; American Section of the International Association for Testing Materials: West Conshohocken, PA, USA, 2010; ASTM D 6802 - 02.
  38. Weiss, N.A. Introductory Statistics; Addison-Wesley: Reading, MA, USA, 2012. [Google Scholar]
  39. Evans, J.D. Straightforward statistics for the behavioral sciences. J. Am. Stat. Assoc. 1996, 91, 1750–1751. [Google Scholar]
  40. Frost, J. Multiple Regression Analysis: Use Adjusted R-Squared and Predicted R-Squared to Include the Correct Number of Variables. In The Minitab Blog. 2013. Available online: http://blog.minitab.com/blog/adventures-in-statistics-2/multiple-regession-analysis-use-adjusted-r-squared-and-predicted-r-squared-to-include-the-correct-number-of-variables (accessed on 28 November 2017).
  41. Bruce, P.C. Introductory Statistics and Analytics: A Resampling Perspective; Wiley: Arlington, VA, USA, 2015. [Google Scholar]
Figure 1. Initial optical absorbance spectrums of four oil samples with different color indices (CI) based on ASTM D 1500.
Sensors 18 02175 g001
Figure 2. Optical absorbance spectrums of four oil samples with different CI based on ASTM D 1500 after applying ND filter.
Sensors 18 02175 g002
Figure 3. Optical absorbance spectrum of transformer oils with increasing CI based on ASTM D 1500.
Sensors 18 02175 g003
Figure 4. (a) CW verses CI of transformer oil samples at Abs = 0.5; 1.0 and 1.5, (b) Area verses CI of transformer oil samples.
Sensors 18 02175 g004
Figure 5. Graph of CW vs. CI of transformer oil samples vs. Abs (Red Circles with black borders) with Gaussian regression (White plane).
Sensors 18 02175 g005
Figure 6. Area vs. CI of transformer oil samples with linear regression line (dotted line).
Sensors 18 02175 g006
Figure 7. Plot of average absolute difference and maximum absolute difference at different Abs value.
Sensors 18 02175 g007
Figure 8. Simple block diagram of potential portable measuring prototype.
Sensors 18 02175 g008
Table 1. Guideline for interpretation of strength of relationship for absolute values of correlation.
Absolute Value of r, |r|Strength of Relationship
0–0.19Very Weak
0.20–0.39Weak
0.40–0.59Moderate
0.60–0.79Strong
0.80–1.00Very Strong
Table 2. Regression analysis results for linear, paraboloid and Gaussian.
Regression MethodR2Adjusted R2S
Linear0.95630.95530.3670
Paraboloid0.96510.96350.3317
Gaussian0.98020.97930.2499
Table 3. Verification data for 42 oil samples (S1–S42) at Abs = 0.75 using Equation (2).
SampleMeasured CI 1Measured Cutoff Wavelength (nm)Calculated CI 2Difference in CI 3Standard DeviationStandard Error
S10.53520.70.20.07330.033
S20.53570.80.3
S30.53460.60.1
S40.53610.80.3
S50.53450.60.1
S61.03710.9−0.10.11740.053
S71.03700.9−0.1
S81.03791.00.0
S91.03851.10.1
S101.03891.20.2
S111.54271.90.40.22380.100
S121.54091.50.0
S131.54021.4−0.1
S141.54251.90.4
S151.54251.90.4
S162.04472.40.40.18390.082
S172.04472.40.4
S182.04402.20.2
S192.04402.20.2
S202.04281.9−0.1
S212.54512.50.00.07770.035
S222.54582.70.2
S232.54562.60.1
S242.54532.50.0
S252.54522.50.0
S263.04672.9−0.10.17230.077
S273.04773.20.2
S283.04773.20.2
S293.04713.00.0
S303.04642.8−0.2
S313.54873.50.0--
S323.54953.80.3--
S334.05044.10.1--
S344.04953.8−0.2--
S354.55114.3−0.2--
S364.55134.4−0.1--
S375.05234.8−0.2--
S385.55385.3−0.2--
S395.55365.2−0.3--
S406.55686.4−0.1--
S417.05827.00.0--
S427.55927.3−0.2--
1 Color index based on measurement in accordance of ASTM D 1500, 2 Color index calculated based on Equation (2), 3 Difference in CI = Calculated CI – Measured CI.
Table 4. Verification data for 42 oil samples (S1–S42) using Equation (3).
SampleMeasured CI 1Area2Calculated CI 3Difference in CI 4Standard DeviationStandard Error
S10.511.77070.1−0.40.04800.021
S20.511.38440.1−0.4
S30.54.01640.0−0.5
S40.516.67690.2−0.3
S50.54.67690.0−0.5
S61.048.8850.4−0.60.08720.039
S71.037.45720.3−0.7
S81.046.2760.4−0.6
S91.056.03870.5−0.5
S101.062.87380.6−0.4
S111.5148.52371.3−0.20.24650.110
S121.5103.4490.9−0.6
S131.583.99420.8−0.7
S141.5138.8091.3−0.2
S151.5136.70291.2−0.3
S162.0236.61372.10.10.30900.138
S172.0236.39612.10.1
S182.0198.79131.8−0.2
S192.0209.38381.9−0.1
S202.0153.30421.4−0.6
S212.5246.32.2−0.30.19030.085
S222.5296.64792.70.2
S232.5274.9062.50.0
S242.5264.56222.4−0.1
S252.5246.692.2−0.3
S263.0503.83274.51.50.66250.296
S273.0355.92283.20.2
S283.0374.73723.40.4
S293.0343.92663.10.1
S303.0313.94382.8−0.2
S313.5435.93063.90.4--
S323.5580.90145.21.7--
S334.0538.90024.90.9--
S344.0430.80673.9−0.1--
S354.5547.16394.90.4--
S364.5345.19153.1−1.4--
S375.0572.17695.20.2--
S385.5805.91437.31.8--
S395.5624.94995.60.1--
S406.5743.96956.70.2--
S417.0821.18637.40.4--
S427.5901.66188.10.6--
1 Color index based on measurement in accordance of ASTM D 1500, 2 Integration of area under the graph from 360 nm to 600 nm, 3 Color index calculated based on Equation (3), 4 Difference in CI = Calculated CI – Measured CI.
Table 5. Maximum absolute difference, average absolute difference, and RMSE value for verification data.
AbsMaximum Absolute DifferenceAverage Absolute DifferenceRMSE
For Equation (2)0.250.80.34130.3972
0.500.60.17520.2235
0.750.40.16320.1961
1.000.40.17980.2144
1.250.60.22470.2747
1.500.80.23500.2981
1.750.90.24930.3163
2.000.90.25740.3249
For Equation (3)-1.80.46470.6274

