A Personalized Healthcare Monitoring System for Diabetic Patients by Utilizing BLE-Based Sensors and Real-Time Data Processing

 ,
,  , , , and
Abstract
:1. Introduction
2. Literature Review
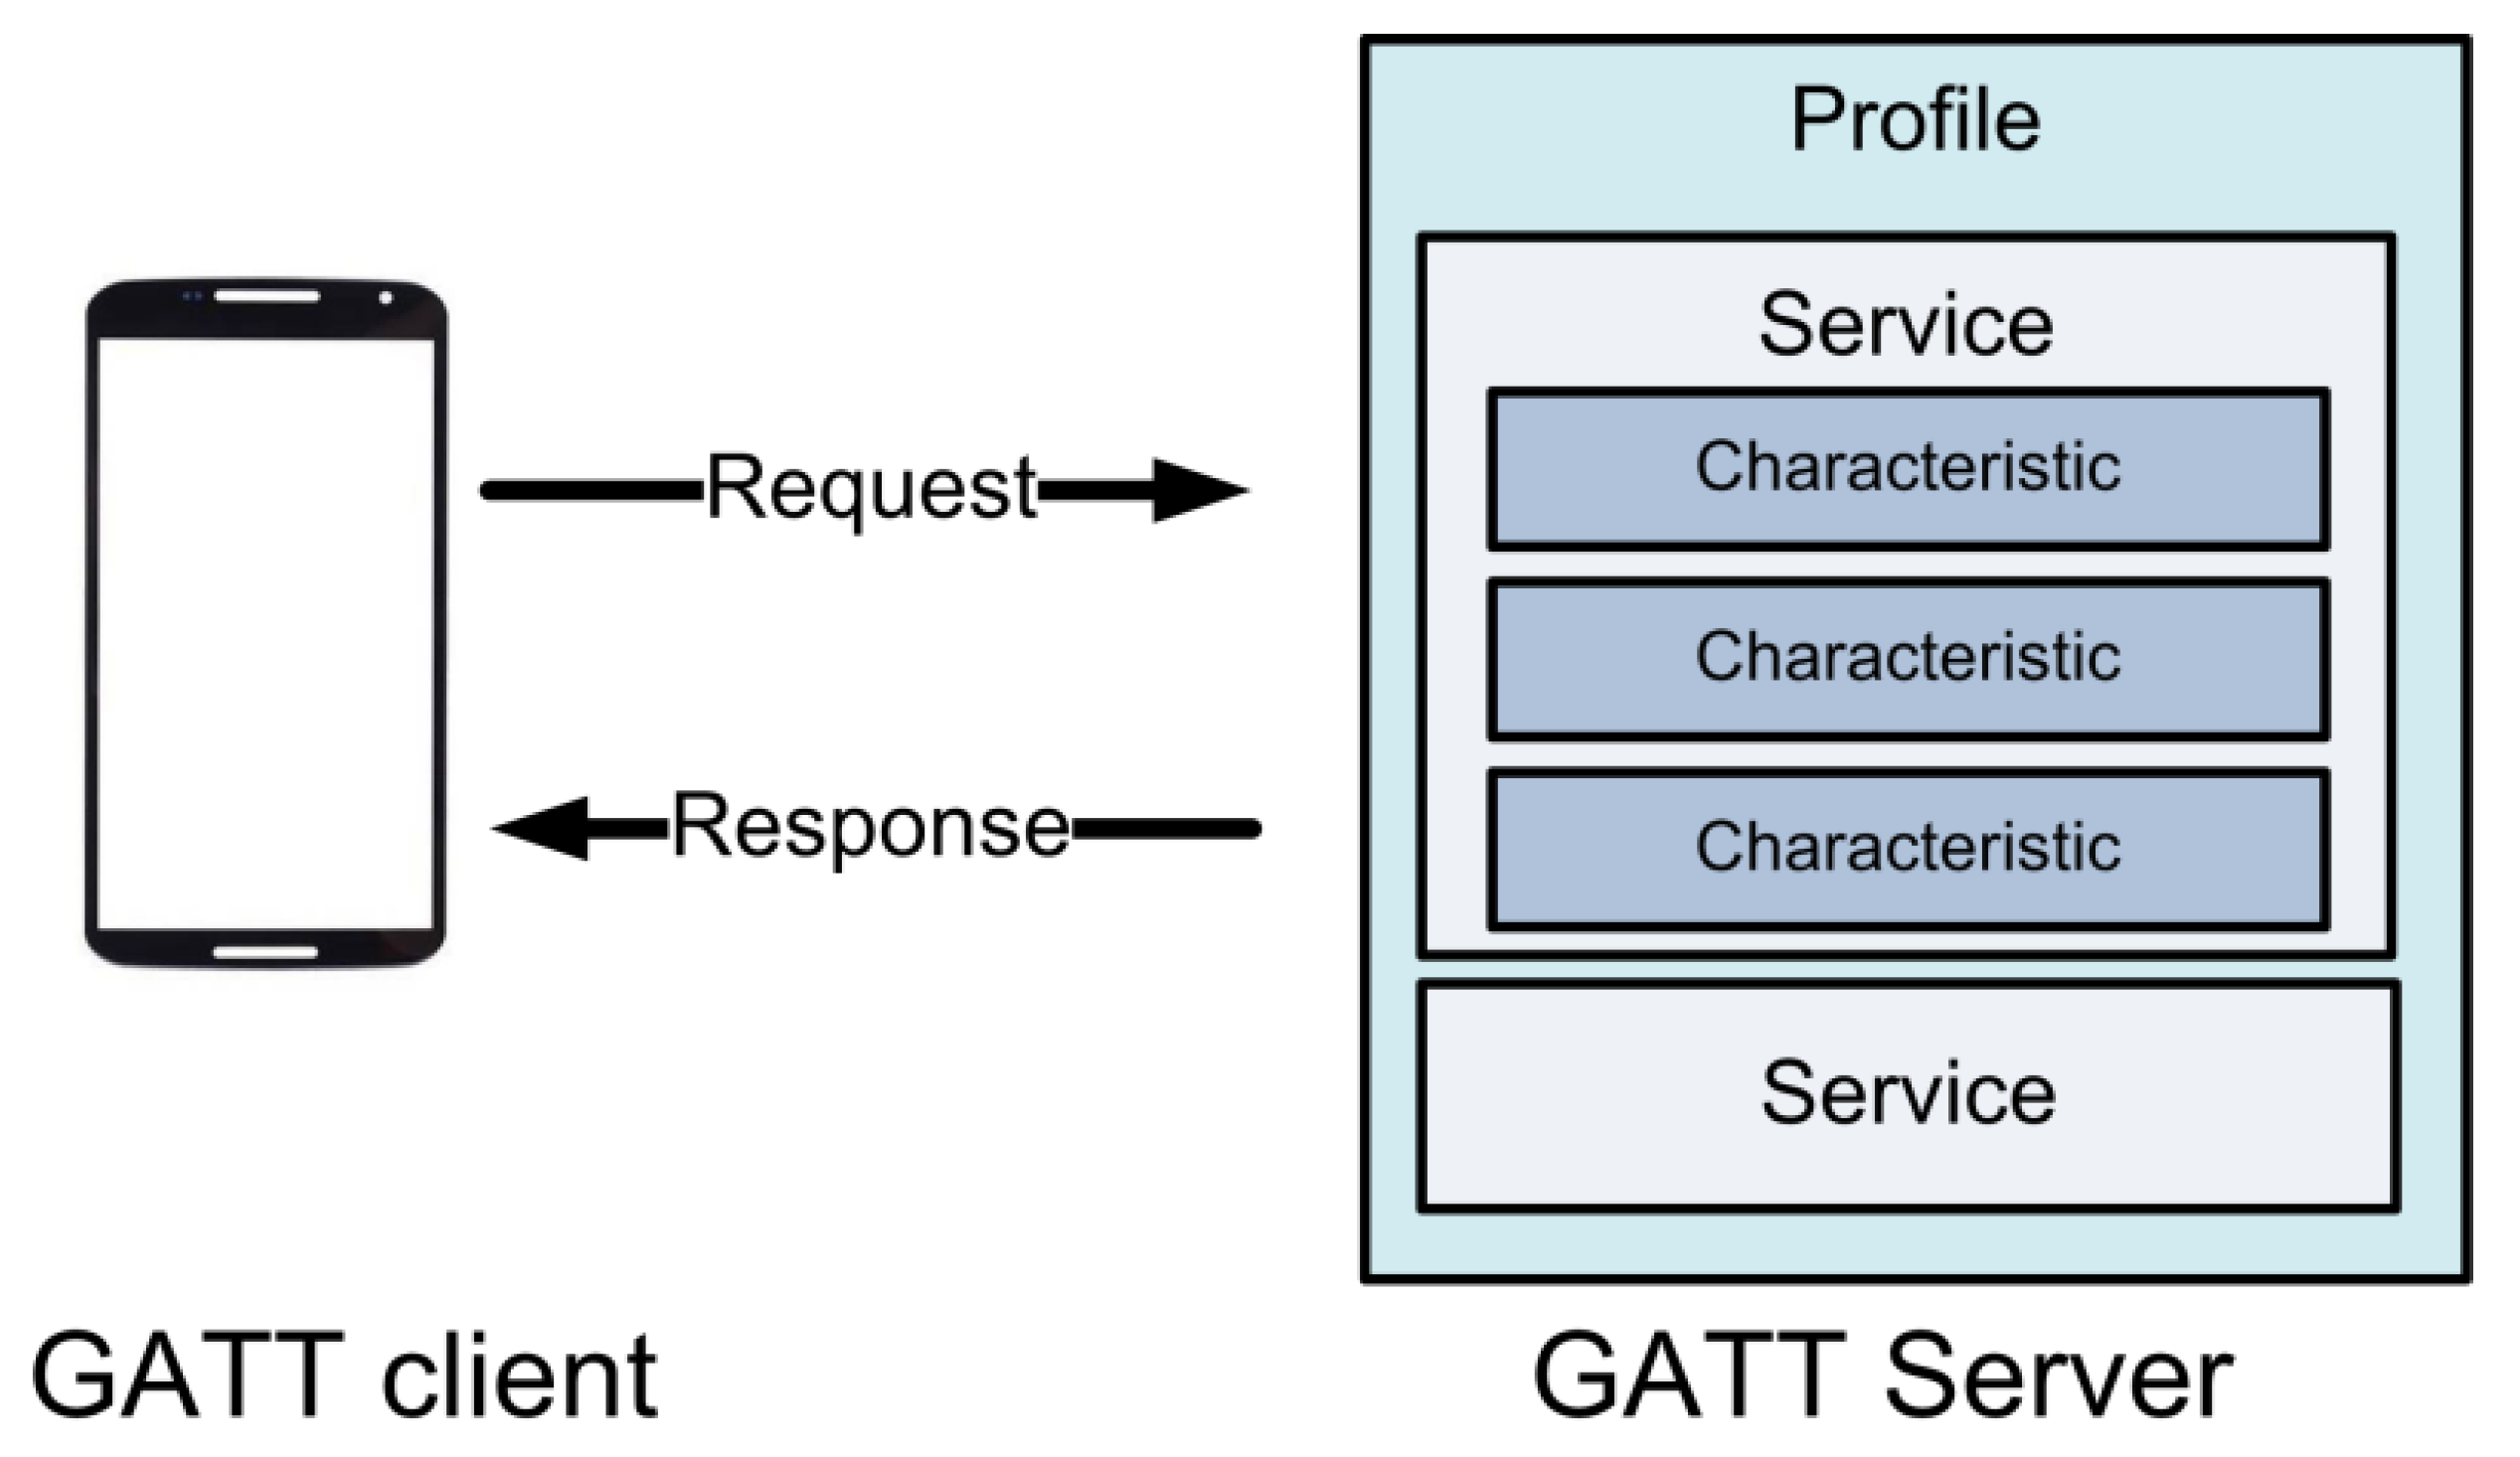
2.1. Glucose Monitoring and BLE
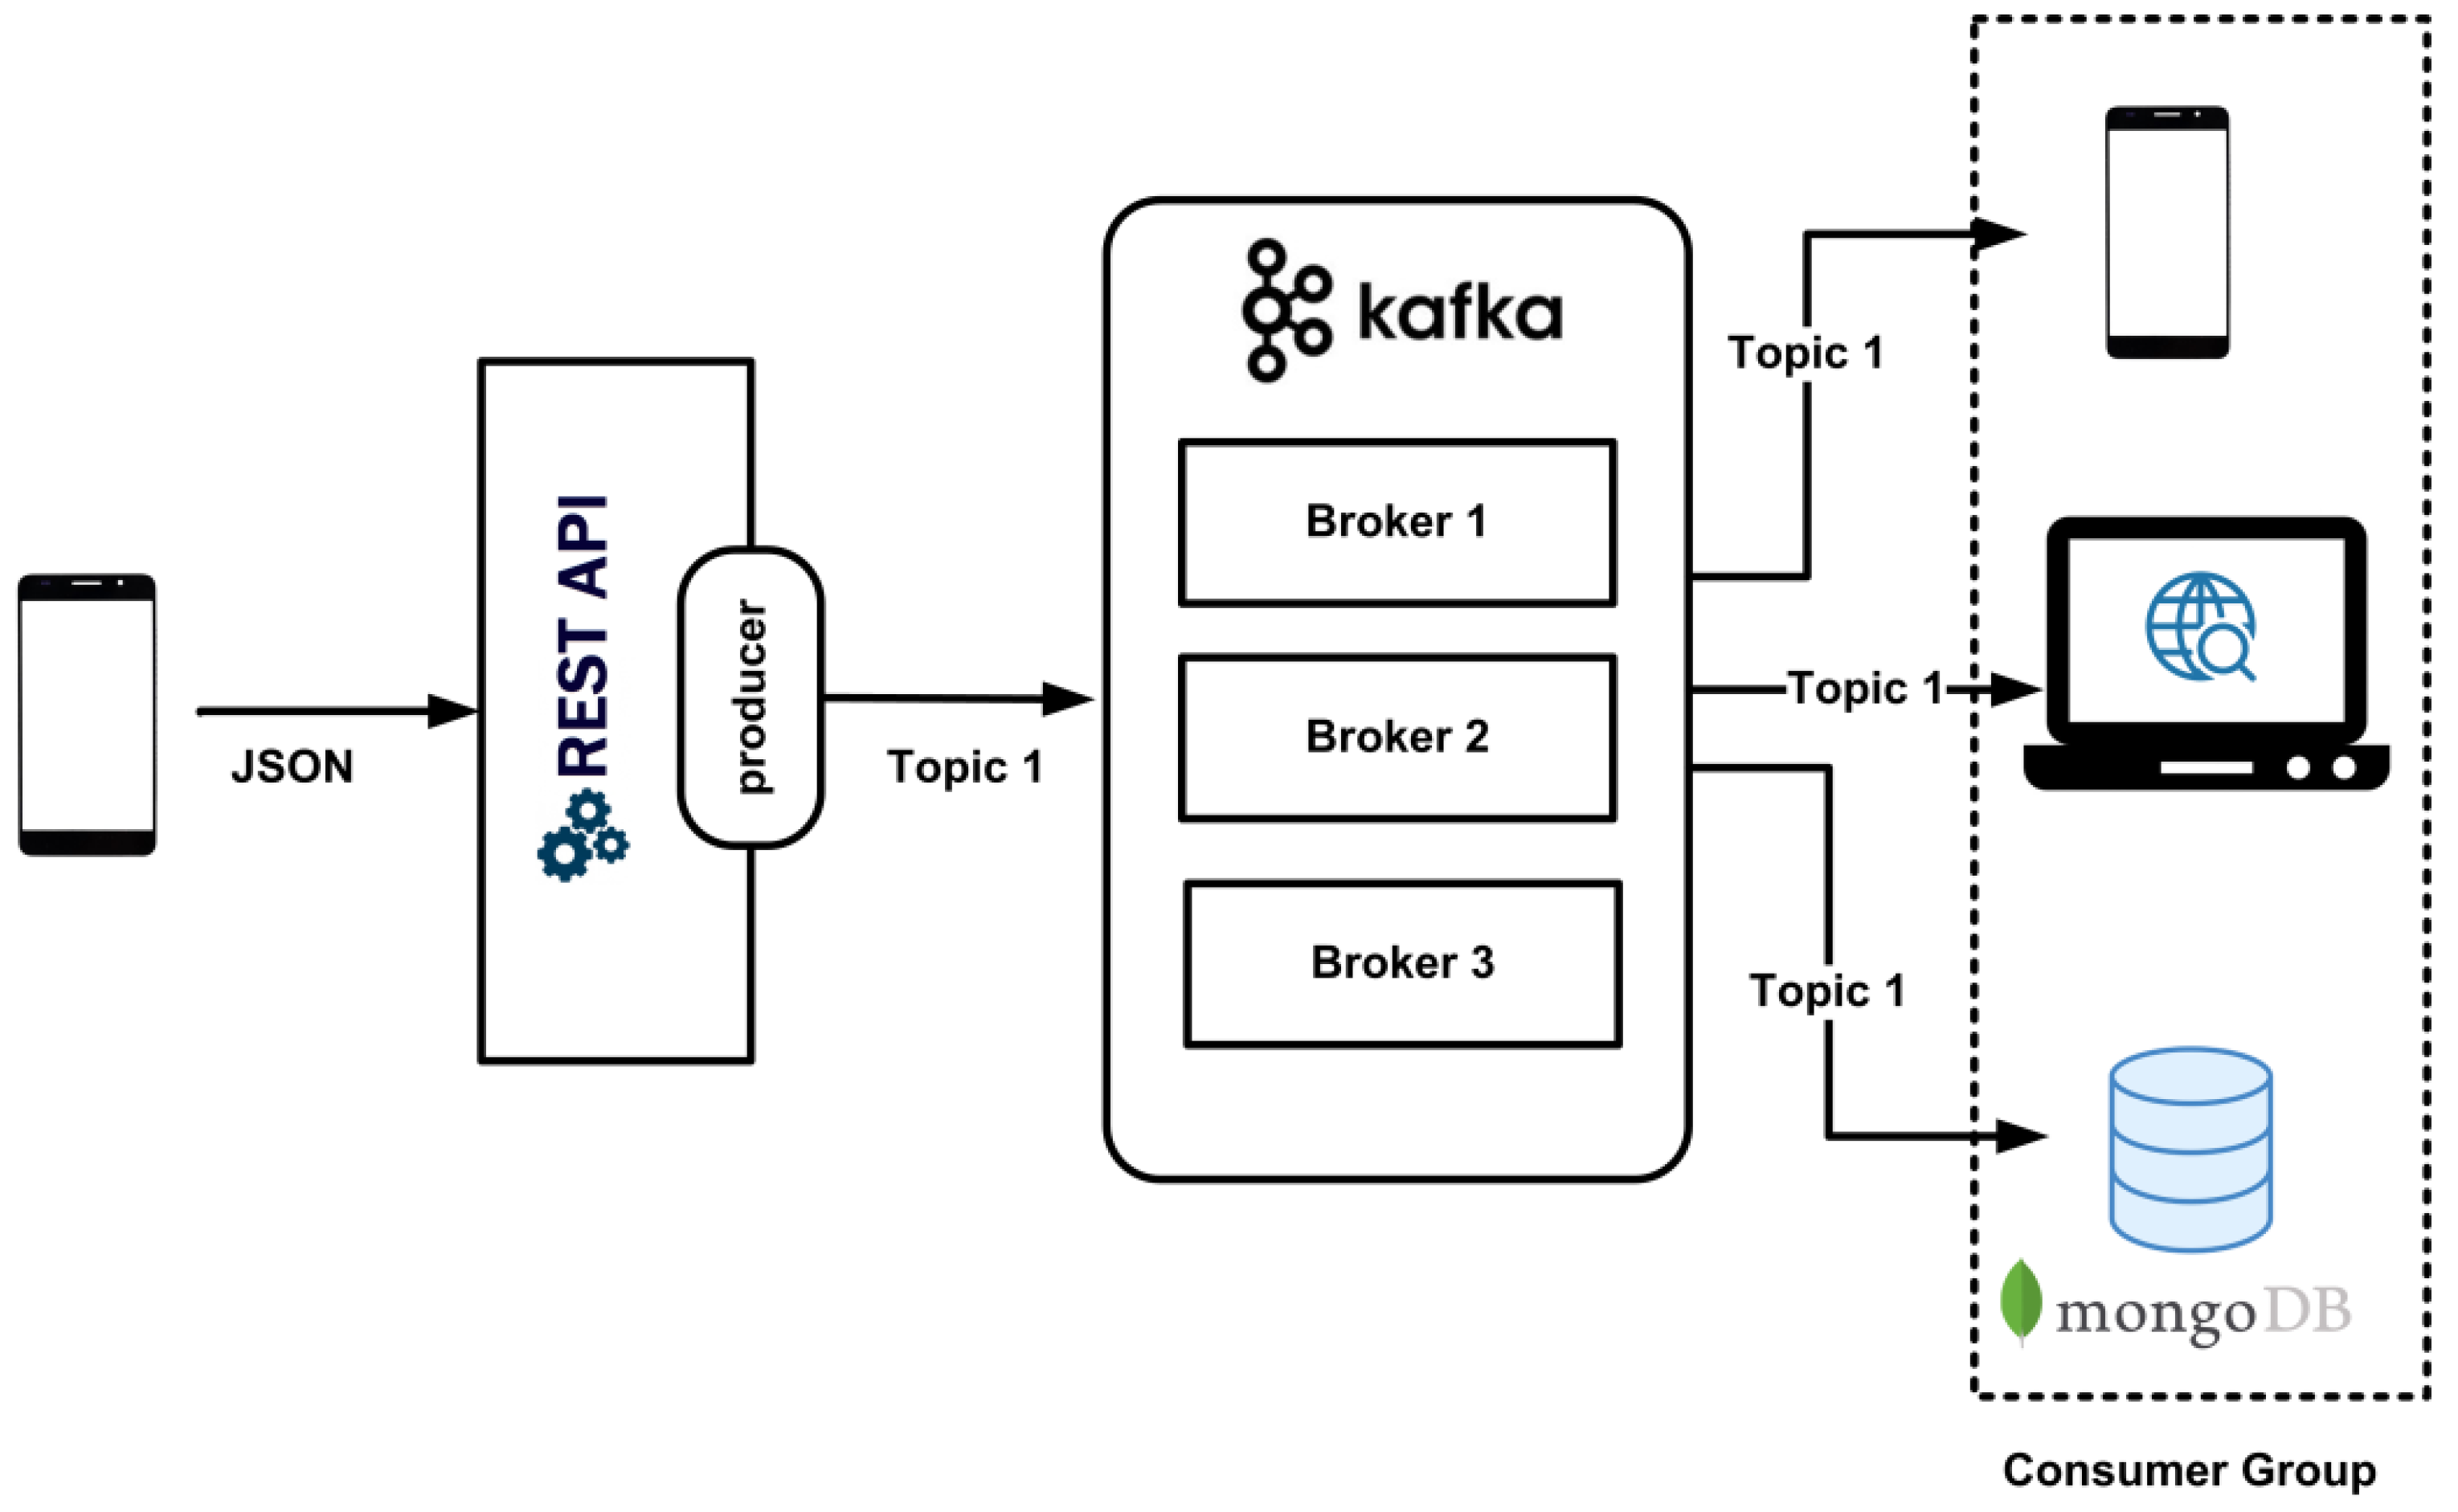
2.2. Real-Time Data Processing
2.3. Machine Learning–Based Algorithms for Diabetes
3. Methodology
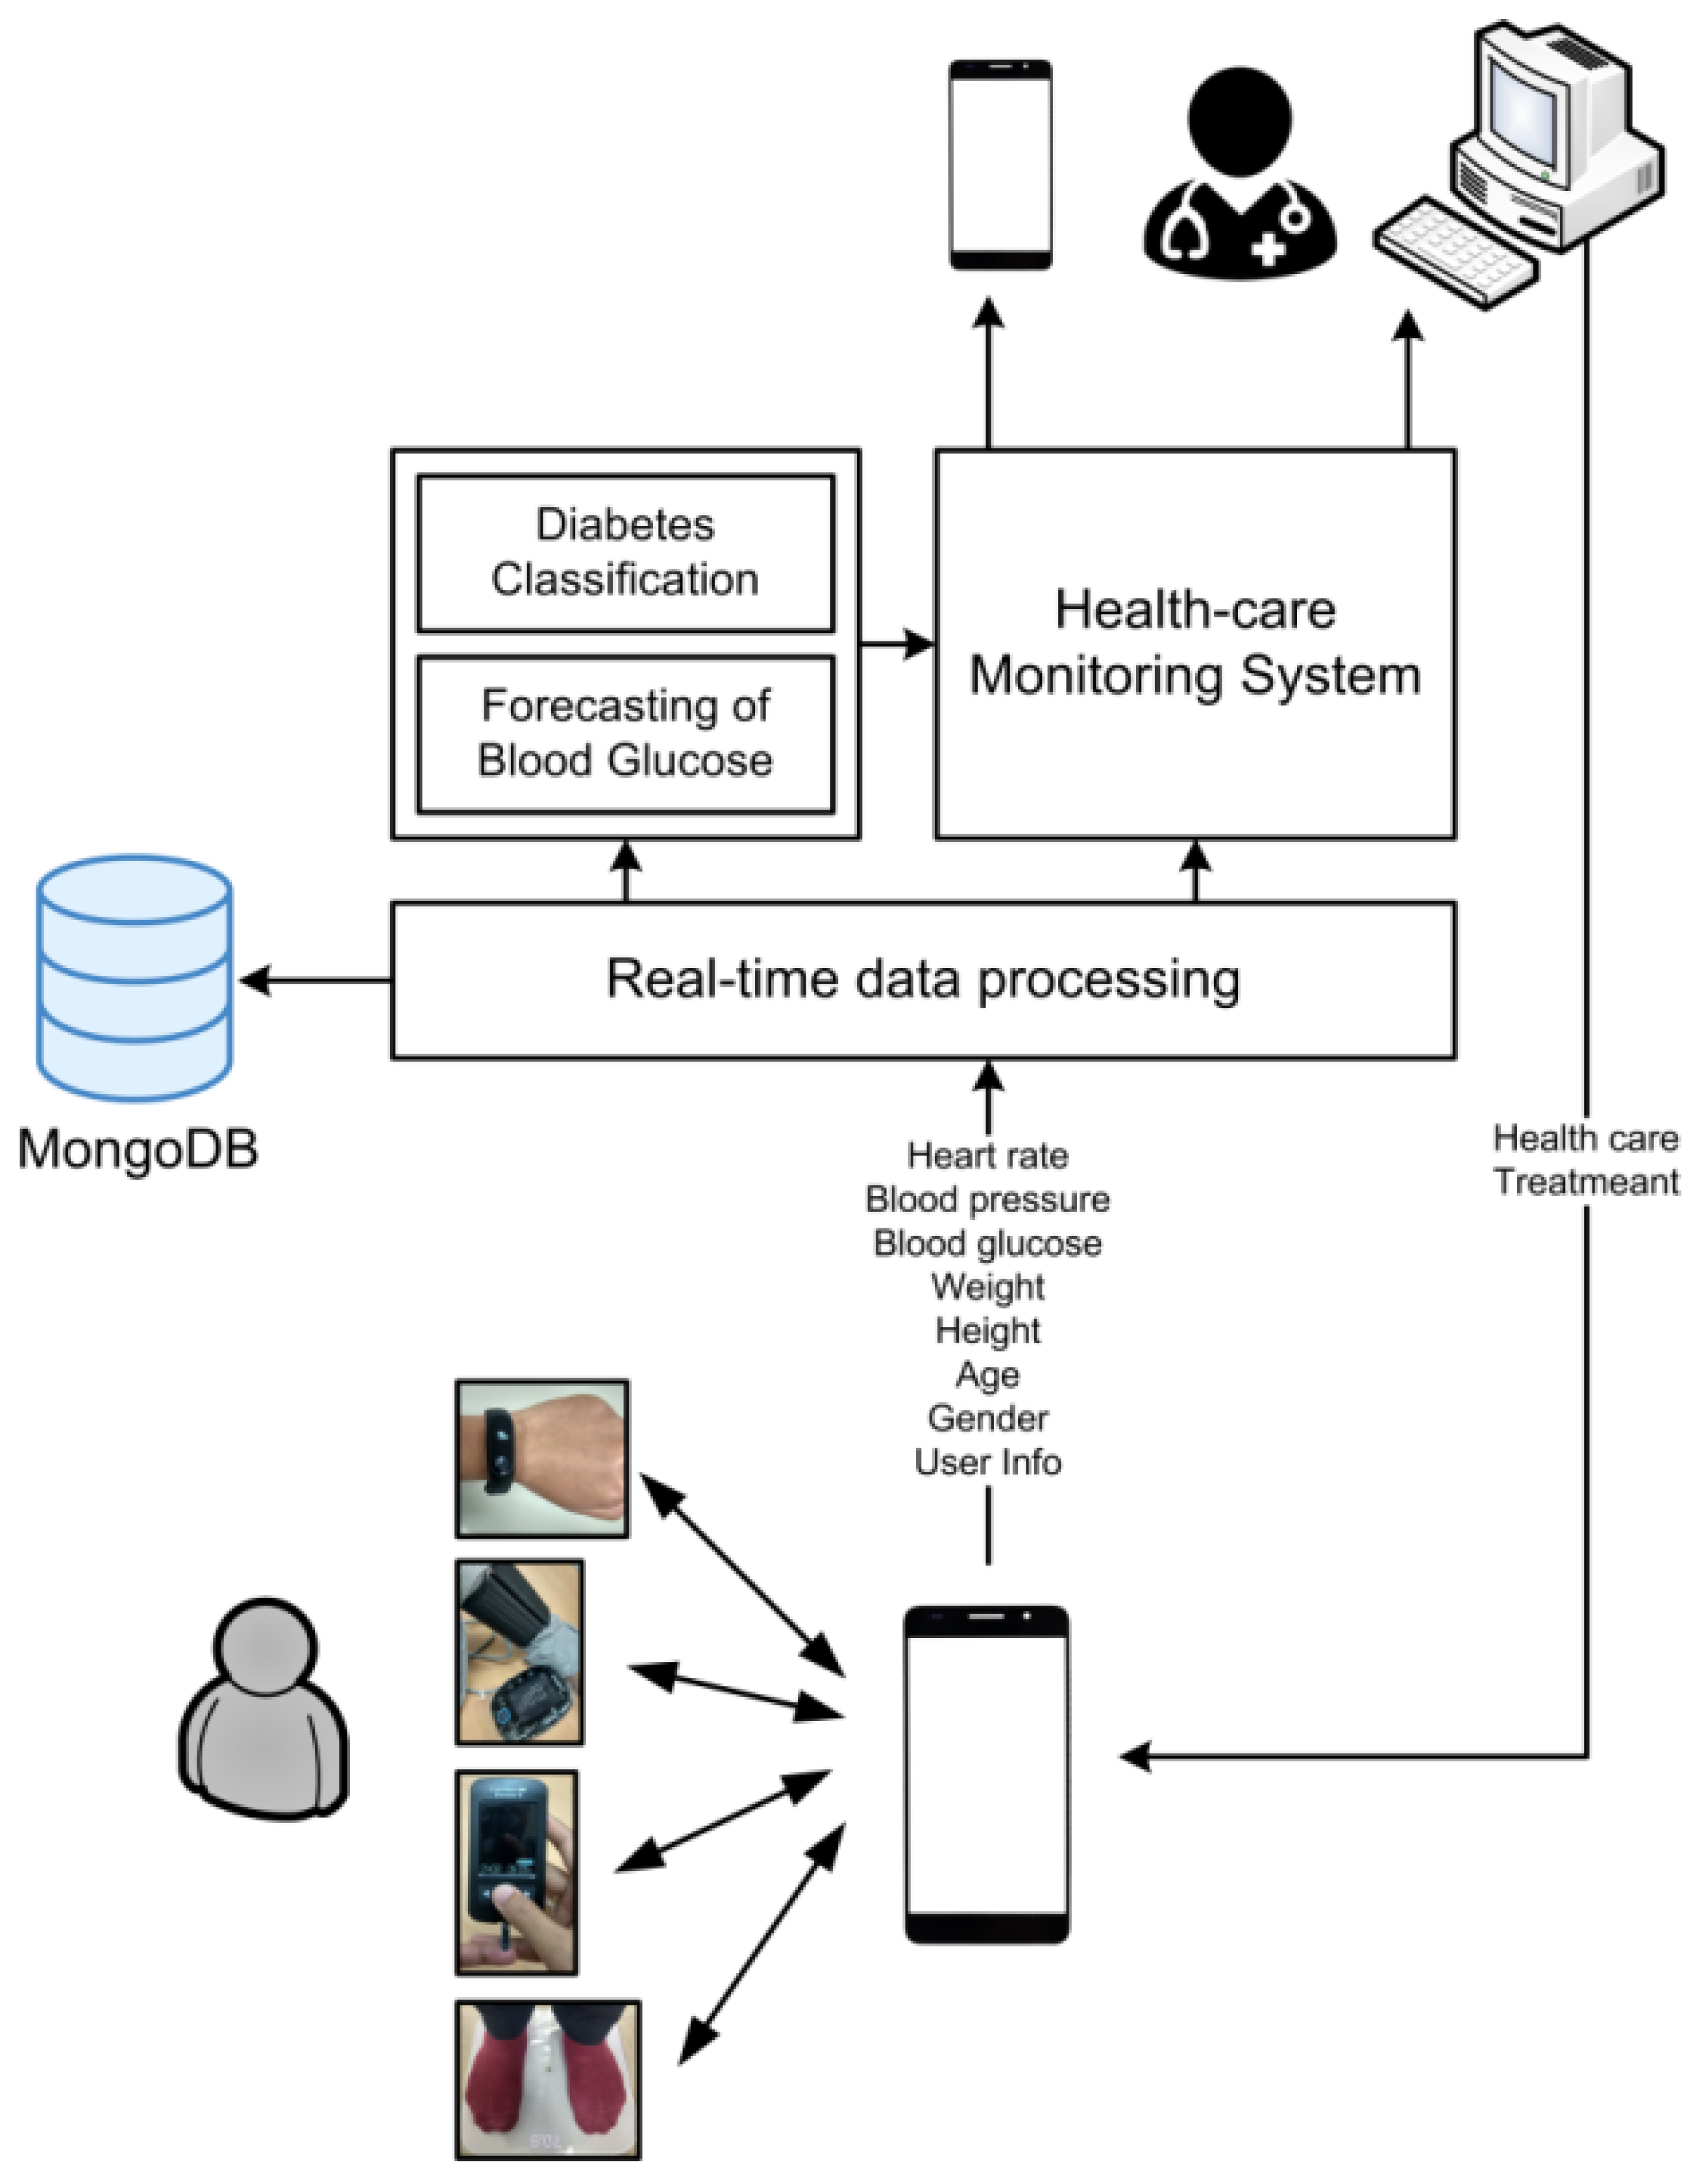
3.1. System Design
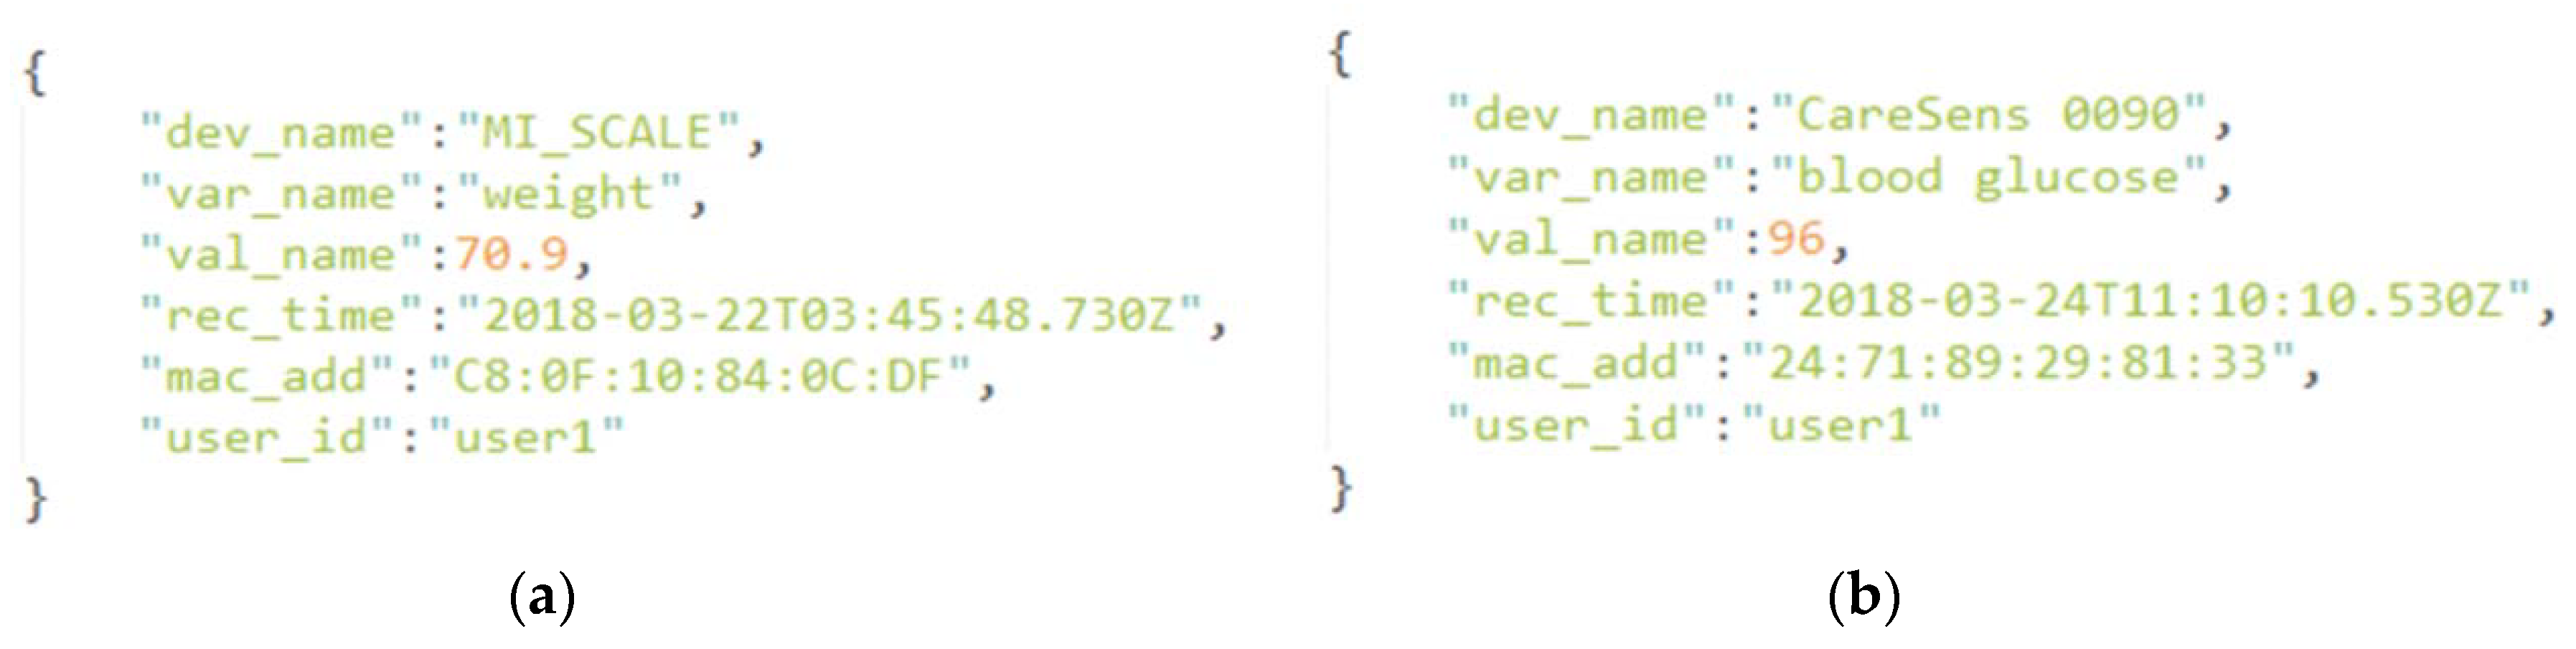
3.2. System Implementation
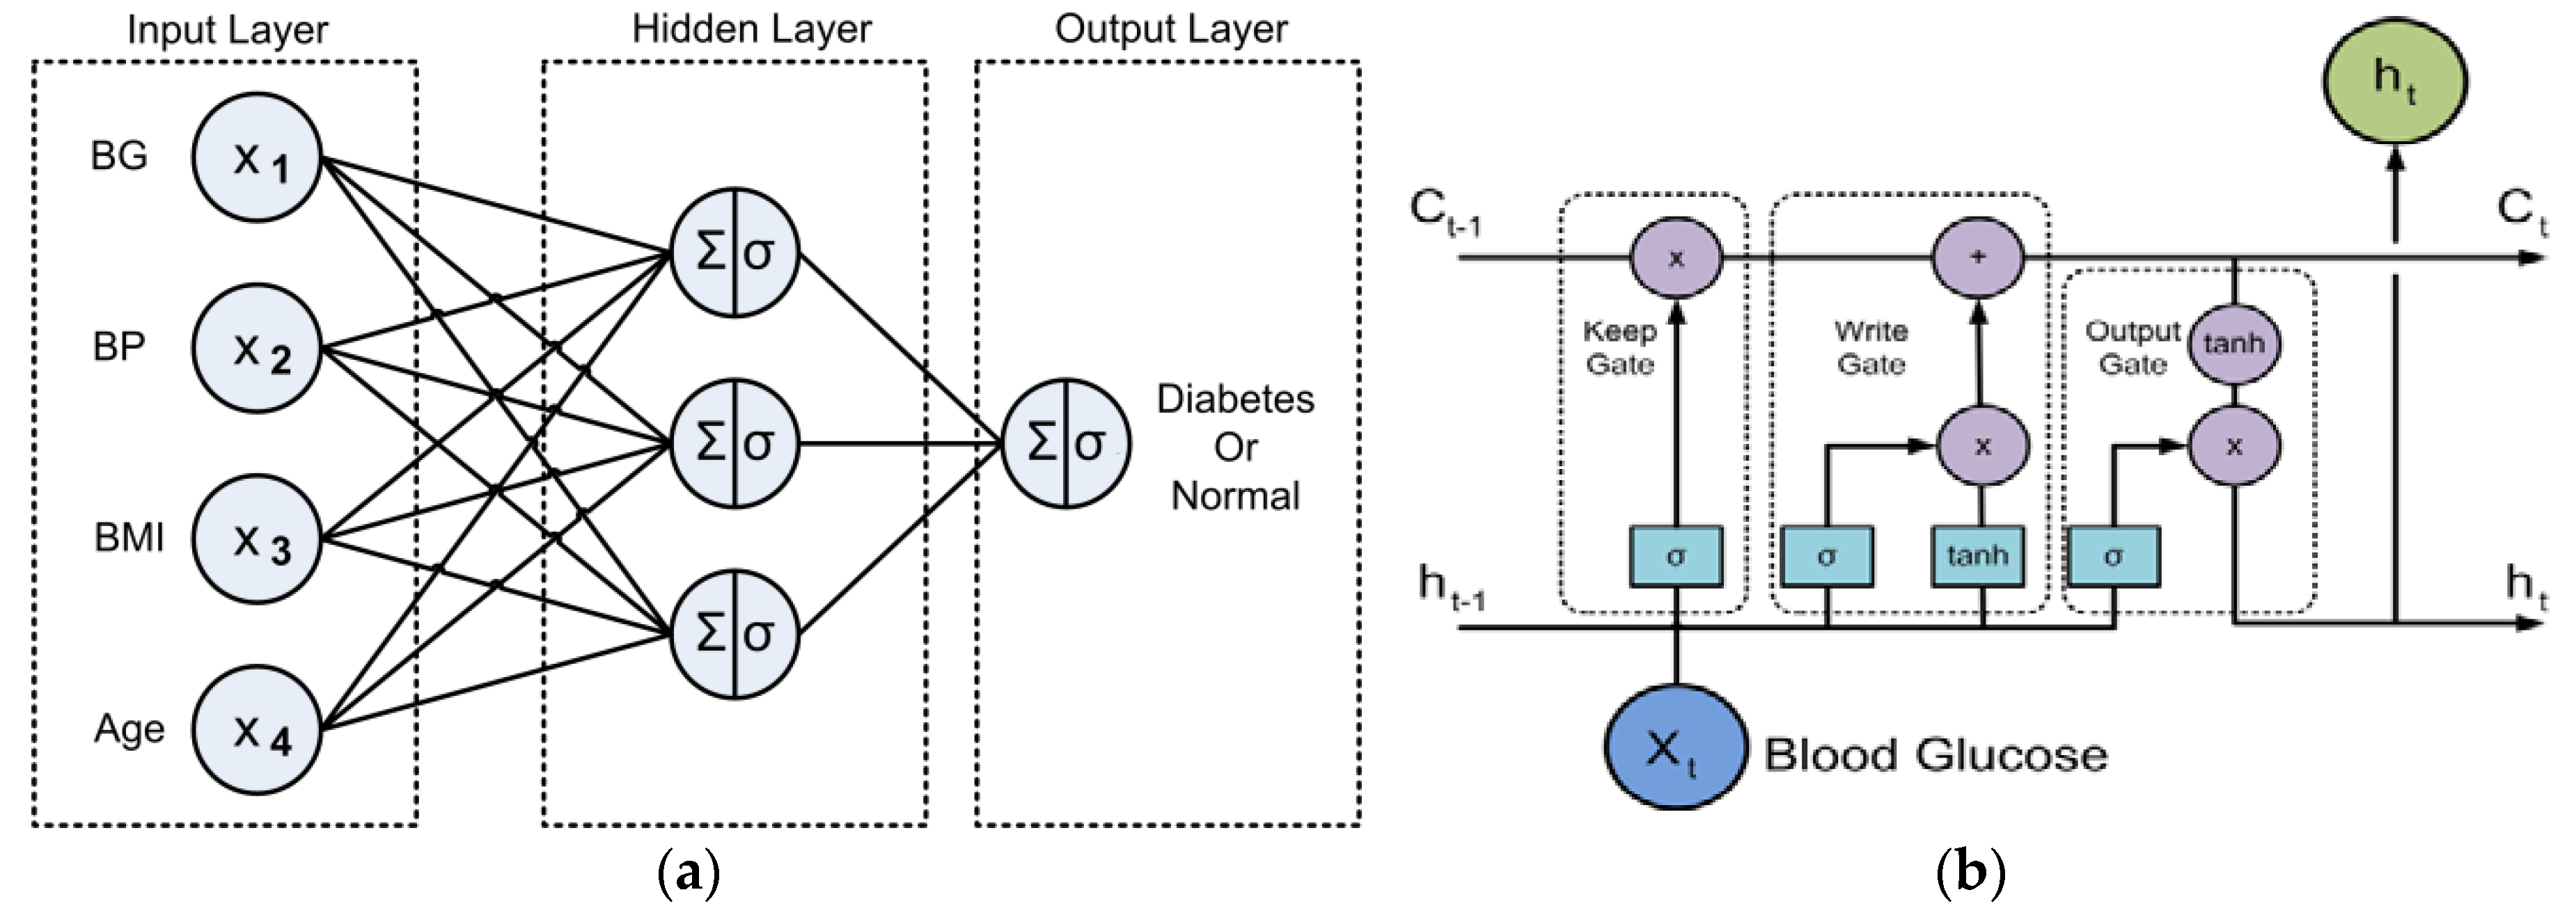
3.3. Diabetes Classification and BG Prediction.
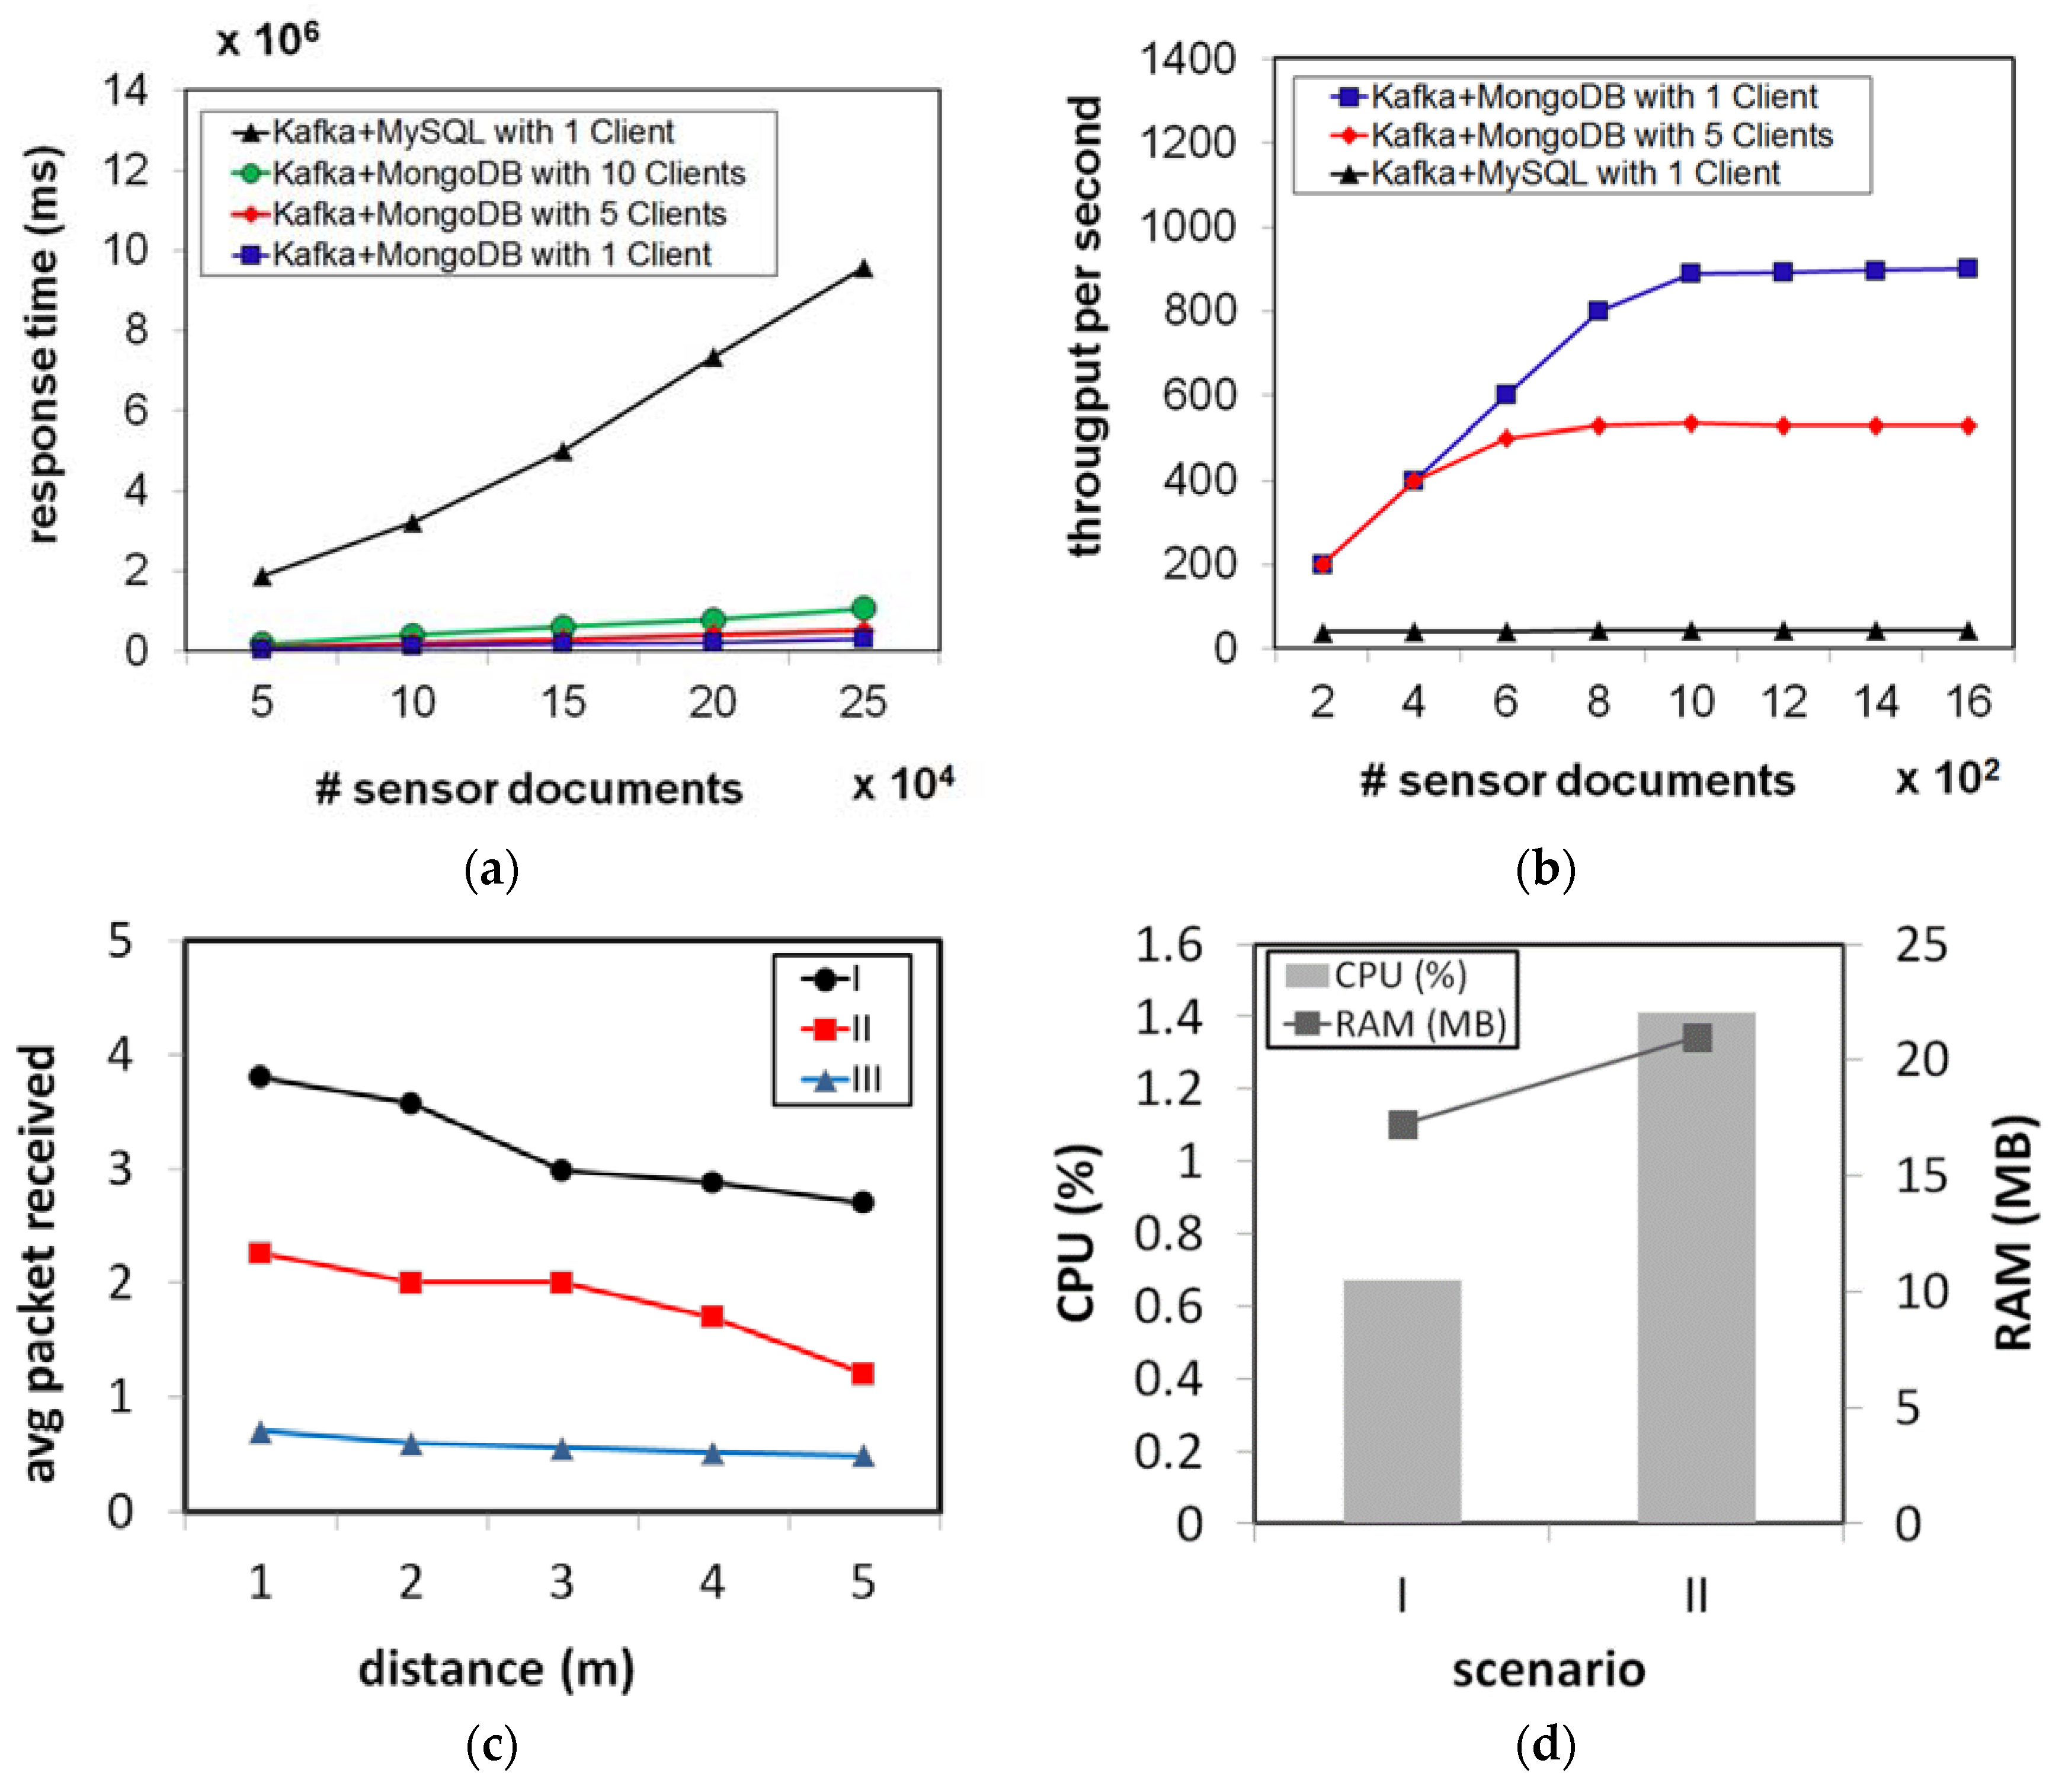
4. Result and Discussion
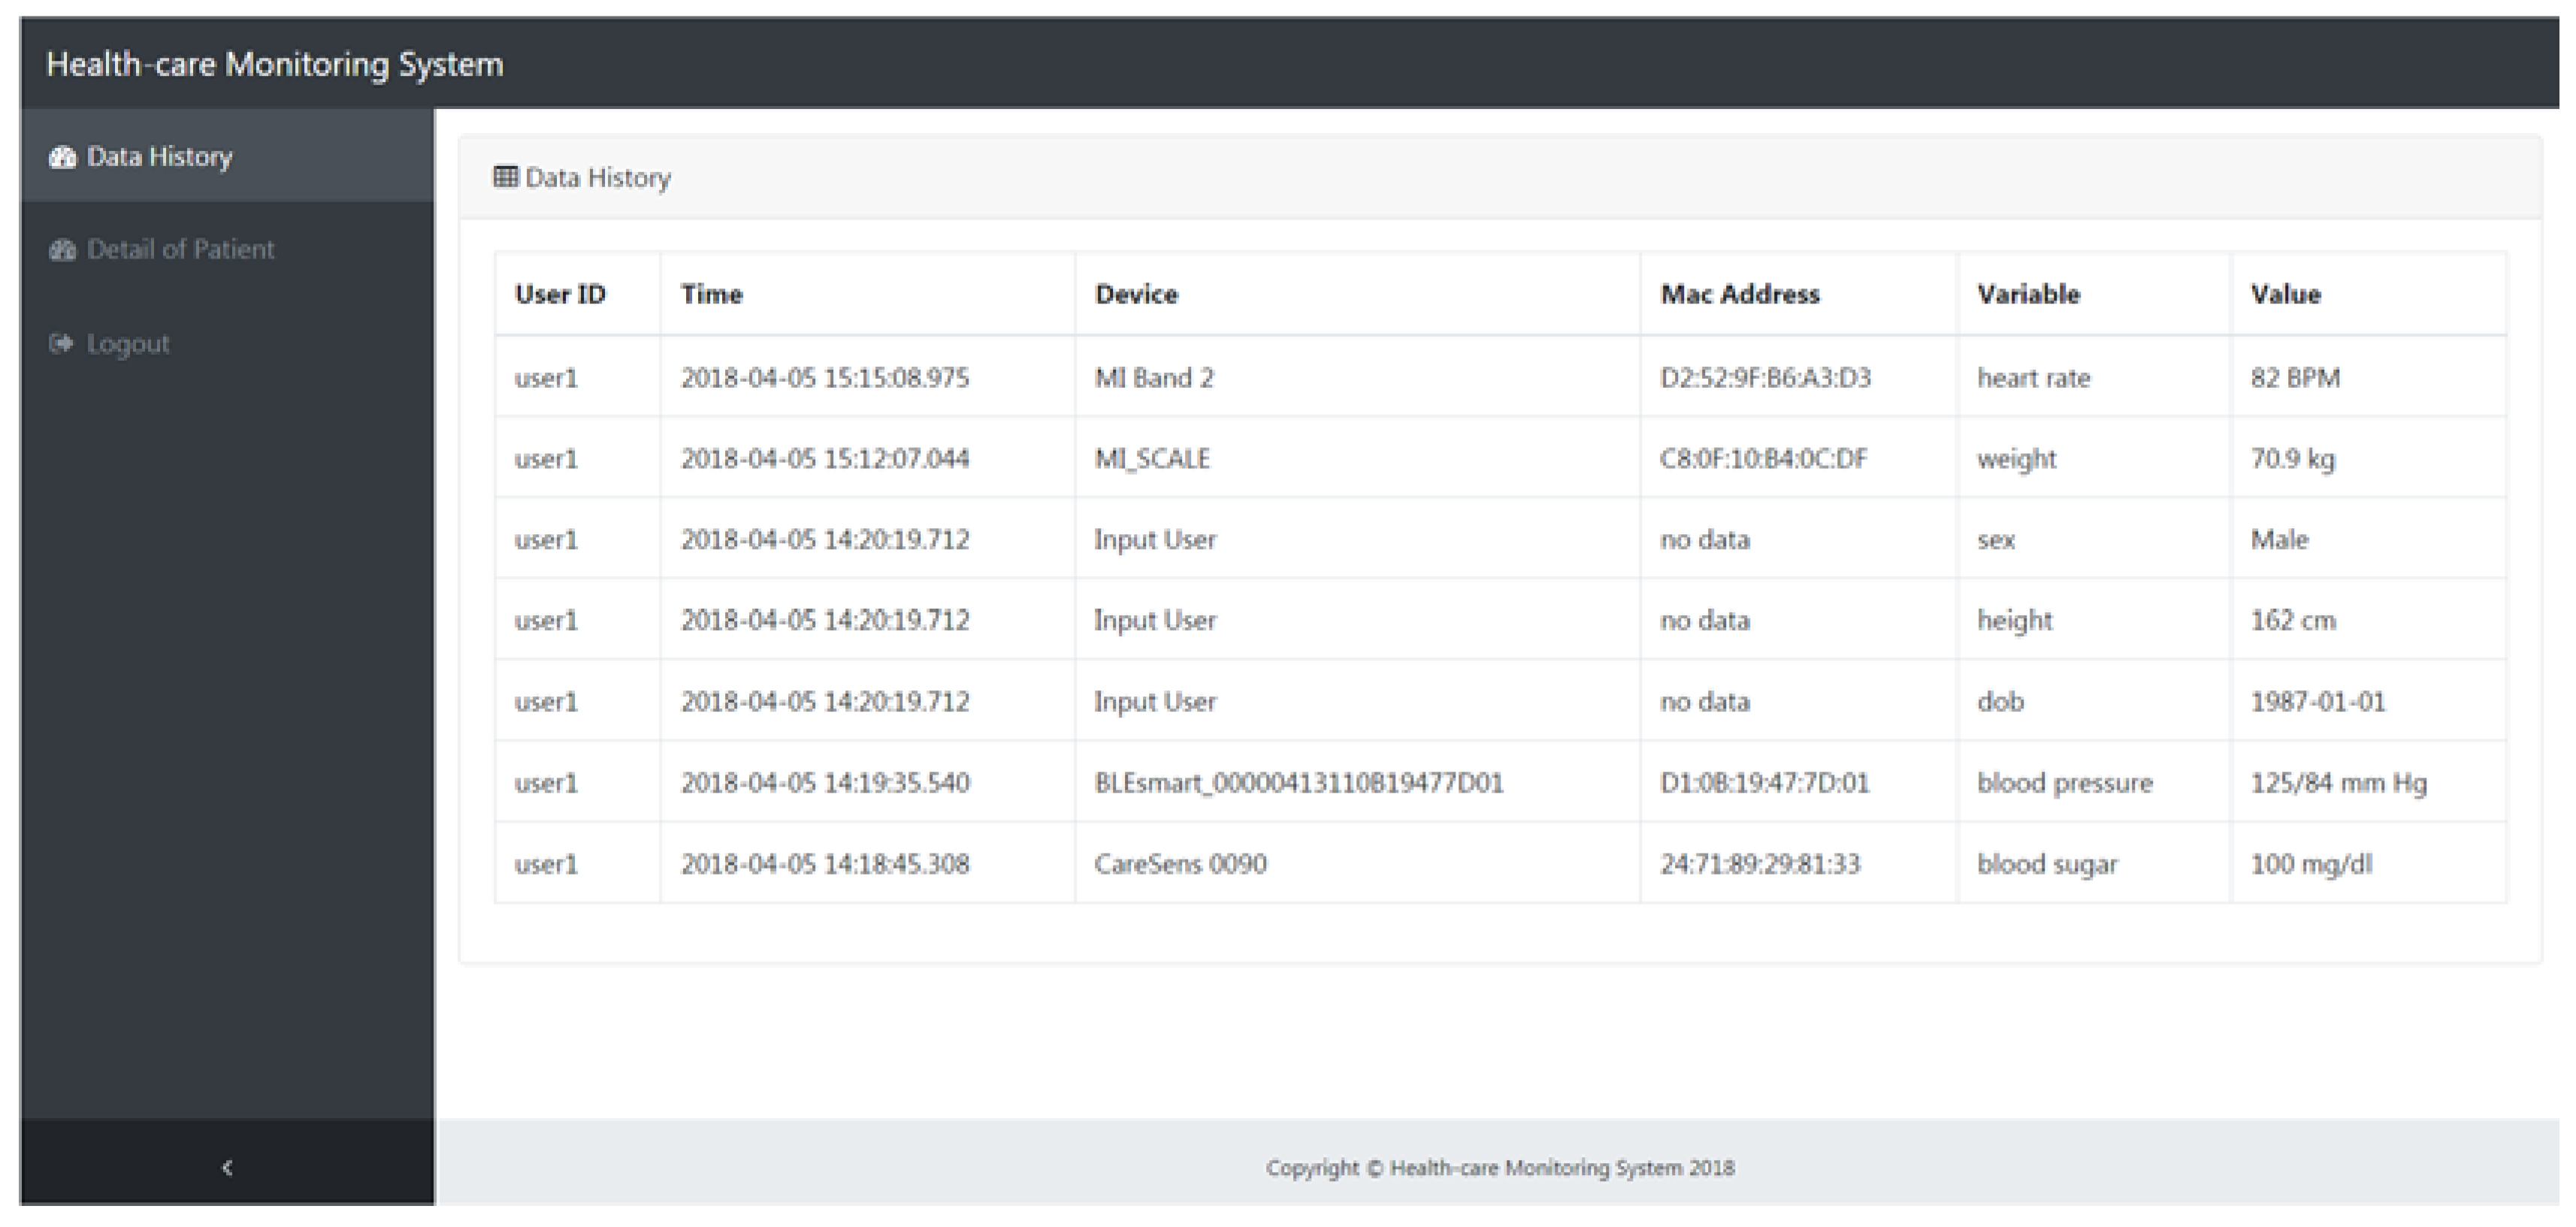
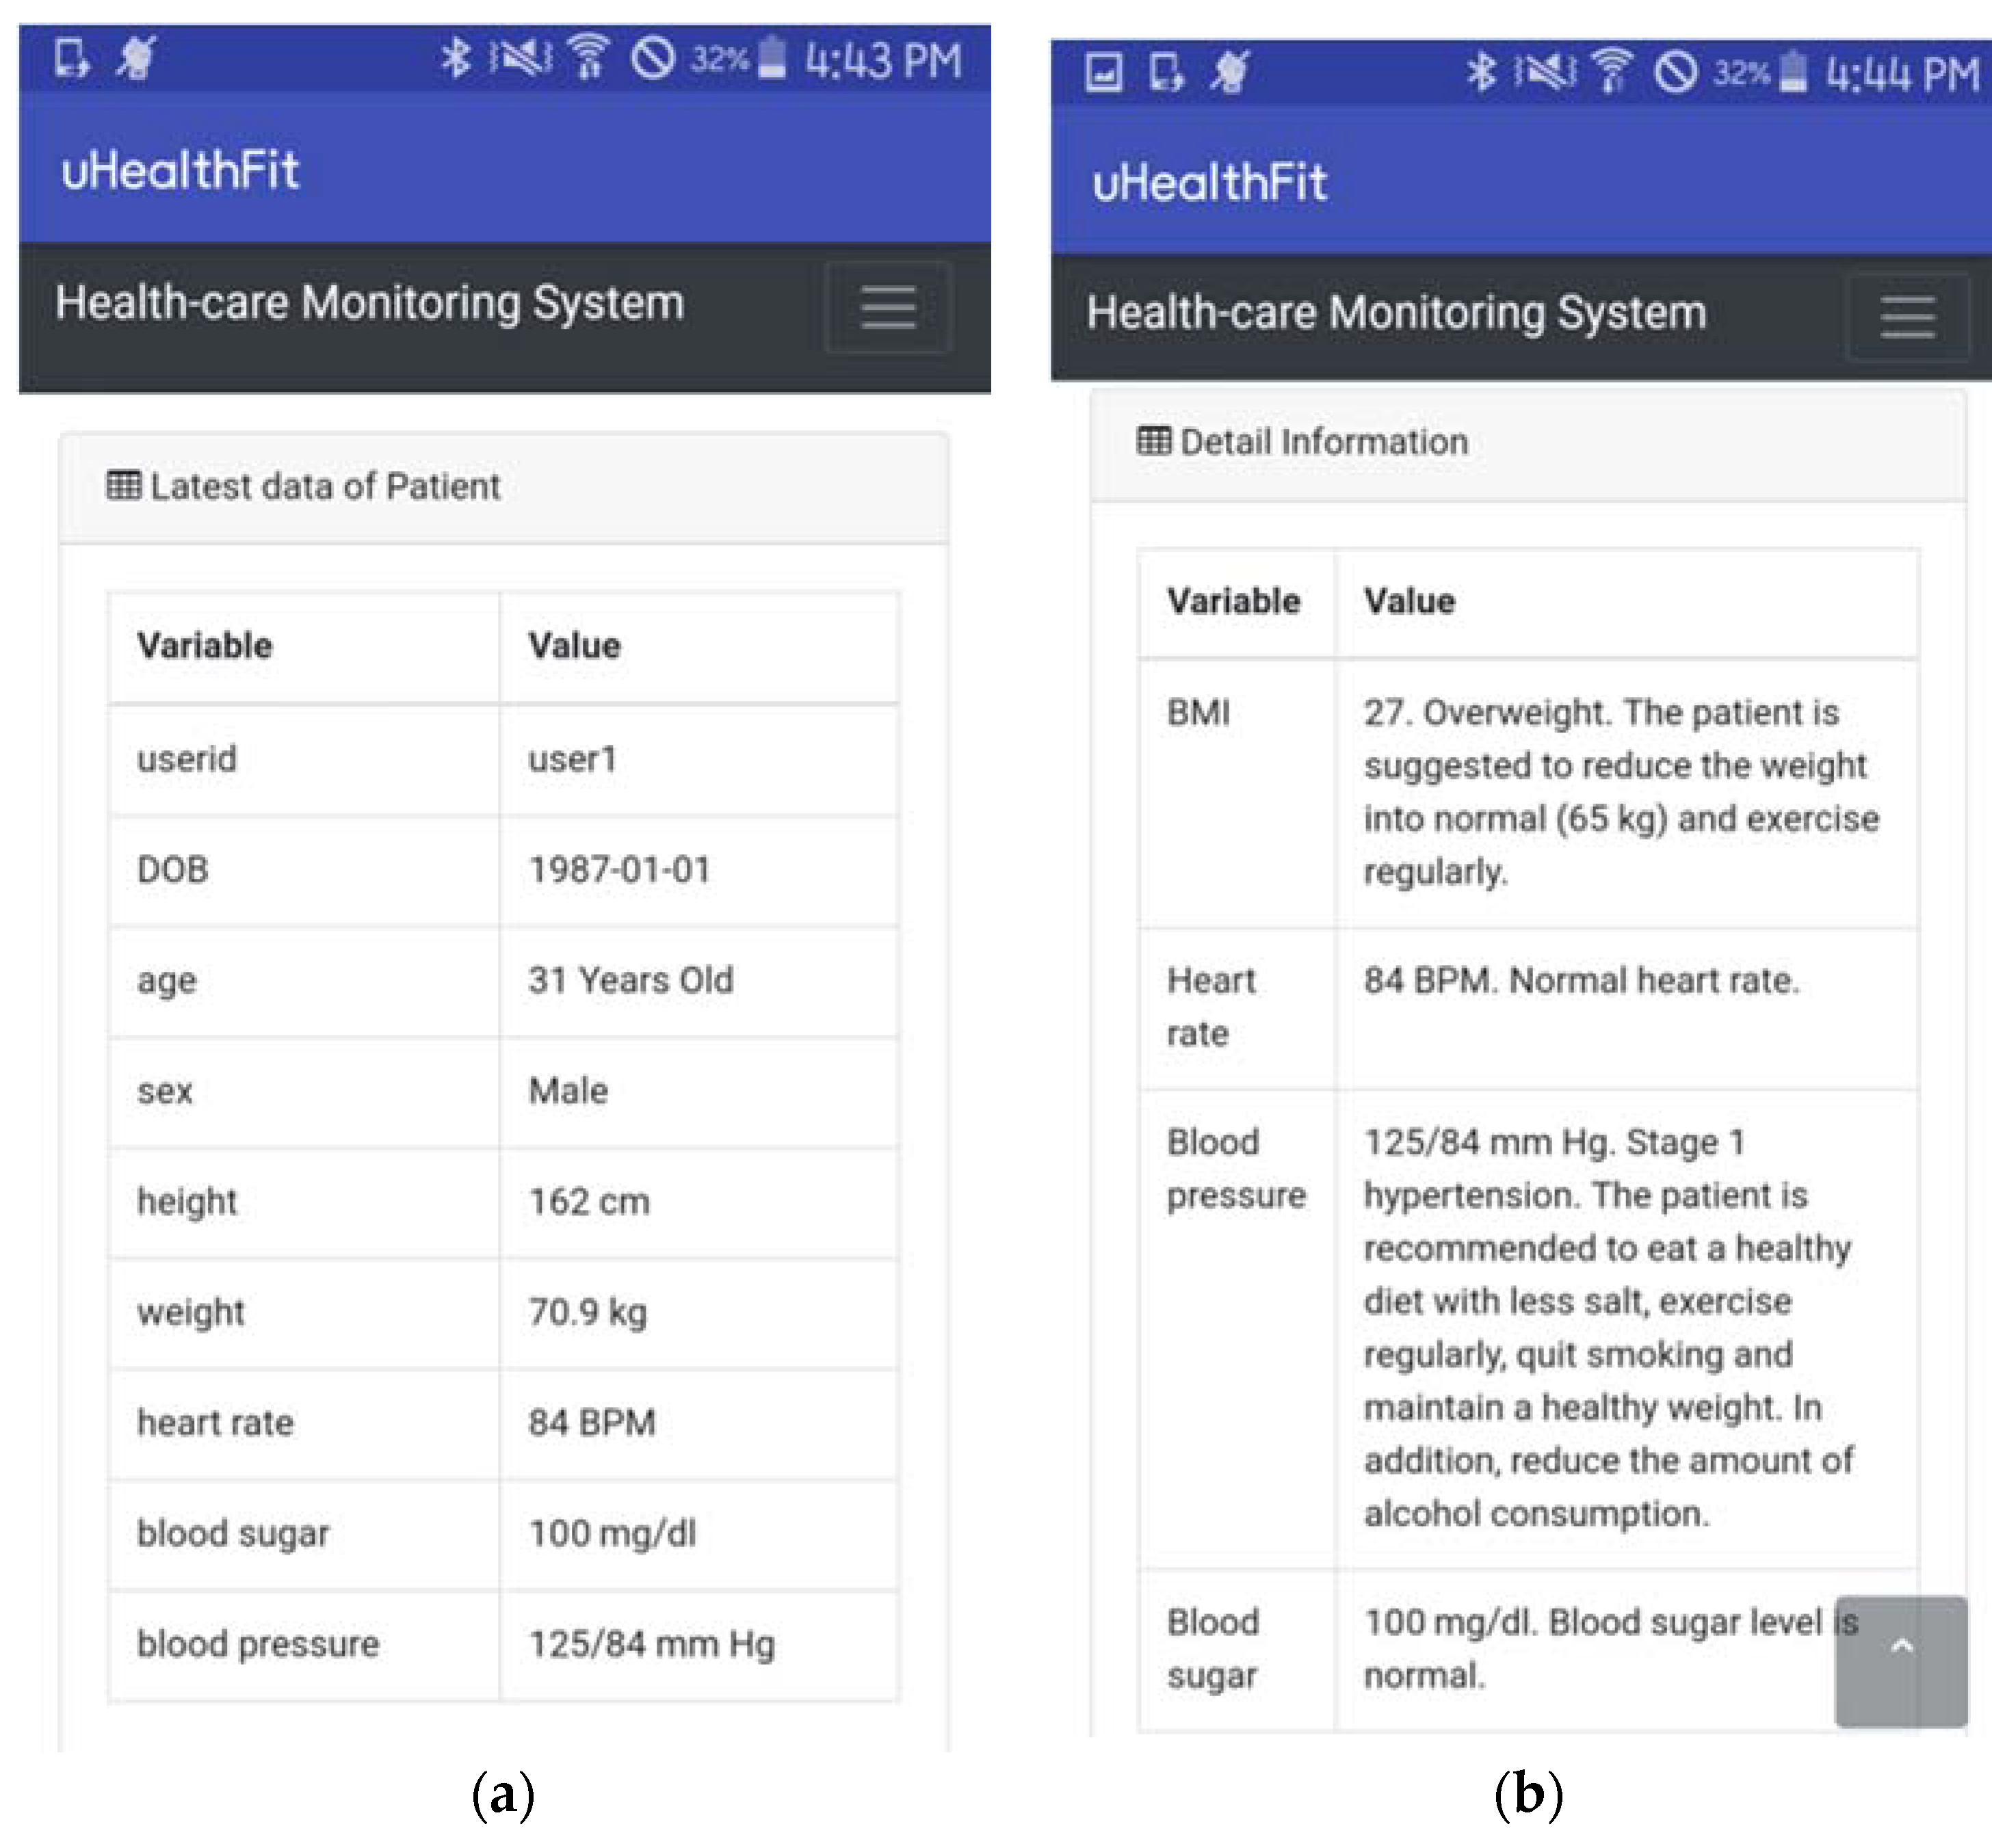
4.1. The Healthcare Monitoring System
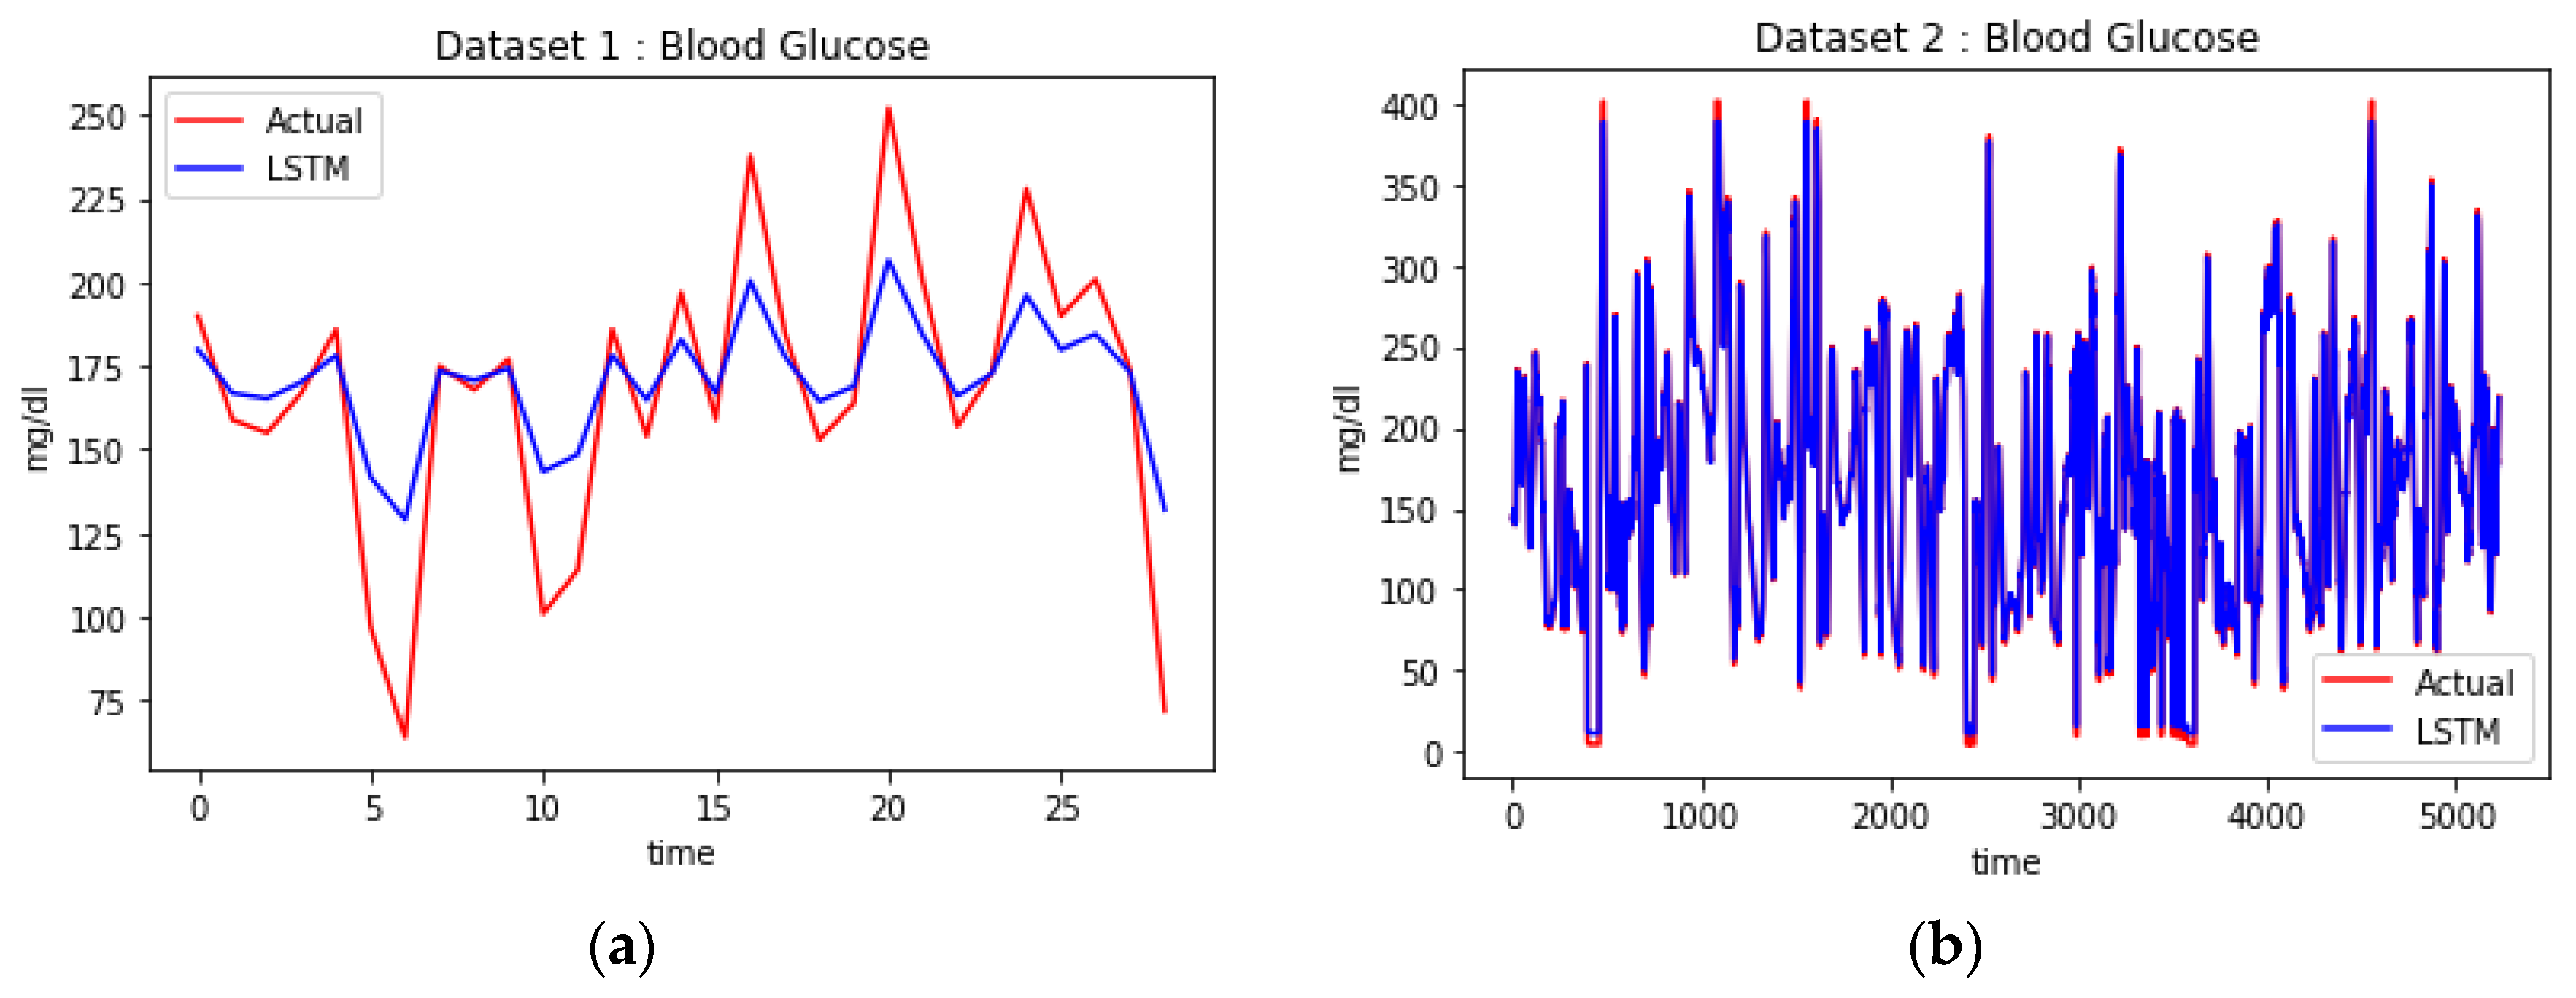
4.2. Diabetes Classification and BG Prediction
4.3. The Implications for Diabetes Management
5. Conclusions and Future Works
Author Contributions
Acknowledgments
Conflicts of Interest
References
- World Health Organization. Definition, Diagnosis, and Classification of Diabetes Mellitus and Its Complications. Part 1: Diagnosis and Classification of Diabetes Mellitus; World Health Organization: Geneva, Switzerland, 1999. [Google Scholar]
- American Diabetes Association. Standards of medical care in diabetes–2006. Diabetes Care. 2006, 29 (Suppl. 1), s4–s42. [Google Scholar]
- Acciaroli, G.; Vettoretti, M.; Facchinetti, A.; Sparacino, G. Calibration of minimally invasive continuous glucose monitoring sensors: State-of-the-art and current perspectives. Biosensors 2018, 13, 24. [Google Scholar] [CrossRef] [PubMed]
- Rubino, F. Is type 2 diabetes an operable intestinal disease? A provocative yet reasonable hypothesis. Diabetes Care 2008, 31 (Suppl. 2), S290–S296. [Google Scholar] [CrossRef] [PubMed]
- Korean Diabetes Association. Diabetes Fact Sheet in Korea. 2016. Available online: http://www.diabetes.or.kr/temp/KDA_fact_sheet%202016.pdf (accessed on 1 May 2018).
- National Diabetes Statistics Report. Estimates of Diabetes and Its Burden in the United States. 2017. Available online: https://www.cdc.gov/diabetes/pdfs/data/statistics/national-diabetes-statistics-report.pdf (accessed on 1 May 2018).
- Wild, S.; Roglic, G.; Green, A.; Sicree, R.; King, H. Global prevalence of diabetes: Estimates for the Year 2000 and projections for 2030. Diabetes Care 2004, 27, 1047–1053. [Google Scholar] [CrossRef] [PubMed]
- Tun, N.N.; Arunagirinathan, G.; Munshi, S.K.; Pappachan, J.M. Diabetes mellitus and stroke: A clinical update. World J. Diabetes 2017, 8, 235–248. [Google Scholar] [CrossRef] [PubMed]
- American Diabetes Association. Introduction: Standards of medical care in diabetes—2018. Diabetes Care 2018, 41 (Suppl. 1), S1–S2. [Google Scholar] [CrossRef]
- Hayes, C.; Kriska, A. Role of physical activity in diabetes management and prevention. J. Am. Diet. Assoc. 2008, 108 (Suppl. 1), S19–S23. [Google Scholar] [CrossRef] [PubMed]
- Ley, S.H.; Hamdy, O.; Mohan, V.; Hu, F.B. Prevention and management of type 2 diabetes: Dietary components and nutritional strategies. Lancet 2014, 383, 1999–2007. [Google Scholar] [CrossRef]
- Clark, L.C., Jr.; Lyons, C. Electrode systems for continuous monitoring in cardiovascular surgery. Ann. N. Y. Acad. Sci. 1962, 102, 29–45. [Google Scholar] [CrossRef] [PubMed]
- Heller, A.; Feldman, B. Electrochemical glucose sensors and their applications in diabetes management. Chem. Rev. 2008, 108, 2482–2505. [Google Scholar] [CrossRef] [PubMed]
- Bruen, D.; Delaney, C.; Florea, L.; Diamond, D. Glucose sensing for diabetes monitoring: Recent developments. Sensors 2017, 17, 1866. [Google Scholar] [CrossRef] [PubMed]
- Bode, B.W.; Battelino, T. Continuous glucose monitoring. Int. J. Clin. Pract. Suppl. 2010, 64, 11–15. [Google Scholar] [CrossRef] [PubMed] [Green Version]
- Torres, I.; Baena, M.G.; Cayon, M.; Ortego-Rojo, J.; Aguilar-Diosdado, M. Use of sensors in the treatment and follow-up of patients with diabetes mellitus. Sensors 2010, 10, 7404–7420. [Google Scholar] [CrossRef] [PubMed]
- Rodríguez-Rodríguez, I.; Zamora-Izquierdo, M.-Á.; Rodríguez, J.-V. Towards an ICT-based platform for type 1 diabetes mellitus management. Appl. Sci. 2018, 8, 511. [Google Scholar] [CrossRef]
- Nieminen, J.; Gomez, C.; Isomaki, M.; Savolainen, T.; Patil, B.; Shelby, Z.; Xi, M.; Oller, J. Networking solutions for connecting Bluetooth low energy enabled machines to the Internet of Things. IEEE Netw. 2014, 28, 83–90. [Google Scholar] [CrossRef]
- Patel, M.; Wang, J. Applications, challenges, and prospective in emerging body area networking technologies. IEEE Wirel Commun. 2010, 17, 80–88. [Google Scholar] [CrossRef]
- Liu, J.; Chen, C. Energy Analysis of Neighbor Discovery in Bluetooth Low Energy Networks; Technical Report; Nokia Research Center/Radio System Lab.: Beijing, China, 2012. [Google Scholar]
- Gomez, C.; Oller, J.; Paradells, J. Overview and evaluation of Bluetooth low energy: An emerging low-power wireless technology. Sensors 2012, 12, 11734–11753. [Google Scholar] [CrossRef]
- Fahim, M.; Idris, M.; Ali, R.; Nugent, C.; Kang, B.; Huh, E.N.; Lee, S. ATHENA: A personalized platform to promote an active lifestyle and wellbeing based on physical, mental and social health primitives. Sensors 2014, 14, 9313–9329. [Google Scholar] [CrossRef] [PubMed]
- Han, S.H.; Kim, K.O.; Cha, E.J.; Kim, K.A.; Shon, H.S. System framework for cardiovascular disease prediction based on big data technology. Symmetry 2017, 9, 293. [Google Scholar] [CrossRef]
- Huh, J.H. Big data analysis for personalized health activities: Machine learning processing for automatic keyword extraction approach. Symmetry 2018, 10, 93. [Google Scholar] [CrossRef]
- Van der Veen, J.S.; Van der Waaij, B.; Meijer, R.J. Sensor data storage performance: SQL or NoSQL, physical or virtual. In Proceedings of the 2012 IEEE Fifth International Conference on Cloud Computing, Honolulu, HI, USA, 24–29 June 2012; pp. 431–438. [Google Scholar]
- Schulz, W.L.; Nelson, B.G.; Felker, D.K.; Durant, T.J.S.; Torres, R. Evaluation of relational and NoSQL database architectures to manage genomic annotations. J. Biomed. Inform. 2016, 64, 288–295. [Google Scholar] [CrossRef] [PubMed]
- Pereira, D.A.; Ourique de Morais, W.; Pignaton de Freitas, E. NoSQL real-time database performance comparison. Int. J. Parallel Emerg. Distrib. Syst. 2018, 33, 144–156. [Google Scholar] [CrossRef]
- Hu, F.; Xu, M.; Yang, J.; Liang, Y.; Cui, K.; Little, M.M.; Lynnes, C.S.; Duffy, D.Q.; Yang, C. Evaluating the open source data containers for handling big geospatial raster data. ISPRS Int. J. Geo-Inf. 2018, 7, 144. [Google Scholar] [CrossRef]
- Goli-Malekabadi, Z.; Sargolzaei-Javan, M.; Akbari, M.K. An effective model for store and retrieve big health data in cloud computing. Comput. Methods Prog. Biomed. 2016, 132, 75–82. [Google Scholar] [CrossRef] [PubMed]
- Nkenyereye, L.; Jang, J.-W. Performance evaluation of server-side javascript for healthcare hub server in remote healthcare monitoring system. Procedia Comput. Sci. 2016, 98, 382–387. [Google Scholar] [CrossRef]
- Maniruzzaman, M.; Kumar, N.; Menhazul, A.M.; Shaykhul, I.M.; Suri, H.S.; El-Baz, A.S.; Suri, J.S. Comparative approaches for classification of diabetes mellitus data: Machine learning paradigm. Comput. Methods Programs Biomed. 2017, 152, 23–34. [Google Scholar] [CrossRef] [PubMed]
- Cheruku, R.; Edla, D.R.; Kuppili, V. SM-RuleMiner: Spider monkey based rule miner using novel fitness function for diabetes classification. Comput. Biol. Med. 2017, 81, 79–92. [Google Scholar] [CrossRef] [PubMed]
- Wu, H.; Yang, S.; Huang, Z.; He, J.; Wang, X. Type 2 diabetes mellitus prediction model based on data mining. Inform. Med. Unlocked 2018, 10, 100–107. [Google Scholar] [CrossRef]
- Meng, X.; Huang, Y.; Rao, D.; Zhang, Q.; Liu, Q. Comparison of three data mining models for predicting diabetes or prediabetes by risk factors. Kaohsiung J. Med. Sci. 2013, 29, 93–99. [Google Scholar] [CrossRef] [PubMed]
- Perveen, S.; Shahbaz, M.; Guergachi, A.; Keshavjee, K. Performance analysis of data mining classification techniques to predict diabetes. Procedia Comput. Sci. 2016, 82, 115–121. [Google Scholar] [CrossRef]
- Nai-arun, N.; Moungmai, R. Comparison of classifiers for the risk of diabetes prediction. Procedia Comput. Sci. 2015, 69, 132–142. [Google Scholar] [CrossRef]
- Sparacino, G.; Zanderigo, F.; Corazza, S.; Maran, A.; Facchinetti, A.; Cobelli, C. Glucose concentration can be predicted ahead in time from continuous glucose monitoring sensor time-series. IEEE Trans. Biomed. Eng. 2007, 54, 931–937. [Google Scholar] [CrossRef] [PubMed]
- Plis, K.; Bunescu, R.; Marling, C.; Shubrook, J.; Schwartz, F. A Machine Learning Approach to Predicting Blood Glucose Levels for Diabetes Management. AAAI Workshops. Modern Artificial Intelligence for Health Analytics. Available online: https://www.aaai.org/ocs/index.php/WS/AAAIW14/paper/view/8737 (accessed on 1 May 2018).
- Ahmed, H.B.; Serener, A. Effects of external factors in CGM sensor glucose concentration prediction. Procedia Comput. Sci. 2016, 102, 623–629. [Google Scholar] [CrossRef]
- Hamdi, T.; Ali, J.B.; Di Costanzo, V.; Fnaiech, F.; Moreau, E.; Ginoux, J. Accurate prediction of continuous blood glucose based on support vector regression and differential evolution algorithm. Biocybern. Biomed. Eng. 2018, 38, 362–372. [Google Scholar] [CrossRef]
- Yoo, E.H.; Lee, S.Y. Glucose biosensors: An overview of use in clinical practice. Sensors 2010, 10, 4558–4576. [Google Scholar] [CrossRef] [PubMed]
- Sparacino, G.; Zanon, M.; Facchinetti, A.; Zecchin, C.; Maran, A.; Cobelli, C. Italian contributions to the development of continuous glucose monitoring sensors for diabetes management. Sensors 2012, 12, 13753–13780. [Google Scholar] [CrossRef] [PubMed]
- Cohen, M.; Boyle, E.; Delaney, C.; Shaw, J. A comparison of blood glucose meters in Australia. Diabetes Res. Clin. Pract. 2006, 71, 113–118. [Google Scholar] [CrossRef] [PubMed]
- Buckingham, B.A.; Kollman, C.; Beck, R.; Kalajian, A.; Fiallo-Scharer, R.; Tansey, M.J.; Fox, L.A.; Wilson, D.M.; Weinzimer, S.A.; Ruedy, K.J.; et al. Evaluation of factors affecting CGMS calibration. Diabetes Technol. Ther. 2006, 8, 318–325. [Google Scholar] [PubMed]
- Marvicsin, D.; Jennings, P.; Ziegler-Bezaire, D. What is new in diabetes technology? J. Nurse Pract. 2017, 13, 205–209. [Google Scholar] [CrossRef]
- Dohr, A.; Modre-Opsrian, R.; Drobics, M.; Hayn, D.; Schreier, G. The Internet of Things for ambient assisted living. In Proceedings of the 7th International Conference on Information Technology: New Generations ITNG 2010, Las Vegas, NV, USA, 12–14 April 2010; pp. 804–809. [Google Scholar]
- Miorandi, D.; Sicari, S.; De Pellegrini, F.; Chlamtac, I. Internet of Things: Vision, applications and research challenges. Ad Hoc Netw. 2012, 10, 1497–1516. [Google Scholar] [CrossRef]
- Koutny, T.; Krcma, M.; Kohout, J.; Jezek, P.; Varnuskova, J.; Vcelak, P.; Strnadek, J. On-line blood glucose level calculation. Procedia Comput. Sci. 2016, 98, 228–235. [Google Scholar] [CrossRef]
- Filippoupolitis, A.; Oliff, W.; Takand, B.; Loukas, G. Location-enhanced activity recognition in indoor environments using off the shelf smart watch technology and BLE beacons. Sensors 2017, 17, 1230. [Google Scholar] [CrossRef] [PubMed]
- Mokhtari, G.; Anvari-Moghaddam, A.; Zhang, Q.; Karunanithi, M. Multi-residential activity labelling in smart homes with wearable tags using BLE technology. Sensors 2018, 18, 908. [Google Scholar] [CrossRef] [PubMed]
- Wang, S.-S. A BLE-Based Pedestrian Navigation System for Car Searching in Indoor Parking Garages. Sensors 2018, 18, 1442. [Google Scholar] [CrossRef] [PubMed]
- Gentili, M.; Sannino, R.; Petracca, M. BlueVoice: Voice communications over Bluetooth Low Energy in the Internet of Things scenario. Comput. Commun. 2016, 89–90, 51–59. [Google Scholar] [CrossRef]
- Suárez, J.I.; Arroyo, P.; Lozano, J.; Herrero, J.L.; Padilla, M. Bluetooth gas sensing module combined with smartphones for air quality monitoring. Chemosphere 2018, 205, 618–626. [Google Scholar] [CrossRef] [PubMed]
- Zhang, T.; Lu, J.; Hu, F. Bluetooth low energy for wearable sensor-based healthcare systems. In Proceedings of the 2014 Helath Innovations and Point-of-Care Technologies Conference, Seattle, WA, USA, 8–10 October 2014; pp. 251–254. [Google Scholar]
- Omre, A.H. Bluetooth low energy: Wireless connectivity for medical monitoring. J. Diabetes Sci. Technol. 2010, 4, 457–463. [Google Scholar] [CrossRef] [PubMed]
- Rachim, V.P.; Chung, W.Y. Wearable Noncontact Armband for Mobile ECG Monitoring System. IEEE Trans. Biomed. Circuits Syst. 2016, 10, 1112–1118. [Google Scholar] [CrossRef] [PubMed]
- Mora, H.; Gil, D.; Terol, R.M.; Azorín, J.; Szymanski, J. An IoT-based computational framework for healthcare monitoring in mobile environments. Sensors 2017, 17, 2302. [Google Scholar] [CrossRef] [PubMed]
- Arsand, E.; Muzny, M.; Bradway, M.; Muzik, J.; Hartvigsen, G. Performance of the first combined smartwatch and smartphone diabetes diary application study. J. Diabetes Sci. Technol. 2015, 9, 556–563. [Google Scholar] [CrossRef] [PubMed]
- Cappon, G.; Acciaroli, G.; Vettoretti, M.; Facchinetti, A.; Sparacino, G. Wearable Continuous Glucose Monitoring Sensors: A Revolution in Diabetes Treatment. Electronics 2017, 6, 65. [Google Scholar] [CrossRef]
- Morón, M.J.; Luque, R.; Casilari, E. On the capability of smartphones to perform as communication gateways in medical wireless personal area networks. Sensors 2014, 14, 575–594. [Google Scholar] [CrossRef] [PubMed]
- Lee, M.; Gatton, T.M.; Lee, K.K. A monitoring and advisory system for diabetes patient management using a rule-based method and KNN. Sensors 2010, 10, 3934–3953. [Google Scholar] [CrossRef] [PubMed]
- Keith-Hynes, P.; Mize, B.; Robert, A.; Place, J. The diabetes assistant: A smartphone-based system for real-time control of blood glucose. Electronics 2014, 3, 609–623. [Google Scholar] [CrossRef]
- Garnweidner-Holme, L.M.; Borgen, I.; Garitano, I.; Noll, J.; Lukasse, M. Designing and developing a mobile smartphone application for women with gestational diabetes mellitus Followed-up at diabetes outpatient clinics in Norway. Healthcare 2015, 3, 310–323. [Google Scholar] [CrossRef] [PubMed] [Green Version]
- Dobre, C.; Xhafa, F. Intelligent services for big data science. Future Gener. Comput. Syst. 2014, 37, 267–281. [Google Scholar] [CrossRef]
- Zhong, R.Y.; Huang, G.Q.; Lan, S.; Dai, Q.Y.; Chen, X.; Zhang, T. A big data approach for logistics trajectory discovery from RFID-enabled production data. Int. J. Prod. Econ. 2015, 165, 260–272. [Google Scholar] [CrossRef]
- Apache Kafka. Available online: https://kafka.apache.org/ (accessed on 14 May 2018).
- MongoDB. Available online: https://www.mongodb.com/ (accessed on 14 May 2018).
- Kreps, J.; Narkhede, N.; Rao, J. Kafka: A distributed messaging system for log processing. In Proceedings of the NetDB, Athens, Greece, 12–16 June 2011. [Google Scholar]
- Fernández-Rodríguez, J.Y.; Álvarez-García, J.A.; Fisteus, J.A.; Luaces, M.R.; Magaña, V.C. Benchmarking real-time vehicle data streaming models for a Smart City. Inf. Syst. 2017, 72, 62–76. [Google Scholar] [CrossRef]
- Syafrudin, M.; Fitriyani, N.L.; Li, D.; Alfian, G.; Rhee, J.; Kang, Y.S. An Open Source-Based Real-Time Data Processing Architecture Framework for Manufacturing Sustainability. Sustainability 2017, 9, 2139. [Google Scholar] [CrossRef]
- Han, J.; Kamber, M.; Pei, J. Data Mining: Concepts and Techniques, 3rd ed.; Morgan Kaufmann Publishers: Burlington, MA, USA, 2011. [Google Scholar]
- GATT Overview. Available online: https://www.bluetooth.com/specifications/gatt/generic-attributes-overview (accessed on 14 May 2018).
- Smith, J.W.; Everhart, J.E.; Dickson, W.C.; Knowler, W.C.; Johannes, R.S. Using the ADAP learning algorithm to forecast the onset of diabetes mellitus. In Proceedings of the Symposium on Computer Applications in Medical Care, Washington, DC, USA, 9 November 1988; Greenes, R.A., Ed.; IEEE Computer Society Press: Los Alamitos, CA, USA, 1988; pp. 261–265. [Google Scholar]
- Rumelhart, D.E.; Hinton, G.E.; Williams, R.J. Learning representations by back-propagating errors. Nature 1986, 323, 533–536. [Google Scholar] [CrossRef]
- Buduma, N.; Locascio, N. Fundamentals of Deep Learning: Designing Next-Generation Machine Intelligence Algorithms; O’Reilly Media: Sebastapol, CA, USA, 2017. [Google Scholar]
- Diabetes Dataset. Available online: https://archive.ics.uci.edu/ml/datasets/diabetes (accessed on 14 May 2018).
- CGM Dataset. Available online: https://choens.github.io/blood-sugars/ (accessed on 14 May 2018).
- Hochreiter, S.; Schmidhuber, J. Long short-term memory. Neural Comput. 1997, 9, 1735–1780. [Google Scholar] [CrossRef] [PubMed]
- Colberg, S.R.; Sigal, R.J.; Yardley, J.E.; Riddell, M.C.; Dunstan, D.W.; Dempsey, P.C.; Horton, E.S.; Castorino, K.; Tate, D.F. Physical Activity/exercise and diabetes: A position statement of the American Diabetes Association. Diabetes Care 2016, 39, 2065–2079. [Google Scholar] [CrossRef] [PubMed]
- Klein, S.; Sheard, N.F.; Pi-Sunyer, X.; Daly, A.; Wylie-Rosett, J.; Kulkarni, K.; Clark, N.G. Weight management through lifestyle modification for the prevention and management of type 2 diabetes: Rationale and strategies. Diabetes Care 2004, 27, 2067–2073. [Google Scholar] [CrossRef] [PubMed]


| Performance Metric | Formula |
|---|---|
| Precision | |
| Recall | |
| Accuracy |
| Method | Precision (%) | Recall (%) | Accuracy (%) |
|---|---|---|---|
| Random Forest | 72.7 | 73 | 73.046 |
| NB | 76.1 | 76.7 | 76.6927 |
| SVM | 76 | 76.6 | 76.562 |
| Logistic Regression | 75.4 | 76.0 | 76.0417 |
| MLP | 76.6 | 77.1 | 77.083 |
| Performance Metric | Formula |
|---|---|
| Correlation coefficient (r) | |
| RMSE |
| Dataset | Method | RMSE | r |
|---|---|---|---|
| Dataset 1 | LSTM | 25.621 | 0.647 |
| Linear Regression | 44.069 | −0.019 | |
| Moving Average | 47.487 | −0.183 | |
| Dataset 2 | LSTM | 2.285 | 0.999 |
| Linear Regression | 82.592 | −0.071 | |
| Moving Average | 42.946 | 0.710 |
© 2018 by the authors. Licensee MDPI, Basel, Switzerland. This article is an open access article distributed under the terms and conditions of the Creative Commons Attribution (CC BY) license (http://creativecommons.org/licenses/by/4.0/).
Share and Cite
Alfian, G.; Syafrudin, M.; Ijaz, M.F.; Syaekhoni, M.A.; Fitriyani, N.L.; Rhee, J. A Personalized Healthcare Monitoring System for Diabetic Patients by Utilizing BLE-Based Sensors and Real-Time Data Processing. Sensors 2018, 18, 2183. https://doi.org/10.3390/s18072183
Alfian G, Syafrudin M, Ijaz MF, Syaekhoni MA, Fitriyani NL, Rhee J. A Personalized Healthcare Monitoring System for Diabetic Patients by Utilizing BLE-Based Sensors and Real-Time Data Processing. Sensors. 2018; 18(7):2183. https://doi.org/10.3390/s18072183
Chicago/Turabian StyleAlfian, Ganjar, Muhammad Syafrudin, Muhammad Fazal Ijaz, M. Alex Syaekhoni, Norma Latif Fitriyani, and Jongtae Rhee. 2018. "A Personalized Healthcare Monitoring System for Diabetic Patients by Utilizing BLE-Based Sensors and Real-Time Data Processing" Sensors 18, no. 7: 2183. https://doi.org/10.3390/s18072183