Review

Monitoring System Analysis for Evaluating a Building’s Envelope Energy Performance through Estimation of Its Heat Loss Coefficient

by
Catalina Giraldo-Soto
1,*,
Aitor Erkoreka
1,
Laurent Mora
2,
Irati Uriarte
1 and
Luis Alfonso Del Portillo
1
1
ENEDI Research Group—Faculty of Engineering of Bilbao, University of Basque Country (UPV/EHU), Alameda Urquijo s/n, 48013 Bilbao, Spain
2
I2M—Institute of Mechanics and Engineering—University of Bordeaux CNRS (UMR 5295), site ENSAM, Esplanade des arts et métiers, 33400 Talence, France
*
Author to whom correspondence should be addressed.
Sensors 2018, 18(7), 2360; https://doi.org/10.3390/s18072360
Submission received: 30 May 2018 / Revised: 28 June 2018 / Accepted: 10 July 2018 / Published: 20 July 2018
(This article belongs to the Special Issue Sensors for Fault Detection)

Abstract

:
The present article investigates the question of building energy monitoring systems used for data collection to estimate the Heat Loss Coefficient (HLC) with existing methods, in order to determine the Thermal Envelope Performance (TEP) of a building. The data requirements of HLC estimation methods are related to commonly used methods for fault detection, calibration, and supervision of energy monitoring systems in buildings. Based on an extended review of experimental tests to estimate the HLC undertaken since 1978, qualitative and quantitative analyses of the Monitoring and Controlling System (MCS) specifications have been carried out. The results show that no Fault Detection and Diagnosis (FDD) methods have been implemented in the reviewed literature. Furthermore, it was not possible to identify a trend of technology type used in sensors, hardware, software, and communication protocols, because a high percentage of the reviewed experimental tests do not specify the model, technical characteristics, or selection criteria of the implemented MCSs. Although most actual Building Automation Systems (BAS) may measure the required parameters, further research is still needed to ensure that these data are accurate enough to rigorously apply HLC estimation methods.

1. Introduction

In this paper, we introduce energy consumption in Europe, the role of the Heat Loss Coefficient (HLC) estimation in understanding the envelope effect on the Energy Performance of Buildings (EPB), the monitoring systems used for this estimation, and the role of fault detection in building energy monitoring systems. In Table A1, all acronyms used in this text can be found.
Butler and Dengel [1] define Heat Loss Coefficient (HLC) as the total heat loss from a building resulting from heat transfer through the envelope (walls, roof and floor) and from background ventilation per °C of temperature difference between inside and outside (expressed as W/K)). This review define the Thermal Envelope Performance (TEP) refers to a characteristic that can be used to evaluate the energy performance of a building envelope. The TEP can be characterized by estimation of the Heat Loss Coefficient (HLC), the energy consumption due to envelope performance or envelope’s characterization (R-value or U-value, dynamic thermal models of the envelope …).
Estimating the Heat Loss Coefficient (HLC) and the Thermal Envelope Performance (TEP) characterization of buildings are important to better understand their energy efficiency, in order to generate Energy Performance Certificates (EPCs). These can be employed as a tool to determine the discrepancies between performances at the design and operation phases of buildings. Actual TEP, actual energy equipment performance, and user behavior are the three main reasons for a building to consume energy differently than its design conditions suggest. European regulations ensure transparent and consistent EPCs through reliable methodologies to estimate the TEP of buildings. These methodologies used for HLC estimation in turn need to be fed with physical variables collected and processed by a Monitoring and Controlling System (MCS), which is composed of elements with the necessary precision to generate reliable EPCs. Likewise, MCS require faults to be detected and minimized in order to guarantee a higher level of accuracy in results by minimizing the error in calculations. Currently, existing smart buildings are monitored and controlled with various building systems (e.g., HVAC, heating, light systems), but do not have an integrated MCS of the type currently used in experimental tests to estimate the TEP and HLC.

1.1. Energy Consumption of Buildings in Europe

The potential for energy demand growth from connected devices in buildings, whether they are smart or not, has already been noted in many European Union (EU) markets, according to a study carried out by Statistics in the Control and Connectivity segment, ‘the number of active households is expected to amount to 43.7 m by 2022’ [2]. In the International Energy Agency (IEA) Central Scenario, 50% of household electricity demand for appliances by 2040 is expected to come from connected devices, presenting opportunities for a smart demand response, but also increasing the need for standby power. ‘Improving the operational efficiency of buildings by using real-time data could lower total energy consumption between 2017 and 2040 by as much as 10% compared with the Central Scenario, assuming limited rebound effects in consumer energy demand’ [3].
Increasing the energy efficiency of buildings can generate economic, social, and environmental benefits and improve the building performance, providing better comfort and wellbeing levels to users as health can be affected by indoor climate improvements. It is necessary to reduce the energy consumption of buildings, which represents approximately 40% of energy consumption in Europe, in order to reduce CO2 emissions [4].
Approximately 35% of buildings in the EU are over 50 years old. Of this percentage, only around 0.4–1.2% (depending on the country) are renewed annually. This implies that a greater renovation of existing buildings could generate significant energy savings through the reduction of 5–6% of the EU’s total energy consumption, and 5% of the total CO2 emissions [5]. The “Action Plan for Energy Efficiency: Realizing the Potential” calls to all regional and local authorities to develop energy efficiency plans and transpose into national legislation directives on the energy performance of buildings [6].
On 30 November 2016, the European Commission presented a proposal for a modest review of Directive 2010/31/EU on the Energy Efficiency of Buildings [7]. Some of the measures in the Clean Energy Package aim to meet the objectives of energy and climate of the EU 2030, together with the Directive on the Energy Efficiency of Buildings (EPBD) [8] which is aimed at achieving the EU’s energy efficiency objectives that are also addressed in the Energy Efficiency Directive (EED) [9]. The proposed revision of the EED (part of the Clean Energy Package) establishes a greater number of energy efficiency measures by 2030, in order for Member States to achieve at least 20% improvements in energy efficiency by 2020 [9,10]. This reduction of 20% is a matter of urgency in the action plan and is equivalent to around 390 Mtoe. This energy reduction is supported by the Green Paper on energy efficiency [11,12].
Energy efficiency and renewable energy technologies were the leading areas of Research, Development and Design (RD&D) investment of the European Commission in 2015, reaching significant shares (24% and 26%, respectively) of the total energy RD&D budget. RD&D for fossil fuels had the smallest share, accounting for 6% of the total budget in 2015 [13], and everything indicates that this investment trend will be maintained in order to carry out the measures in the Clean Energy Package and meet the 2030 goals.

1.2. The MCSs Role in Energy Performance Certificates and the HLC to Characterize the Thermal Envelope Performance of Buildings

The Energy Performance of Buildings Directive 2010/31/EU [7], in order to guarantee uniform conditions for its application, proposes to grant powers to the European Union for rating the smart readiness of buildings. These powers must be exercised in accordance with Regulation (EU) No 182/2011 of the European Parliament and of the Council [14]. This regulation specifies the need to have a smartness indicator that is used to measure the capacity of buildings to use Information and Communication Technologies and electronic systems, in order to optimize the operation of the building and to be able to interact with the network. The smartness indicator will create awareness among the owners of buildings and their occupants about the value that lies behind the automation of buildings and the electronic monitoring of technical building systems, increasing the confidence of the occupants in the ability to obtain a real savings when introducing new improved features in their dwellings.
In the same way, this directive talks about the importance of comparing EPCs issued before and after renewal. To do so, a transparent method provided by the installer of the certification or qualification level must be used to measure the performance of the equipment or material used for the renovation, thus guaranteeing their best use in the renovation of buildings in terms of the renovation quality, and to measure the associated financial impact and energy efficiency of buildings. To meet the objectives of the energy efficiency policy for buildings, the transparency of EPCs should be improved by ensuring that all necessary variables for calculations, for both certification and minimum energy performance requirements, are set out and applied consistently.
A report by the EPBD [15,16] remarks on the importance of implementing Monitoring and Control Systems (MCSs) to achieve quality assurance. These are an essential part of assessing compliance rates, which require confidence validation in source data and legitimacy in order to issue compliance reporting and can then be used for certification, such as the EPCs.
According to Article 3 of the EPBD [4], the EU Member must estimate a building’s energy performance using a specific methodology—at minimum using standardized conditions specified by national regulations. Taking into account the HLC is one of the Key Performance Indicators (KPIs) [17] of energy performance.
To estimate the Heat Loss Coefficient (HLC) it is necessary to collect physical variable data of an in-use building or an unoccupied building, depending on the calculus methodology employed, to estimate the HLC. The sensors should measure, among other parameters, the temperature, heating, ventilating, solar radiation, and energy consumption [17,18] to demonstrate the energy efficiency of the building’s envelope. In-use building monitoring will be developed in the next few years to collect physical variables, and could be used to obtain the building’s envelope thermal characteristics.
The Thermal Envelope Performance (TEP) of a whole building is often quantified by the Heat Transfer Coefficient (HTC). ‘HTC’ is interchangeable with a second term, the heat loss coefficient (HLC), which has often been used when reporting Co-Heating results and will be used in this article to refer to the Heat Transfer Coefficient. ‘HTC’ has been adopted as a standard term in line with the naming convention used in ISO 52016-1:2017 [19], the international standard method for calculating the energy performance of a building, which cancels the previous standard ISO 13790:2008 [20]. The HLC is a useful metric that describes the total, time-averaged rate of heat transfer (in watts) from a building in a per-degree-Kelvin difference between indoor and outdoor air temperatures. Each building can be assumed to have a constant HLC—a value that is estimated as a metric in building energy models such as the Standard Assessment Procedure (SAP), which ‘is the United Kingdom (UK) government standard to calculate a buildings’ energy efficiency and carbon emissions’ [21]. By estimating the HLC, the thermal performance of the complete building envelope, as built, can be directly compared with the designed thermal performance independent of occupant behavior and weather conditions.

1.3. The Monitoring Systems Used to Estimate HLC to Determine the Thermal Envelope Performance of Buildings

Given the importance of measuring buildings’ energy performance, this paper reviews the monitoring systems used to show the energy efficiency level of buildings through physical data collected by sensors. This data is used to estimate the energy performance using specific methodologies, which in future will guarantee transparent EPCs for minimum energy consumption. This article will focus on the energy monitoring used in projects to estimate the HLC with two methods: the Averaging Method [17] and the Regression Method, which is similar to the Co-Heating method [1,22]. These, along with other methods, can be used to calculate the Thermal Envelope Performance (TEP) of buildings.
The latest report of Digitalization & Energy [3] of the International Energy Agency (IEA) in 2017 stated that there is a greater potential for energy saving in heating, cooling and lighting, since these together in 2015 accounted for more than 60% of the total demand for final energy in buildings. The report also highlights that sensors, intelligent controls, and connected devices consume energy to maintain connectivity, even when they are in standby mode. To improve the energy performance of the building this necessitates, for example, the use of intelligent thermostats to improve the management of heating and cooling loads, allowing an improved and even remote control of the temperatures throughout the building.
Without automated monitoring and fault detection of the sensors and controls, performance can degrade. The number and range of types of sensors installed in commercial buildings is inadequate to provide sufficient automated (or even visual) monitoring [23].
The characterization of the TEP of in-use buildings and systems requires a monitoring system that provides real data, which in turn requires a minimum sensor set to obtain a correct characterization. The data collected from the sensor set then needs to be analyzed with different and robust methodologies due to the large amount of data obtained from the building monitoring systems.
Currently, some energy monitoring systems are integrated in domotic systems with the objective of giving information about the energy consumption and perform the control of user comfort parameters. However, in order to characterize the TEP of in-use buildings, there is no evidence of the integration of an energy MCS with a minimum sensor set in domoctic systems. This sensor set integer in Building Automation Systems (BAS) or domotic systems would allow us to know the real energy performance of buildings envelopes through TEP characterization after the construction or retrofit of buildings.

1.4. Fault Detection and Calibration in Building Monitoring Systems

Buildings may have operational problems due to degraded equipment, failed sensors, incorrect installation, poor maintenance, and improperly implemented controls. Currently, most problems related to building systems are detected through complaints from occupants or alarms provided by BAS. Detection and diagnosis can be performed automatically and integrally by integrating the experience required to detect and diagnose operational problems into software tools that take advantage of existing sensors and control systems. These tools are not designed to replace the people who operate the building systems, but to help them improve the functioning of those systems. The automatic start-up and diagnosis technologies for systems and building equipment are expected to reduce and act on problems and improve the functioning of the building, through the automatic and continuous detection of performance problems and maintenance requirements that are communicated to the building operators, who can then perform the necessary corrective actions [23].
Due to the large amount of data collected from sensor sets, is necessary to address which calibration system and methodologies are applied in the building energy monitoring systems, and to know the sensor set necessary to characterize the energy performance of in-use buildings’ envelopes. The literature related to fault detection and calibration in building monitoring is focused on the building systems, including fan coils, Heating, Ventilation and Air Conditioning systems (HVACs), heat pumps, air conditioners, commercial refrigerators, lighting, water heaters, chillers and cooling towers, Air Handling Units (AHUs), and Variable Air Volume (VAV) boxes. From all the works reviewed, a specific methodology that could be applied to the entire sensor of the BAS and domotic systems was not found.

2. Materials and Methods

This section begins with a review of building automation, communication protocols, sensors and the fault detection methods most used in building control systems. This gives a perspective on the monitoring and controlling of the system that is necessary in building automation. In order to identify and analyze the MCSs implemented in current research projects, we undertook a review of the literature that, through experimental tests, estimated the HLC using the Average Method, Co-Heating Method, and other methods to characterize the TEP. This reviewed literature allowed the identification of the equipment that makes up MCSs, and that is used to collect and process the physical variables in these experimental tests. Figure 1 shows an abbreviated outline of the development of this section.

2.1. Building Automation

The Building Control System, also termed the Building Automation System (BAS) or Building Management System (BMS), is the control system composed of integrated hardware and software networks that monitors and controls the indoor climatic conditions in building facilities [24].
The Building Automation System (BAS) is installed to monitor and control the heating, cooling, ventilation, air conditioning, lighting, shading, life safety, alarm security systems, and other building systems [25]. The system can be divided into four areas: applications, hardware, communications, and oversights [23]. The BAS is a part of the Intelligent Building, where this ‘intelligence’ implies capturing the current state of the building and its devices through the collection of physical variables and signal processing to make the appropriate adjustments, so that the building inhabitants experience increased marginal utility in terms of comfort and energy cost. Intelligent buildings increase this marginal utility through sensor system integration, computer automation, information and communication systems, smart home appliance devices, and new materials [26].
‘Domotic’ is other term used frequently in reference to building automation; it is defined by S. Millán-Anglés [27] as a scalable set of services integrated into the home that are provided by systems that can configure one or several internal networks of the habitat and that, in turn, can communicate with networks outside the home. These services have functions related to energy saving, technical management of facilities, information, communication, leisure, accessibility, assistance, comfort, and more.
Georgios Lilis [28] defined three hierarchical level of functionality in a BAS. The management level is where all information is collected, aggregated, and represented for further management by the operator. The automation level includes the entire infrastructure for controlling and applying management of the data or system supervision, in which interacting devices range from environmental sensors for luminosity, humidity, temperature, presence, and so forth, to actuators controlling passive devices and environmental parameters such as heating, lighting, and access to premises. Finally, the field level is where all the end-devices and field buses which interface the physical world and are used in the automation of industrial processes and buildings, and which are limited solely to point-to-point communication within the BAS, belong.
The functions of a Building Automation and Control System (BACS) generally include the Heating, Ventilation and Air Conditioning systems (HVACs); domestic hot water; lighting system control; shading systems control; energy conversion and storage (heating and cooling); onsite power generation; monitoring and data acquisition; and communications and security management [29]. Building automation integrates technology in a closed space with intelligent designs, which in turn can be integrated by indoor and outdoor communication networks—wired or wireless—so that energy management is efficient and includes the air conditioning and boiler controls, awning controls, and electric shutter and electricity management.
Economic and legal restrictions regarding energy consumption and environmentalism define building energy borders [26]. House system optimization is possible through the Control System of the BAS, which helps to improve the comfort of the occupants while reducing the energy consumption and expediting the operation, monitoring, and maintenance of the building [25]. The reduction of electricity consumption and improvement in the occupant comfort level make the building an energetically efficient system, which is largely achieved by the interaction of a wide range of sensors that collect physical variables, such the temperature, CO2 concentration, zone airflow, daylight levels, occupancy levels, and so forth [23]. Even so, energy management is conditioned by user behavior and comfort conditions have to take into account the lighting control and heating and cooling system control in the building automation.

2.2. Protocol Communication Used in Building Automation

Communications play a major role in enabling building-wide controls. The communication protocols let communication between devices occur, and are central to data transmission in order to share essential information that allows effective control functioning. This transmission uses physical media through which control information and commands pass between devices via twisted-pair wiring or wireless devices, and has a substantial impact on the installed cost of building controls in building automation systems [23]. Table 1 shows various analogies between the wired and wireless communication protocols.
Today, building automation systems can be realized using a multitude of different standards. In the 2010 IEEE International Symposium on Industrial Electronics, the main building automation protocols were identified as [30]:
  • KNX is an international standard (ISO/IEC 14543-3), European (CENELEC EN 50090 and CEN EN 13321-1) and Chinese (GB/T 20965), open for control in both commercial and residential buildings [31];
  • LonWorks standard is based on the scheme proposed by LON (Local Operating Network). The standard has been ratified by the American National Standards Institute (ANSI) organization as official in 1999 (ANSI/EIA 709.1-A-1999 [32];
  • BACnet is a Data Communication Protocol for Building Automation and Control Networks. Developed under the auspices of the American Society of Heating, Refrigerating and Air-Conditioning Engineers (ASHRAE) 13 5-1995-7 and published in 1995, the BACnet standard has the objective of providing a solution to the systems of automation and control of buildings of different sizes and types [33];
  • EnOcean is the standard based on the Institute of Electrical and Electronics Engineers (IEEE) 802.15.4. Where the modules based on EnOcean technology combine micro power converters with very low power electronics. This technology allows wireless communication between wireless sensors without batteries, switches, controllers and gateways. EnOcean is a wireless energy capture technology used in building automation systems and other industrial applications, transportation, logistics and smart homes [34];
  • Zigbee specifies a set of high-level wireless communication protocols with low-power digital transmission, based on the IEEE 802.15.4 standard for Wireless Personal Area Networks (WPAN) [35].
Currently, the BACnet, LonWorks, KNX and ZigBee technologies (based on IEEE 802.15.4) have attained considerable weight in the global market, as KNX has a strong presence in the European market [28]. Other technologies frequently used in BAS are:
  • INSTEON is a domotic network technology designed by SmartLabs, Inc. (Irvine, CA, USA). It is designed to allow devices such as switches, thermostats, sensors (movement, heat, smoke etc.) to be connected in a network through the power line and the radio frequency [36];
  • Modbus is a communications protocol located at level 7 of the Open System Interconnection (OSI) Model, based on the master/slave architecture (Remote Terminal Unit), or client/server (Transmission Control Protocol/Internet Protocol (TCP/IP)), designed in 1979 by Modicon for its range of Programmable Logic Controllers (PLCs). Developed into a de facto standard communications protocol in the industry, it has the greatest availability for the connection of industrial electronic devices [37];
  • Z-Wave is a wireless communications protocol used mainly for home automation. It is a mesh network that uses low-energy radio waves to communicate from one device to another, allowing wireless control of appliances and other devices [38].
The low-power wireless communication protocols such as EnOcean and Z-Wave are generally used in home automation and industry. Similarly, INSTEON is not restricted and gives support for wireless communication, and while it is generally used for home automation it is not limited to this [25]. According to a report from the Superior Council of Scientific Investigations of Spain (CSIC report (2014)) [27], the most used communication protocols are Wifi, Ethernet, and Bluetooth. As for the control protocols, these are the European Installation Bus and KNX.
On the other hand, the most used framework platforms are Lonworks, Universal Plug and Play (UPnP) architecture; which is an open architecture and allows the interconnection between devices such as personal computers, home appliances, consumer electronics devices and wireless devices [39].
Moreover, Open Services Gateway Initiative (OSGi) that began in 1999 as a set of standards for a Java-based service framework that could be managed remotely. OSGi was originally conceived as a gateway to manage smart devices and other Internet-enabled devices in the home [40].
To translate the protocol information used in an initial network, to the protocol used in the destination network, gateways are used. The approach based on gateway has several disadvantages, storage of large mapping tables is required, and this is a factor that limits the scalability of the BAS since the effort required for configuration and maintenance increases with the translation of all the relevant data points that are incorporated from the appropriate segments. This is a significantly large mapping table to be stored and can be a limiting factor with respect to BAS scalability. In addition, having a front door can introduce a single point of failure and a security risk [41]. The literature demonstrates designs for multi-protocol devices, since this is a gateway-free solution that eliminates the need for specialized gateways for inter-protocol communication, increasing the potential product range available for each manufacturer and decreasing the installation cost and number of devices needed for building automation [41].
Unfortunately, protocols used in building automation are often not compatible with each other, therefore inter-operation across system boundaries requires special gateway solutions. To counteract these limitations, several middleware solutions have been developed that allow the communication of adjacent sides so that there is abstraction of the specific details of the provider of the BAS components [42]. This solution (Middleware) is a software that allows interaction and communication between various applications or packages of programs, networks, hardware, and/or operating systems. The communication hidden the resources heterogeneities of software, operating system, protocols, and so forth determine the interoperability between them [43].
Currently, there is no intrusion detection and prevention available for the BAS networks, which are increasingly extending their functionalities and their connection to internet. This significantly increases the exposure of BAS networks to cyber-attacks due to the significant increase in the attack surface. This also increases the interconnection between communication protocols due to the increase in information services and advanced network technologies, with the need for Cloud Computing and Fog Computing increasing in order to provide solutions for the automation of final physical devices [44], allowing its integration on Internet through a virtual representation, being the vision of Internet of Things (IoT) [45]. The building automation devices are considered for an integration in the IoT in order to have a smart and sustainable building operation [46]. Besides, the main difference between and Fog computing is the Cloud computing ‘refers to both the applications delivered as services over the Internet and the hardware and systems software in the data centers that provide those services’ [46], and Fog computing is a ‘paradigm that extends Cloud computing and services to the edge of the network. Similar to Cloud, Fog provides data, compute, storage, and application services to end-users’ [47].

2.3. Sensors Used in Building Automation

The sensor systems in advanced intelligent buildings are required to provide comfort, high performance and automation, energy and resource savings, and security [26]. In 2010, many modern automated buildings contained a limited number of wired sensors in control systems such as BACnet or LonWorks. This is mainly because the wired sensors need additional wiring for each sensor, wich is a significant barrier in wired sensor deployment due to the increased installation cost. The entrance into the market of low-cost wireless sensors without a need for wire has opened opportunities in the market to increase the number of connected sensors in buildings, thus allowing for improved sensing of the different necessary variables to achieve efficient and effective automation and consequently improve user comfort [48].
For the correct control of the interior conditions, a considerable number of sensors is necessary to control unwanted levels by the users and to achieve optimum levels in the use of energy. It is also necessary to use optimal control techniques in the system and throughout the building to achieve the levels of performance necessary to ensure that the conditions inside the building are of high quality with a minimum consumption of net energy [23,25,26,49].
Previous research has specified the use of sensors and meters for controlling building performance, where the most installed environmental sensors are those measuring temperature, Relative Cumidity (RH), and Carbon Dioxide (CO2)—which are used to control the HVAC operation. This control through environmental variables looks to maximize user comfort with an optimal performance of the HVAC systems [29]. The sensor used to meter electrical power/current is one of the most important types of sensor employed for monitoring energy efficiency. Table 2 shows a list of the main sensors and meters used for control in building automation.
In the literature, there is no specification of the monitoring system necessary to estimate the energy performance of a building’s envelope using a specific methodology, according to Article 3 of the EPBD [4]. However, there are many studies that have been carried out to estimate the HLC in order to characterize the building’s thermal envelope performance, together with other estimations to characterize the energetic behavior of the building envelope. The monitoring systems needed to measure the user’s behavior and comfort are studied in depth in many papers through the control of heating, cooling, and lighting systems, measuring the electrical consumption of homes and buildings in order to know the energy performance of the users. In the next section, we will present the monitoring system necessary to estimate the HLC using Average Methods [17] and the Co-Heating Method or similar [21,22] and will present a review of different monitoring systems used in different studies developed to estimate the HLC.

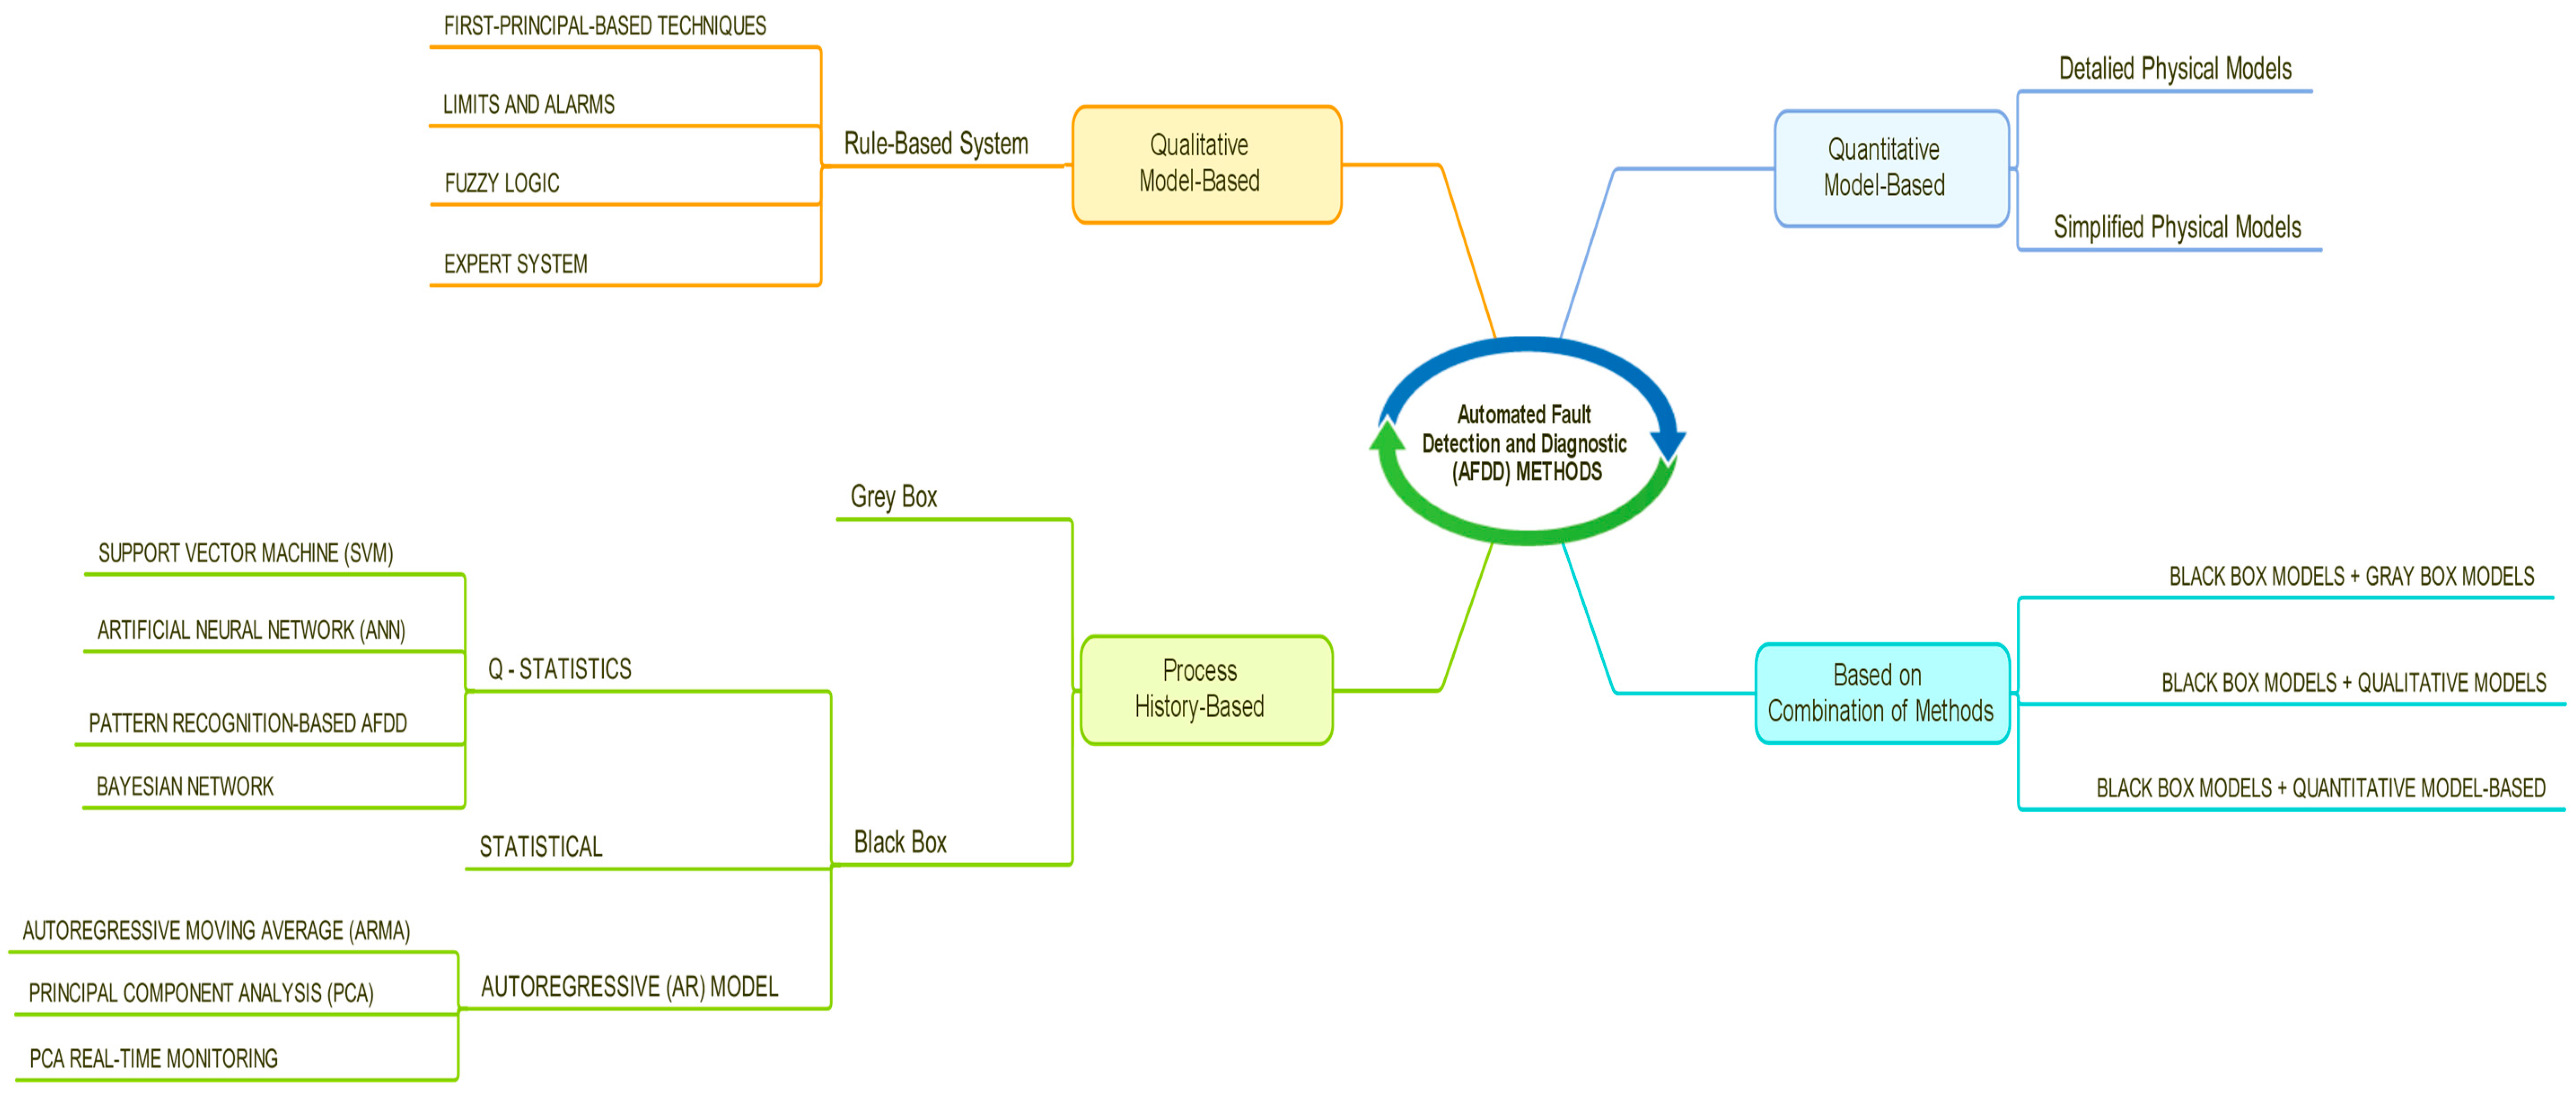
2.4. Fault Detection, Diagnostics, Pronostics and Calibration in Building Monitoring Systems

Evaluating uncertainties in a test can lead to comprehension errors due to the absence of knowledge about the “true” value of a measured variable, especially systematic errors due to the absence of a reference between the true value and the measured value. The true value of a measurement can never be known, but when you measure the HLC of a building it varies in an unknown way and is difficult to predict, and this makes it difficult to assess the uncertainty of the estimate [50]. Some authors have studied the uncertainty in the calculation of the HLC, such as Stamp S. [51] who investigated the uncertainties related to solar gains through field tests and simulated Co-Heating tests.
Sensor errors greatly affect the performance of control, diagnosis, and optimization systems within building energy systems, negatively affecting energy efficiency. Calibrated measurements improve the accuracy of energy performance analysis for a building energy system by up to 18% [52]. It has been reported that the exponential increase of the number of maintenance requests for building energy systems in the past decades is due to an increase in building operational faults [53]. Typical operational faults may arise from improper installation, equipment degradation, sensor offset or failures, or control logic problems. The latter can be split into several categories: control faults, sensor offset, equipment performance degradation, fouling faults, stuck faults, and others [54].
Table 3 shows impact sensor errors in a monitoring system, which reflect the need to implement and integer a tool to detect, predict, diagnose and calibrate the sensor and monitoring systems in all building automation systems in an integral way.
Automated Fault Detection and Diagnosis (AFDD) is an area of investigation concerned with automating the processes of detecting faults [60], whereby faulty operations, degraded performance, and broken components in a physical system are detected and understood. AFDD tools are based on algorithms that process data to determine if the source of the data is experiencing an error. The tool can be passive if the operation of the equipment/system is analyzed without modifying any reference points or control outputs, or active if the changes are made automatically to produce or simulate the operating conditions of a wider range of conditions that could not be modified for some time in a normal operation [23]. The impact of the failures allows determination of the priority of repairs, directly affecting the reduction of energy use and costs and achieving greater comfort and useful life of the equipment, as well as a reduction in service costs. The severity of the failure and its impact on energy consumption is essential to consider in order to prioritize repairs. Assessing the failure or evaluating the impact (energy and cost) is one of the main steps in the AFDD process, however determining the severity of the failure is difficult because in many cases the information necessary to perform the evaluation is not readily available [60].
The sensor and control performance can degrade without automated monitoring and fault detection. The number and range of the types of sensors installed in buildings today is inadequate to provide sufficient automated (or even visual) monitoring. Performance monitoring, automated fault detection and diagnosis, commissioning, optimal control, and the use of developed environments, design tools, and trainers are complementary technologies, with notable potential to realize significant energy savings and other performance improvements in commercial buildings, including existing buildings [23]. All sensor systems are facing a noticeable upward trend in performance requirements for maintenance, downtime, reliability, fault tolerance, fault recovery, and adaptability [26].
The main fault detection and calibration methodologies in building systems include fan coils, HVACs, heat pumps, air conditioners, commercial refrigerators, lighting, water heaters, chillers and cooling towers, AHUs, and VAV boxes [60].
The AFDD methods can be classified into quantitative model-based, qualitative model-based, and process history-based methods [60,61,62] (Figure 2). The history-based process is the most used when the theoretical model of system behavior is inappropriate to explain its behavior, or it is not easy to create the model. In this AFDD method the Black Box is the most used because of its simplicity. The qualitative model-based (rule-based) method is the second most used AFDD method. The quantitative model-based method needs a precise mathematical model of system behavior and reliable sensors for the acquisition of data—as it is the most complex model and the least popular, it is more used for industrial purposes than building landscapes. There are also AFDD methods that combine these three methods, which are used in order to improve the efficiency of individual methods and detect failures simultaneously (e.g., rule-based combined with statistical methods to reduce the noise, disturbances, and uncertainty of monitoring) [60].
AFDD can be integrated into an automatic start-up process. Start-up (new buildings) and commissioning (existing buildings) involve functional tests carried out to determine if a device or system is working correctly. In the commissioning process, the proper functioning of the equipment is verified by observing a series of functional tests, however it is not guaranteed that the equipment can continue to function properly. Only continuous monitoring of the state of the equipment and its performance can guarantee continuous operation. The AFDD system constantly monitors the equipment and identifies failures and loss of performance, and is a fundamental system in the commissioning of buildings. While the intervention of a human operator or repair technician is essential to complete the start-up cycle, without the automated monitoring system operating continuously many problems may not be detected for days, weeks, months, or even years [23].
All studies on fault detection and calibration of monitoring systems that were reviewed did not apply AFDD methodologies in the energy monitoring system to characterize the TEP and to understand the energy efficiency of in-use buildings’ envelopes through HLC estimation. Currently, the methods lack a holistic approach to predict the global impacts of faults at the building level [60].

2.5. Monitoring Systems to Estimate the Heat Loss Coefficient (HLC) Using the Average Method and Co-Heating Method

To guarantee transparent EPCs for minimum energy performances, it is necessary to estimate the energy performance using specific methodologies in order to determine the energy efficiency level of buildings. Physical data collected from the sensors of a monitoring system are necessary for this purpose. This section will focus on the study of energy monitoring systems used in projects to estimate the Heat Loss Coefficient (HLC) with two methods: the Averaging Method [17] and the Co-Heating Method, or similar [1,22].

2.5.1. Methods and Data Requirements to Estimate the Building Envelope HLC

The monitoring requirements of the Average Method and Co-Heating Method were analyzed, showing the main physical variables required and reviewing the monitoring used in different projects published to estimate the HLC.
Corrected Average Method: A. Erkoreka [17] proposed the Average Method and Corrected Average Method, with similarities to the ISO 9869 standard, to estimate the Heat Loss Coefficient (HLC) of the whole building. These methods take into account the k observation of all heat gains inside the building (including the heating system and all the other internal gains, but excluding solar radiation) represented by (Q + K) and the solar gains (SaHsol) (Equation (1)) in specific periods where:
  • There is very low solar radiation and it is possible to roughly estimate the building’s solar heat gains. To minimize the uncertainty of roughly estimating the solar gains, the solar gains should be less than 10% compared to the sum of all the rest of the heat gains inside the building (Q + K).
  • The interior to exterior average temperature difference during the selected testing period should be higher than 15 °C and never less than 10 °C. Furthermore, the building’s average temperature must be the same at the start and end times of the method to make the effect of the change in internal energy of the building negligible.
  H L C N , a i r t o a i r =   k = 1 N ( Q k + K k + S a H s o l , k ) k = 1 N ( T i , k T o , k )  
where:
HLCN, air-to-air [kW/°C] is the air to air Heat Loss Coefficient of the building envelope. The HLC considers both, losses due to transmission and losses due to ventilation and/or infiltration.
Q [kW] is all the heating and ventilating systems’ energy inputs inside the building.
K [kW] is all the other heat gains inside the building (illumination, all other electrical device consumption, and heat gains due to people, solar gains, and Q are not included).
Ti [°C] is the indoor air temperature.
To [°C] is the outdoor air temperature.
Sa [m2] is the solar aperture.
Hsol [W/m2] is the horizontal global solar radiation.
k is the index observations for the period consisting of N measurements of all variables.
To solve this estimation, the physical variables are obtained from five different types of sensors, shown in Table 4.
Co-Heating Method: The Co-Heating test [1] has existed for more than three decades and been used for many purposes. The performance parameters of the building of interest, in the form of the Heat Loss Coefficient (HLC) and the global solar aperture, are determined by applying a linear regression analysis, assuming a simplified thermal equilibrium and aggregate performance data. Therefore, we observe the aggregate performance of its components. A common method to evaluate this is the Co-Heating test. This test essentially represents an almost stationary test based on the linear regression analysis of the aggregate building performance data acquired during the appropriate heating experiments. During a Co-Heating test, the investigated dwelling is heated homogeneously to an indoor temperature of a steady state of 25 °C, using electric heaters and fans scattered throughout the building. The use of electrical energy, indoor and outdoor air temperatures and relative humidity, wind speed and direction, and solar radiation are controlled throughout the test. The influence of the transient effects induced by the loading and unloading of the thermal mass of the building can be reduced by carefully selecting the period of the experiment and averaging the collected data over a sufficient period.
Using the regression analysis, the indoor and outdoor supervised conditions are related to the electric heating energy necessary to maintain a constant indoor air temperature. The coefficient that describes this relationship, representing the thermal performance characteristics of interest, is the Heat Loss Coefficient (HLC) in W/K. The total HLC constitutes a combined loss due to heat transmission and infiltration/ventilation. To decouple both, a Co-Heating test is usually combined with a blower door test or tracer gas test [1,18,22,63,64].
According to the specifications of the standard ISO 13790 [20], it is possible to obtain measurements to estimate the HLC of a dwelling through a Co-Heating test, determining the heat loss throughout the building envelope. The heat loss of the building achieved by the Co-Heating test has some advantages over other possible estimates of independent mechanisms of heat loss; for example, infiltration measurements [65] or point measurements (e.g., measurements of the building envelope independent component U-values, in situ [66]).
D. Butler (2013) [1] used the regression methodology to estimate the HLC (Equation (2)) and the solar aperture (Sa) of the whole building with reference to the south vertical global solar radiation. The Co-Heating test is carried out in winter to reduce the uncertainty effect of solar radiation on the HLC.
  ( Q + K ) =   H L C ( Δ T ) S a V s o l  
where:
Q [kW] is all heating and ventilating systems energy inputs inside the building.
K [kW] is all the other heat gains inside the building (solar gains and Q not included).
T [°C] is the difference between Ti [°C] (the indoor air temperature) and To [°C] (the outdoor air temperature).
Sa [m2] is the solar aperture of the whole building with reference to the south vertical global solar radiation.
Vsol [kW/m2] is the vertical south global solar radiation.
To solve this estimation, the physical variables are obtained from five different types of sensors, shown in Table 5.

2.5.2. Sensor Accuracy of Monitoring Systems Used in an Experimental Test for Evaluating the Building Envelope HLC: A Research Project Sample

In order to have a reference and know the current accuracy used in the experimental test to estimate the HLC, this section presents the sensors used in an occupied big office building (Table 6) together with the communication protocol, hardware, and software (Table 7) that was implemented. The MCS was implemented in a public building of the University of the Basque Country under the 7th Framework Program for Research (FP7) [67] project A2PBEER [68,69] in which an energy characterization [17] was carried out. This building has been retrofitted and is currently being energetically monitored. Their MCS had not implemented any FDD methods.
This project is a sample of how the automation of buildings is being implemented in research. This example and the literature studied in the next section demonstrate the need to implement MCSs in experimental tests to obtain the energy characterization of the building envelope and a correct estimate of the HCL.

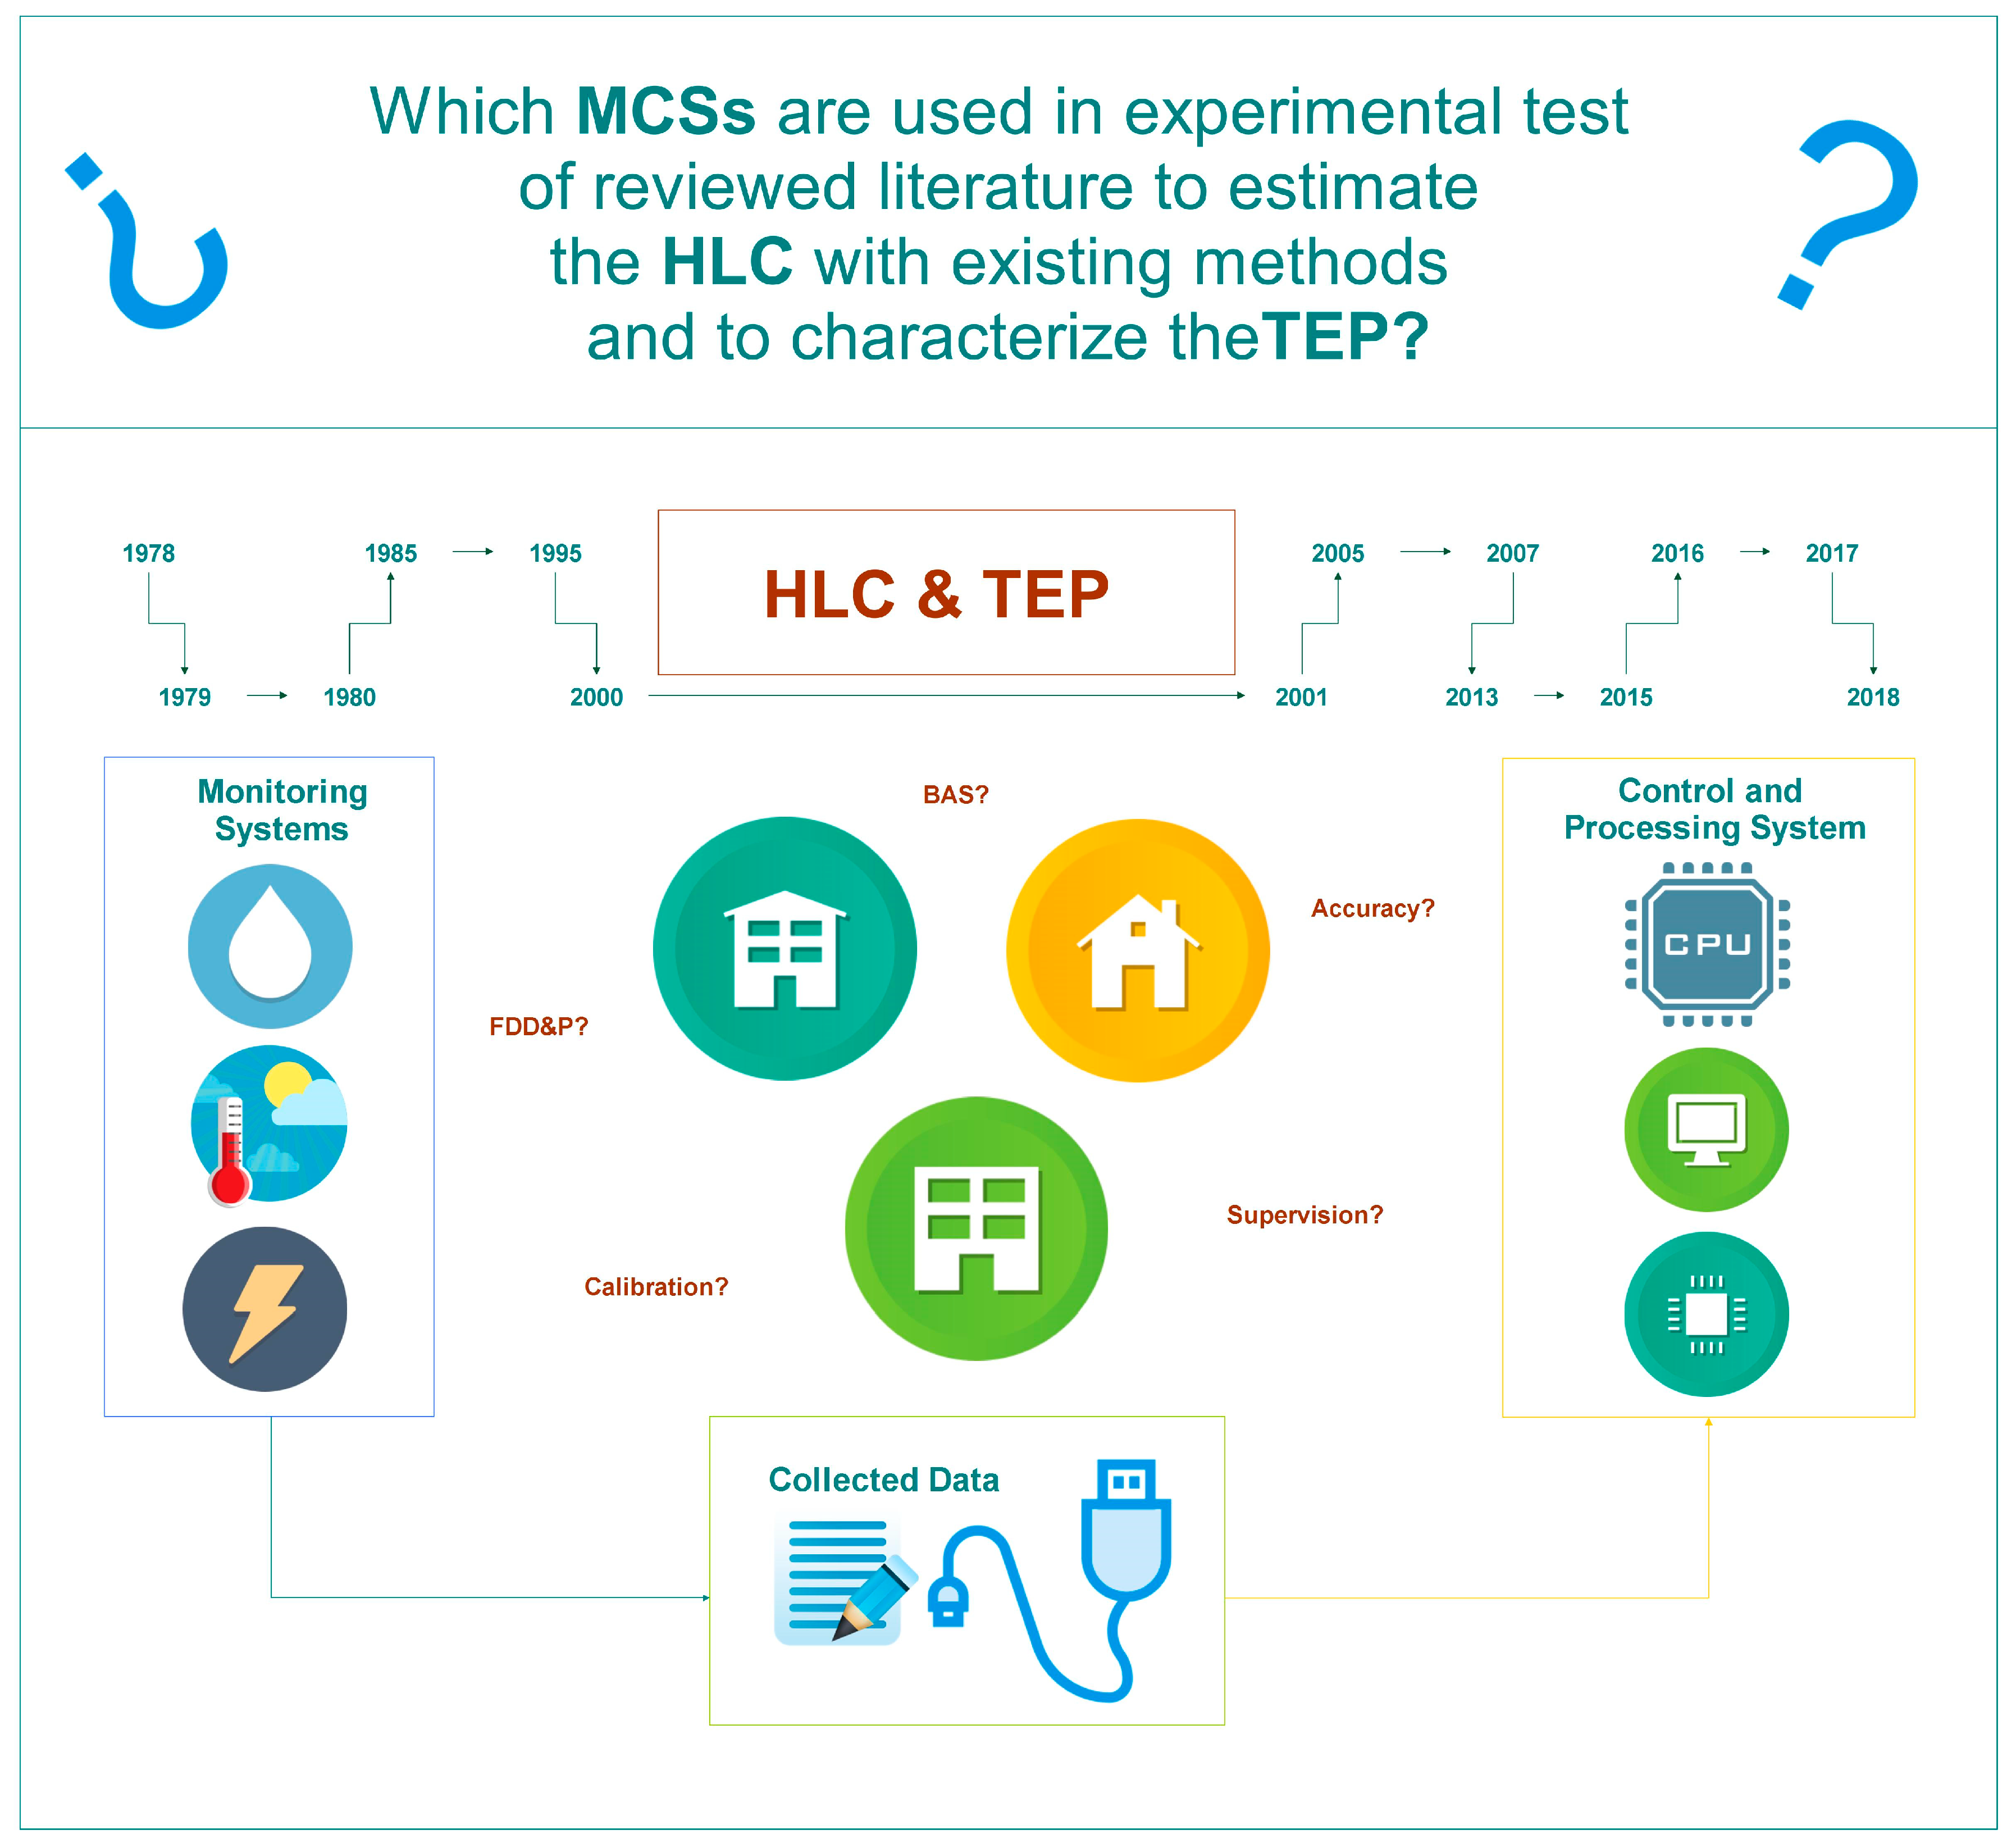
2.5.3. Equipment of Monitoring and Control Systems (MCSs) Used in Research Projects to Estimate the HLC and Characterize the TEP of Buildings: A Review of MCSs in Experimental Tests

In order to know the MCSs used to measure the physical variables necessary to estimate the HLC and TEP, a range of literature has been selected. The purpose of this selection is to identify sensors, controls, hardware and software employed in research studies in order to determine, for example, what kind of accuracy and technical sheet the used sensors have. In addition, the technology used will be analyzed in the discussion section to understand the possibility of implementing the MCSs used in BAS and domotic systems in order to characterize TEP.
The choice of literature took into account several requirements in order to ensure the literature was based not only on an analytical study of HLC estimation and TEP characterization, but also had an experimental basis. The experimental basis should be specific to buildings, housing or prototypes. Within the selection, studies based on simulations or that are purely theoretical or analytical were not taken into account. The requirements for the research to be considered were:
(1)
Studies based on experimental tests of buildings, houses, or prototypes of small scale.
(2)
Studies that were developed with the objective of characterizing TEP in experimental buildings, houses or prototypes of small scale, and that also used one or more of following methods:
(a)
Co-Heating Method.
(b)
Energy Balance.
(c)
Average Method.
(d)
Corrected Average Method.
(e)
Other methods (e.g., statistical methods) for estimating the building envelope energy behavior, but that also include at least one of the following studies:
  • Energy Consumption.
  • Energy Balance.
  • Infiltration.
  • Local U-Value.
  • Other energy analysis (e.g., estimation of the heat dynamic of buildings).
Table 8 shows the relationship of the references selected for this study with the corresponding methods and studies carried out from 1978–2018. The references include reports, journal articles, and conference publications. The literature that was studied includes reports of the first studies of the Co-Heating Method in the 1970s [70], developed by the U.S. Energy Department [71], which analyzed the sensors, controls, instrumentation, hardware and software necessary for MCSs to achieve HLC estimation and other building’s envelope energy behavior estimation to characterize the TEP of buildings. Moreover, in the second decade of the 21st century, an increase of experimental tests was observed, with a greater concentration of publications occurring in 2015, 2016, and 2017. A study from 2018 [72] exists in which a sensitive analysis was carried out to determine the level of uncertainty in the HLC estimation due to the measurements obtained by the sensors. This type of analysis is necessary in order to identify which type of sensors should be implemented in the MCSs of buildings in order to characterize their TEP.
Table 9 shows the sensors, controls, hardware, software, and devices used in the experimental tests of each selected reference, together with the verification of the FDD method that was used, which was not implemented in any of the experimental tests studied. In the next section the results and analysis of MCSs are developed through qualitative and quantitative analyses. Additionally, the methodology and criteria used to obtain the results are described.

3. Results and Discussion

This section will present the qualitative and quantitative analysis of the equipment and the technical specification level of the MCSs utilized in 24 bibliographies that were reviewed, of which 67% used the Co-Heating Method and 17% used other regression methods. One publication estimated the HLC with the Corrected Average Method and another with the Average Method, with each one representing 4% of total publications reviewed. To estimate local U-Values, two of four publications used ISO9869:1994, one publication does not specify the methology implemented, and another was based on ISO 6946:2007 [85]. Seven publications, or 29%, implemented other methodologies to characterize the TEP—for example, statistical methods. These values are specified in Tables 13–15.
The objective of the qualitative and quantitative analyses is to identify the MCSs currently used to estimate the HLC and TEP in order to:
  • Identify the technology used in experimental tests.
  • Analyze the integration of MCSs into BAS.
  • Identify the currently state of FDD methods implemented in MCSs.
Based on data recompilation of Table 9, a qualitative and quantitative analysis were undertaken in terms of the function of the equipment and technical specification level of the MCSs’ described and presented in the methodology reviewed from the literature.
To analyze the MCS technologies used in experimental tests of the selected bibliography; different levels have been defined according to technical specifications that selected publications describe in their experimental methodology. For this, the MCS equipment implemented to collect and process the physical variables to develop the methods for the TEP characterization, which these publications propose, is characterized. The three levels are defined as Level A, B, and C. These levels are quantified as 1, 0.5 and 0, respectively, and the degree of detail that defines the level is shown in Table 10.
The evaluated criteria has been divided into two groups: one to analyze the Monitoring System that include the sensors, and other to analyze the Controlling System that include controls, communication protocols, software and hardware. Table 11 shows the criteria considered to analyze the MCSs’ specification of the degree of technologies used in research projects in the reviewed literature. The MCSs’ specification degree helps to identify the degree of importance of MCSs in HLC estimation and in other estimates used to determinate energy behavior of the buildings, in order to characterize the TEP. This allow us know the reason there is a difficulty in identifying MCS technologies used in experimental tests.
Table 12 shows the review bibliography with the analyzed criteria and the corresponding level for each of them. In analyzing the Monitoring System device criteria, more than 50% of the literature studied falls into level C—where it has not been possible to identify the type or model of the sensors used in those experimental tests. Of 24 bibliographies reviewed an 83.3% did not specify the data sheet, and 58.3% did not specify the sensor’s accuracy either. A total of 79.2% did not describe the decision criteria used to select the sensors (economic, technical, or other criteria). Furthermore, a 67% used the Co-Heating Method and 17% used other regression methods. One publication estimated the HLC with the Corrected Average Method and another with the Average Method, with each one representing 4% of total publications reviewed. To estimate local U-Values, two of four publications used ISO9869:1994, one publication does not specify the methology implemented, and another was based on ISO 6946:2007 [85]. Seven publications, or 29%, implemented other methodologies to characterize the TEP—for example, statistical methods. These values are specified in Table 13, Table 14 and Table 15.
Regarding the Controlling System devices, they showed a similar tendency as the Monitoring System devices, with only around 12.5% giving a complete description specifying the model or type of control devices, the data sheet, and the criteria used to determinate the Control System in terms of the function of its technical requirements. On the other hand, 20.8% specified the protocol communication, software, and hardware used. In addition, just 25% specified the operating characteristics of the hardware and software used to control and process the collected data, respectively, around 21% and 13% specify the hardware and software type and the criterion used to determinate the controlling system implemented.
By studying the publications, it was often possible determine the sensors and devices used when these were not included explicitly in the methodologies because they were specified in the analysis, tables, and/or data graphics. In this way, it was possible to know in some cases the sensors used in the experimental test. Even so, there are publications that did not specify the devices used and just gave the results, making it impossible to identify the devices used in the experimental test. Table 14 and Table 15 show the sensors, devices, software and hardware identified in the selected literature. It was possible to identify in 100% of literature the use of sensors to measure the interior temperature, in 83% those used to measure the exterior temperature, and in around 13% those used to measure surface temperatures. The difference between the exterior and interior temperature may be because these data were collected using weather stations, but neither was found if this measure was collected by a station. In the tests, just 13% and 17 had used sensors to measure indoor CO2 level and indoor relative humidity respectively.
In 21% of experimental tests, infrared thermographics were used, and 50% used different devices to estimate the infiltration. Only 33% used local heat flow sensors. The environmental conditions were measured in several tests, of which 50% specified the horizontal global radiation, 63% the vertical global radiation, and 33% the diffuse radiation and relative humidity sensors.
In 83% of the reviewed literature, an electricity meter was used to measure the total energy consumption. Likewise, in determining the use of other meter sensors, 17% used gas meters, 25% used heat meters, and 8% used HVAC air flow and specific sensors to measure the light electricity consumption.
A total of 67% used the Co-Heating Method for their experimental tests, whereas 94% specify the use of a meter to measure the total electricity consumption and 81% the use of a sensor to measure the exterior temperature; of these, 25% measured the exterior RH and only 13% measured the interior RH. Respectively 50% and 38% measured the global vertical and global horizontal solar radiation, as well a 19% wind speed and 25% measured diffuse solar radiation and wind direction, just 56% and 50% described the use of electrical radiators and fans, respectively. A total of 56% measured air infiltration, 31% used infrared thermographics, 38% used heat flow, and only 6% measured surface temperatures. A 25% and 19% used heating and HVAC systems severally, the use of these building systems in some cases was to maintain the external conditions when a building prototype was being tested, or to avoid stratification during different tests. The physical variables shown in Table 5 are those measured in the Co-Heating Methods developed in selected publications.
Experimental tests in 75% of the reviewed cases that used other regression methods used sensors to measure the total electricity consumption, outdoor temperature, exterior relative humidity, vertical solar radiation, and wind direction, and 50% measured the surface temperature, indoor CO2 concentration, heat flow, gas consumption, and diffuse solar radiation. All of the reviewed research experiments used sensors to measure global horizontal radiation, wind speed, and heating meters. Another 25% with sensors measured the interior relative humidity, infiltration, interior illumination level, light electricity consumption, and exterior illuminance.
The Average Method used in experimental test, specified devices to measure the interior, exterior and surface temperature, heat flow, electricity consumption, exterior relative humidity, horizontal, vertical and diffuse solar radiation, direction and wind speed, besides the use of heating meters. The Corrected Average Method specified measures of the interior and exterior temperature, indoor CO2 concentration, interior and exterior RH and light power consumption, indoor and outdoor illumination levels and horizontal solar radiation, wind speed and also uses heating meters. Each of these methods were used by only one of the experimental tests.
Seven papers (29%) used methods different to Co-Heating, regressions, the Average Method, and the Corrected Average Method for TEP characterization. Two publications used devices to measure the surface temperature, heat flow, indoor CO2 concentration, and gas consumption. Six experimental tests did not measure the interior RH, interior illuminance level, and HVAC airflow. A total of 71% used a sensor meter to measure the total electricity consumption and measure the global horizontal solar radiation, 86% measured the outdoor temperature, and 100% measured the global vertical solar radiation. A total of 57% measured the diffuse radiation, and 43% the exterior RH. Only one publication used an electrical radiator or a heating system, while in two publications an HVAC system was used. A 43% used heat meters and measure infiltrations versus a 57% that measure the direction and wind speed.
Analyzing the devices of Controlling Systems of all literatures, around 42% used a thermostat and 25% used any other device for another purpose, for example to open or close windows. Around 56% of publications that analyzed the Co-Heating test used thermostats, versus 14% of publications that implemented other methods to estimate the energy performance of buildings envelope. Besides the 50% used fans and 56% electric radiators, versus 33% and 42% respectively of all literatures.
No project mentions the use of a Supervisory Control and Data Acquisition (SCADA) for collecting and processing data, although around 54% used a data logger and approximately 33% a data processor.
The communication protocols that were used were not identified; only around 21% of publications specified some characteristic of data transmission, and only one publication specified the use of a gateway or transmitter. A total of 29% of all publications specified the use of computer. The experimental tests that implemented the Co-Heating and other methods to estimate the energy behavior of buildings envelope to characterize TEP, have the same tendency.
The results show that no publication has implemented an FDD method to detect, identify, and correct the error in MCSs used during experimental tests.

4. Conclusions

There is evidence that energy efficiency research is primarily focused on the use of automated projects to collect physical data, transfer the information using standard communication protocols, and through the use of software process all information to control and monitor physical variables and undertake data treatment. Researchers could use centralized automation in their projects to facilitate the collection of a large amount of data. This could help them to not only understand the building envelope behavior, but also develop new services to be integrated into the market of BASs
Currently in BASs, there is no evidence of integration of in-use building energy monitoring systems to characterize the TEP. However, it would be useful to know how efficient the envelope is after the construction or retrofit in order to determine the discrepancy between the building’s design and the building in-use, and to identify future retrofits of the building envelope.
The equipment necessary to carry out the TEP characterization includes sensors, controllers, software, hardware, communication protocols, and other devices and components of MCSs. At the end of the 1970s and the beginning of the 1980s, studies were undertaken regarding the different monitoring technologies and cost/precision criteria for equipment selection used in the energy monitoring of buildings to characterize the TEP of buildings with the estimation of HLC together with other estimations. Currently, there is no evidence from recent studies comparing between the different sensors and equipment used in energy monitoring with existing technologies. There is also no evidence for which monitoring systems should be used to characterize the TEP in BASs or domotic systems.
The reviewed publications do not specify the selection criteria of the monitoring systems used in research projects, which shows that there is no standardization in the type of MCS that should be used to perform experimental tests in these estimations. It is also evident that experimental tests tend to focus more on developing methods to estimate the HLC and other estimations to determinate the envelope energy behaviors of buildings to characterize the TEP, rather than carrying out an analysis to determine the criteria to choose the MCSs. This trend is apparent even though the sensors used to measure physical variables are critical to the reliability of the data collected to perform the TEP characterization. It has been observed, too, that the MCSs used to estimate HLC allow the analysis and estimation of other parameters used to characterize the buildings’ TEP. The physical variables necessary for these estimations are collected in current BASs and domotic systems in order to determine user comfort, electricity consumption, and for the control of the building systems. This makes it possible for the experimental tests used to characterize TEP to be designed from the perspective of BASs and domotic systems, in order to introduce this characterization into these automation systems. For this to be effective, the experimental tests should develop selection criteria for the MCSs in the research projects in order to standardize them.
The standardization of the MCSs used in the TEP characterization in experimental tests needs further research in order to ensure the physical data are accurate enough to rigorously apply the HLC estimation methods. In this way, the HLC estimates for the emission of reliable EPCs according to the requirements of the legislation may be used if they are able to be integrated into BASs and domotic systems. It is also necessary to emphasize the importance of defining the criteria in MCS selection in order to guarantee the technologies are accurate, reliable, profitable, and safe from cyber-attacks.
No publication has been found that develops AFDD methods for the whole monitoring system of a building in BASs or domotic systems. Studies that characterize TEP by testing different sensor technologies to understand any discrepancies in the HLC estimation, and what the sensor response is in building energy monitoring systems, are also lacking. The methods analyzed to estimate the HLC and other estimates to determinate the envelope energy behaviors of building taking into account the errors and the manufacturing precision of the devices used. As an example, to understand the measured discrepancies of temperature, RH, CO2 levels, energy consumption, solar radiation, and other physical variables, it is necessary to know the sensor characteristics used in a building’s automation in the research projects that characterize the TEP. For this, it is essential to know in real-time the faults that occur during the experimental tests, in order to analyze their impact and determine the error discrepancies with the manufacturing data sheet. All of this information is necessary for the implementation of AFDD method in the MCSs of experimental tests.
The literature studied in this paper evidences the use of AFDD methods in building systems like fan coils, HVACs, heat pumps, air conditioners, commercial refrigerators, lighting, water heaters, chillers, cooling towers, AHUs and VAV boxes. However, a specific method for all MCSs used in BASs and domotic systems has not been found, with this being essential in order to integrate FDD methods for all parties that make up these MCSs. It is necessary to develop FDD methods to calibrate, predict and detect the error of all devices in an MCS. This would facilitate the maintenance of the system, allowing its self-regulation and calibration to increase the accuracy and reliability of the studies.
In future, research needs to focus on the effect of the estimation of the HLC and other estimations to determinate the envelope energy behaviors of buildings using different sensor technologies, with laboratory accuracy and market sensor accuracy. This type of research could allow the development of a monitoring kit and control specifications to characterize the TEP, together with their layout in buildings, in order to in the future issue reliable certificates of the energy performance of building with the EPCs. In addition, it is necessary to know the discrepancy in the estimations of the HLC and other estimations to determinate the envelope energy behaviors of buildings. This discrepancy can be determined using the technology of current BASs and domotic systems in order to know if, with the market technology, it is possible to determine the TEP of buildings after the new buildings construction or retrofit of existing buildings. Therefore, knowing how to integrate the standardized MCSs used to estimate the HLC and other estimations to determinate the envelope energy behaviors of buildings, which characterize the TEP, in BASs and domotic systems for new and existing buildings, is essential.

Author Contributions

The main author is C.G.-S. who did the research and theoretical study of the state of the art to develop the review paper, created the methodology to evaluate, quantitatively and qualitatively, the Monitoring and Controlling System used in reviewed literature of experimental tests, together with its corresponding development, analysis and conclusions. Thesis directors of principal author, A.E. and L.M., have carried out the review, supervision of the article and its structure. The section regarding the HLC estimation using Co-Heating Method, Average Method and Corrected Average Method, has been carried out by L.A.d.P. and I.U.

Funding

This work was supported by: Spanish Economy and Competitiveness Ministry and European Regional Development Fund through the IMMOEN project: “Implementation of automated calibration and multiobjective optimization techniques applied to Building Energy Model simulations by means of monitored buildings”. Project reference: ENE2015-65999-C2-2-R (MINECO/FEDER); European Commission through the A2PBEER project “Affordable and Adaptable Public Buildings through Energy Efficient Retrofitting”. Grant agreement No.: 609060; Laboratory for the Quality Control of Buildings (LCCE) of the Basque Government; University of the Basque Country (UPV/EHU). Framework agreement: Euro-regional Campus of Excellence within the context of their respective excellence projects, Euskampus and IdEx Bordeaux. Funder reference: PIFBUR 16/26.

Conflicts of Interest

The authors declare no conflicts of interest.

Appendix A

Table A1. Acronyms list.
AcronymMeaning
A2PBEERAffordable and Adaptable Public Buildings through Energy Efficient Retrofitting
AFDDAutomated Fault Detection and Diagnosis
AHUAir Handling Unit
ANSIAmerican National Standards Institute
ARAutoregressive
ARMAAutoregressive Moving Average
ANNArtificial Neural Network
ASHRAEAmerican Society of Heating, Refrigeration and Air Conditioning Engineers
BACnet Data Communication Protocol for Building Automation and Control Networks
BASBuilding Automation Systems
BMSBuilding Management System
CO2Carbon Dioxide
CSICSuperior Council of Scientific Investigations of Spain
EEDEnergy Efficiency Directive
EPBDEnergy Performance of Buildings Directive
EPCsEnergy Performance Certificates
EUEurope Union
FDDFault Detection and Diagnosis
FP77th Framework Programme for Research and Technological Development
HLCHeat Loss Coefficient
HTCHeat Transfer Coefficient
HVACHeating, Ventilation and Air Conditioning systems
IEAInternational Energy Agency
IEEEInstitute of Electrical and Electronics Engineers
IoTInternet of Things
KPIKey Performance Indicators
LONWorkLocal Operating Network
MCSMonitoring and Controlling System
MtoeMillion Tons of Oil Equivalent
OSGIOpen Services Gateway Initiative
OSIOpen System Interconnection
PCAPrincipal Component Analysis
PLCProgrammable Logic Controllers
PCAPrincipal Component Analysis
RD&DResearch, Development and Design
RFRadio Frequency
RHRelative Humidity
SAPStandard Assessment Procedure
SCADASupervisory Control And Data Acquisition
SVMSupport Vector Machine
TCP/IPTransmission Control Protocol / Internet Protocol
TEPThermal Envelope Performance
UKUnited Kingdom
UPnPUniversal Plug and Play
VAVVariable Air Volume
WPANWireless Personal Area Networks

References

  1. Butler, D.; Dengel, A. Review of Co-Heating Test Methodologies; NHBC Foundation: Knowlhill, UK, 2013. [Google Scholar]
  2. Smart Home-Europe|Statista Market Forecast. Available online: https://www.statista.com/outlook/279/102/smart-home/europe# (accessed on 16 May 2018).
  3. Digitalization and Energy; Digitalization and Energy Working Group-International Energy Agency (IEA): Paris, France, 2017.
  4. Directive 2010/31/EU of the European Parliament and of the Council of 19 May 2010 on the Energy Performance of Buildings; European Union: Brussels, Belgium, 2010.
  5. Buildings-Energy-European Commission. Available online: https://ec.europa.eu/energy/en/topics/energy-efficiency/buildings (accessed on 29 May 2018).
  6. Report on an Action Plan for Energy Efficiency Realising the Potential (2007/2106 (INI)); European Parliament: Brussels, Belgium, 2008.
  7. Proposal for a Directive of the European Parliament and of the Council Amending Directive 2010/31/EU on the Energy Performance of Buildings (2016/0381 (COD)); European Parliament: Brussels, Belgium, 2016.
  8. Energy Performance of Buildings: Impact Assessment (SWD (2016) 414, SWD (2016) 415 (Summary)) of a Commission Proposal for a Directive of the European Parliament and of the Council Amending Directive 2010/31/EU on the Energy Performance of Buildings (COM (2016) 765); European Parliament: Brussels, Belgium, 2017.
  9. Directive 2012/27/EU of the European Parliament and of the Council of 25 October 2012 on Energy Efficiency, Amending Directives 2009/125/EC and 2010/30/EU and repealing Directives 2004/8/EC and 2006/32/EC; European Parliament: Brussels, Belgium, 2012.
  10. Commission Proposes New Rules for Consumer Centred Clean Energy Transition—European Commission. Available online: https://ec.europa.eu/energy/en/news/commission-proposes-new-rules-consumer-centred-clean-energy-transition (accessed on 16 May 2018).
  11. Action Plan for Energy Efficiency: Realising the Potential. COM (2006) 545 Final; European Commission: Brussels, Belgium, 2006.
  12. Green Paper on Energy Efficiency or Doing More with Less. COM(2005) 265 Final; European Commission: Brussels, Belgium, 2005.
  13. Energy Technology RD&D Budgets Overview; The IEA Energy Efficiency Indicators Statistical: Paris, France, 2017.
  14. Regulation (EU) No 182/2011 of the European Parliament and of the Council of 16 February 2011, Laying Down the Rules and General Principles Concerning Mechanisms for Control by Member States of the Commission’s Exercise of Implementing Powers; European Parliament: Brussels, Belgium, 2011.
  15. Proposal for of the European Parliament and of the Council Amending Directive 2010.31.EU on the Energy Performance of Buildings. General approach; European Parliament: Brussels, Belgium, 2017; Vol. 2016/0381 (COD).
  16. Brajterman, O.; Jamieson, M.; Verstraeten, Y.; Arbon, J. EPBD Compliance Study-Final Report. Energy Performance of Buildings Directive (EPBD) Compliance Study Specific Contract No. MOVE/ENER/SRD.1/2012-409-Lot3/ENER/C3/2014-542/S12.701648; European Union: Luxembourg, 2018. [Google Scholar]
  17. Erkoreka, A.; Garcia, E.; Martin, K.; Teres-Zubiaga, J.; Del Portillo, L. In-use office building energy characterization through basic monitoring and modelling. Energy Build. 2016, 119, 256–266. [Google Scholar] [CrossRef]
  18. Johnston, D.; Miles-Shenton, D.; Wingfield, J.; Farmer, D.; Bell, M. Whole House Heat Loss Test Method (Coheating); International Energy Agency Annex 58: Reliable Building Energy Performance Characterisation Based on Full Scale Dynamic Measurements; International Energy Agency: Bilbao, Spain, 2012. [Google Scholar]
  19. ISO. Energy Performance of Buildings—Energy Needs for Heating and Cooling, Internal Temperatures Sensible and Latent Heat Loads—Parte 1: Calculation Procedures; ISO Standard 52016-1; AENOR: Genoa, Italy, 2017. [Google Scholar]
  20. ISO. Thermal Performance of Buildings—Calculation of Energy Use for Space Heating, ISO 13790; AENOR: Genoa, Italy, 2008. [Google Scholar]
  21. Murphy, G.B.; Kummert, M.; Anderson, B.R.; Counsell, J. A comparison of the UK Standard Assessment Procedure (SAP) and detailed simulation of building-integrated renewable energy systems. In Proceedings of the Building Simulation 2009, 11th International Building Performance Simulation Association Conference, Glasgow, Scotland, 27–30 July 2009. [Google Scholar]
  22. Sutton, R.; Stafford, A.; Gorse, C. The Co-Heating Test: The value of a number. In Proceedings of the International Energy Agency Annex 58: Reliable Building Energy Performance Characterisation Based on Full Scale Dynamic Measurements, Bilbao, Spain, 2 April 2012. [Google Scholar]
  23. Brambley, M.R.; Haves, P.; McDonald, S.C.; Torcellini, P.; Hansen, D.; Holmberg, D.R.; Roth, K.W. Advanced Sensors and Controls for Building Applications: Market Assessment and Potential R&D Pathways; Prepared for the U.S. Department of Energy under Contract DE-AC05-76RL01830; Pacific Northwest National Laboratory: Washington, DC, USA, 2005; p. 163. [Google Scholar]
  24. Shaikh, P.H.; Nor, N.B.M.; Nallagownden, P.; Elamvazuthi, I.; Ibrahim, T. A review on optimized control systems for building energy and comfort management of smart sustainable buildings. Renew. Sustain. Energy Rev. 2014, 34, 409–429. [Google Scholar] [CrossRef]
  25. Domingues, P.; Carreira, P.; Vieira, R.; Kastner, W. Building automation systems: Concepts and technology review. Comput. Stand. Interf. 2016, 45, 1–12. [Google Scholar] [CrossRef]
  26. Gassmann, O.; Meixner, H. Sensors in Intelligent Buildings; Wiley-VCH Verlag GmbH: Weinheim, Germany, 2001; Volume 2. [Google Scholar]
  27. Millán-Anglés, S.; García-Santos, A.; Jiménez-Leube, F.J.; Higuera-Rincón, O. Estudio de la influencia de la automatización en el proyecto arquitectónico. Informes Constr. 2014, 66, e020. [Google Scholar] [CrossRef] [Green Version]
  28. Lilis, G.; Conus, G.; Asadi, N.; Kayal, M. Towards the next generation of intelligent building: An assessment study of current automation and future IoT based systems with a proposal for transitional design. Sustain. Cities Soc. 2017, 28, 473–481. [Google Scholar] [CrossRef]
  29. Aste, N.; Manfren, M.; Marenzi, G. Building Automation and Control Systems and performance optimization: A framework for analysis. Renew. Sustain. Energy Rev. 2017, 75, 313–330. [Google Scholar] [CrossRef]
  30. Granzer, W.; Reinisch, C.; Kastner, W. Future challenges for building automation: Wireless and security. In Proceedings of the 2010 IEEE International on Symposium Industrial Electronics, Bari, Italy, 4–7 July 2010; pp. 4415–4467. [Google Scholar]
  31. KNX Association—KNX Association [Official Website]. Available online: https://www.knx.org/knx-en/index.php (accessed on 16 May 2018).
  32. LonMark—News & Events—LON Achieves ISO/IEC Standardization. Available online: http://www.lonmark.org/news_events/press/2008/1208_iso_standard (accessed on 16 May 2018).
  33. BACnet Website. Available online: http://www.bacnet.org/ (accessed on 16 May 2018).
  34. Energy Harvesting Wireless Sensor Solutions and Networks from EnOcean. Available online: https://www.enocean.com/en/ (accessed on 29 May 2018).
  35. Zigbee Alliance. Available online: http://www.zigbee.org/ (accessed on 16 May 2018).
  36. Technology—Insteon. Available online: https://www.insteon.com/technology/ (accessed on 29 May 2018).
  37. The Modbus Organization. Available online: http://www.modbus.org/ (accessed on 20 May 2018).
  38. Z-Wave for OEMs & Developers. Available online: https://z-wavealliance.org/z-wave-oems-developers/ (accessed on 29 May 2018).
  39. OCF-UPnP Standards & Architecture. Available online: https://openconnectivity.org/developer/specifications/upnp-resources/upnp (accessed on 29 May 2018).
  40. OSGiTM Alliance—The Dynamic Module System for Java. Available online: https://www.osgi.org/ (accessed on 29 May 2018).
  41. Granzer, W.; Kastner, W.; Reinisch, C. Gateway-free integration of BACnet and KNX using multi-protocol devices. In Proceedings of the 2008 6th IEEE International Conference on Industrial Informatics, Daejeon, Korea, 13–16 July 2008; pp. 973–978. [Google Scholar]
  42. Wendzel, S.; Kahler, B.; Rist, T. Covert Channels and Their Prevention in Building Automation Protocols: A Prototype Exemplified Using BACnet. In Proceedings of the 2012 IEEE International Conference on Green Computing and Communications, Besancon, France, 20–23 November 2012; pp. 731–736. [Google Scholar]
  43. Singh, J.; Hassanzadeh, N.; Rea, S.; Pesch, D. Semantics-empowered middleware implementation for home ecosystem gateway. In Proceedings of the 2014 IEEE International Conference on Pervasive Computing and Communication Workshops (PERCOM WORKSHOPS), Budapest, Hungary, 24–28 March 2014; pp. 449–454. [Google Scholar]
  44. Pan, Z.; Pacheco, J.; Hariri, S. Anomaly behavior analysis for building automation systems. In Proceedings of the 2016 IEEE/ACS 13th International Conference of Computer Systems and Applications (AICCSA), Agadir, Morocco, 29 November–2 December 2016; pp. 1–8. [Google Scholar]
  45. Jung, M.; Reinisch, C.; Kastner, W. Integrating Building Automation Systems and IPv6 in the Internet of Things. In Proceedings of the 2012 Sixth International Conference on Innovative Mobile and Internet Services in Ubiquitous Computing, Palermo, Italy, 4–6 July 2012; pp. 683–688. [Google Scholar]
  46. Armbrust, M.; Fox, A.; Griffith, R.; Joseph, A.D.; Katz, R.; Konwinski, A.; Lee, G.; Patterson, D.; Rabkin, A.; Stoica, I.; et al. A View of Cloud Computing. Commun. ACM 2010, 53, 50–58. [Google Scholar] [CrossRef]
  47. Stojmenovic, I.; Wen, S. The Fog computing paradigm: Scenarios and security issues. In Proceedings of the 2014 Federated Conference on Computer Science and Information Systems, Warsaw, Poland, 7–10 September 2014; pp. 1–8. [Google Scholar]
  48. Agarwal, Y.; Balaji, B.; Gupta, R.; Lyles, J.; Wei, M.; Weng, T. Occupancy-driven Energy Management for Smart Building Automation. In Proceedings of the 2nd ACM Workshop on Embedded Sensing Systems for Energy-Efficiency in Building, Zurich, Switzerland, 2 November 2010; pp. 1–6. [Google Scholar]
  49. So, A.T.; Chan, W.L. Intelligent Building Systems; Springer Science & Business Media: New York, NY, USA, 1999. [Google Scholar]
  50. Evaluation of Measurement Data—Guide to the Expression of Uncertainty in Measurement; Working Group 1 of the Joint Committee for Guides in Metrology (JCGM/WG 1): Paris, France, 2008; p. 134.
  51. Stamp, S.; Altamirano-Medina, H.; Lowe, R. Measuring and accounting for solar gains in steady state whole building heat loss measurements. Energy Build. 2017, 153, 168–178. [Google Scholar] [CrossRef]
  52. Yoon, S.; Yu, Y. Hidden factors and handling strategies on virtual in-situ sensor calibration in building energy systems: Prior information and cancellation effect. Appl. Energy 2018, 212, 1069–1082. [Google Scholar] [CrossRef]
  53. Roper, K.O.; Payant, R.P. The Facility Management Handbook, 4th ed.; American Management Association: New York, NY, USA, 2014. [Google Scholar]
  54. Basarkar, M.; Pang, X.; Wang, L.; Haves, P.; Hong, T. Modeling and simulation of HVAC faults in Energyplus. Presented at the Building Simulation 2011|IBPSA: 12th Conference of International Building Performance Simulation Association, Sydney, Australia, 14–16 November 2011; pp. 2897–2903. [Google Scholar]
  55. Zhang, R.; Hong, T. Modeling of HVAC operational faults in building performance simulation. Appl. Energy 2017, 202, 178–188. [Google Scholar] [CrossRef] [Green Version]
  56. Verhelst, J.; Ham, G.V.; Saelens, D.; Helsen, L. Economic impact of persistent sensor and actuator faults in concrete core activated office buildings. Energy Build. 2017, 142, 111–127. [Google Scholar] [CrossRef]
  57. Roth, K.; Westphalen, D.; Llana, P.; Feng, M. The Energy Impact of Faults in U.S. Commercial Buildings. In Proceedings of the International Refrigeration and Air Conditioning Conference, Lafayette, IN, USA, 12–15 July 2014. [Google Scholar]
  58. Kao, J.Y.; Pierce, E.T. Sensor errors: Their effects on building energy consumption. ASHRAE J. 1983, 25, 12. [Google Scholar]
  59. Kim, W. Fault Detection and Diagnosis for Air Conditioners and Heat Pumps Based on Virtual Sensors. Ph.D. Thesis, Purdue University, Ann Arbor, MI, USA, 2013. [Google Scholar]
  60. Kim, W.; Katipamula, S. A review of fault detection and diagnostics methods for building systems. Sci. Technol. Built Environ. 2018, 24, 3–21. [Google Scholar] [CrossRef]
  61. Katipamula, S.; Brambley, M.R. Review Article: Methods for Fault Detection, Diagnostics, and Prognostics for Building Systems—A Review, Part I. HVAC&R Res. 2005, 11, 3–25. [Google Scholar] [CrossRef] [Green Version]
  62. Katipamula, S.; Brambley, M.R. Review Article: Methods for Fault Detection, Diagnostics, and Prognostics for Building Systems—A Review, Part II. HVAC&R Res. 2005, 11, 169–187. [Google Scholar] [CrossRef]
  63. Fletcher, M.; Gorse, C.; Stafford, A.; Sutton, R. Full Scale Dynamic Building Testing: Roadmap Document 1:1 Outline of test methods and equipment. In Proceedings of the International Energy Agency Annex 58: Reliable Building Energy Performance Characterisation Based on Full Scale Dynamic Measurements, Bilbao, Spain, 2–4 April 2012. [Google Scholar]
  64. Bauwens, G.; Roels, S. Co-heating test: A state-of-the-art. Energy Build. 2014, 82, 163–172. [Google Scholar] [CrossRef]
  65. First International Conference a Companion to: ‘Sustainable Ecological Engineering Design—Selected Proceedings; LSI Publishing: Leeds, UK, 2015.
  66. ISO. Thermal Insulation—Building Elements—In-Situ Measurement of Thermal Resistance and Thermal Transmittance—Part 1: Heat Flow Meter Method; ISO Standard 9869-1; AENOR: Genoa, Italy, 2014. [Google Scholar]
  67. What Is FP7?—FP7 in Brief—Research—EUROPA. Available online: https://ec.europa.eu/research/fp7/understanding/fp7inbrief/what-is_en.html (accessed on 29 May 2018).
  68. Affordable and Adaptable Public Buildings through Energy Efficient Retrofitting (A2PBEER). Available online: http://www.a2pbeer.eu/ (accessed on 16 May 2018).
  69. Affordable and Adaptable Public Buildings through Energy Efficient Retrofitting|Projects|FP7-NMP|European Commission. Available online: https://cordis.europa.eu/project/rcn/108894_es.html (accessed on 16 May 2018).
  70. Socolow, R.H. Saving Energy in the Home: Princeton’s Experiments at Twin Rivers; Ballinger Publishing Company: Cambridge, MA, USA, 1978. [Google Scholar]
  71. OSTI.GOV|OSTI, US Dept of Energy Office of Scientific and Technical Information. Available online: https://www.osti.gov/ (accessed on 16 May 2018).
  72. Jack, R.; Loveday, D.; Allinson, D.; Lomas, K. First evidence for the reliability of building co-heating tests. Build. Res. Inf. 2018, 46, 383–401. [Google Scholar] [CrossRef]
  73. Modera, M.P. Electric Co-Heating: A Method for Evaluating Seasonal Heating Efficiencies and Heat Loss Rates in Dwellings; Prepared for the US Department of Energy under Contract No. W-7405-ENG-48; Lawrence Berkeley Laboratory of University of California/Berkeley: Berkeley, CA, USA, 2018. [Google Scholar]
  74. Palmiter, L.S.; Hamilton, L.B.; Holtz, M.J. Low Cost Performance Evaluation of Passive Solar Buildings; Prepared for the U.S. Department of Energy under Contract No. EG-77-C-01-4042; Solar Energy Research Institute: Golden, CO, USA, 1979. [Google Scholar]
  75. Sonderegger, R.C.; Condon, P.E.; Modera, M.P. In-Situ Measurements of Residential Energy Performance Using Electric Co-Heating; California University, Lawrence Berkeley Lab.: Berkeley, CA, USA, 1980. [Google Scholar]
  76. Everett, R.; Horton, A.; Doggart, J.; Willoughby, J. Linford Low Energy Houses; Technical Report; Prepared for the U.S. Department of Energy under Contract No. E/SA/CON/1025/174/020; Energy Technology Support Unit (ETSU): Milton Keynes, UK, 1985. [Google Scholar]
  77. Chapman, J.; Lowe, R.; Everett, R. The Pennyland Project; Prepared for the U.S. Department of Energy under Contract No. E5A/CON/1046/174/040; Energy Technology Support Unit (ETSU): Milton Keynes, UK, 1985. [Google Scholar]
  78. Madsen, H.; Holst, J. Estimation of continuous-time models for the heat dynamics of a building. Energy Build. 1995, 22, 67–79. [Google Scholar] [CrossRef]
  79. Bell, M.; Lowe, R. Energy efficient modernisation of housing: A UK case study. Energy Build. 2000, 32, 267–280. [Google Scholar] [CrossRef]
  80. Richalet, V.; Neirac, F.P.; Tellez, F.; Marco, J.; Bloem, J.J. HELP (house energy labeling procedure): Methodology and present results. Energy Build. 2001, 33, 229–233. [Google Scholar] [CrossRef]
  81. Meulenaer, V.D.; der Veken, J.V.; Verbeeck, G.; Hens, H. Comparison of measurements and simulations of passive house. In Proceedings of the 9th International IBPSA Building Simulation Conference, Montréal, QC, Canada, 15–18 August 2005; pp. 769–775. [Google Scholar]
  82. Lowe, R.J.; Wingfield, J.; Bell, M.; Bell, J.M. Evidence for heat losses via party wall cavities in masonry construction. Build. Serv. Eng. Res. Technol. 2007, 28, 161–181. [Google Scholar] [CrossRef] [Green Version]
  83. Guerra-Santin, O.; Tweed, C.; Jenkins, H.; Jiang, S. Monitoring the performance of low energy dwellings: Two UK case studies. Energy Build. 2013, 64, 32–40. [Google Scholar] [CrossRef]
  84. Lethé, G. A New Experiment and Modelling Work to Jointly Identify the Building Envelope’s Thermal Parameters and a Physical Solar Aperture. In Sustainable Ecological Engineering Design; Springer: Cham, Switzerland, 2015; pp. 163–180. [Google Scholar]
  85. Rodriguez-Gracia, D.; Piedra-Fernández, J.A.; Iribarne, L. Adaptive Domotic System in Green Buildings. In Proceedings of the 2015 IIAI 4th International Congress on Advanced Applied Informatics, Okayama, Japan, 12–16 July 2015; pp. 593–598. [Google Scholar]
  86. Jack, R.; Loveday, D.; Allinson, D.; Lomas, K. Quantifying the Effect of Window Opening on the Measured Heat Loss of a Test House. In Sustainable Ecological Engineering Design; Springer: Cham, Switzerland, 2015; pp. 183–196. [Google Scholar]
  87. Carutasiu, M.-B.; Tanasiev, V.; Ionescu, C.; Danu, A.; Necula, H.; Badea, A. Reducing energy consumption in low energy buildings through implementation of a policy system used in automated heating systems. Energy Build. 2015, 94, 227–239. [Google Scholar] [CrossRef]
  88. Latif, E.; Lawrence, M.; Shea, A.; Walker, P. In situ assessment of the fabric and energy performance of five conventional and non-conventional wall systems using comparative coheating tests. Build. Environ. 2016, 109, 68–81. [Google Scholar] [CrossRef] [Green Version]
  89. Farmer, D.; Johnston, D.; Miles-Shenton, D. Obtaining the heat loss coefficient of a dwelling using its heating system (integrated coheating). Energy Build. 2016, 117, 1–10. [Google Scholar] [CrossRef] [Green Version]
  90. Marshall, A.; Fitton, R.; Swan, W.; Farmer, D.; Johnston, D.; Benjaber, M.; Ji, Y. Domestic building fabric performance-Closing the gap between the in situ measured and modelled performance. Energy Build. 2017, 150, 307–317. [Google Scholar] [CrossRef]
  91. Farmer, D.; Gorse, C.; Swan, W.; Fitton, R.; Brooke-Peat, M.; Miles-Shenton, D.; Johnston, D. Measuring thermal performance in steady-state conditions at each stage of a full fabric retrofit to a solid wall dwelling. Energy Build. 2017, 156, 404–414. [Google Scholar] [CrossRef]
  92. Roels, S.; Bacher, P.; Bauwens, G.; Castaño, S.; Jiménez, M.J.; Madsen, H. On site characterisation of the overall heat loss coefficient: Comparison of different assessment methods by a blind validation exercise on a round robin test box. Energy Build. 2017, 153, 179–189. [Google Scholar] [CrossRef]
  93. Alzetto, F.; Farmer, D.; Fitton, R.; Hughes, T.; Swan, W. Comparison of whole house heat loss test methods under controlled conditions in six distinct retrofit scenarios. Energy Build. 2018, 168, 35–41. [Google Scholar] [CrossRef]
Figure 1. Abbreviated outline of Section 2: Materials and Methods.
Sensors 18 02360 g001
Figure 2. Classification scheme for AFDD methods based on previous research [60,61].
Sensors 18 02360 g002
Table 1. Differences between the wired and wireless communication protocols [30].
WiredWireless
High bandwidthLow-medium bandwidth
High performanceHigher latency
RobustInterference
ReliableUnreliable by nature
Installation expensiveInstallation cheap
“Unlimited” resourcesLow power, memory
Static networkMobile network
Less security problemsMore security problems
Table 2. The main sensors and meters used for control in building automation based on previous research [17,29].
TypologySensor MeasureInternational System Unit
Total ConsumptionElectricity of whole BuildingsWh, kWh, MWh
Energy Consumption of Heating, Cooling, light, etc.Wh, kWh, MWh
Water ConsumptionL, m3
Fuel ConsumptionWh, kWh, MWh, L, Nm3, m3
WeatherTemperature°C
Relative humidity%
Global Solar Radiation W/m2
Wind Velocitykm/h
Wind Direction(0°–360°)
Indoor ConditionsTemperature°C
Relative Humidity%
CO2 Concentrationppm
Illuminance Level (Lux)lux
Building SystemsFluid Temperature of Circuit: AHU/HVAC and Hot Water°C
AHU/HVAC Relative Humidity%
FlowsL/h, m3/s
PressureskPa, Pa
Presence Sensor’s Control0–100%, 0–1, ON/OFF, 0/1
CO2 Sensor’s Control0–100%, 0–1, ON/OFF, 0/1
Frequency to Collect DataHigh, Medium and Low Frequencys, min, h, day, day, month, year
Table 3. Examples of impacts produced by sensor errors in some study cases.
ReferenceError and Fault AnalyzedImpact
R. Zhang, T. Hong [55]Outdoor air temperature sensor errors and thermostat errors on energy consumption.Increase of cooling energy consumption by 0.8–13.6%, cooling and heating energy consumption increases 19.07–34.24%.
J. Verhelst, G. V. Ham [56]HVAC performance under the fault sensors and actuators in a concrete core activated office building.Economic impact from +7% to +1000% due to simultaneous sensor and actuator faults (realistic, randomly distributed and non-correlative).
K. Roth, D. Westphalen [57]Identify thirteen key faults based on literature review, developing bottom-up energy impact range.Increase of 4–18% of the energy annual consumption of the sum of commercial building HVAC, lighting, and refrigeration energy consumption, and is consistent with the typical range of energy waste reported in building commissioning studies.
J.Y. Kao, E.T. Pierce [58]Simulation of error effects in the sensors of automatic controls for HVAC systems, in an office building of lightweight construction.In annual building-energy requirements, increase of 30–50% attributable to an air handling system.
W. Kim [59]Fault detection and diagnosis for air conditioners and heat pumps based on virtual sensors.Reduction of approximately 20% of the cooling capacity and 15% of the energy efficiency if the refrigerant undercharging is in the range of 25%.
Table 4. Physical variables measured in the Corrected Average Method.
TypologySensor MeasureInternational System Unit
Energy ConsumptionTotal electricity consumed whiting the buildings envelopeWh, kWh, MWh
Total energy supplied by the HeatingWh, kWh, MWh
WeatherOutdoor temperature°C
Horizontal global solar radiationW/m2
Indoor ConditionsIndoor temperature°C
Table 5. Physical variables measured in the Co-Heating test.
TypologySensor MeasureInternational System Unit
Energy ConsumptionTotal electricity within the building’s envelopeWh, kWh, MWh
Total energy consumption by the heaters and fansWh, kWh, MWh
WeatherOutdoor temperature°C
Vertical global south solar radiationW/m2
Indoor ConditionsIndoor temperature°C
Table 6. Monitoring system of a public building of the University of the Basque Country.
TypologyMeasurementDevice IdentificationAccuracy
Energy consumptionHeating system7 Calorimeter: Kamstrup Multical 602 for heating; F0 1 calorimeter; F1, F2 and F3 2 calorimeters per floor, for the set sensorsET ± (0.4 + 4/ΔT)%
Lighting system4 Electricity Power Meter: 1 ABB EM/S 3.16.1 meter, 3 ABB A43 meters (1 per floor)±2% for all
Indoor ConditionsIlluminance (lux)13 Illuminance sensors: Siemens 5WG1 255-4AB12-
Air Quality (ppm CO2)13 Air quality, Temperature and Humidity Sensors: ARCUS SK04-S8-CO2-TF±1% Measurement Error
Temperature (°C)±0.5 °C
Relative Humidity (%)±3% RH
WeatherIlluminance (lux)1 Weather Station on roof: ELSNER 3595 Sun tracer KNX basic±35% at 0…150,000 lux
Temperature (°C)±0.5 °C
Wind Speed (m/s)±25% at 0…15 m/s
Rain (yes/no)-
Temperature (°C)1 Outdoors Temperature and Humidity Sensor on roof:
ARCUS SK01-TFK-AFF
±0.5 °C
Relative Humidity (%)±3% RH
Global Horizontal Solar Radiation (W/m2)1 Pyranometer on roof: ARCUS SK08-GLBS±5%
Table 7. Controlling system of a public building of the University of the Basque Country.
TypologyTechnologyDevice SpecificationsDescriptions
CommunicationsKNX ProtocolBus KNXThe installation is based on device communication via a communication bus KNX that will allow communication between all the devices present in the installation.
CableTwisted pair (TP1) of the type Y (St) Y 2 × 2 × 0.8 mm2Red (+) and black (–) for the bus line. The two remaining wires are yellow and white, which will be used for additional applications, additional power supply of certain components, or as an additional bus line or reserve for breakdowns.
HardwareKNX/IP InterfaceWeinzierl 730Four lines of the Measuring System and of the lines set out are done through IP connections. Each line has a KNX/IP Interface located on the KNX board of each floor.
Web ServerFor the control and monitoring of the installation, the Cambridge Studio Evolution Server (CBSE) of IPAS is usedThis device must be connected to a LAN network of each building and provided with Internet access. It communicates with the KNX network using KNX/IP gateways.
Switch and routerUsed by universityThe university has several routers and switches that were used.
SoftwareSpecific KNX software toolUnique Standard Application for Programming KNX Systems Software.The programming occurs in two different phases. The first phase is the creation of the topological structure of the installation, parameterization of the devices, and assigning of the physical addresses and groups. The second phase consists of the physical programming of the installation directly into the building.
Table 8. List of publications used in the MCS to characterize the TEP of in-situ buildings through HLC estimation and other estimates used to determinate energy behavior of the buildings.
ReferencePublication YearTEP CHARACTERIZATION THROUGH
HLC EstimationEstimation of Building Envelope Energy Behavior Through
Co-Heating MethodRegression MethodAverage MethodCorrected Average MethodEnergy Consumption Energy Balance EstimationInfiltration EstimationU-Value EstimationR-Value EstimationOthers Estimation and Methods 1
[70]1978X X X
[73]1979X
[74]1979X X
[75]1980X X
[76]1985 X XX X
[77]1985 X X X
[78]1995 X
[79]2000X X
[80]2001 X
[81]2005X
[82]2007X
[83]2013X XX
[84]2015X
[85]2015 X
[86]2015X X
[87]2015 XX X
[88]2016X XX
[17]2016 X X
[89]2016X X
[90]2017X
[91]2017X XX
[92]2017 XX X
[93]2018X
[72]2018X
1 Includes others estimations of building energy behavior as the estimations of the heat dynamics of buildings, thermal performance evaluations, and so forth, using other methods, are presented in Table 8. The methods used are statistical methods and other models of calculus (e.g., Grey Box Modelling, multiple linear regression, ARX and ARMAX models, etc.).
Table 9. MCSs in the reviewed literature from 1979–2018, specified by the authors to characterize the TEP of buildings.
ReferencePublication YearType of PublicationFDDSensorsActuatorsControl SystemOther Devices
Specify the Application of FDD Method to MCSIndoor Air TemperatureSurface Temperature (Out and Indoor)Indoor CO2Interior Relative HumidityHeat FluxesInfiltrationInfrared ThermographyIlluminance Level (Lux)Total Electricity MeterGas MeterHeat MeterHVAC Air FlowLight Electricity MeterOutdoor Air TemperatureExterior Relative HumidityGlobal Vertical Solar
Radiation Intensity
Global Horizontal Solar
Radiation Intensity
Diffuse Solar Radiation
Intensity
Outdoor Illuminance Level (Lux)Wind Speed AnemometerWind DirectionAtmospheric PressurePrecipitationThermostatOther Building Devices to ControlProtocol CommunicationGetaway or TransmittersData LoggerData ProcessorSCADAComputerBuilding Heating SystemsHVACFansDedicated Electric Radiator
[70]1978ReportNoX XX XXX XXXXXX XX XXXX XX X
[73]1979PaperNoX X X X X X
[74]1979ReportNoX X X XX X X X
[75]1980ReportNoX X X X XX X X
[76]1985ReportNoXXX XX XXX XXXX XX XX XX X
[77]1985ReportNoX XXX X XX XX X X
[78]1995PaperNoX X X X X X
[79]2000PaperNoX X XX
[80]2001PaperNoX X X X X X X
[81]2005PaperNoX X X XX X X X
[82]2007PaperNoX X X XXX X XXX X XX
[83]2013PaperNoX XXX X X XX
[84]2015Conference PaperNoX X X X X XX X XX
[85]2015Conference PaperNoX XXXXX XX X X XXX
[86]2015Conference PaperNoX X X XXX XX
[87]2015PaperNoX XX XX X X XXX XX X
[88]2016PaperNoXX XXX X X XXX X
[17]2016PaperNoX XX X X XXX X XX
[89]2016PaperNoX X X X XXX XX XX X X X
[90]2017PaperNoX XX X X X X XX XXX
[91]2017PaperNoX XXX X X X X X XXX
[92]2017PaperNoXX X X X XXXXX XX
[93]2018PaperNoX X XX X X XXX
[72]2018PaperNoX XX X XXX X XX
Table 10. Description of the level quantification used to analyze the MCSs presented in the reviewed literature.
LevelsDetail Degree of Technical SpecificationsQuantitative Value
Level AHigh degree specification1
Level BPartial specification0.5
Level CThere is not specification0
Table 11. Criteria to evaluate the specification level.
ANALIZED CRITERIALS
Devices of Monitoring SystemDevices of Controlling System and Data Acquisition System
Specify the Model or TypeSpecify the Model or Type of control devices
Specify the Data SheetSpecify the Data Sheet
Details the AccuracySpecify the Protocol Communications
Specify the criterion used for determinate the Type of Monitoring SystemSpecify the operating characteristics of Hardware and Software
Specify the Hardware and Software type
Specify the criterion used for determinate the type of Controlling System used
Table 12. Qualitative analysis of the specification level’s degree of the analyzed criteria for the devices, hardware, and software of MCSs used in buildings or prototypes in each publication studied.
ReferencePublication YearType of PublicationMonitoring System’s DevicesControlling System’s Devices
Specify the Model or TypeSpecify the Data SheetDetails the AccuracySpecify the Criterion used for Determinate the Type of Monitoring SystemSpecify the Model or Type of control DevicesSpecify the Data SheetSpecify the Protocol CommunicationsSpecify the Operating Characteristics of Hardware and SoftwareSpecify the Hardware and Software TypeSpecify the Criterion Used for Determinate the Type of Controlling System Used
[70]1978ReportLevel CLevel CLevel CLevel CLevel CLevel BLevel ALevel ALevel BLevel C
[73]1979PaperLevel CLevel CLevel CLevel CLevel CLevel CLevel CLevel CLevel CLevel C
[74]1979ReportLevel ALevel ALevel ALevel ALevel ALevel ALevel ALevel ALevel ALevel A
[75]1980ReportLevel CLevel CLevel CLevel CLevel CLevel CLevel CLevel ALevel CLevel C
[76]1985ReportLevel BLevel BLevel BLevel BLevel BLevel BLevel CLevel ALevel ALevel A
[77]1985ReportLevel BLevel BLevel BLevel BLevel CLevel CLevel CLevel ALevel ALevel A
[78]1995PaperLevel CLevel CLevel CLevel CLevel CLevel BLevel CLevel CLevel CLevel B
[79]2000PaperLevel CLevel CLevel CLevel CLevel CLevel CLevel CLevel CLevel BLevel C
[80]2001PaperLevel CLevel CLevel CLevel CLevel CLevel CLevel BLevel BLevel BLevel C
[81]2005PaperLevel BLevel CLevel CLevel CLevel ALevel ALevel CLevel CLevel CLevel B
[82]2007PaperLevel ALevel CLevel CLevel CLevel ALevel ALevel ALevel ALevel ALevel C
[83]2013PaperLevel CLevel CLevel CLevel CLevel CLevel CLevel CLevel CLevel CLevel C
[84]2015Conference PaperLevel CLevel CLevel CLevel CLevel CLevel CLevel ALevel BLevel BLevel B
[85]2015Conference PaperLevel CLevel CLevel CLevel CLevel CLevel CLevel CLevel CLevel BLevel B
[86]2015Conference PaperLevel CLevel CLevel CLevel CLevel CLevel CLevel CLevel CLevel CLevel C
[87]2015PaperLevel CLevel CLevel CLevel CLevel CLevel CLevel CLevel CLevel ALevel C
[88]2016PaperLevel BLevel CLevel BLevel CLevel CLevel CLevel CLevel CLevel CLevel C
[17]2016PaperLevel ALevel CLevel ALevel BLevel CLevel CLevel CLevel CLevel CLevel C
[89]2016PaperLevel ALevel CLevel ALevel CLevel CLevel BLevel CLevel BLevel BLevel C
[90]2017PaperLevel ALevel CLevel BLevel CLevel CLevel CLevel ALevel BLevel BLevel C
[91]2017PaperLevel ALevel CLevel ALevel BLevel CLevel BLevel CLevel BLevel BLevel C
[92]2017PaperLevel ALevel CLevel CLevel CLevel CLevel CLevel CLevel CLevel CLevel C
[93]2018PaperLevel CLevel BLevel BLevel CLevel CLevel BLevel CLevel CLevel CLevel C
[72]2018PaperLevel ALevel CLevel BLevel CLevel CLevel BLevel CLevel CLevel CLevel C
Table 13. Quantitative analysis of specification level’s degree of the analyzed criteria of MCSs used in buildings or prototypes in the reviewed literature.
All Reviewed Literature
All MethodsMonitoring System’s DevicesControlling System’s Devices
24 referencesSpecify the Model or TypeSpecify the Data SheetDetails the AccuracySpecify the criterion used for determinate the Type of Monitoring SystemSpecify the Model or Type of control devicesSpecify the Data SheetSpecify the Protocol CommunicationsSpecify the operating characteristics of Hardware and SoftwareSpecify the Hardware and Software typeSpecify the criterion used for determinate the type of Controlling System used
Level A8141335653
33.3%4.2%16.7%4.2%12.5%12.5%20.8%25%20.8%12.5%
Level B4364171584
16.7%12.5%25%16.7%4.2%29.2%4.2%20.8%33.3%16.7%
Level C12201419201418131117
50%83.3%58.3%79.2%83.3%58.3%75.0%54.2%45.8%70.8%
Reviewed Literature with Co-Heating Method (HLC estimation)
Co-Heating MethodMonitoring System’s DevicesControlling System’s Devices
16 references
67%
Specify the Model or TypeSpecify the Data SheetDetails the AccuracySpecify the criterion used for determinate the Type of Monitoring SystemSpecify the Model or Type of control devicesSpecify the Data SheetSpecify the Protocol CommunicationsSpecify the operating characteristics of Hardware and SoftwareSpecify the Hardware and Software typeSpecify the criterion used for determinate the type of Controlling System used
Level A6131335421
37.5%6.3%18.8%6.3%18.8%18.8%31.3%25%12.5%6.3%
Level B2141050462
12.5%6.3%25%6.3%0%31.3%0%25%37.5%12.5%
Level C814914138118813
50%87.5%56.3%87.5%81.3%50%68.8%50%50%81.3%
Reviewed Literature with Regression Method (HLC estimation)
Regression MethodsMonitoring System’s DevicesControlling System’s Devices
4 references
17%
Specify the Model or TypeSpecify the Data SheetDetails the AccuracySpecify the criterion used for determinate the Type of Monitoring SystemSpecify the Model or Type of control devicesSpecify the Data SheetSpecify the Protocol CommunicationsSpecify the operating characteristics of Hardware and SoftwareSpecify the Hardware and Software typeSpecify the criterion used for determinate the type of Controlling System used
Level A2010100022
50%0%25%0%25%0%0%0%50%50%
Level B2223011000
50%50%50%75%0%25%25%0%0%0%
Level C0211033422
0%50%25%25%0%75%75%100%50%50%
Reviewed Literature with Average Method (HLC estimation)
Average MethodMonitoring System’s DevicesControlling System’s Devices
1 reference
4%
Specify the Model or TypeSpecify the Data SheetDetails the AccuracySpecify the criterion used for determinate the Type of Monitoring SystemSpecify the Model or Type of control devicesSpecify the Data SheetSpecify the Protocol CommunicationsSpecify the operating characteristics of Hardware and SoftwareSpecify the Hardware and Software typeSpecify the criterion used for determinate the type of Controlling System used
Level A1000000000
100%0%0%0%0%0%0%0%0%0%
Level B0000000000
0%0%0%0%0%0%0%0%0%0%
Level C0111111111
0%100%100%100%100%100%100%100%100%100%
Reviewed Literature with Corrected Average Method (HLC estimation)
Corrected Average MethodMonitoring System’s DevicesControlling System’s Devices
1 reference
4%
Specify the Model or TypeSpecify the Data SheetDetails the AccuracySpecify the criterion used for determinate the Type of Monitoring SystemSpecify the Model or Type of control devicesSpecify the Data SheetSpecify the Protocol CommunicationsSpecify the operating characteristics of Hardware and SoftwareSpecify the Hardware and Software typeSpecify the criterion used for determinate the type of Controlling System used
Level A1010000000
100%0%100%0%0%0%0%0%0%0%
Level B0001000000
0%0%0%100%0%0%0%0%0%0%
Level C0100111111
0%100%0%0%100%100%100%100%100%100%
Reviewed Literature implementing other methods
Other Methods Applied 1Monitoring System’s DevicesControlling System’s Devices
7 references
29%
Specify the Model or TypeSpecify the Data SheetDetails the AccuracySpecify the criterion used for determinate the Type of Monitoring SystemSpecify the Model or Type of control devicesSpecify the Data SheetSpecify the Protocol CommunicationsSpecify the operating characteristics of Hardware and SoftwareSpecify the Hardware and Software typeSpecify the criterion used for determinate the type of Controlling System used
Level A1000000232
14%0%0%0%0%0%0%29%43%29%
Level B2222121122
29%29%29%29%14%29%14%14%29%29%
Level C4555656423
57%71%71%71%86%71%86%57%29%43%
1 This quantitative analysis include experimental test that use other methods: (i) To estimate HLC using methods different to Co-Heating Method, Average Method and Corrected Average Method. (ii) To characterize the Thermal Envelope performance (TEP).
Table 14. Quantitative analysis of the references studied by methodology: Global analysis of the method used, the fault detection and sensor type used for measuring physical variables in the MCSs in each methodology.
Literatures Grouping by MethodsType of PublicationGlobal AnalysisFDDSensors
Specify the Application of Fault Detection MethodIndoor Air TemperatureSurface Temperature (Out and Indoor)Indoor CO2Interior Relative HumidityHeat FlowInfiltrationInfrared ThermographyIndoor Illumination Level (Lux)Total Electricity MeterGas MeterHeat MeterHVAC Air FlowLight Electricity MeterOutdoor Air TemperatureExterior Relative HumidityGlobal Vertical Solar
Radiation Intensity
Global Horizontal Solar
Radiation Intensity
Diffuse Solar Radiation
Intensity
Outdoor Illuminance Level (Lux)Wind Speed AnemometerWind DirectionAtmospheric PressurePrecipitation
All Literatures StudiedTotal references24024334812522046222081512818801
Percentage rate100%0%100%13%13%17%33%50%21%8%83%17%25%8%8%83%33%63%50%33%4%33%33%0%4%
Co-Heating MethodTotal references16016102695015221113486403401
Percentage rate67%0%100%6%0%13%38%56%31%0%94%13%13%6%6%81%25%50%38%25%0%19%25%0%6%
Regression MethodTotal references4042212101324013334214300
Percentage rate17%0%100%50%50%25%50%25%0%25%75%50%100%0%25%75%75%75%100%50%25%100%75%0%0%
Average MethodTotal references1011001000101001111101100
Percentage rate4%0%100%100%0%0%100%0%0%0%100%0%100%0%0%100%100%100%100%100%0%100%100%0%0%
Corrected Average MethodTotal references1010110001001011101011000
Percentage rate4%0%100%0%100%100%0%0%0%100%0%0%100%0%100%100%100%0%100%0%100%100%0%0%0%
Other Methods AppliedTotal references7072212301523106375404400
Percentage rate29%0%100%29%29%14%29%43%0%14%71%29%43%14%0%86%43%100%71%57%0%57%57%0%0%
Table 15. Quantitative analysis of references studied by methodology: Global analysis of the method, actuators, controls systems, and devices used in each methodology.
Literatures Grouping by MethodsType of PublicationGlobal AnalysisActuatorsControl SystemOther Devices
ThermostatOther Building Devices to ControlProtocol CommunicationGetaway or TransmittersData LoggerData ProcessorSCADAComputerBuilding Heating SystemsHVACFansDedicated Electric Radiator
All Literatures StudiedTotal references24106511380755810
Percentage rate100%42%25%21%4%54%33%0%29%21%21%33%42%
Co-Heating MethodTotal references16934195044389
Percentage rate67%56%19%25%6%56%31%0%25%25%19%50%56%
Regression MethodTotal references4110021020000
Percentage rate17%25%25%0%0%50%25%0%50%0%0%0%0%
Average MethodTotal references1000000000000
Percentage rate4%0%0%0%0%0%0%0%0%0%0%0%0%
Corrected Average MethodTotal references1000000000000
Percentage rate4%0%0%0%0%0%0%0%0%0%0%0%0%
Other Methods AppliedTotal references7131043031201
Percentage rate29%14%43%14%0%57%43%0%43%14%29%0%14%

