Polymer Based Whispering Gallery Mode Humidity Sensor
by
 and
and
Ann Britt Petermann
1, 
Thomas Hildebrandt
1,
Uwe Morgner
2,
Bernhard Wilhelm Roth
1 and
Merve Meinhardt-Wollweber
1,* 1
Hannover Centre for Optical Technologies (HOT), Leibniz Universität Hannover, Nienburger Strasse 17, D-30167 Hannover, Germany
2
Institute of Quantum Optics, Leibniz Universität Hannover, Welfengarten 1, D-30167 Hannover, Germany
*
Author to whom correspondence should be addressed.
Sensors 2018, 18(7), 2383; https://doi.org/10.3390/s18072383
Submission received: 11 June 2018
/
Revised: 11 July 2018
/
Accepted: 19 July 2018
/
Published: 22 July 2018
(This article belongs to the Special Issue State-of-the-Art Sensors Technology in Germany)
Abstract
:Whispering gallery mode (WGM) resonators are versatile high sensitivity sensors, but applications regularly suffer from elaborate and expensive manufacturing and read-out. We have realized a simple and inexpensive concept for an all-polymer WGM sensor. Here, we evaluate its performance for relative humidity measurements demonstrating a sensitivity of 47 pm/% RH. Our results show the sensor concepts’ promising potential for use in real-life applications and environments.
1. Introduction
Monitoring and measuring the relative humidity (RH) is an important factor in many chemical processes and industrial applications, for example in air quality management, food manufacturing or in metal processing and polymer synthesis [1]. There is a wide range of different possibilities for humidity detection based on electrical, as well as optical principles [2].
Optical techniques have the advantage of immunity against electrical and vibrational influences and offer interesting multiplexing capabilities, among others [3]. Optical humidity sensors are based on radiation losses in optical waveguides [4], fiber Bragg gratings (FBGs) [5,6] or whispering gallery modes (WGMs), for example [7]. When using a radiation loss-based sensor, it is difficult to separate the response of the sensor to humidity from changes in laser power and also varying losses in optical connectors. Silica-based FBGs need a humidity-sensitive polymer coating to be functional. This coating material swells in response to humidity and reduces the refractive index, leading to a change of the Bragg wavelength. Unfortunately, the swelling also causes bending stress in the fiber. No additional coating is necessary when polymer optical fiber Bragg gratings (POFBGs) are used, but the response time could be very slow (typical sensitivities are in the range of pm/% RH) [8].
WGM-based sensors enable very long photon life times or high quality factors, respectively. This makes them ideal sensors for many applications, especially for biological and chemical sensing [9]. Typical WGM resonator geometries are spheres, rings or toroids. WGM resonators confine light at specific wavelengths, called resonance wavelengths. The electromagnetic field is located close under the surface of the resonator, leading to a strong evanescent field outside. The resonance wavelength depends on, among others, the effective refractive index and the radius of the resonator R. Hence, changing one of these parameters will cause a resonance wavelength shift [10]:
is the change in the effective refractive index and the change in the size of the resonator. Humidity sensors based on WGM resonators were successfully tested in the last few years. For example, Mehrabani et al. used a polymer-coated silica microtoroid and reached a sensitivity of pm/% RH [1]. Bhola et al. instead used a sol-gel-clad microring resonator with a sensitivity of 16 pm/% RH [11]. The manufacturing process of these sensors is expensive and time consuming. Moreover, their handling requires precise adjustment of different components. Consequently, WGMs have not been used in routine humidity measurement yet, even though they have proven to be highly sensitive sensors for this application.
As a first step to overcome these issues, we developed an inexpensive, easy to handle, easy to manufacture and completely polymer-based sensor. The general setup of the WGM sensor concept was introduced earlier for the application of wavelength measurement [12]. Using polymer materials for the resonators makes an additional coating unnecessary [8]. In this article, we realize a polymer WGM-based humidity sensor achieving high sensitivity and characterize its performance.
2. Materials and Methods
2.1. Experimental Setup
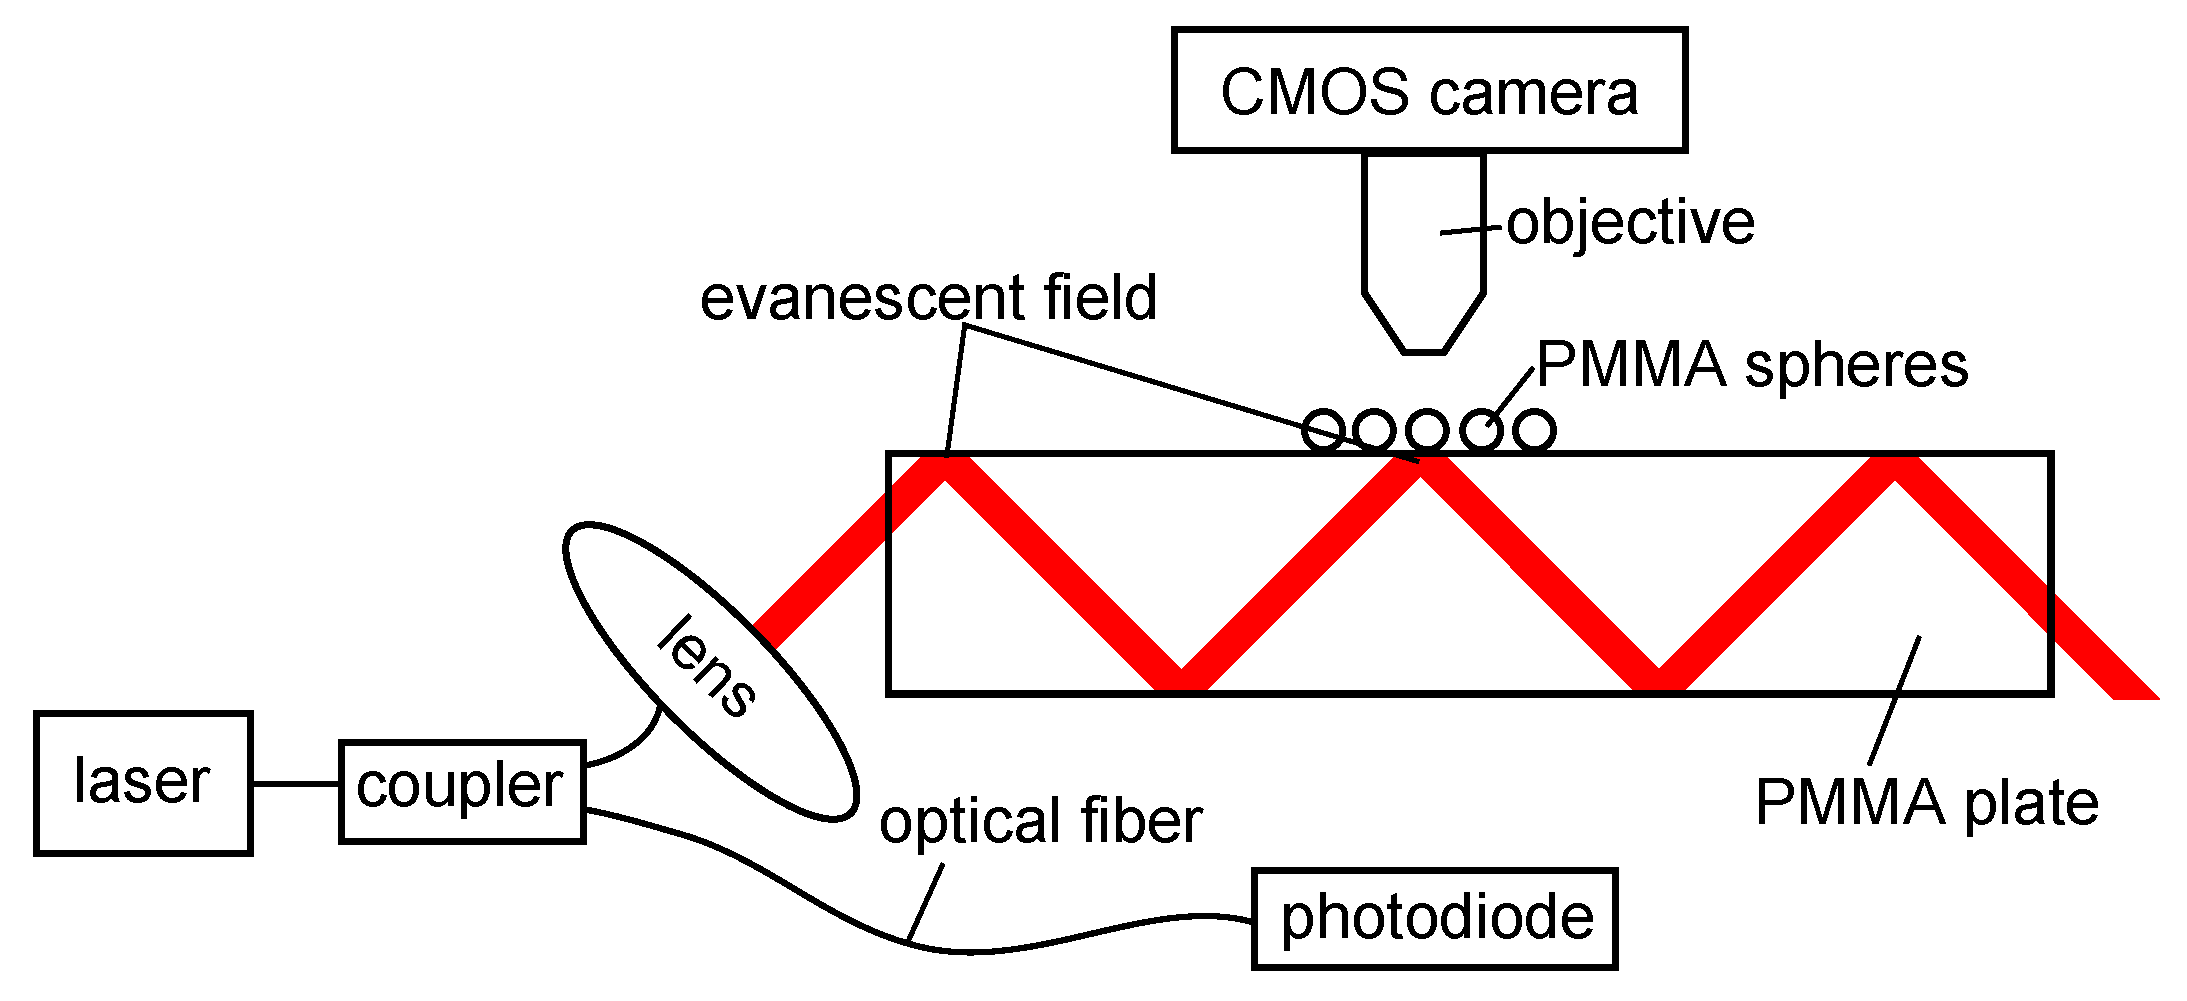
As outlined in the Introduction, the sensor concept was developed to rely on a simple scheme and to be easy to manufacture. The design is shown in Figure 1. A PMMA plate with dimensions 50 mm × 50 mm × 2 mm forms the core of the sensor. The beam of a tunable narrow-band laser (TLB-6700, Newport Spectra-Physics GmbH, Darmstadt, Germany) with a tuning speed of 5 nm/s, a linewidth of ≤ 200 kHz and a resolution of 0.01 nm was collimated and coupled under 45° into this plate.
The plate acts as an optical waveguide due to total internal reflection. Thus, an evanescent field is present at the surface of the plate. In this field, commercially available PMMA spheres (Bang Laboratories, Fishers, IN, USA) were placed with a random distribution and positions. Two different mean diameters, (all spheres smaller than 90 ) and 165 (diameters between 150 and 180 ), respectively, were used to investigate the influence of the resonator size. For a more flexible use and to ensure a more stable sensor configuration, the spheres could be fixed to the plate with a thin spin-coated layer of a UV curing adhesive (OG675, John P. Kummer GmbH, Augsburg, Germany) [13]. At a particular wavelength, only some of the spheres are in resonance, because the sphere diameters vary. Therefore, the total light distribution of all spheres changes with the incident wavelength. The generated intensity pattern of the spheres was captured by a CMOS camera (DCC1645C, Thorlabs, Newton, MA, USA) via a microscope objective (M-10X, Newport Spectra Physics GmbH, Darmstadt, Germany). Ten percent of the excitation light was detected with a photodiode (PDA36A-EC, Thorlabs, Newton, MA, USA) for intensity normalization.
In order to evaluate the sensor performance, the whole sensor was enclosed in an acrylic box, against environmental influences. To adjust the relative humidity, a Petri dish with a saturated salt solution was positioned inside the box together with the sensor [14]. By using lithium chloride (Carl Roth GmbH & Co. KG, Karlsruhe, Germany) at a temperature of , it is possible to modify the relative humidity inside the box between 25% and 40%, For the determination of the actual relative humidity, a commercially available relative humidity sensor (TSP01 and M00426120, Thorlabs, Newton, MA, USA) was placed in the box, as well. Our setup also contained a temperature sensor. The control of the temperature is crucial, because temperature changes also induce resonance wavelength shifts [12,15].
2.2. Characterization and Measurement Procedure
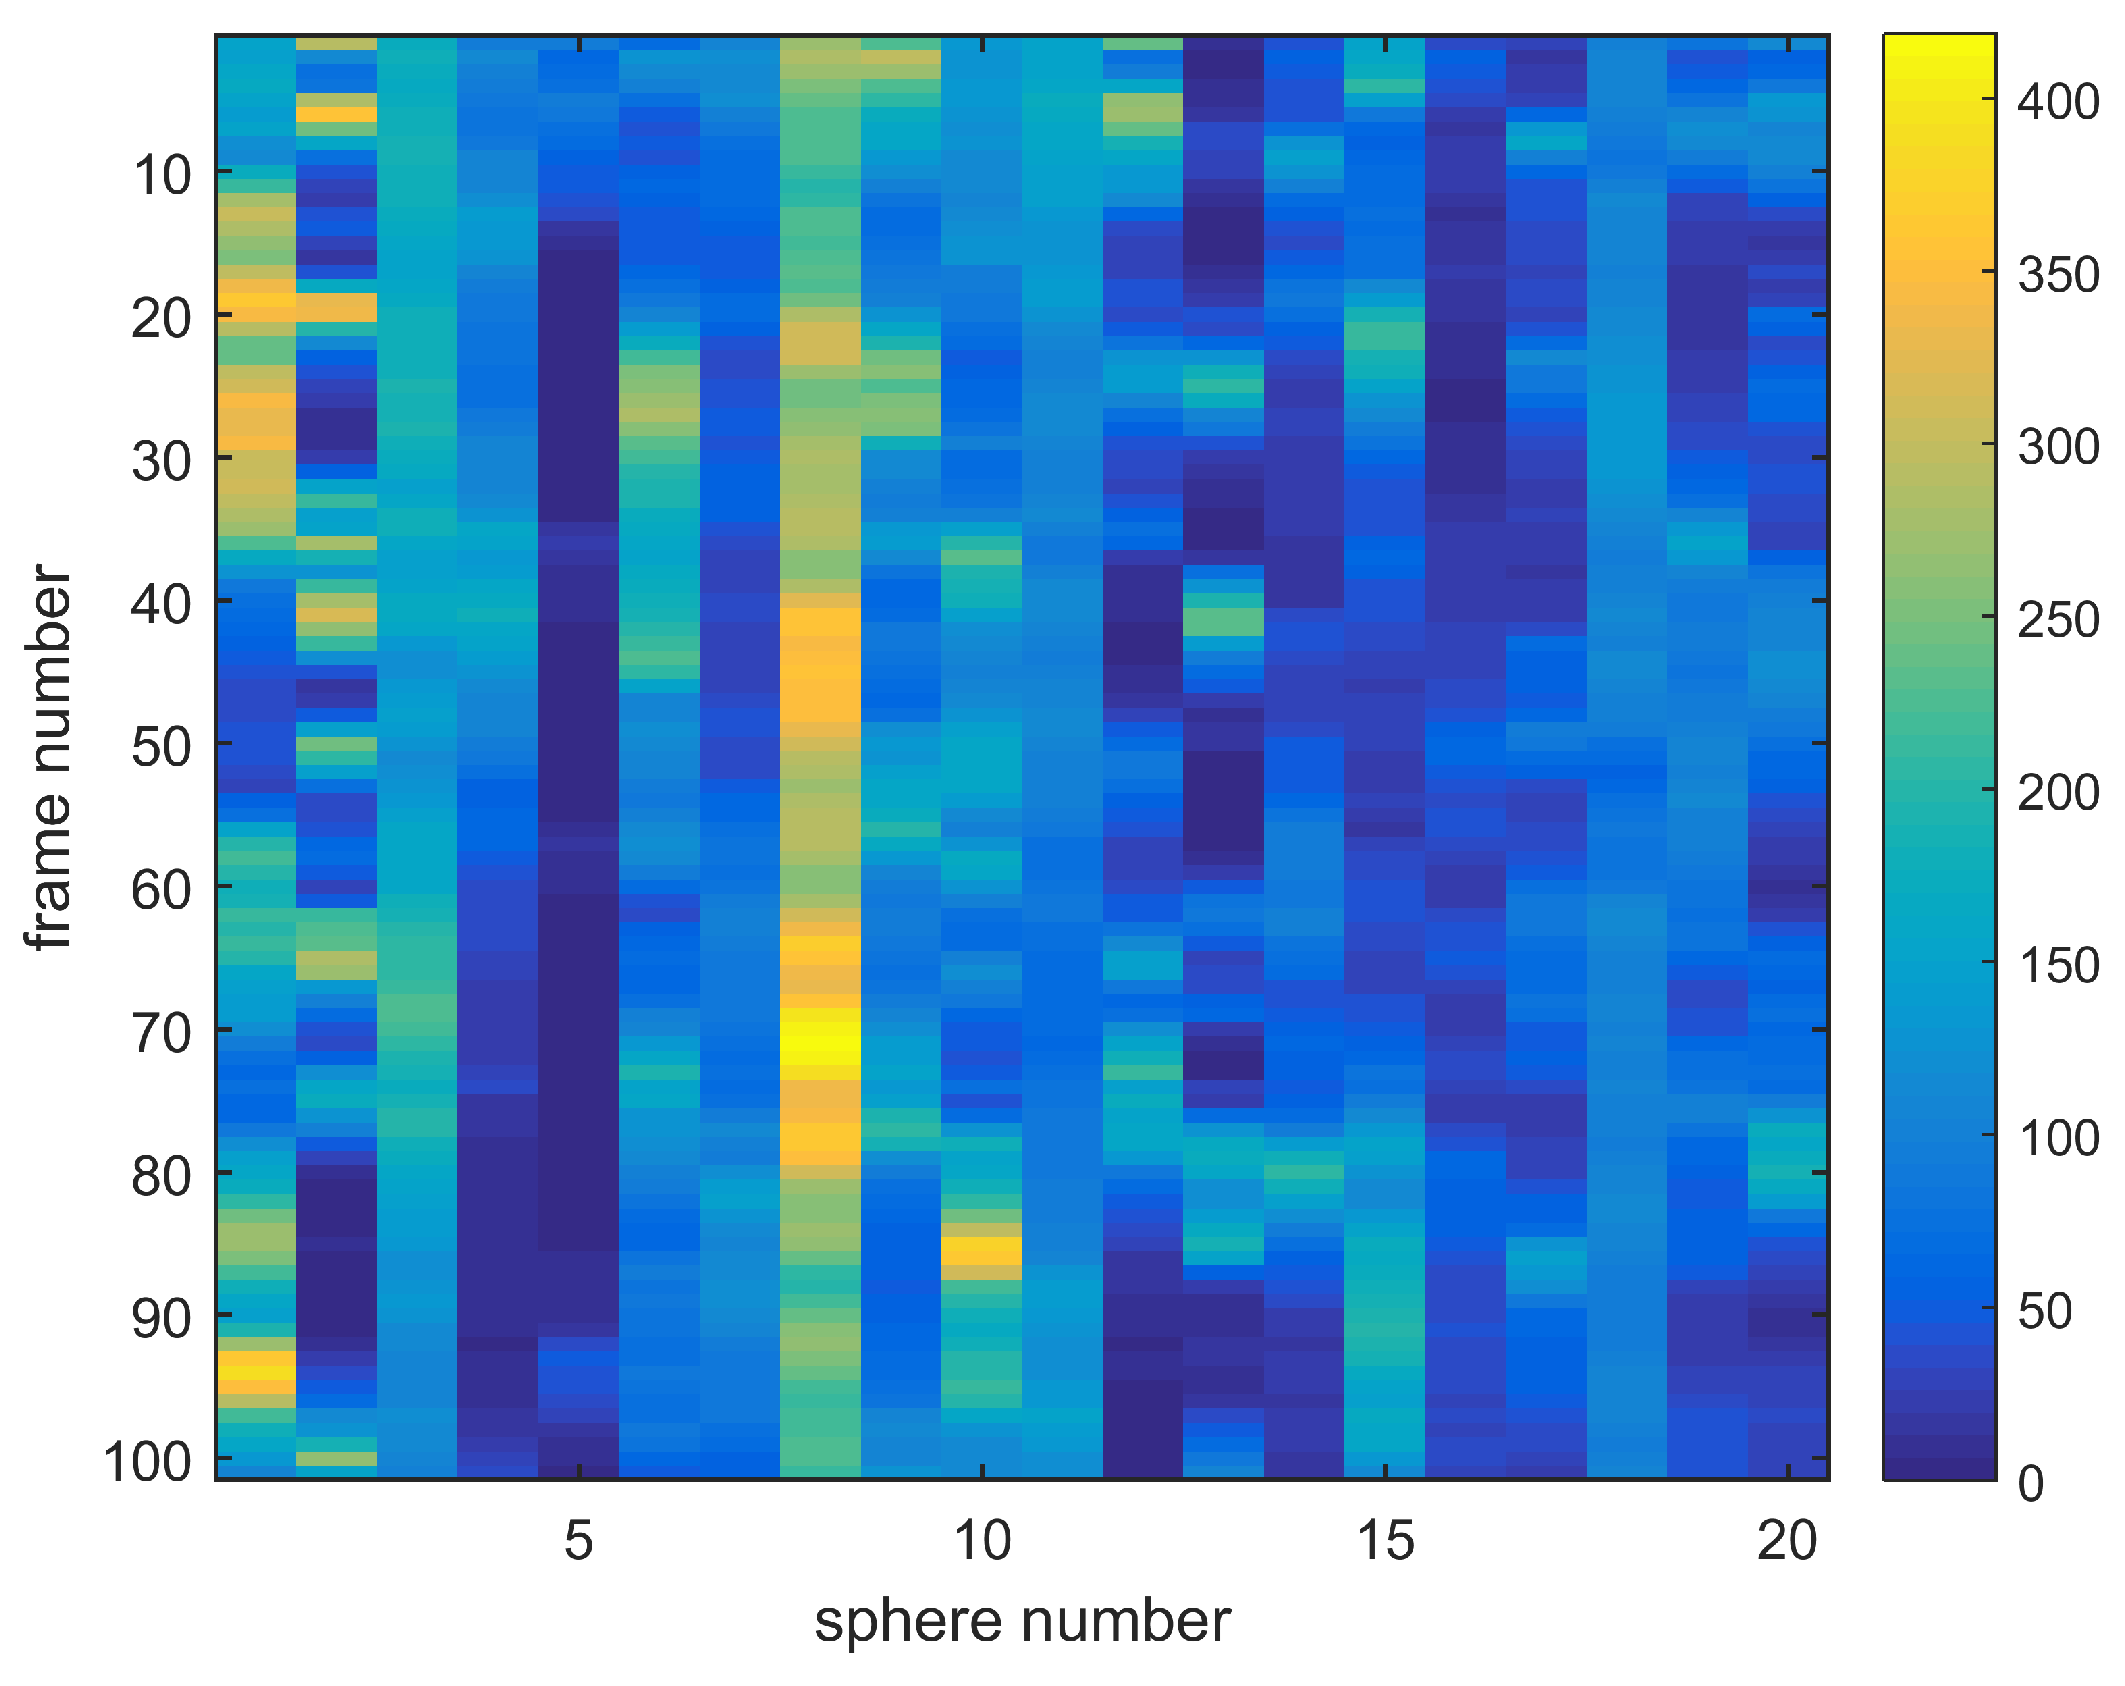
Before the sensor can be used for relative humidity measurements [12,16], it needed to be calibrated once. In the calibration procedure, the exciting wavelength was scanned from 635 to 636 in steps, and the intensity profile of the spheres at each wavelength was captured by the CMOS-camera (see Figure 2). Afterwards the positions and areas of the spheres that showed the strongest intensity changes were identified, and the associated pixel values were integrated over the sphere areas to obtain an integrated intensity for each sphere at each calibration wavelength. The laser power recorded with the photodiode is used to normalize the obtained intensity values. These intensity values for all spheres are stored together in a mode map. Figure 3 shows the mode map for an array of twenty spheres with a mean diameter of . Due to small differences in the spheres’ diameters, only some spheres are in resonance at a specific wavelength marked as yellow bars in the mode map.
In each sphere, a variety of different modes is excited, so specific modes cannot be distinguished by the intensity measurements recorded with the sensor sketched in Figure 1. The approach here is that the intensity pattern of many spheres is unique, and therefore, an unambiguous determination of the present resonance condition is possible. To determine an unknown relative humidity, the wavelength was scanned again at different environmental conditions, and the resultant intensity values of the spheres for each specific wavelength were compared to the mode map measured in the first step via the correlation function [12,16,17]:
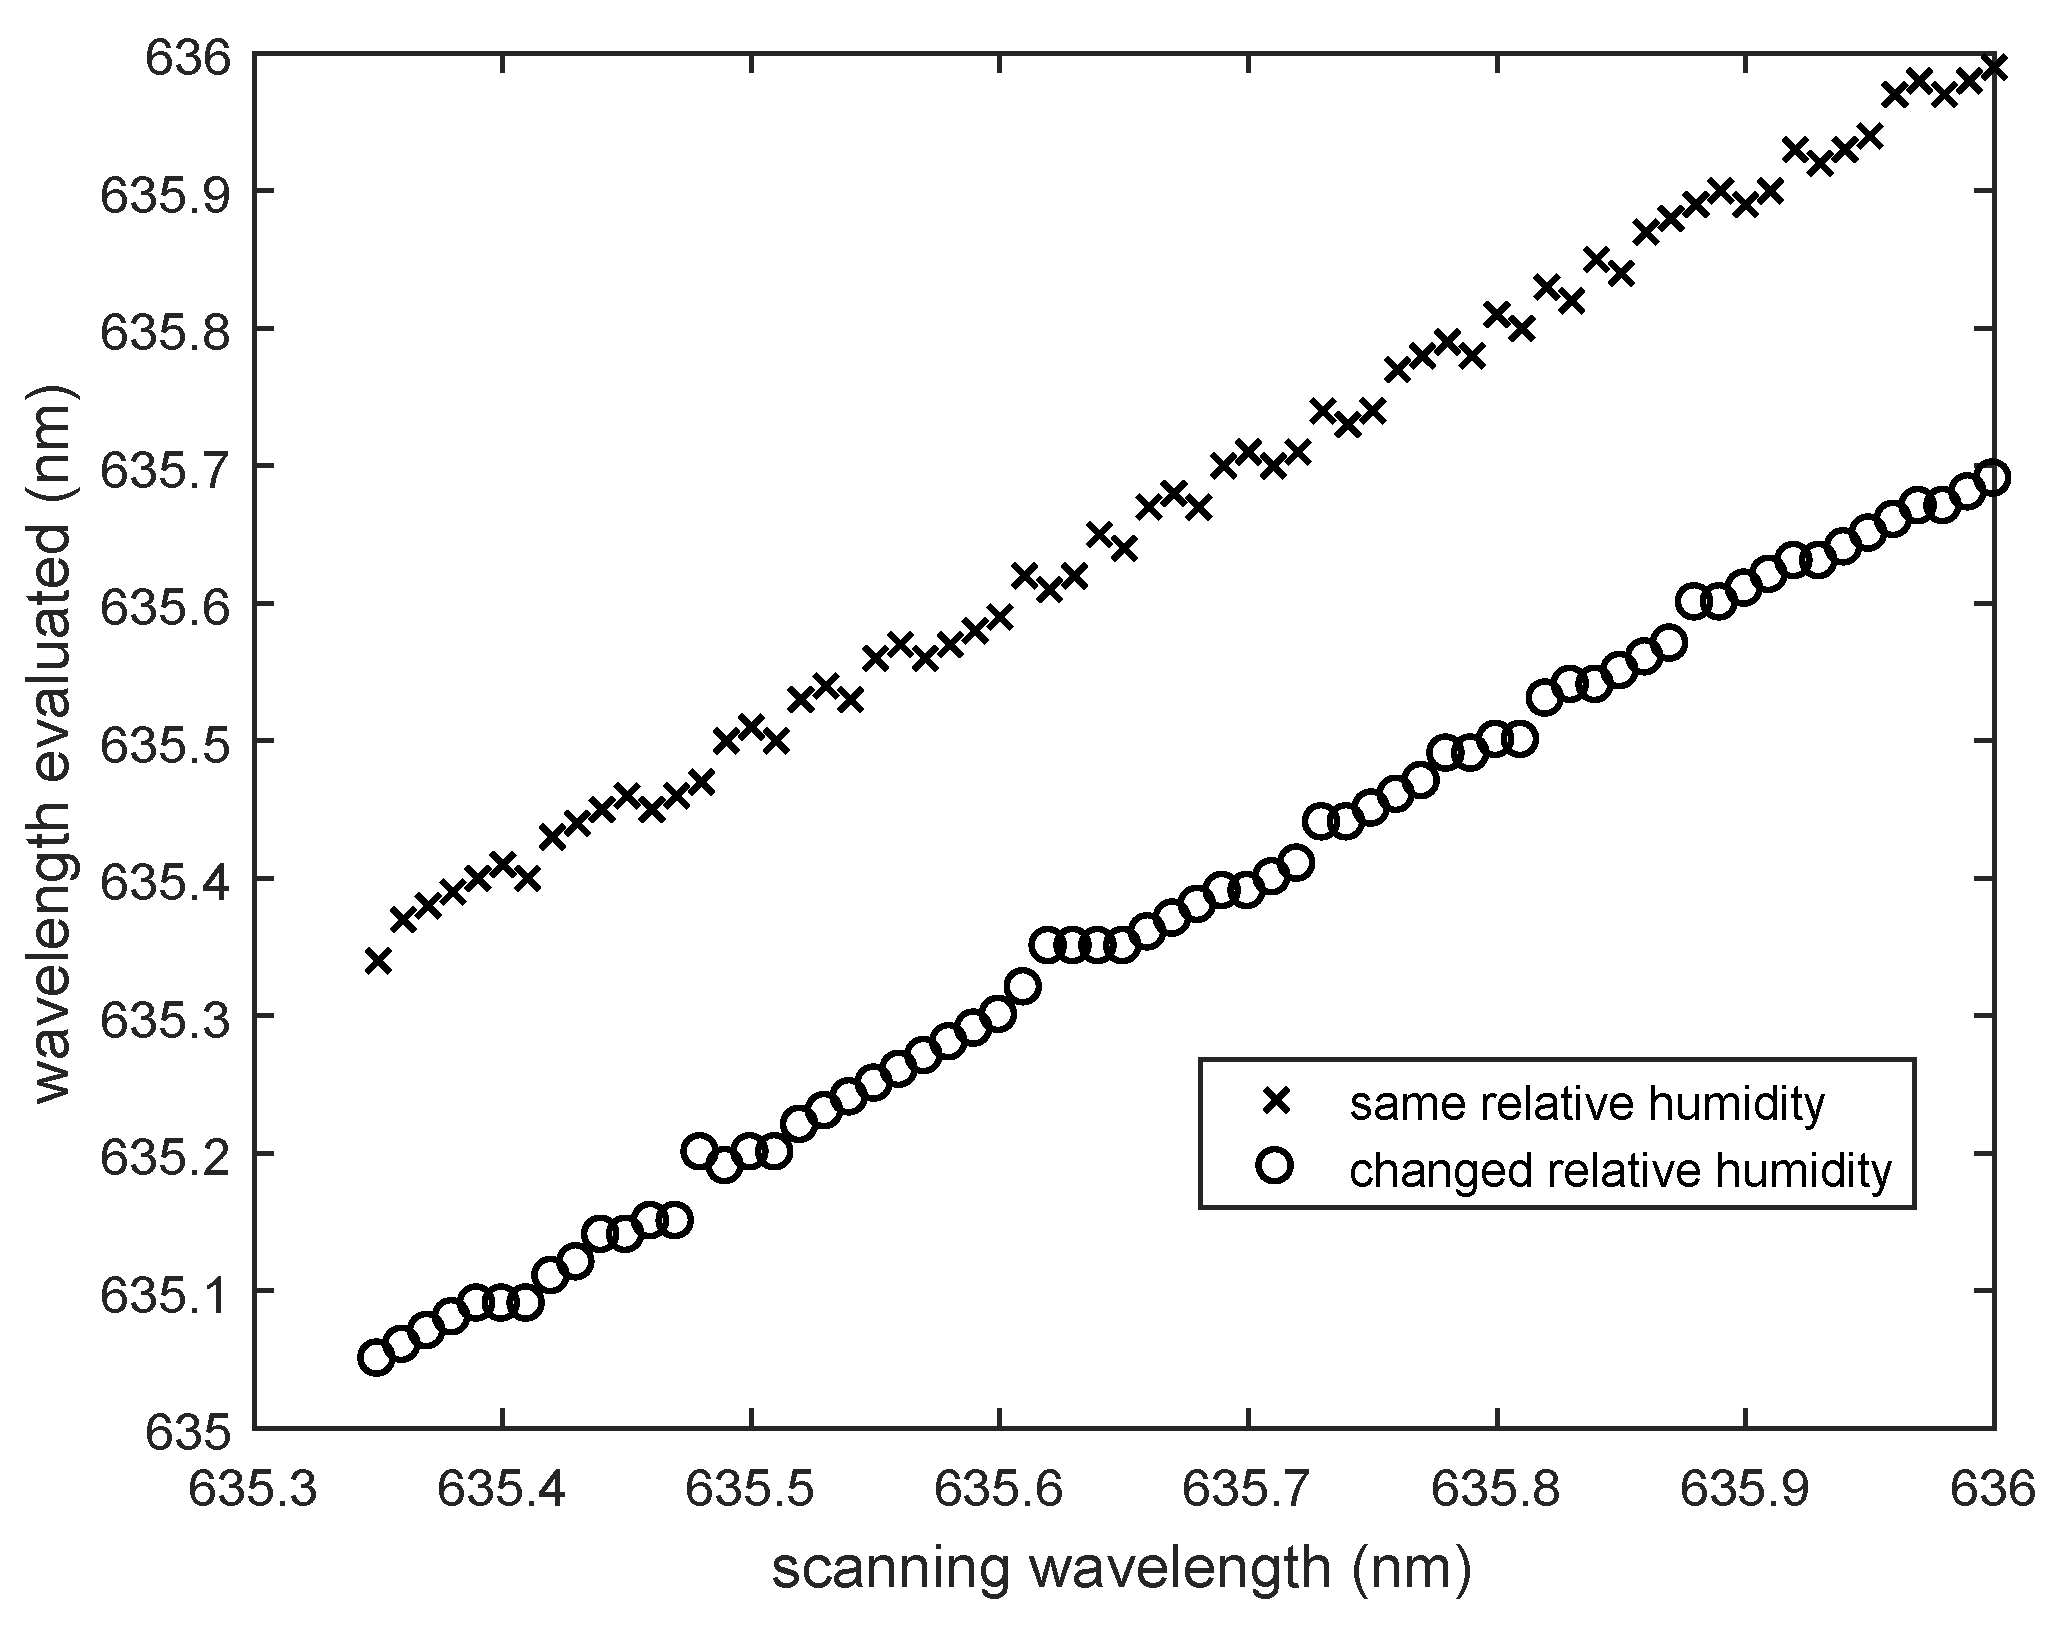
is the actual scanning wavelength; is the intensity of the j-th sphere in the calibration mode map; and the intensity of this sphere at the unknown relative humidity. The correlation function has a minimum at that wavelength where the intensity profile at the unknown relative humidity fits the mode map best. In case the relative humidity does not change, the evaluated wavelength will be the same as the scanning wavelength. For example: the intensity profile of a sphere array at an unknown relative humidity at a scanning wavelength of is compared to the calibration mode map. If the relative humidity has not changed, the correlation function has a minimum at . If this is not the case, the relative humidity has changed, and the wavelength difference is proportional to the relative humidity variation. Figure 4 illustrates this dependence, showing a plot of the scanning wavelength versus the determined wavelength as obtained via the correlation function. For the curve with circles, the RH has changed, whereas for the curve with crosses, the RH remained constant.
3. Results
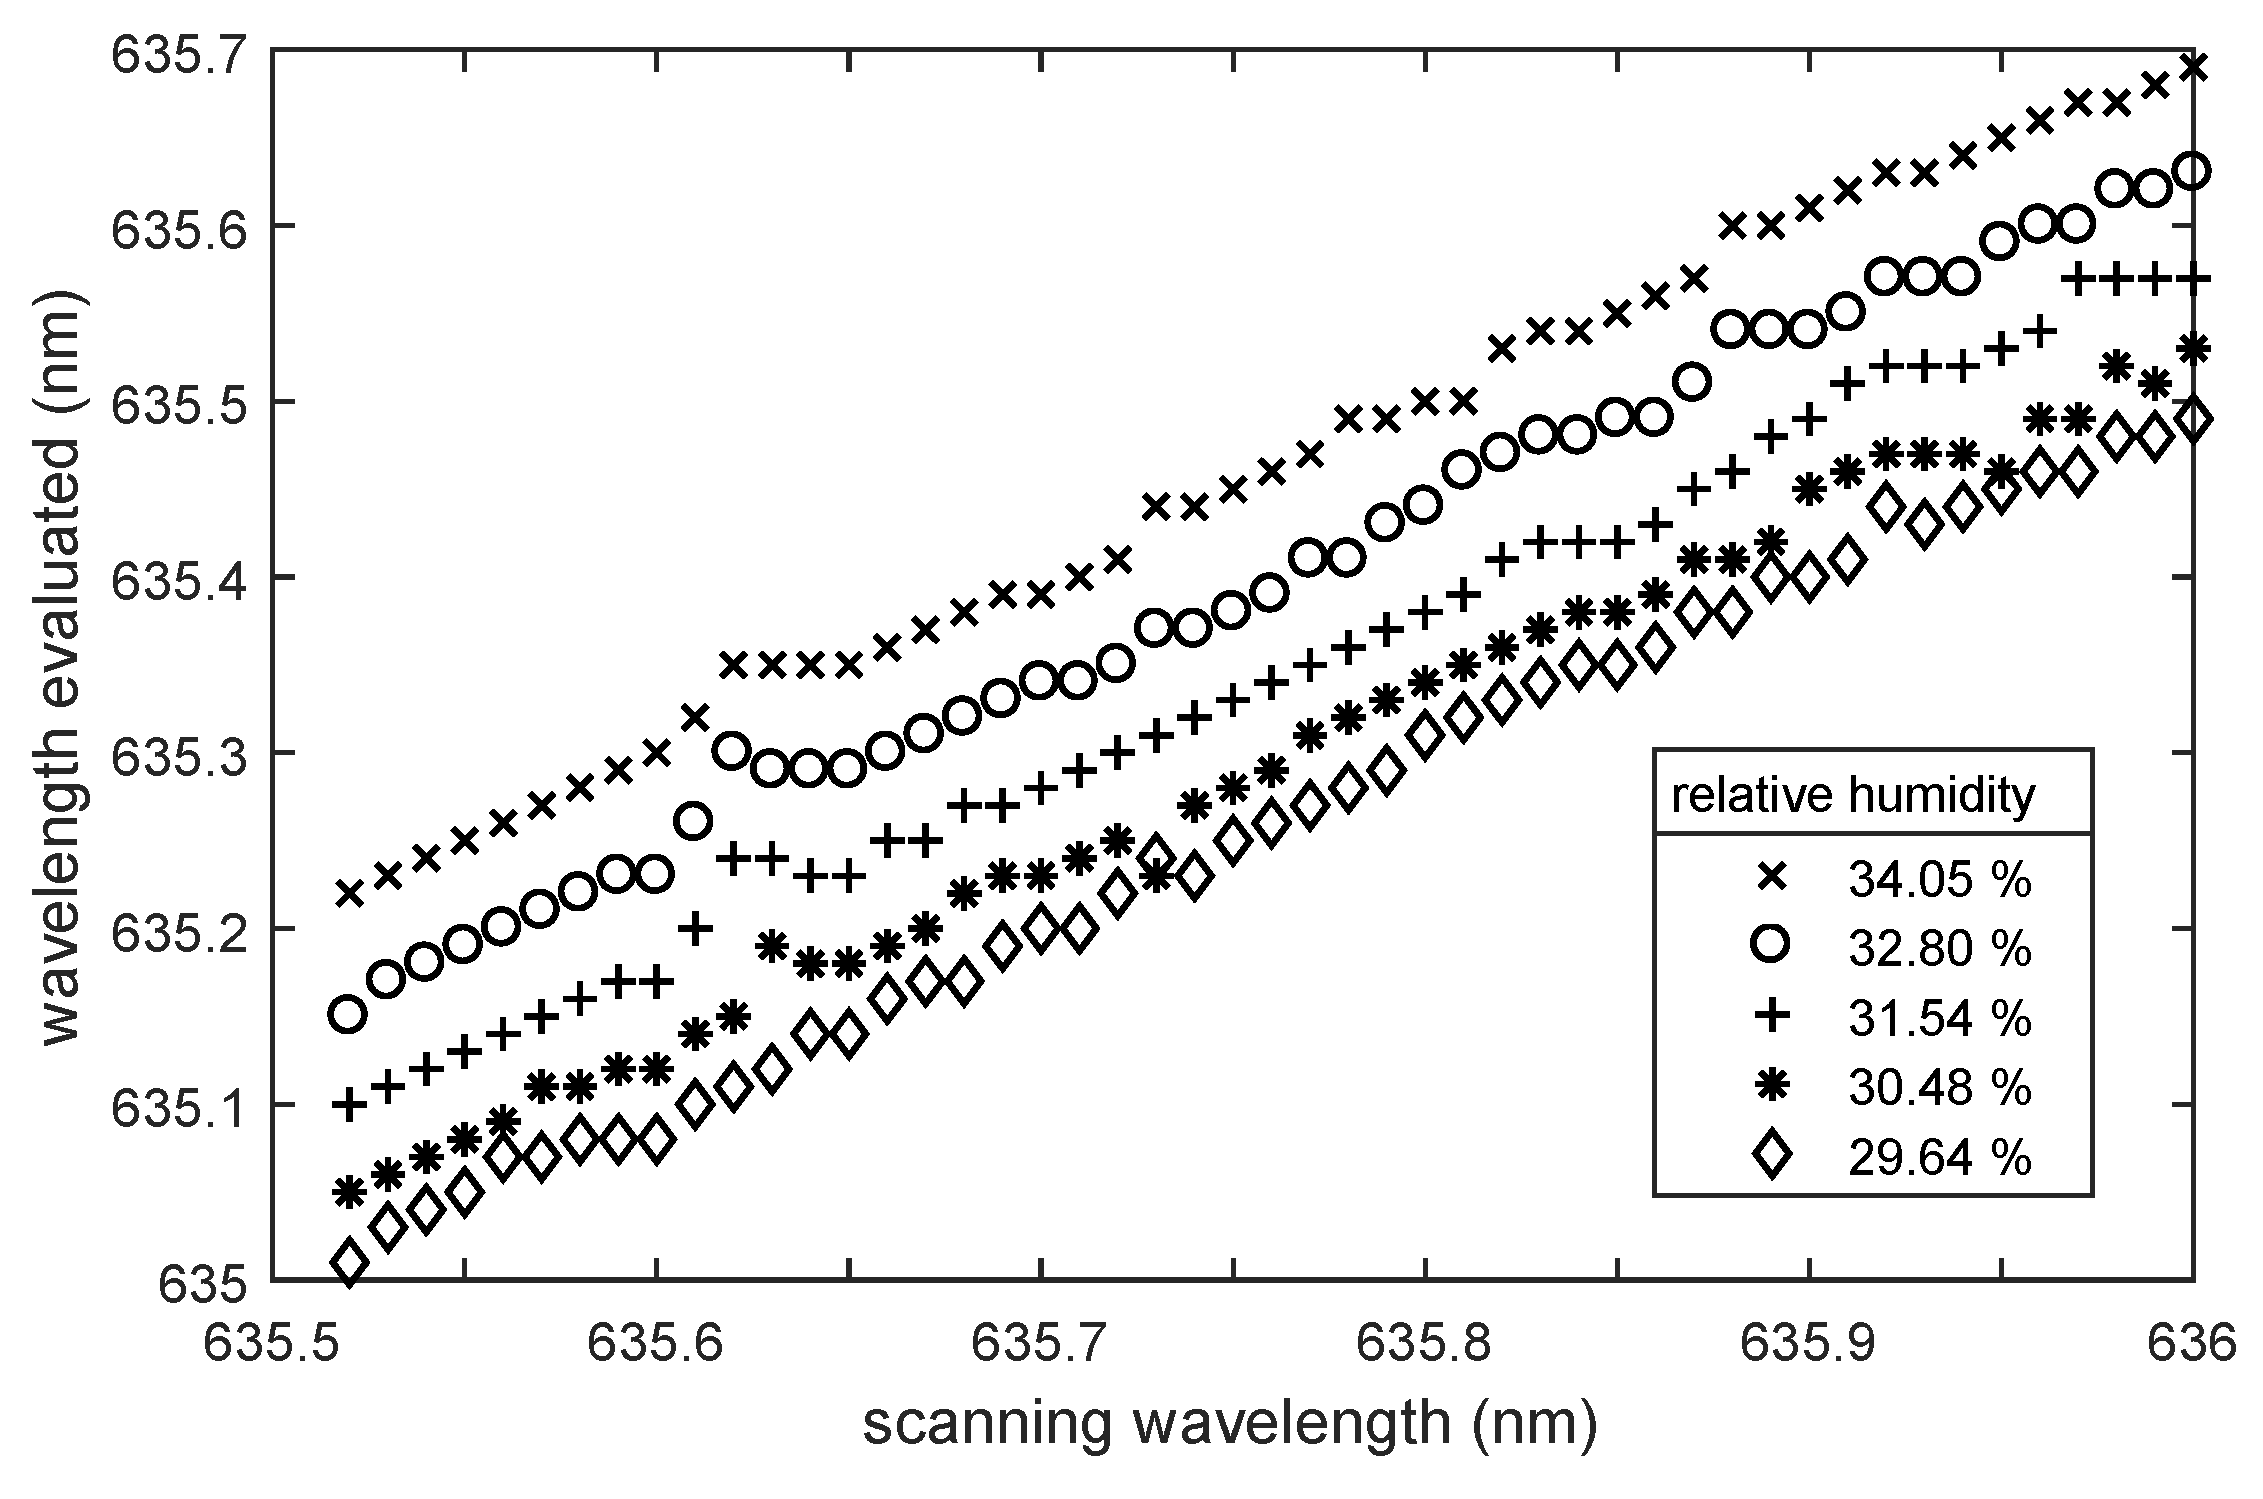
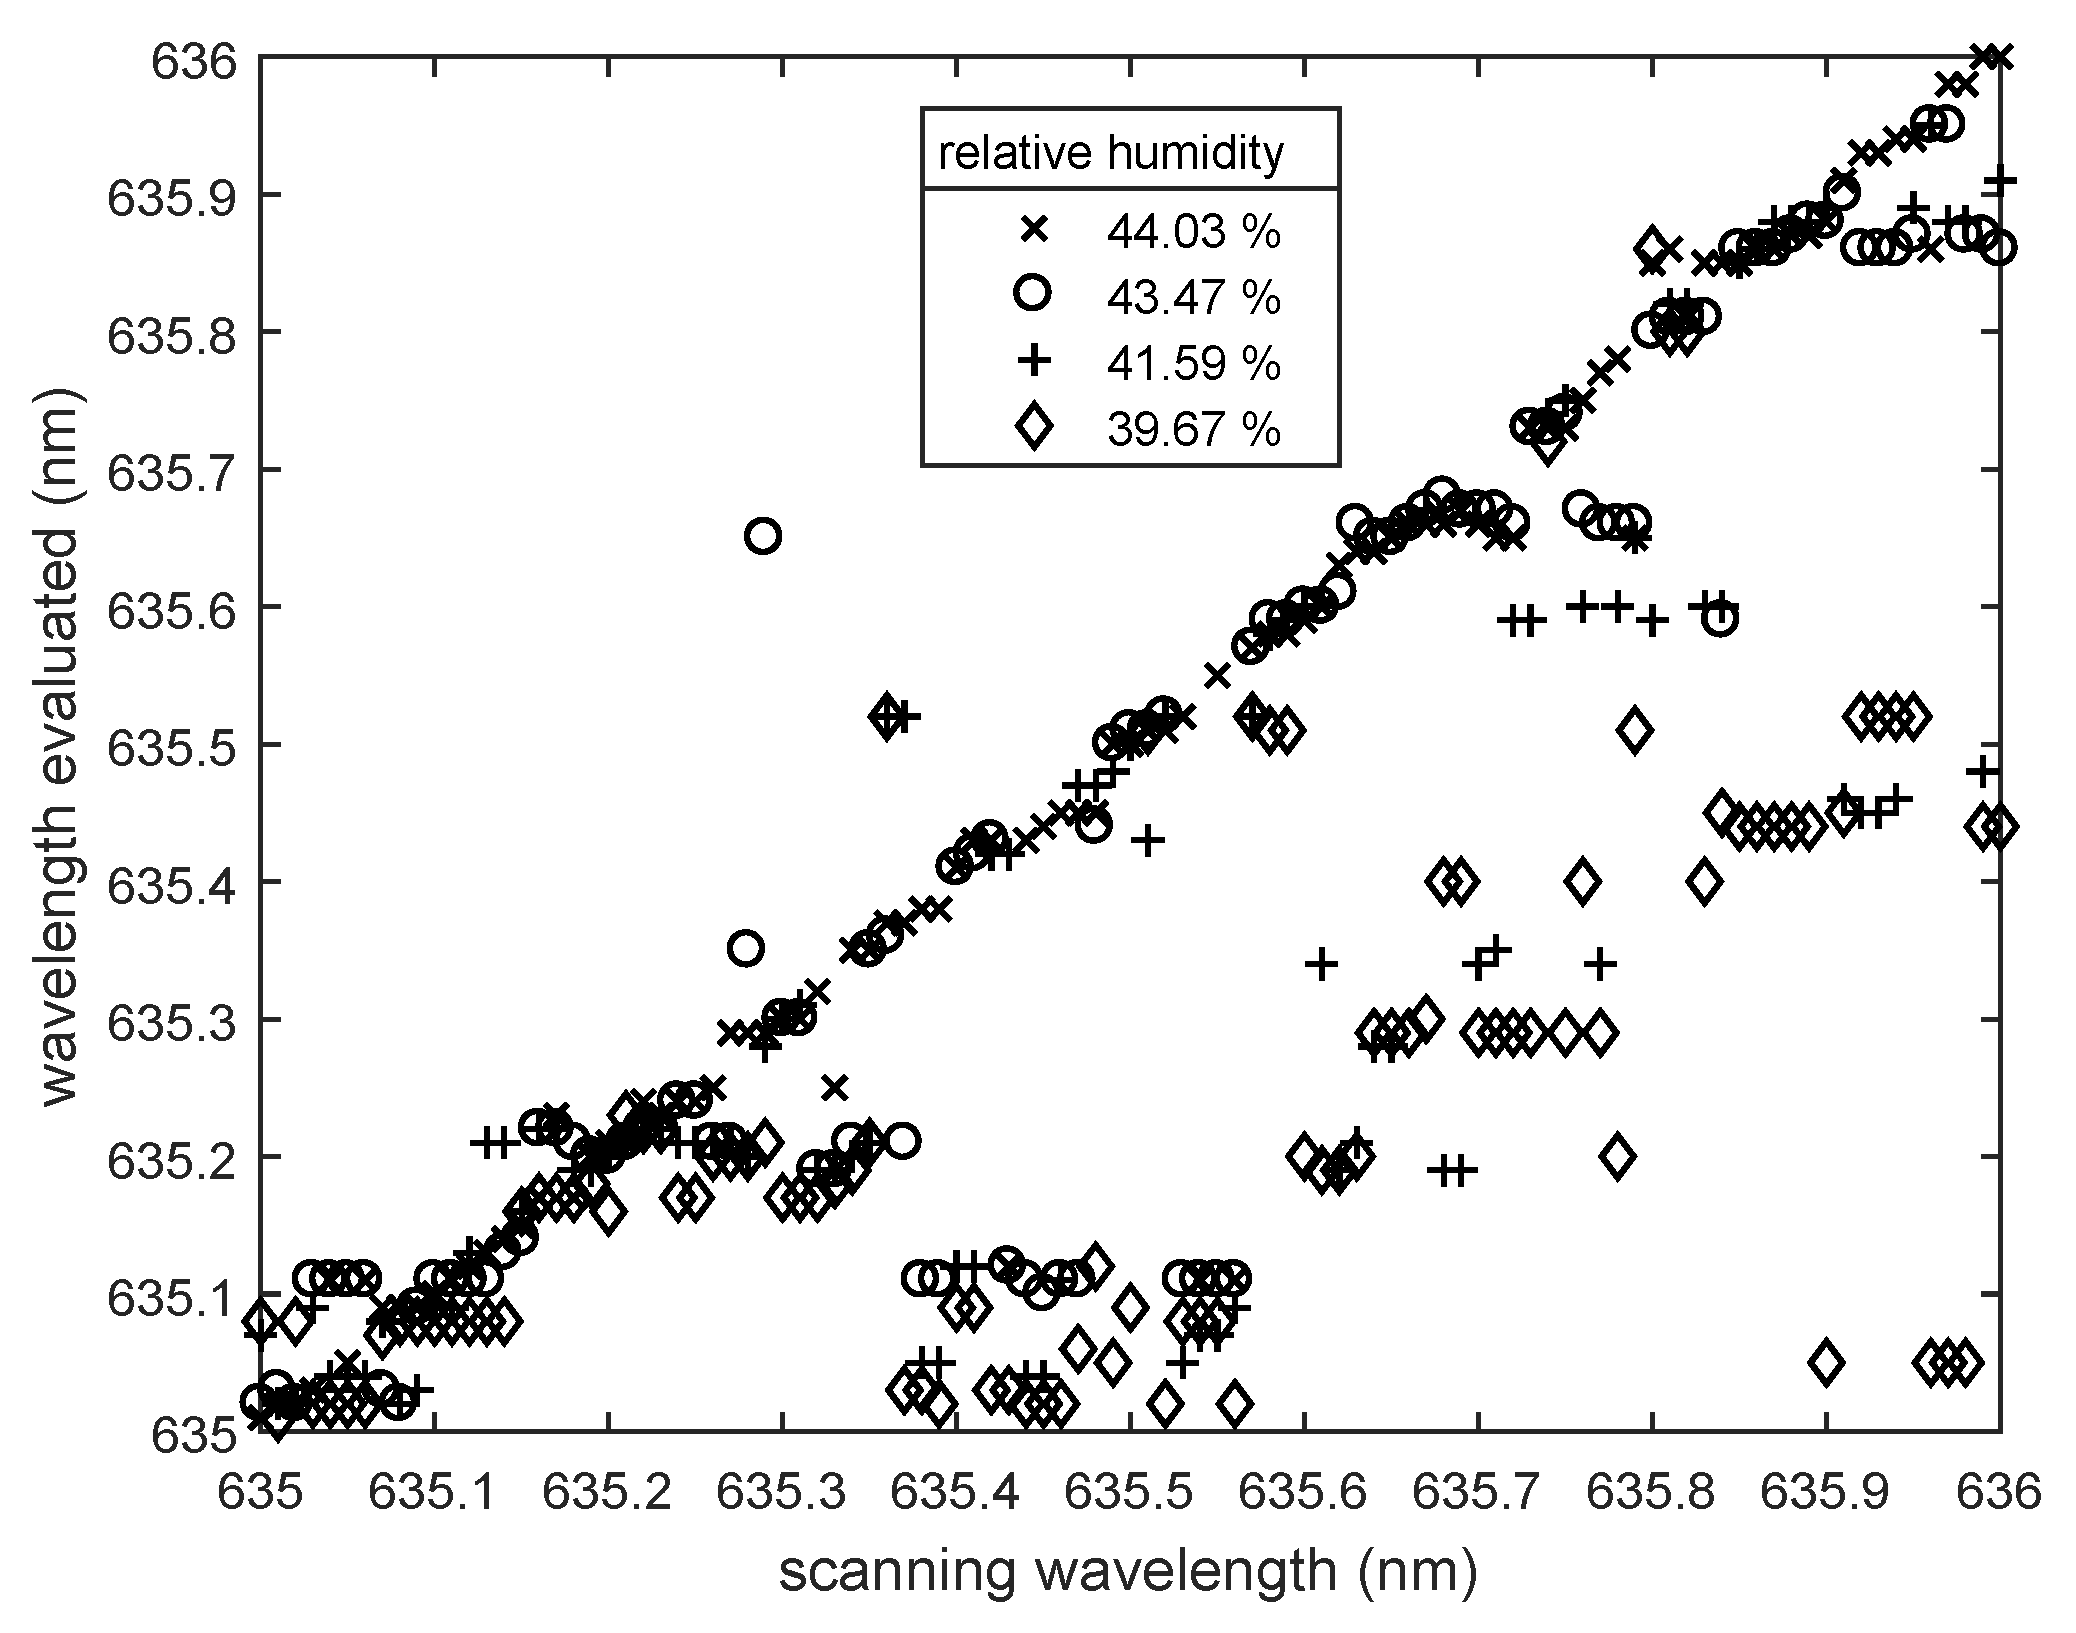
Different variants of the sensor array were investigated to evaluate the performance of the polymer-based WGM sensor concept for measurement of relative humidity. Each tested array consisted of approximately twenty spheres either with a mean diameter of 74 or 165 , respectively. In addition, arrays with fixed 74 spheres were fabricated. As described in Section 2.1, samples were placed in an closed acrylic box, and the relative humidity inside the box was adjusted by a salt solution. As the relative humidity is expected to translate to a spectral shift in the resonance pattern of the array, we compared the true excitation wavelength to the wavelength measured by the array at different humidity conditions. The sensors’ behavior and sensitivity were characterized at different humidity levels by scanning the wavelength of the exciting laser, taking an image of the array under test at each wavelength and finally comparing these images to the related mode map of the array from the initial calibration. Figure 5 exemplarily shows the results for an array consisting of twenty 74 spheres without fixation.
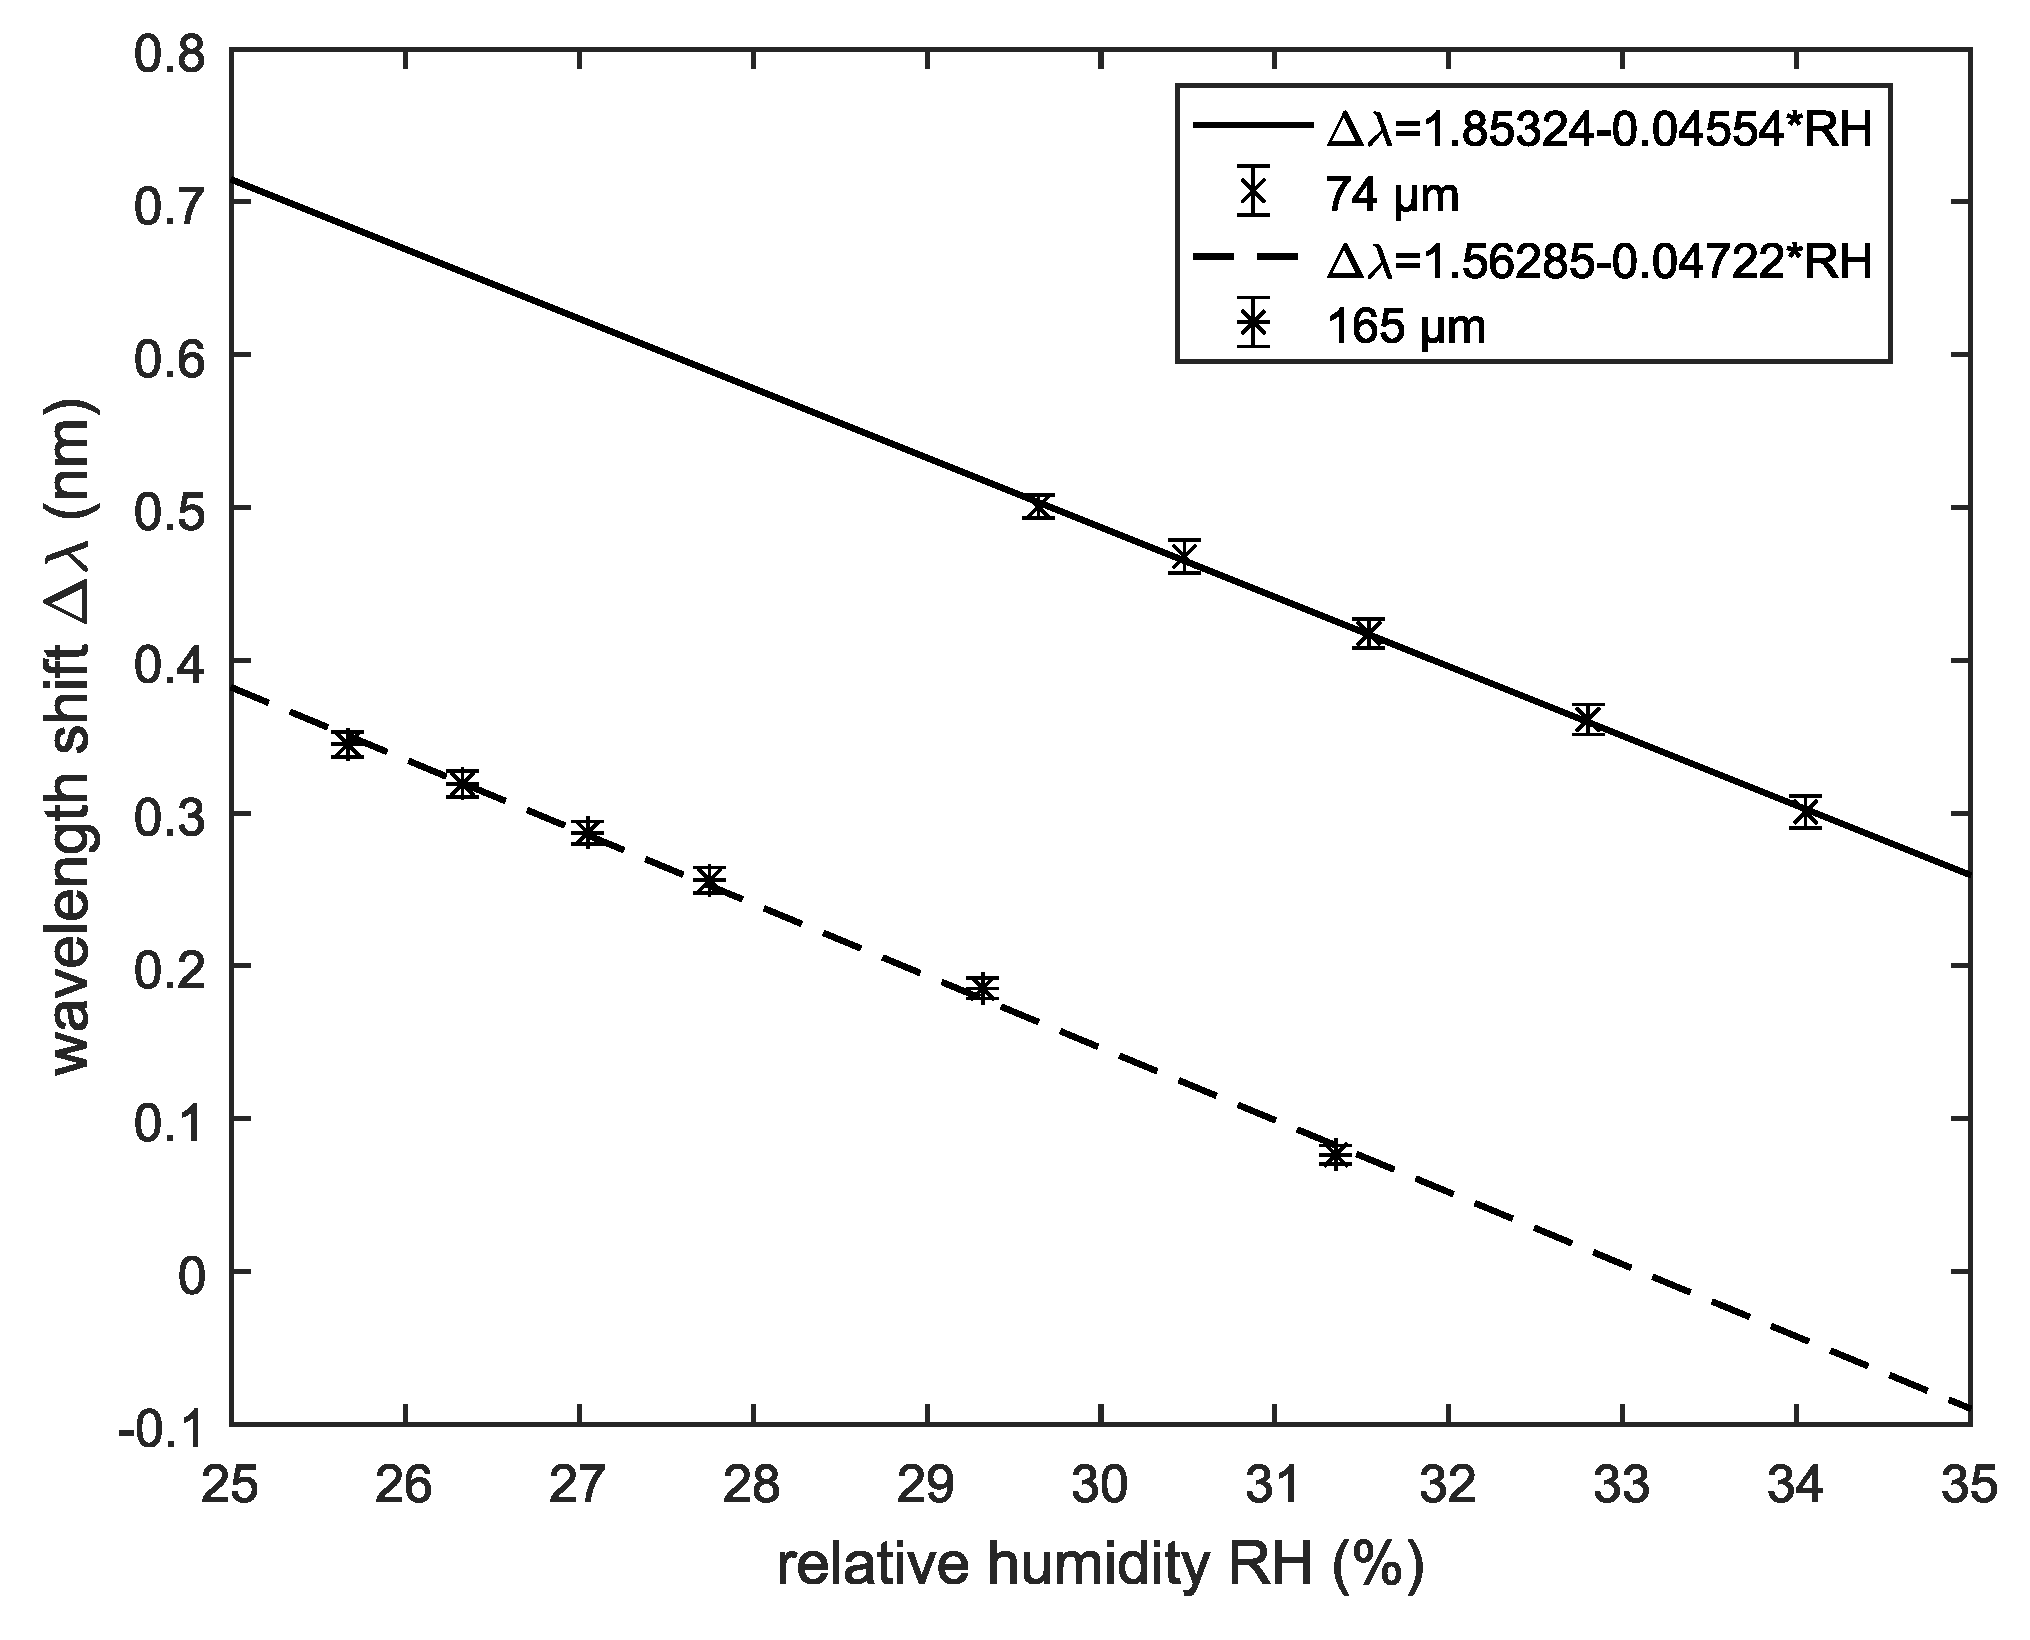
The relative humidity used for initial calibration was %, With decreasing RH, the evaluated wavelength shifted to smaller values (blue shift). To determine the sensitivity, the wavelength differences between evaluated and scanning wavelength were calculated. This was done for both average sphere sizes utilized. Figure 6 shows the calculated wavelength shift as a function of the relative humidity (RH). The slope of the curves is equal to the related sensitivity.
The sensitivity for the 74 -sphere array is /% RH. For the 165 -sphere array, /% RH is obtained. Therefore, the sensitivity for the larger spheres is slightly bigger. Furthermore, the measurement error is very small. As shown in previous work, the accuracy could be improved by adding more spheres to the system [12]. Here, the arrays consist of twenty 74 and twenty-four 165 spheres, respectively, which is a large number compared to arrays used in previous works [12,13].
For a more flexible use of the sensor and for a better protection against environmental influences, the spheres can be fixed to the substrate. Previously, we showed that the sensitivity loss of a sensor with fixation is small against a sensor without fixation when determining an unknown wavelength [13]. To test if the sensor with fixed spheres is also a suitable relative humidity sensor, we used an array with fixed 74 spheres and repeated the procedure as described above. Figure 7 shows the results for an array with twenty spheres and a initial relative humidity of %.
First, despite decreasing RH, we observed that the evaluated wavelength remained at the true exciting wavelength. When the relative humidity change became larger, the evaluated wavelength differed from the actual exciting wavelength, but not in a systematic way, as observed before by the unfixed spheres. We repeated the test with different fixed arrays and obtained the same result. Obviously, the fixation layer was the reason for this. The diameter of the spheres varied in response to the changes of the relative humidity. A change of refractive index was also possible, but not expected to be large enough to explain the pronounced spectral shift of the resonance conditions. The fixation layer probably shielded a part of each sphere from the influence of the surrounding humidity. It may have also mechanically counteracted humidity-induced diameter changes. Therefore, the sphere diameters and consequently also the evaluated wavelength remained constant. If the relative humidity change became larger, the sphere diameters would change, but not in a well-determined way. As the fixed spheres started to deform, the mode profile of the deformed spheres was not comparable to the original mode profile stored in the mode map. A comparison of the wavelength-dependent resonance patterns was, thus, no longer possible, and the relative humidity could not be measured accurately.
4. Discussion and Conclusions
Today, humidity sensors utilizing whispering gallery mode resonators generally consist of only one resonator [1,11]. Consequently, high quality resonators are crucial for such a system. To achieve high quality factors, the resonator material is often glass [18], requiring a humidity-sensitive coating for application in humidity measurement [1,2,11].
In this work, we presented an all-polymer whispering gallery mode sensor concept and evaluated the performance of different design variants in humidity measurements. The design has two main advantages compared to the standard single-resonator design: firstly, using many spheres instead of one softens the high demands on resonator quality; and secondly, using PMMA instead of silica makes an additional humidity-sensitive coating unnecessary. As the requirements concerning the quality of the spheres are low in our design, commercially available spheres can be used, ensuring that the device is inexpensive and easy to manufacture.
The experimental evaluation of different sensor configurations (fixed and unfixed spheres, large and small spheres) for RH measurement showed promising results. For unfixed spheres, we achieved sensitivities of 47 /% RH for the 165 spheres and 46 /% RH for the 74 spheres, respectively. The achieved sensitivities are higher compared to those reported previously in the literature with other whispering gallery mode-based humidity sensors such as /% RH for a polymer-clad silica microtoroid [1] or 16 /% RH for a polymer-clad microring resonator [11]). Rather, our results are comparable to those achieved with FBG-based humidity sensors (e.g., /% RH [8]).
Even though the sensor was not able to reliably measure humidity in the fixed sphere configuration, more favorable results may be achieved with an improved fixation layer, e.g., reduced coverage of the sphere surface by the fixation material and/or using a more elastic material. In view of the transfer of the sensor concept to real-life applications, it needs to be mentioned that in the experiments presented here, the temperature was constant over the whole trial period. In a real environment, this will, rather, not be the case. As temperature changes induce diameter changes, as well, the resonance pattern of the spheres will shift accordingly. Consequently, the two effects need to be separated in a humidity measurement. This can be realized in the future by making one part of the sensor array insensitive to humidity, for example by application of a protective layer. With this protected part, it would be possible to measure temperature variations simultaneously with the same sensor array in order to correct the evaluated humidity response for the actual temperature.
Author Contributions
Conceptualization, A.B.P., M.M.W. and B.W.R.; Methodology, A.B.P.; Software, A.B.P.; Validation, A.B.P. and T.H.; Formal Analysis, A.B.P.; Investigation, A.B.P. and T.H.; Resources, B.W.R. and M.M.W.; Data Curation, A.B.P. and T.H.; Writing—Original Draft Preparation, A.B.P.; Writing—Review & Editing, M.M.W. and B.W.R.; Visualization, A.B.P.; Supervision, M.M.W. and U.M.; Project Administration, M.M.W.; Funding Acquisition, M.M.W. and U.M.
Acknowledgments
The authors gratefully acknowledge the financial support by Deutsche Forschungsgemeinschaft (DFG) within the Collaborative Research Center “Transregio 123-Planar Optronic Systems.” The publication of this article was funded by the Open Access fund of Leibniz Universität Hannover.
Conflicts of Interest
The authors declare no conflict of interest. The funding sponsors had no role in the design of the study; in the collection, analyses or interpretation of data; in the writing of the manuscript; nor in the decision to publish the results.
References
- Mehrabani, S.; Kwong, P.; Gupta, M.; Armani, A.M. Hybrid microcavity humidity sensor. Appl. Phys. Lett. 2013, 102, 241101. [Google Scholar] [CrossRef]
- Huang, X.F.; Sheng, D.R.; Cen, K.F.; Zhou, H. Low-cost relative humidity sensor based on thermoplastic polyimide-coated fiber Bragg grating. Sens. Actuators B Chem. 2007, 127, 518–524. [Google Scholar] [CrossRef]
- Arregui, F.J.; Matias, I.R.; Cooper, K.L.; Claus, R.O. Simultaneous measurement of humidity and temperature by combining a reflective intensity-based optical fiber sensor and a fiber Bragg grating. IEEE Sens. J. 2002, 2, 482–487. [Google Scholar] [CrossRef]
- Muto, S.; Suzuki, O.; Amano, T.; Morisawa, M. A plastic optical fibre sensor for real-time humidity monitoring. Meas. Sci. Technol. 2003, 14, 746–750. [Google Scholar] [CrossRef]
- Yeo, T.L.; Sun, T.; Grattan, K.T.V.; Parry, D.; Lade, R.; Powell, B.D. Characterisation of a polymer-coated fibre Bragg grating sensor for relative humidity sensing. Sens. Actuators B Chem. 2005, 110, 148–156. [Google Scholar] [CrossRef]
- Zhang, W.; Webb, D.J. Humidity responsivity of poly (methyl methacrylate)-based optical fiber Bragg grating sensors. Opt. Lett. 2014, 39, 3026–3029. [Google Scholar] [CrossRef] [PubMed]
- Ma, Q.; Huang, L.; Guo, Z.; Rossmann, T. Spectral shift response of optical whispering-gallery modes due to water vapor adsorption and desorption. Meas. Sci. Technol. 2010, 21, 115206. [Google Scholar] [CrossRef]
- Zhang, W.; Webb, D.J.; Peng, G.D. Investigation into time response of polymer fiber Bragg grating based humidity sensors. J. Lightwave Technol. 2012, 30, 1090–1096. [Google Scholar] [CrossRef]
- Vollmer, F.; Yang, L. Review Label-free detection with high-Q microcavities: A review of biosensing mechanisms for integrated devices. Nanophotonics 2012, 1, 267–291. [Google Scholar] [CrossRef] [PubMed]
- Vollmer, F.; Arnold, S. Whispering-gallery-mode biosensing: Label-free detection down to single molecules. Nat. Methods 2008, 5, 591–596. [Google Scholar] [CrossRef] [PubMed]
- Bhola, B.; Nosovitskiy, P.; Mahalingam, H.; Steier, W.H. Sol-gel-based integrated optical microring resonator humidity sensor. IEEE Sens. J. 2009, 9, 740–747. [Google Scholar] [CrossRef]
- Petermann, A.B.; Varkentin, A.; Roth, B.; Morgner, U.; Meinhardt-Wollweber, M. All-polymer whispering gallery mode sensor system. Opt. Express 2016, 24, 6052–6062. [Google Scholar] [CrossRef] [PubMed]
- Petermann, A.B.; Rezem, M.; Roth, B.; Morgner, U.; Meinhardt-Wollweber, M. Surface-immobilized whispering gallery mode resonator spheres for optical sensing. Sens. Actuators A Phys. 2016, 252, 82–88. [Google Scholar] [CrossRef]
- Kelb, C.; Körner, M.; Prucker, O.; Rühe, J.; Reithmeier, E.; Roth, B. A Planar low-cost full-polymer Optical Humidity Sensor. Procedia Technol. 2016, 26, 530–536. [Google Scholar] [CrossRef]
- Ma, Q.; Rossmann, T.; Guo, Z. Whispering-gallery mode silica microsensors for cryogenic to room temperature measurement. Meas. Sci. Technol. 2010, 21, 025310. [Google Scholar] [CrossRef]
- Schweiger, G.; Nett, R.; Weigel, T. Microresonator array for high-resolution spectroscopy. Opt. Lett. 2007, 32, 2644–2646. [Google Scholar] [CrossRef] [PubMed]
- Weigel, T.; Dobbelstein, H.; Esen, C.; Schweiger, G.; Ostendorf, A. Spherical optical microresonator array as a multi-purpose measuring device. Proc. SPIE 2014, 8960. [Google Scholar] [CrossRef]
- Lin, G.; Diallo, S.; Henriet, R.; Jacquot, M.; Chembo, Y.K. Barium fluoride whispering-gallery-mode disk-resonator with one billion quality-factor. Opt. Lett. 2014, 39, 6009–6012. [Google Scholar] [CrossRef] [PubMed]
Figure 1.
Experimental setup: Ten percent of the laser intensity is detected with a photodiode for calibration purposes. The remaining ninety percent of the laser intensity is collimated and coupled under 45° in a PMMA plate and guided based on total internal reflection. PMMA spheres supporting the whispering gallery modes (WGMs) are placed in the evanescent field present at the plate surface. The light distribution is captured by a CMOS camera equipped with a microscope objective.

Figure 2.
The WGM sensor, the commercially available relative humidity sensor and the saturated salt solution for humidity adjustment, placed under an acrylic box.
Figure 2.
The WGM sensor, the commercially available relative humidity sensor and the saturated salt solution for humidity adjustment, placed under an acrylic box.

Figure 3.
Mode map for an array of twenty spheres with a mean diameter of (the frame number relates to wavelength).
Figure 3.
Mode map for an array of twenty spheres with a mean diameter of (the frame number relates to wavelength).

Figure 4.
Comparison of scanning wavelengths and determined wavelengths, if the relative humidity changes (circles) or remains constant (crosses).
Figure 4.
Comparison of scanning wavelengths and determined wavelengths, if the relative humidity changes (circles) or remains constant (crosses).

Figure 5.
Determined wavelength compared to the laser scanning wavelength for different relative humidity levels. The initial relative humidity was %, and the array consisted of twenty 74 spheres.
Figure 5.
Determined wavelength compared to the laser scanning wavelength for different relative humidity levels. The initial relative humidity was %, and the array consisted of twenty 74 spheres.

Figure 6.
Wavelength shift as a function of relative humidity for arrays consisting of 74 spheres and 165 spheres, respectively. The slope of the curves is equal to the sensitivity.
Figure 6.
Wavelength shift as a function of relative humidity for arrays consisting of 74 spheres and 165 spheres, respectively. The slope of the curves is equal to the sensitivity.

Figure 7.
Determined wavelength compared to the laser scanning wavelength for a fixed sensor array at different relative humidity levels. The initial relative humidity was %, and the array consisted of twenty fixed spheres with diameter of 74 .
Figure 7.
Determined wavelength compared to the laser scanning wavelength for a fixed sensor array at different relative humidity levels. The initial relative humidity was %, and the array consisted of twenty fixed spheres with diameter of 74 .

© 2018 by the authors. Licensee MDPI, Basel, Switzerland. This article is an open access article distributed under the terms and conditions of the Creative Commons Attribution (CC BY) license (http://creativecommons.org/licenses/by/4.0/).
Share and Cite
MDPI and ACS Style
Petermann, A.B.; Hildebrandt, T.; Morgner, U.; Roth, B.W.; Meinhardt-Wollweber, M. Polymer Based Whispering Gallery Mode Humidity Sensor. Sensors 2018, 18, 2383. https://doi.org/10.3390/s18072383
AMA Style
Petermann AB, Hildebrandt T, Morgner U, Roth BW, Meinhardt-Wollweber M. Polymer Based Whispering Gallery Mode Humidity Sensor. Sensors. 2018; 18(7):2383. https://doi.org/10.3390/s18072383
Chicago/Turabian StylePetermann, Ann Britt, Thomas Hildebrandt, Uwe Morgner, Bernhard Wilhelm Roth, and Merve Meinhardt-Wollweber. 2018. "Polymer Based Whispering Gallery Mode Humidity Sensor" Sensors 18, no. 7: 2383. https://doi.org/10.3390/s18072383
Note that from the first issue of 2016, this journal uses article numbers instead of page numbers. See further details here.