A Simple and Effective Colorimetric Assay for Glucose Based on MnO2 Nanosheets
by
Zhengjun Huang
†, 
Linlin Zheng
†,
Feng Feng
,
Yuyuan Chen
,
Zhenzhen Wang
,
Zhen Lin
,
Xinhua Lin
and
Shaohuang Weng
* Department of Pharmaceutical Analysis, School of Pharmacy, the Higher Educational Key Laboratory for Nano Biomedical Technology of Fujian Province, Fujian Medical University, Fuzhou 350122, China
*
Author to whom correspondence should be addressed.
†
These authors contributed equally to this work.
Sensors 2018, 18(8), 2525; https://doi.org/10.3390/s18082525
Submission received: 7 June 2018
/
Revised: 26 July 2018
/
Accepted: 28 July 2018
/
Published: 2 August 2018
(This article belongs to the Special Issue Colorimetric and Fluorescent Sensors 2018)
Abstract
:Simple and effective methods for the detection of the level of blood glucose are closely linked to the monitoring of people’s health. In the study, MnO2 nanosheets with absorption range of 300 nm~500 nm and obvious yellow color were easily prepared and applied to detect glucose through their absorbance and color. The proposed method is based on the fact that a specific concentration of glucose can be quantitatively transformed into hydrogen peroxide (H2O2) under the catalytic effect of glucose oxidase. Based on the redox reaction of MnO2 with H2O2, yellow MnO2 can be converted into colorless Mn2+ to monitor the concentration of glucose. Under optimal conditions, a simple and effective visual assay for the sensitive and reliable detection of glucose was developed. The linear range was estimated to the range from 0 μM to 100 μM, with a detection limit of 12.8 μM. Furthermore, the proposed colorimetric assay based on MnO2 nanosheets can effectively detect blood glucose of clinical serum samples with accuracy and convenience.
1. Introduction
Glucose, the energy source of living cells and the intermediate product of metabolism, plays an important role in the natural growth of cells and organisms. For humans, blood glucose should be maintained at the suitable range to meet the needs of a healthy body. Abnormal levels of blood glucose are closely linked to some diseases such as diabetes and hypoglycemia. In recent years, the trend of younger and the increasing incidence of diabetes require some facile and accurate methods for the monitor of blood glucose. At present, numerous analytical methods, such as surface-enhanced Raman scattering [1], chemiluminescence [2], electrochemistry (electroanalysis and electrochemiluminescence) [3,4], fluorescence [5,6] and spectrophotometry [7], have been developed and applied for blood glucose determination. Among them, colorimetric assays based on spectrophotometry have attracted great attention, which has led to a significant contribution to real-time detection of glucose in a convenient and economical strategy [8,9,10]. A variety of colorimetric systems are used to accurately determine blood glucose, such as those based on paper microfluidic devices [11], metal-organic frameworks [12], nanoclusters [13], mesoporous carbon [14,15] and magnetic nanoparticles [16]. Although these methods are powerful and effective, the potential interference of complex components present in clinical specimens and high cost are still issues in visual blood glucose measurement. Therefore, it is still of great value to develop some new type colorimetric methods that are modification-free and inexpensive for blood glucose monitoring.
Hydrogen peroxide (H2O2) plays key roles as a redox signaling molecule in the regulation of various physiological processes [17,18]. The control level of H2O2 is a relatively significant indicator of several biological processes such as the immune system [19], and cancer incidence [20,21]. In addition, H2O2 can be the main intermediary reactant for immunoassays such as enzyme linked immunosorbent assay (ELISA) and chemiluminescence [22,23]. Furthermore, H2O2 is a byproduct of general oxidation reactions from the catalytic process of glucose oxidase [24], amino-acid oxidase [25], uricase and so on [26]. Thus, accurate detection of H2O2 or fabricating special sensing method based on the medium of H2O2 is of practical importance in clinical and biological systems. Recently, the interaction between H2O2 and metal oxides has been applied extensively to the construction of H2O2-related colorimetric or fluorescent biosensing platform [27,28,29]. Among a wide variety of metal oxides, Fe3O4 and CeO2 were the two best materials for the successful application of the H2O2-based bioanalysis [27,28,29]. However, the fabrication of H2O2-based analyses for special targets through the direct action of H2O2 and metal oxides to modulate the content of applied metal oxide as the signal is still rare.
Recently, MnO2 nanosheets, a metal oxide nanomaterial with ultrathin layers, were recognized as planar structures like graphene [30]. Due to their two-dimensional, adsorption and convenient preparation characteristics, several applications based on the changes of the content of MnO2 nanosheets, such as fluorescent and drug delivery platforms [31], were established. Besides them, sensing methods for ascorbic acid, hypochlorite and other substances based on the change of the absorbance of MnO2 nanosheets, have proved that MnO2 nanosheets can be a suitable candidate for the establishment of visual inspection methods [32,33]. Furthermore, MnO2 nanosheets have the advantages of non-toxicity and a large molar extinction coefficient (9.6 × 10³ M−1 cm−1) [34,35]. However, colorimetric assays based on the direct application of MnO2 nanosheets as the visual signal source is still scarce at present.
In this work, we designed and prepared MnO2 nanosheets with obvious yellow color, and used their absorbance and color to fabricate a visual analytical system for glucose monitoring, as shown in Scheme 1. It is known that H2O2 can react with MnO2 nanosheets following the redox reaction of MnO2 + H2O2 + 2H+ → Mn2+ + 2H2O + O2. Under certain conditions, the yellow MnO2 nanosheets were reduced to colorless Mn2+ by H2O2. The degree of reaction was closely related to the concentration of H2O2, so we can quantify the concentration of H2O2 using the color reduction of yellow color of MnO2 nanosheets [5]. As the well-known byproduct of the enzymatic reaction of glucose oxidase (GOD) towards glucose, the generated H2O2 in glucose sensors was the actual target for the modified signal. Therefore, based on the reaction of yellow MnO2 nanosheets and H2O2, the quantification of glucose corresponding to the different absorbance of yellow MnO2 nanosheets will be achieved.
2. Experimental
2.1. Chemicals and Materials
Glucose, 30% H2O2, and KMnO4 were obtained from Sinopharm Chemical Reagent Co., Ltd. (Shanghai, China). 2-Morpholinoethanesulfonic acid (MES), N-ethylmaleimide (NEM), glucose oxidase from Aspergillus niger (GOD) (Art. No. G7141) and human serum albumin (HSA) were purchased from Sigma-Aldrich Co. Ltd. (St. Louis, MO, USA). Maltose, fructose, phenylalanine (Phe), lysine (Lys), cysteine (Cys), glutathione (GSH) and sodium periodate were obtained from Aladdin Chemistry Co., Ltd. (Shanghai, China). All chemicals were of analytical grade and used as received. All of the stock solutions were prepared through deionized water.
2.2. Apparatus
Ultraviolet and visible (UV-vis) spectra were performed on a UV-2450 spectrophotometer (Shimadzu Co., Kyoto, Japan). FTIR spectra were performed on an Avatar-330 infrared spectrometer (Nicolet Co., Waltham, MA, USA). Transmission electron microscopy (TEM) and high resolution TEM (HRTEM) were performed on a JEM-2100 system (JEOL Co., Ltd., Tokyo, Japan) with an accelerating applied potential of 200 kV. All the testing was carried out at ambient temperature.
2.3. Synthesis of MnO2 Nanosheets
In a tube, 9 μL of 10 mM KMnO4 was added in 75 μL of 0.1 mM MES buffer (pH = 6.0). Afterward, the above solution was diluted to 300 μL with deionized water. After reacting for a few minutes, the color of the solution changed from purple to brown under shaking. The as-formed precipitate was successively centrifuge for 10 min at 3500 g. Then, the precipitate was washed and centrifuged with deionized water several times to remove byproducts and residual ions [36]. Later, the obtained MnO2 nanosheets were all dispersed in 100 μL MES buffer in a tube for subsequent use. Such MnO2 nanosheets dispersion in a tube was designed as “solution 1”.
2.4. Reaction between H2O2 and MnO2 Nanosheets
Before the detection of glucose, the reaction between H2O2 and MnO2 nanosheets was investigated. In 10 mM MES buffer (pH = 6.0), a series of concentration of H2O2 were respectively added into the solution 1. The reaction volume was adjusted to 700 μL via the addition of 10 mM MES buffer. Then, UV-vis spectrum was recorded.
2.5. Determination of Glucose
There are two operating steps for the detection of glucose. First, different concentrations of glucose solution was successively added into the certain volume of 10 mM MES buffer (pH = 6.0) and 57.62 μL of 0.0321 mg/mL GOD, followed by successively mixing and incubation at 37 °C for 5 min to obtain H2O2. Then, the dispersion of the prepared MnO2 nanosheets in a tube (Solution 1) was added into the above solution. The reaction volume was adjusted to 700 μL by controlling the amount of MES buffer. The resulting solution was successively incubated at 37 °C for 40 min for the further UV-vis determination and taking pictures.
3. Results and Discussion
3.1. Characterization of MnO2 Nanosheets
At first, the morphology, lattice structure and spectral properties of the as-formed MnO2 nanosheets were systematically characterized. As displayed in Figure 1A, TEM images of MnO2 nanosheets show uniform large two-dimensional film morphology with a lateral diameter of about 100 nm. Furthermore, obvious wrinkles can be seen on the surface of the MnO2 nanosheets, suggesting the thin characteristics of the film. High-resolution TEM (HRTEM) demonstrated that MnO2 nanosheets formed typical interlayer lattice planes of ~0.27 nm, which was ascribed to the (111) diffraction facet of monoclinic-stuctured δ-MnO2 [37]. EDS of MnO2 nanosheets in carbon-coated Cu supported membrane suggested the main components of Mn and O with the elemental ratio of Mn and O close to 1:2 (Figure 1B). In addition, FTIR and UV-vis measurements were used for the further illuminating the characteristics of the prepared MnO2 nanosheets. As shown in Figure 1C, the FTIR spectrum showed a characteristic absorption peak at about 521 cm−1 ascribed to Mn-O vibration, suggesting the specific structure information of the MnO2 nanosheets [31,38]. In the wavelength range from 300 nm to 500 nm, the UV-vis spectrum indicated a broad absorption band with a shoulder centered at 346 nm (Figure 1D), which was the d-d transition of Mn (IV) in the lattice structure of MnO6 octahedra of MnO2 nanosheets. Thus, the absorption at 346 nm can be a suitable selection for the quantification of the content of MnO2 nanosheets. The spectral characterizations confirmed the structural information and spectral propertyof the prepared MnO2 nanosheets [33]. Moreover, the insert of Figure 1D illustrated that the dispersion MnO2 nanosheets exhibited a homogeneous, transparent, and uniform yellow color by comparing three MnO2 nanosheet dispersions manufactured in the same manner under parallel operation.
3.2. Feasibility of the Detection of Glucose Using MnO2 Nanosheets
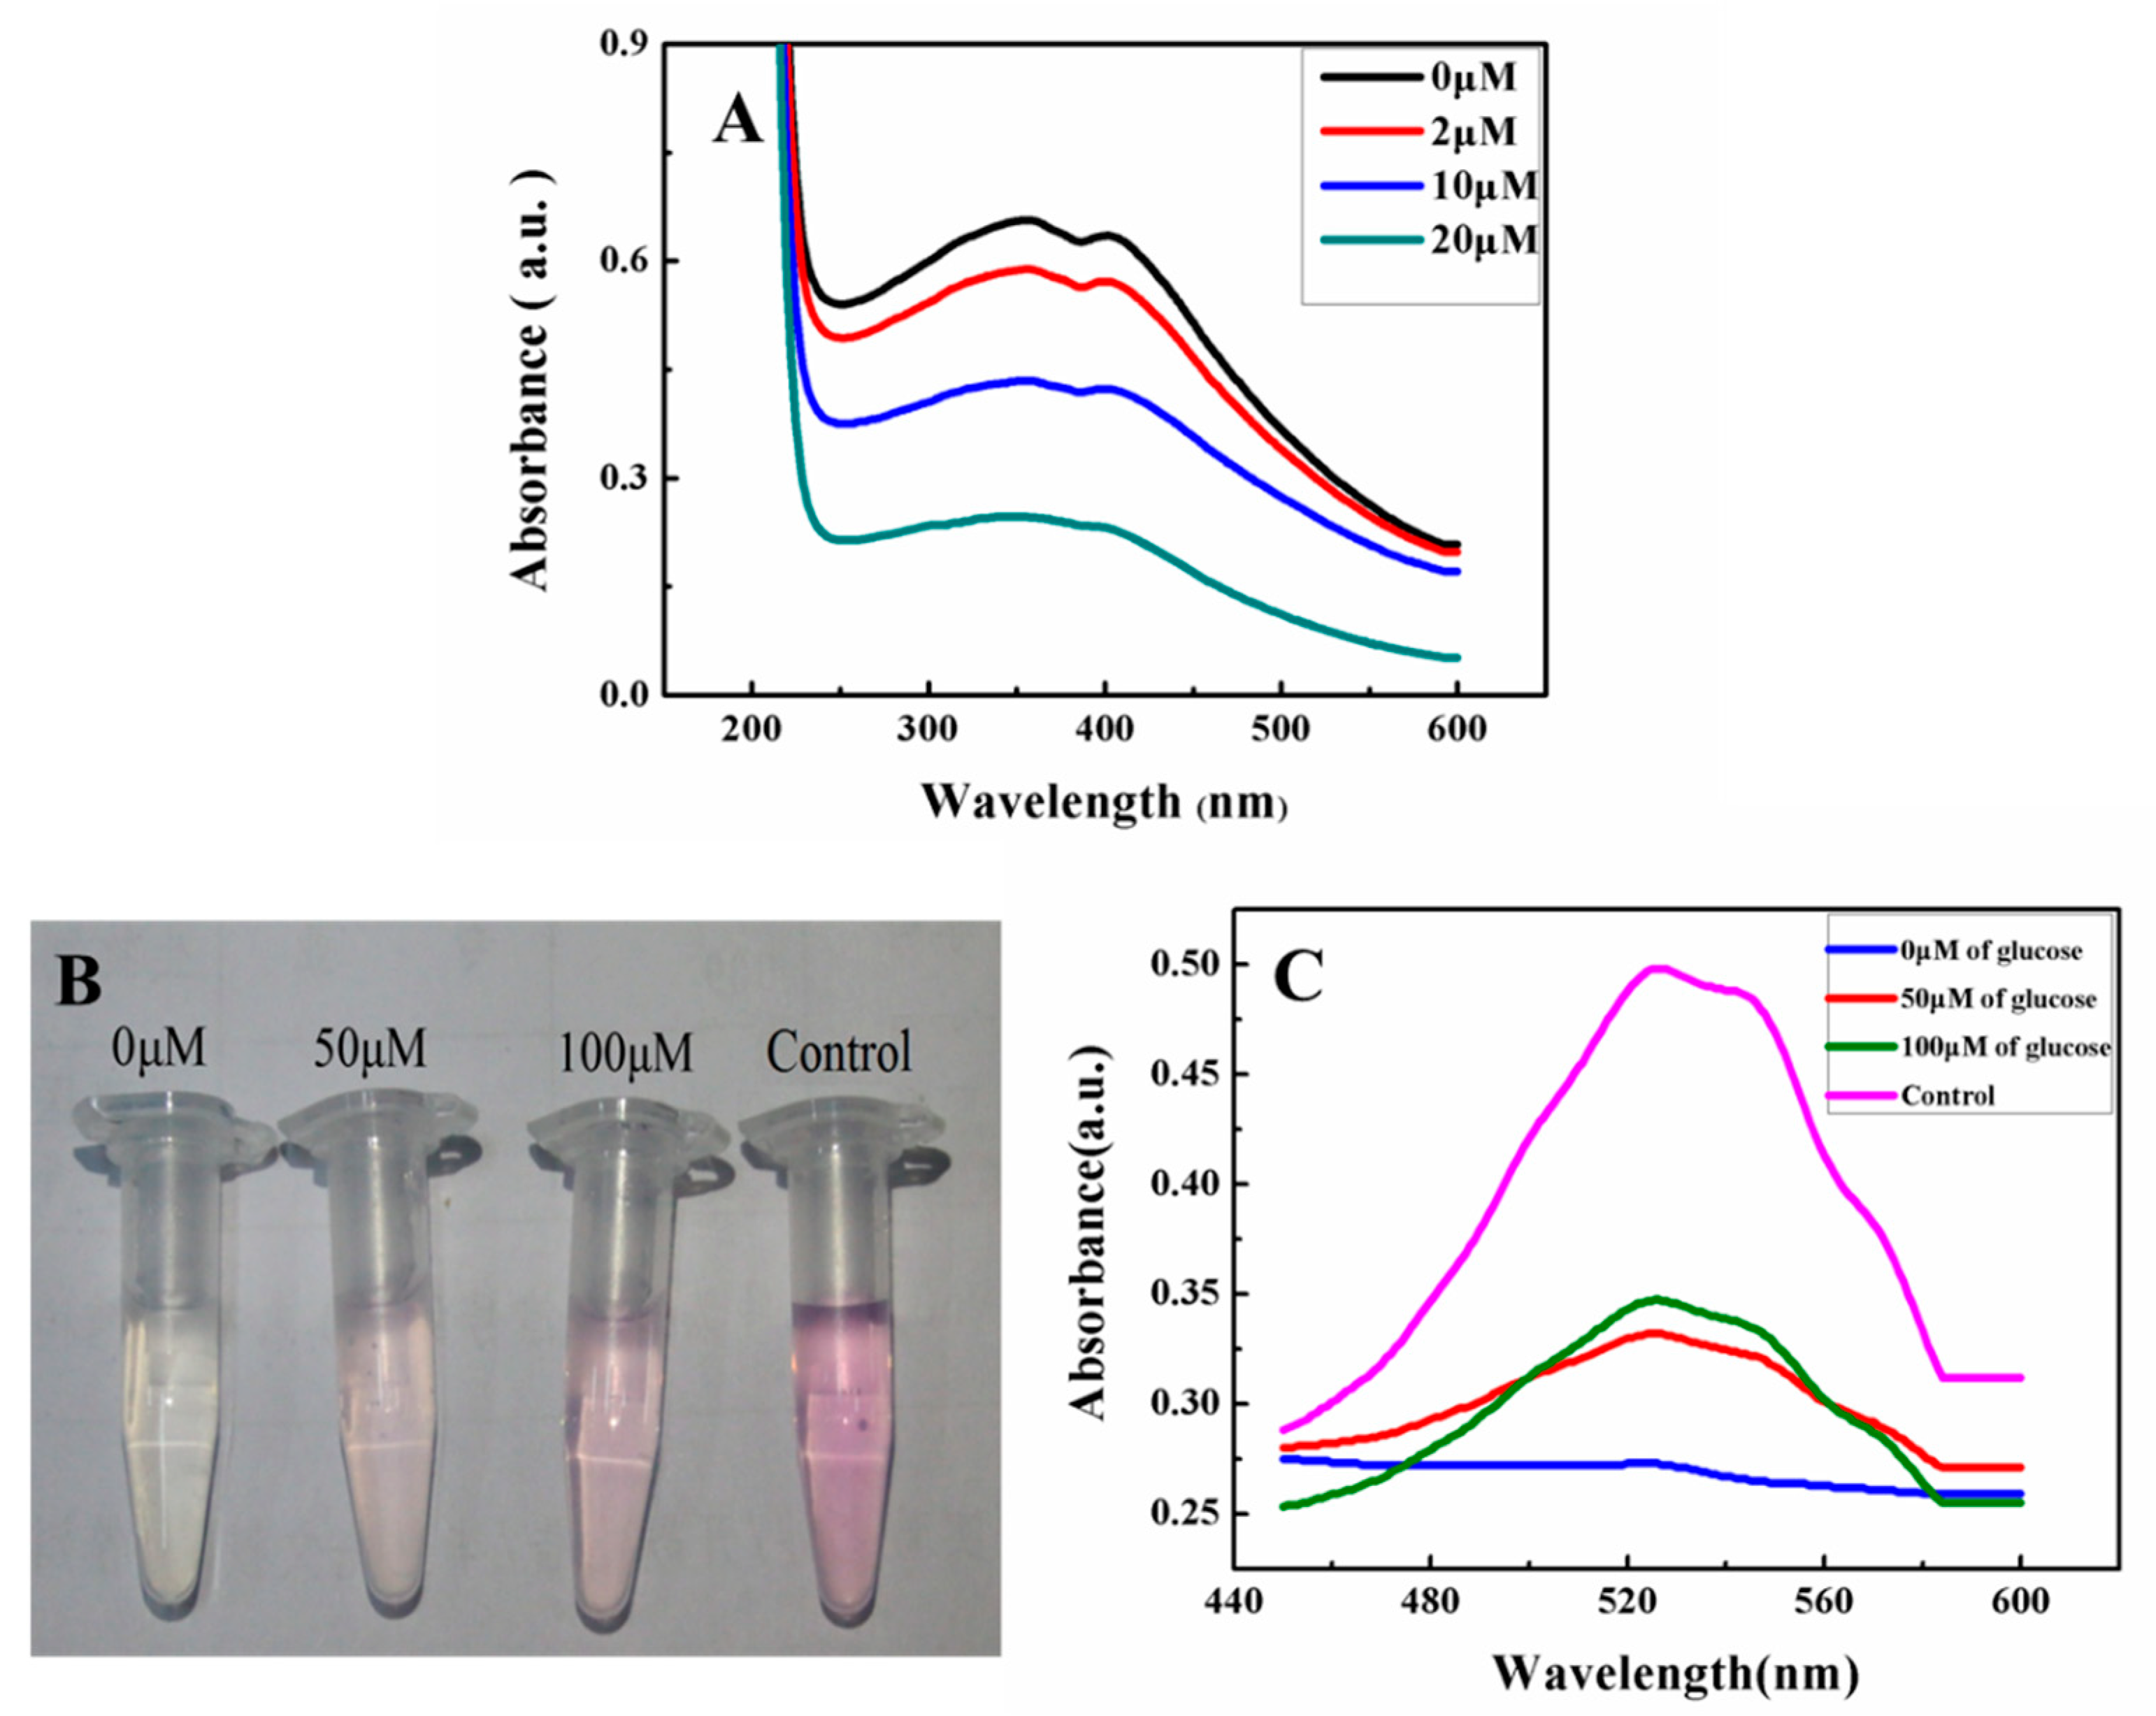
The feasibility of the reaction between MnO2 nanosheets and H2O2 was evaluated. As shown in Figure 2A, with the increased concentrations of H2O2 in the dispersion of MnO2 nanosheets, the absorbance of MnO2 nanosheets gradually decreased. The result proved that the redox reaction of MnO2 and H2O2 had happened according to the reaction MnO2 + H2O2 + 2H+→Mn2+ + 2H2O + O2. It is known that H2O2 can be generated under the enzymatic catalysis of GOD to glucose. Thus, the detection of glucose using MnO2 nanosheets as signal with the catalysis of GOD can be achieved.
Although the application of MnO2 nanosheets as a signal source for the detection of glucose [33], the judgment of the mechanism of the sensing feasibility for glucose is also an important factor for the understanding of this method. It is known that one of the resultant products of MnO2 and H2O2 was Mn2+, thus in order to judge the feasibility of the sensing of glucose, the verification of Mn2+ as the product of detecting glucose using MnO2 and GOD as the reacting sources was investigated. The sodium periodate oxidation colorimetric assay was used to validate the generated Mn2+. Mn2+ will be oxidized by periodate to generate purple permanganate under acidic conditions following the reaction of 2Mn2+ + 5IO4− + 3H2O → 2MnO4− + 5IO3− + 6H +. According to the detecting protocol of glucose, the result reacting solutions with different contents of glucose were applied to react with sodium periodate to prove the generation of Mn2+. Figure 2B shows that the resulting solution according to the detection protocol of glucose using MnO2 nanosheets restored the purple observation with the addition of sodium periodate and the increased concentrations of glucose cause a deepened purple. The increased absorbance was in agreement with the increasing generation of MnO4− according to increased Mn2+ obtained from the detecting progress of glucose through the reaction of H2O2 and MnO2 nanosheets (Figure 2C). Thus, the feasibility of the reaction between MnO2 and H2O2 can be expanded to the sensing of glucose.
3.3. Optimization of Experimental Conditions
pH significantly affects the activity of GOD and the detection sensitivity, so the pH was first optimized. Typically, considering the activity of GOD and the physiological condition of organisms, the main pH range from 5.0 to 7.5 was applied to investigate the influences of MES buffers at different pH on the varied absorbance of the strategy for glucose. Figure 3A shows that the ΔA (the difference of the absorbance of the assay without and with the presence of glucose) of MnO2 nanosheets at 346 nm increased and then decreased in the pH range of 5.0 to 7.5 with a maximum value at pH 6.0 towards the detection of glucose. Therefore, pH 6.0 was chosen as the optimal solution for this procedure. A series of the original concentrations of GOD added into the assay condition were also compared to optimize the suitable concentration of GOD for the proposed method, as shown in Figure 3B. The ΔA of MnO2 nanosheets at 346 nm was maximum at the condition of the addition of 0.0321 mg/mL GOD into the solution. Thus, original 0.0321 mg/mL GOD for the assay was chosen.
3.4. Analytical Performance of the Sensing of Glucose
Under the optimal conditions, different concentrations of glucose were detected. Figure 4A shows the UV-vis spectra after the system of GOD and MnO2 nanosheets with several variable concentrations of glucose. The absorbance of the resulting solution decreased proportionately with the increasing concentrations of glucose. Furthermore, Figure 4B indicated that the absorbance at 346 nm showed a linear relation with the glucose concentrations in the range of 0 to 100 μM. The linear fitting equation was A = −0.00537 C(glucose, μM) + 0.91888 with R = 0.9959, and the limit of detection was calculated to be 12.8 μM at a signal-to-noise ratio of 3. It indicated MnO2 nanosheets could be utilized as a quantitative and sensitive measuring substrate for glucose detection.
Correspondingly, we could also observe directly the color changes due to different concentrations of glucose. As shown in Figure 4C, the colors of the detection solutions gradually became lighter with the increase of glucose concentration, and the color differentiation of each sample was obvious. It further demonstrated that this method could achieve the colorimetric detection of glucose concentrations.
Several common interferences were tested to evaluate the specificity of the proposed colorimetric detection. Herein, the dispersion of MnO2 nanosheets in the testing condition was diluted to make the absorbance value to be around 0.63, and the UV-vis absorbance of the method toward interference was obtained under the same experimental condition for each other, as shown in Figure 5. Ascribed to their reducibility, GSH and Cys could reduce MnO2 nanosheets, resulting in decreasing absorbance. However, when NEM was added, which can selectively consume the thiol group-containing materials, MnO2 nanosheets could stabilize by means of resisting the reduction of GSH or Cys. It indicated that NEM could be used to treat the complex samples containing thiol group to eliminate the possible interference. In the system containing maltose, fructose or amino acids, the absorbance of the testing conditions were almost equal to that of pure MnO2 nanosheets, indicating that these common interferents would not affect the determination of glucose. Furthermore, the close absorbance for glucose with or without NEM suggested that NEM had negligible effect for the determination of glucose. Thus, the above result suggested the excellent reliability and selectivity of this method for glucose.
3.5. Application of Visual Detection in Human Serum Samples
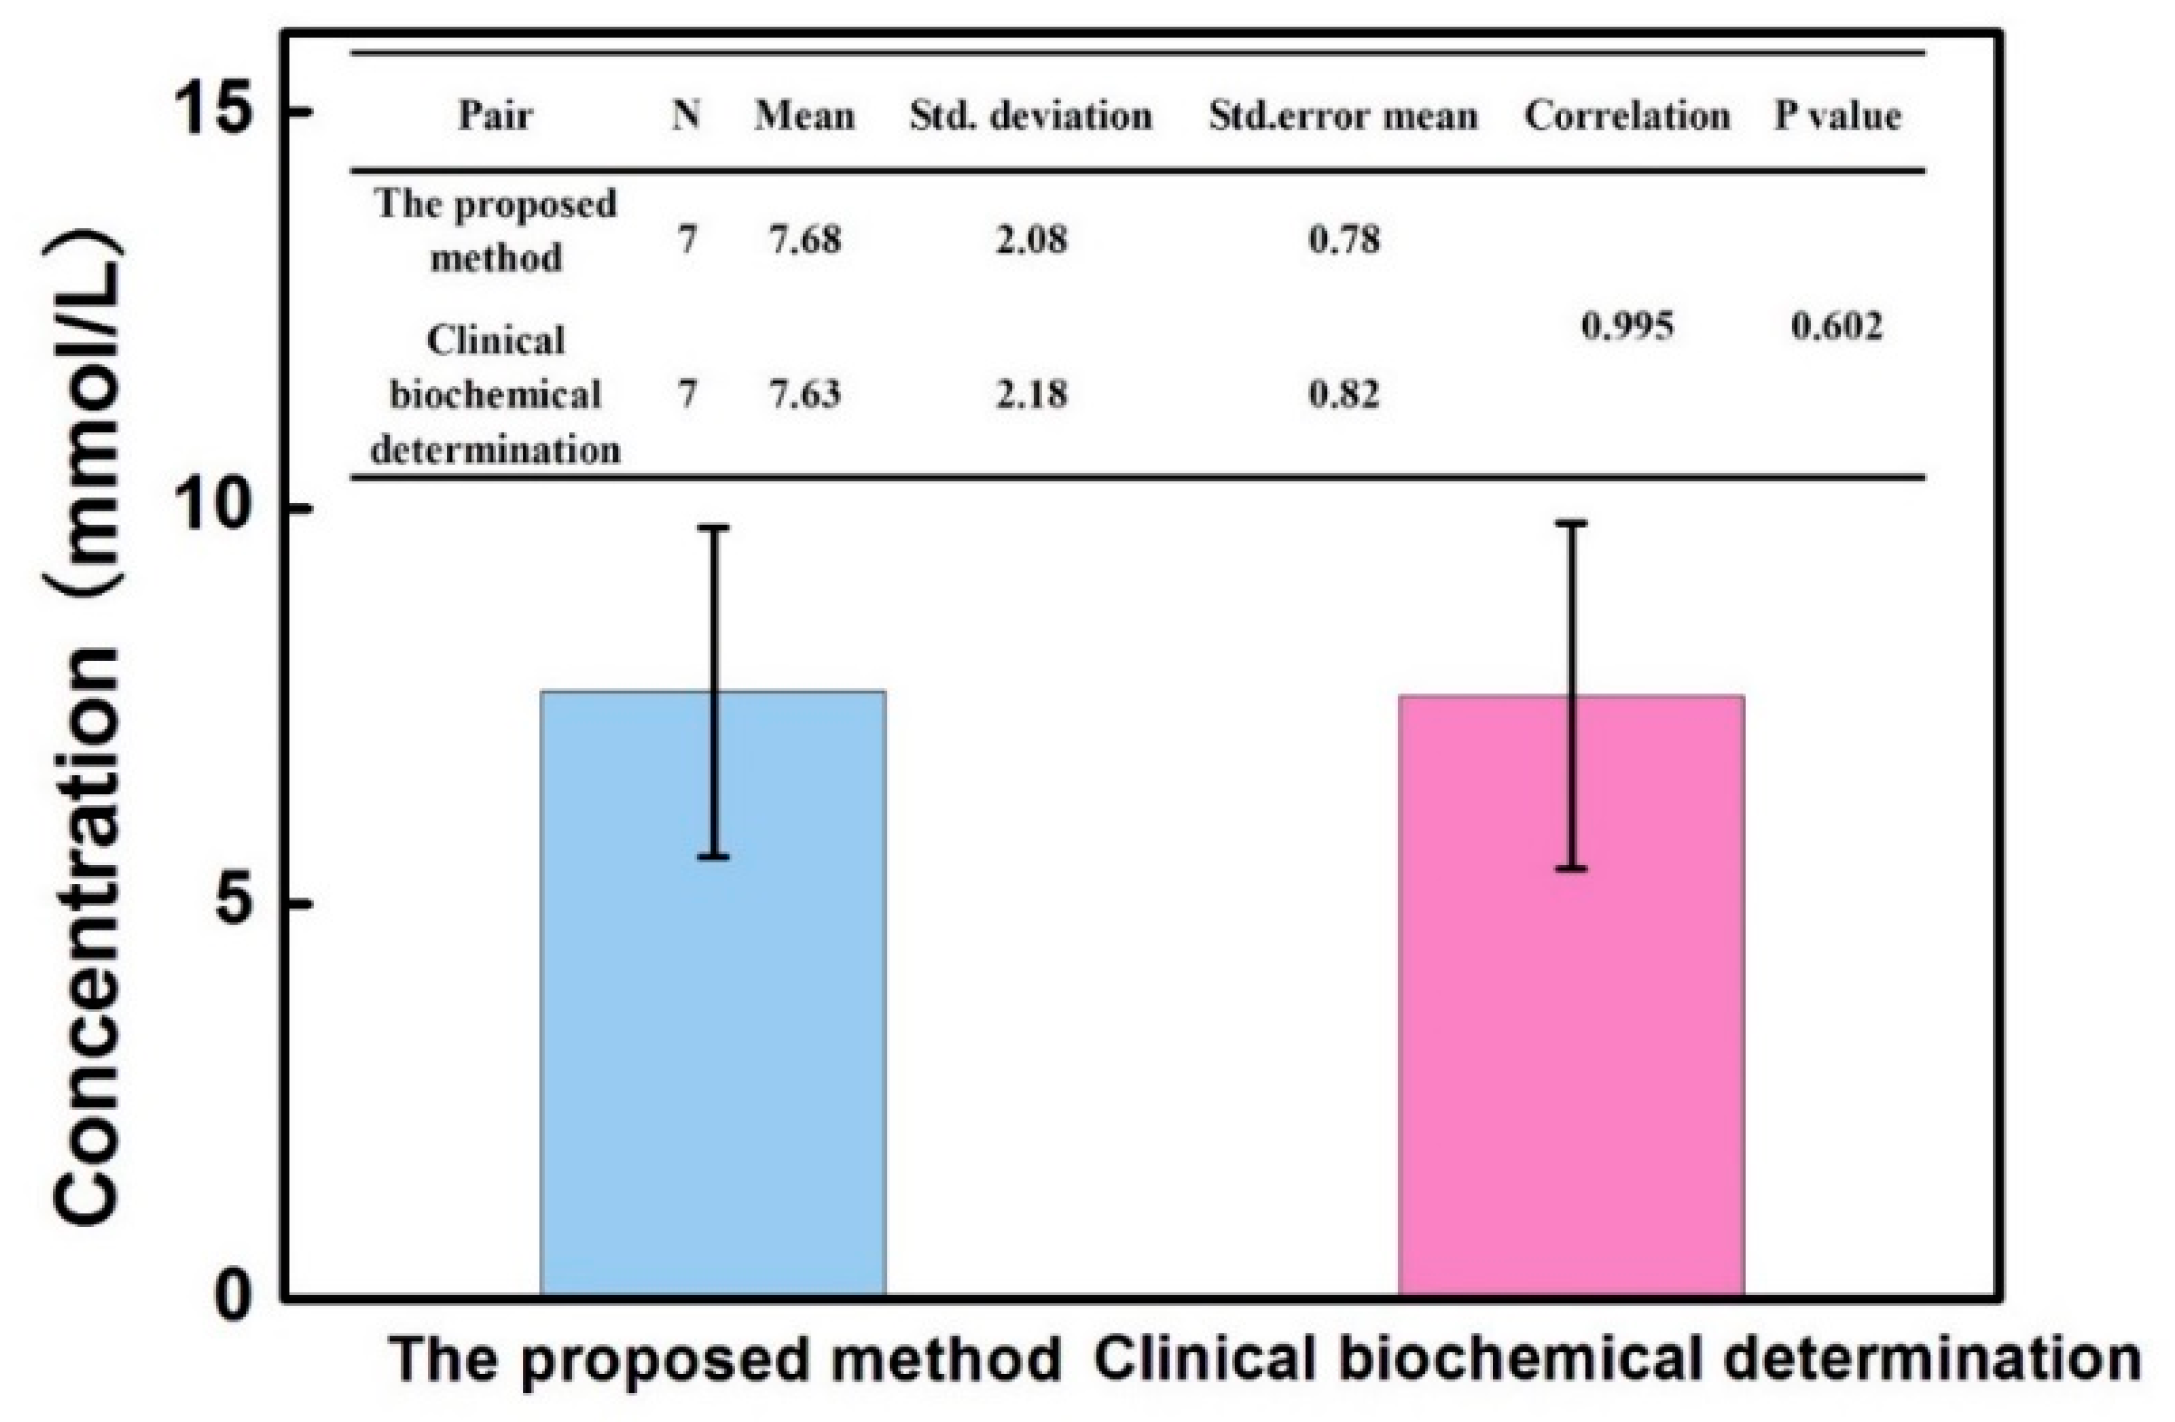
The feasibility of the proposed colorimetric assay for possible clinical application was investigated by analyzing seven serum samples obtained from a local hospital. Taking into consideration the blood glucose level in healthy people and the analytical performance of this method, the obtained serum was diluted 100 fold with MES buffer for the detection. NEM was added into the diluted serum to eliminate the possible interfering effect from GSH and other thiol-substances. The collection and use of clinical serums obtained from anonymous participants were approved by the ethics committee of Fujian Medical University. As shown in Table 1, the test results of each sample with low RSDs were obtained using the current method. Compared with the established clinical biochemical determination, the absolute values of the relative errors of each other were lower than 6%. Furthermore, statistical analysis of the detecting results from this method and the clinical biochemical method was operated to prove the real practicability of the proposed method based on MnO2 nanosheets. The two methods correlated well with a correlation coefficient of 0.995, as shown in Figure 6; the P-value of the paired t-test was 0.602 (no significant difference). The real application result suggested the excellent accuracy and feasibility of the proposed method based on MnO2 nanosheets as simple and effective signals for colorimetric detection of blood glucose.
4. Conclusions
In this work, we designed and prepared MnO2 nanosheets through a convenient and economical route. After maximizing the UV-vis absorption properties of MnO2 nanosheets, we developed an effective method for the visual detection of glucose levels. Furthermore, the proposed assay, which was used to test the clinical serum samples, exhibited accuracy, suggesting the feasibility of the assay in future real applications. In brief, this study suggested an effective strategy for visual signals based on MnO2 nanosheets that can be used to assess glucose levels.
Author Contributions
S.W. and Z.H. proposed the main idea and finished the draft manuscript. L.Z. conceived the experiments. F.F. and Y.C. carried out the experiments. Z.W. drew the figures and tables. Z.L. and X.L. participated in the writing of the manuscript. S.W. and Z.H. analyzed the data and revised the manuscript.
Acknowledgments
This work was supported from the National Science Foundation of Fujian Province (2017J01532), the Elite Culti-vation Program of Health and Family Planning of Fujian Province (2017-ZQN-61), the Education and Scientific Research Project of young and middle-aged teachers in Fujian Province of China (JAT160198), the Sailing Research Fund of Fujian Medical University (2016QH013, 2017XQ1054).
Conflicts of Interest
The authors declare no conflict of interest.
References
- Hu, Y.; Cheng, H.; Zhao, X.; Wu, J.; Muhammad, F.; Lin, S.; He, J.; Zhou, L.; Zhang, C.; Deng, Y.; et al. Surface-Enhanced Raman Scattering Active Gold Nanoparticles with Enzyme-Mimicking Activities for Measuring Glucose and Lactate in Living Tissues. ACS Nano 2017, 11, 5558–5566. [Google Scholar] [CrossRef] [PubMed]
- Yu, D.; Wang, P.; Zhao, Y.; Fan, A. Iodophenol blue-enhanced luminol chemiluminescence and its application to hydrogen peroxide and glucose detection. Talanta 2016, 146, 655–661. [Google Scholar] [CrossRef] [PubMed]
- Tierney, M.; Kim, H.; Burns, M.; Tamada, J.; Potts, R. Electroanalysis of Glucose in Transcutaneously Extracted Samples. Electroanalysis 2015, 12, 666–671. [Google Scholar] [CrossRef]
- Liu, L.; Ma, Q.; Li, Y.; Liu, Z.; Su, X. A novel signal-off electrochemiluminescence biosensor for the determination of glucose based on double nanoparticles. Biosens. Bioelectron. 2015, 63, 519–524. [Google Scholar] [CrossRef] [PubMed]
- Yuan, J.; Cen, Y.; Kong, X.; Wu, S.; Liu, C.; Yu, R.; Chu, X. MnO2-Nanosheet-Modified Upconversion Nanosystem for Sensitive Turn-On Fluorescence Detection of H2O2 and Glucose in Blood. ACS Appl. Mater. Interfaces 2015, 7, 10548–10555. [Google Scholar] [CrossRef] [PubMed]
- Muhr, V.; Buchnera, M.; Hirsch, T.; Jovanović, D.; Dolić, S.; Dramićanin, M.; Wolfbeis, O. Europium-doped GdVO4 nanocrystals as a luminescent probe for hydrogen peroxide and for enzymatic sensing of glucose. Sens. Actuators B Chem. 2017, 241, 349–356. [Google Scholar] [CrossRef]
- Chang, Q.; Tang, H. Optical determination of glucose and hydrogen peroxide using a nanocomposite prepared from glucose oxidase and magnetite nanoparticles immobilized on graphene oxide. Microchim. Acta 2014, 181, 527–534. [Google Scholar] [CrossRef]
- Mu, J.; He, Y.; Wang, Y. Copper-incorporated SBA-15 with peroxidase-like activity and its application for colorimetric detection of glucose in human serum. Talanta 2016, 148, 22–28. [Google Scholar] [CrossRef] [PubMed]
- Xiong, Y.; Zhang, Y.; Rong, P.; Yang, J.; Wang, W.; Liu, D. A high-throughput colorimetric assay for glucose detection based on glucose oxidase-catalyzed enlargement of gold nanoparticles. Nanoscale 2015, 7, 15584–15588. [Google Scholar] [CrossRef] [PubMed]
- Cai, S.; Han, Q.; Qi, C.; Lian, Z.; Jia, X.; Yang, R.; Wang, C. Pt74Ag26 nanoparticle-decorated ultrathin MoS2 nanosheets as novel peroxidase mimics for highly selective colorimetric detection of H2O2 and glucose. Nanoscale 2016, 8, 3685–3693. [Google Scholar] [CrossRef] [PubMed]
- Gabriel, E.; Garcia, P.; Cardoso, T.; Lopes, F.; Martinsa, F.; Coltro, W. Highly sensitive colorimetric detection of glucose and uric acid in biological fluids using chitosan-modified paper microfluidic devices. Analyst 2016, 141, 4749–4756. [Google Scholar] [CrossRef] [PubMed]
- Liu, F.; He, J.; Zeng, M.; Hao, J.; Guo, Q.; Song, Y.; Wang, L. Cu-hemin metal-organic frameworks with peroxidase-like activity as peroxidase mimics for colorimetric sensing of glucose. J. Nanoparticle Res. 2016, 18, 1–9. [Google Scholar] [CrossRef]
- Jin, L.; Meng, Z.; Zhang, Y.; Cai, S.; Zhang, Z.; Li, C.; Shang, L.; Shen, Y. Ultrasmall Pt Nanoclusters as Robust Peroxidase Mimics for Colorimetric Detection of Glucose in Human Serum. ACS Appl. Mater. Interfaces 2017, 9, 10027–10033. [Google Scholar] [CrossRef] [PubMed]
- Xiang, D.; Yin, L.; Ma, J.; Guo, E.; Li, Q.; Li, Z.; Liu, K. Amperometric hydrogen peroxide and glucose biosensor based on NiFe2/ordered mesoporous carbon nanocomposites. Analyst 2015, 140, 644–653. [Google Scholar] [CrossRef] [PubMed]
- Han, L.; Zeng, L.; Wei, M.; Li, C.; Liu, A. V2O3-Ordered Mesoporous Carbon Composite with Novel Peroxidase-Like Activity towards Glucose Colorimetric Assay. Nanoscale 2015, 7, 11678–11685. [Google Scholar] [CrossRef] [PubMed]
- Kim, M.I.; Cho, D.; Park, H.G. Colorimetric Quantification of Glucose and Cholesterol in Human Blood Using a Nanocomposite Entrapping Magnetic Nanoparticles and Oxidases. J. Nanosci. Nanotechnol. 2015, 15, 7955–7961. [Google Scholar] [CrossRef] [PubMed]
- Sies, H. Hydrogen peroxide as a central redox signaling molecule in physiological oxidative stress: Oxidative eustress. Redox Biol. 2017, 11, 613–619. [Google Scholar] [CrossRef] [PubMed]
- Lennicke, C.; Rahn, J.; Lichtenfels, R.; Wessjohann, L.; Seliger, B. Hydrogen peroxide—Production, fate and role in redox signaling of tumor cells. Cell Commun. Signal. 2015, 13, 39. [Google Scholar] [CrossRef] [PubMed]
- Niethammer, P.; Grabher, C.; Look, A.T.; Mitchison, T.J. A tissue-scale gradient of hydrogen peroxide mediates rapid wound detection in zebrafish. Nature 2009, 459, 996–999. [Google Scholar] [CrossRef] [PubMed] [Green Version]
- Satooka, H.; Hara-Chikuma, M. Aquaporin-3 Controls Breast Cancer Cell Migration by Regulating Hydrogen Peroxide Transport and Its Downstream Cell Signaling. Mol. Cell. Biol. 2016, 36, 1206–1218. [Google Scholar] [CrossRef] [PubMed] [Green Version]
- Lux, C.D.G.; Joshi-Barr, S.; Nguyen, T.; Mahmoud, E.; Schopf, E.; Fomina, N.; Almutairi, A. Biocompatible Polymeric Nanoparticles Degrade and Release Cargo in Response to Biologically Relevant Levels of Hydrogen Peroxide. J. Am. Chem. Soc. 2012, 134, 15758–15764. [Google Scholar] [CrossRef] [Green Version]
- Mizutani, F.; Ohta, E.; Mie, Y.; Niwa, O.; Yasukawa, T. Enzyme immunoassay of insulin at picomolar levels based on the coulometric determination of hydrogen peroxide. Sens. Actuators B Chem. 2009, 135, 304–308. [Google Scholar] [CrossRef]
- Zhou, J.; Gu, J.; Tian, C.; Jiang, D.; Chen, Y.; Xi, K. Co3O4-cored carbon dots for chemiluminescence analysis of intracellular hydrogen peroxide. RSC Adv. 2016, 6, 39480–39483. [Google Scholar] [CrossRef]
- Ling, Y.; Zhang, N.; Qu, F.; Wen, T.; Gao, Z.; Li, N.; Luo, H. Fluorescent detection of hydrogen peroxide and glucose with polyethyleneimine-templated Cu nanoclusters. Spectrochim. Acta Part A Mol. Biomol. Spectrosc. 2014, 118, 315–320. [Google Scholar] [CrossRef] [PubMed]
- Rau, J.E.; Fischer, U. In-gel detection of L-amino acid oxidases based on the visualisation of hydrogen peroxide production. J. Microbiol. Methods 2011, 85, 228–229. [Google Scholar] [CrossRef] [PubMed]
- Kim, M.C.; Kwak, J.; Lee, S.Y. Sensing of Uric Acid via Cascade Catalysis of Uricase and a Biomimetic Catalyst. Sens. Actuators B Chem. 2016, 232, 744–749. [Google Scholar] [CrossRef]
- Zhang, Z.; Zhang, X.; Liu, B.; Liu, J. Molecular Imprinting on Inorganic Nanozymes for Hundred-fold Enzyme Specificity. J. Am. Chem. Soc. 2017, 139, 5412–5419. [Google Scholar] [CrossRef] [PubMed]
- Liu, B.; Han, X.; Liu, J. Iron oxide nanozyme catalyzed synthesis of fluorescent polydopamine for light-up Zn2+ detection. Nanoscale 2016, 8, 13620–13626. [Google Scholar] [CrossRef] [PubMed]
- Liu, B.; Sun, Z.; Huang, P.; Liu, J. Hydrogen Peroxide Displacing DNA from Nanoceria: Mechanism and Detection of Glucose in Serum. J. Am. Chem. Soc. 2015, 137, 1290–1295. [Google Scholar] [CrossRef] [PubMed]
- Lei, J.; Lu, X.; Wang, W.; Bian, X.; Xue, Y.; Wang, C.; Li, L. Fabrication of MnO2/graphene oxide composite nanosheets and their application in hydrazine detection. RSC Adv. 2012, 2, 2541–2544. [Google Scholar] [CrossRef]
- Liu, Z.; Cai, X.; Lin, X.; Zheng, Y.; Wu, Y.; Chen, P.; Weng, S.; Lin, L.; Lin, X. Signal-on fluorescent sensor based on GQDs–MnO2 composite for glutathione. Anal. Methods 2016, 8, 2366–2374. [Google Scholar] [CrossRef]
- Zheng, L.; Yu, H. Manganese dioxide nanosheets as an optical probe for photometric determination of free chlorine. Microchim. Acta 2016, 183, 2229–2234. [Google Scholar] [CrossRef]
- Huang, Z.; Yang, J.; Zhang, L.; Geng, X.; Ge, J.; Hu, Y.; Li, Z. A novel one-step colorimetric assay for highly sensitive detection of glucose in serum based on MnO2 nanosheets. Anal. Methods 2017, 9, 4275–4281. [Google Scholar] [CrossRef]
- Zhao, Z.; Fan, H.; Zhou, G.; Bai, H.; Liang, H.; Wang, R.; Zhang, X.; Tan, W. Activatable fluorescence/mri bimodal platform for tumor cell imaging via MnO2 nanosheet-aptamer nanoprobe. J. Am. Chem. Soc. 2014, 136, 11220–11223. [Google Scholar] [CrossRef] [PubMed]
- Zhao, G.; Li, J.; Ren, X.; Hu, J.; Hu, W.; Wang, X. Highly active MnO2 nanosheet synthesis from graphene oxide templates and their application in efficient oxidative degradation of methylene blue. RSC Adv. 2013, 3, 12909–12914. [Google Scholar] [CrossRef]
- Deng, R.; Xie, X.; Vendrell, M.; Chang, Y.; Liu, X. Intracellular Glutathione Detection Using MnO2-Nanosheet-Modified Upconversion Nanoparticles. J. Am. Chem. Soc. 2011, 133, 20168–20171. [Google Scholar] [CrossRef] [PubMed]
- Li, L.; Li, R.; Gai, S.; Ding, S.; He, F.; Zhang, M.; Yang, P. MnO2 Nanosheets Grown on Nitrogen-Doped Hollow Carbon Shells as a High-Performance Electrode for Asymmetric Supercapacitors. Chemistry 2015, 21, 7119–7126. [Google Scholar] [CrossRef] [PubMed]
- Yang, Y.; Yuan, W.; Li, S.; Yang, X.; Xu, J.; Jiang, Y. Manganese dioxide nanoparticle enrichment in porous conducting polymer as high performance supercapacitor electrode materials. Electrochim. Acta 2015, 165, 323–329. [Google Scholar] [CrossRef]
Scheme 1.
Schematic illustration of the detection for H2O2 and glucose based on MnO2 nanosheets as the visual signals.
Scheme 1.
Schematic illustration of the detection for H2O2 and glucose based on MnO2 nanosheets as the visual signals.
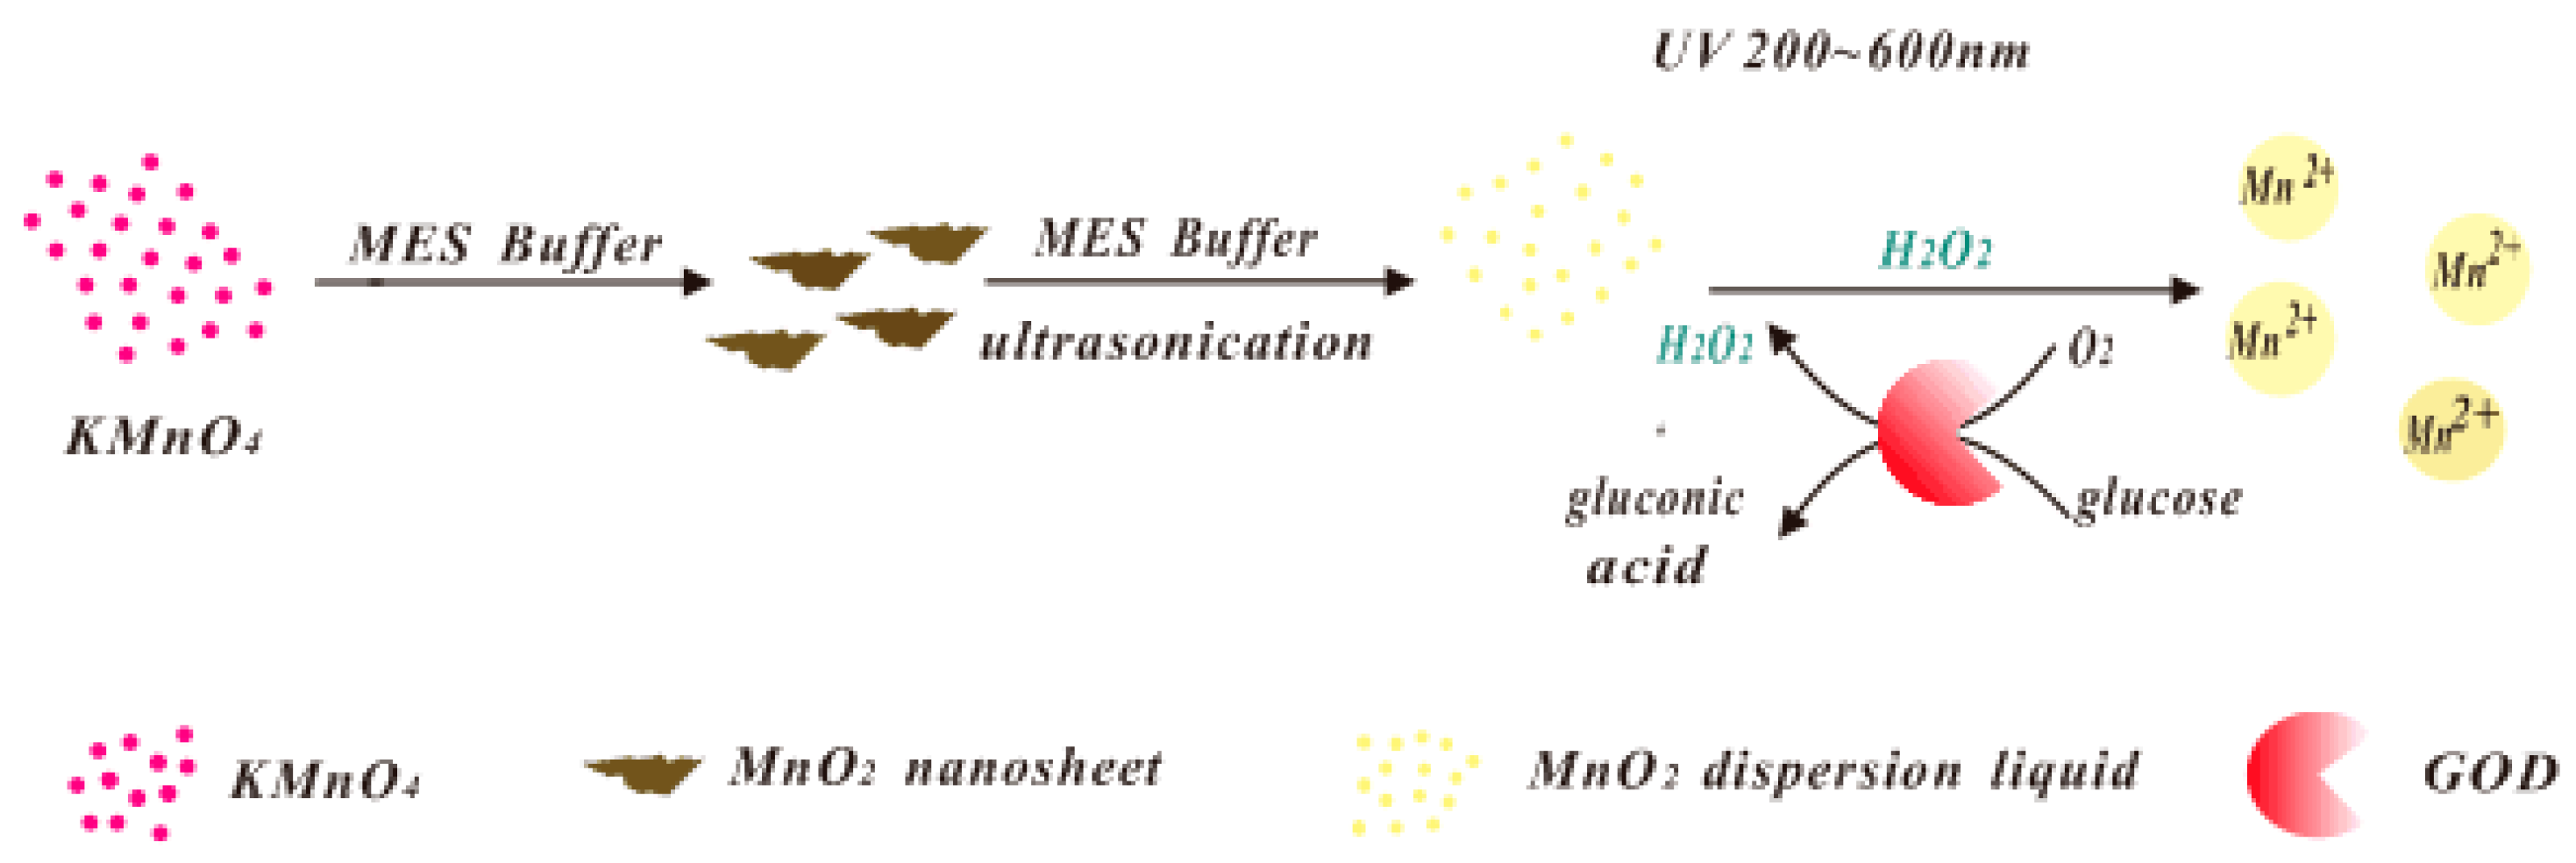
Figure 1.
TEM image (A), EDS (B), FTIR spectrum (C) and UV-vis spectrum (D) of MnO2 nanosheets. Inset of (A,D) showed the HRTEM of MnO2 nanosheets (A) and dispersion pictures of MnO2 nanosheets of three parallel operations (D), respectively.
Figure 1.
TEM image (A), EDS (B), FTIR spectrum (C) and UV-vis spectrum (D) of MnO2 nanosheets. Inset of (A,D) showed the HRTEM of MnO2 nanosheets (A) and dispersion pictures of MnO2 nanosheets of three parallel operations (D), respectively.

Figure 2.
UV-vis spectra of MnO2 nanosheets after reacting different concentrations of H2O2 (A). Visualization (B) and UV-vis spectra (C) of the verification of generatedMn2+ from MnO2 nanosheets after reacting different concentrations of glucose through GOD using the oxidization by periodate. The control solution shown in (B,C) was simple KMnO4 solution (0.3 mM).

Figure 3.
Effects of pH of the assay on detecting 50 μM glucose (A), and effects of the concentration of GOD on detecting 0.2 mM glucose (B) at 346 nm. Note: Error bars represented the SDs from three independent detections.
Figure 3.
Effects of pH of the assay on detecting 50 μM glucose (A), and effects of the concentration of GOD on detecting 0.2 mM glucose (B) at 346 nm. Note: Error bars represented the SDs from three independent detections.
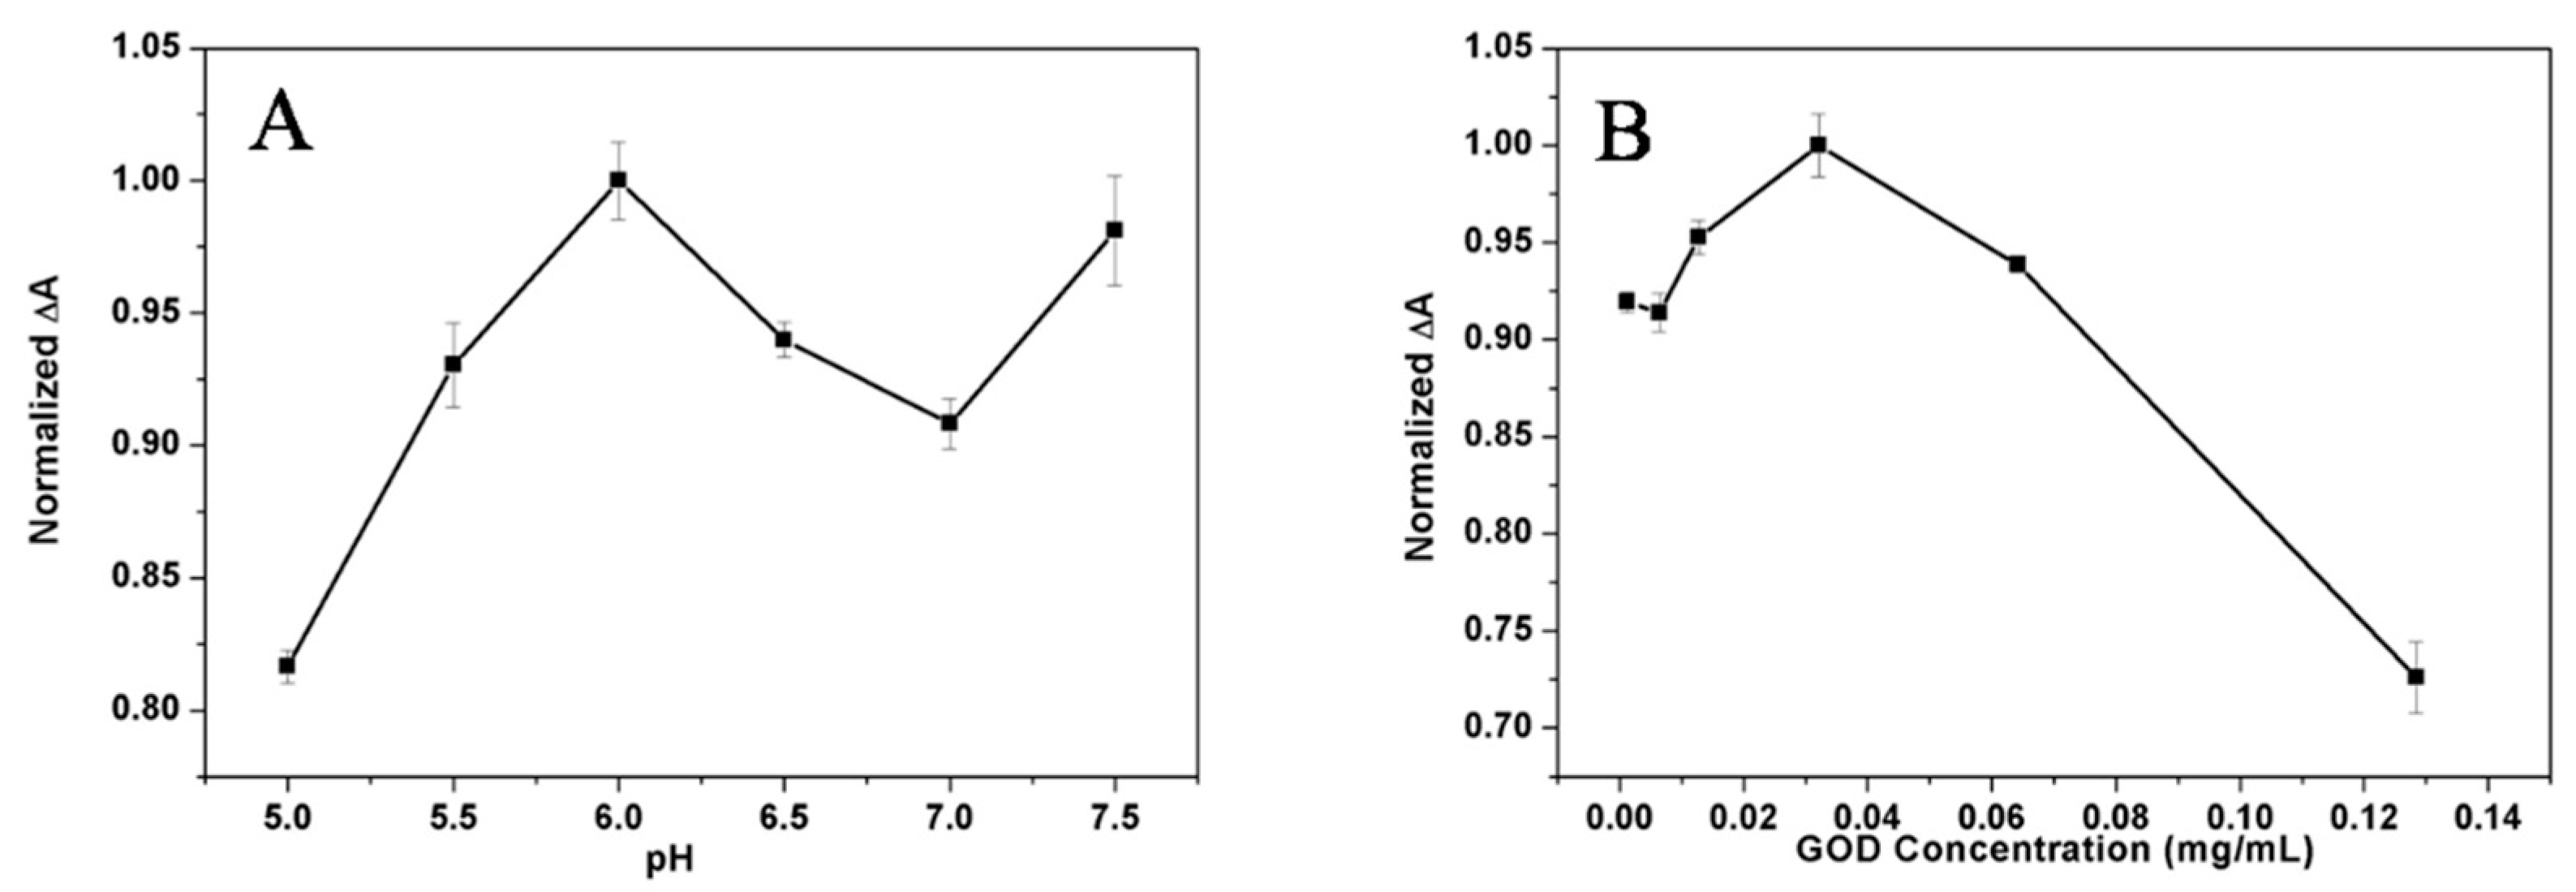
Figure 4.
UV-vis spectra of the detection of different concentrations (0, 5, 50, and 100 μM) of glucose (A), the linear relationship between the absorbance at 346 nm and glucose concentrations (B), and the visual detection of variable glucose (C). Error bars in (B) represented the SDs from three independent detections.

Figure 5.
Comparision of the specificity of this method for the detection of 50 μM glucose towards several common interferences of maltose, fructose and metal ions (500 μM), and BSA, HSA (1%) and GSH, Cys (50 μM). Note: Error bars represented the SDs from three independent detections.
Figure 5.
Comparision of the specificity of this method for the detection of 50 μM glucose towards several common interferences of maltose, fructose and metal ions (500 μM), and BSA, HSA (1%) and GSH, Cys (50 μM). Note: Error bars represented the SDs from three independent detections.
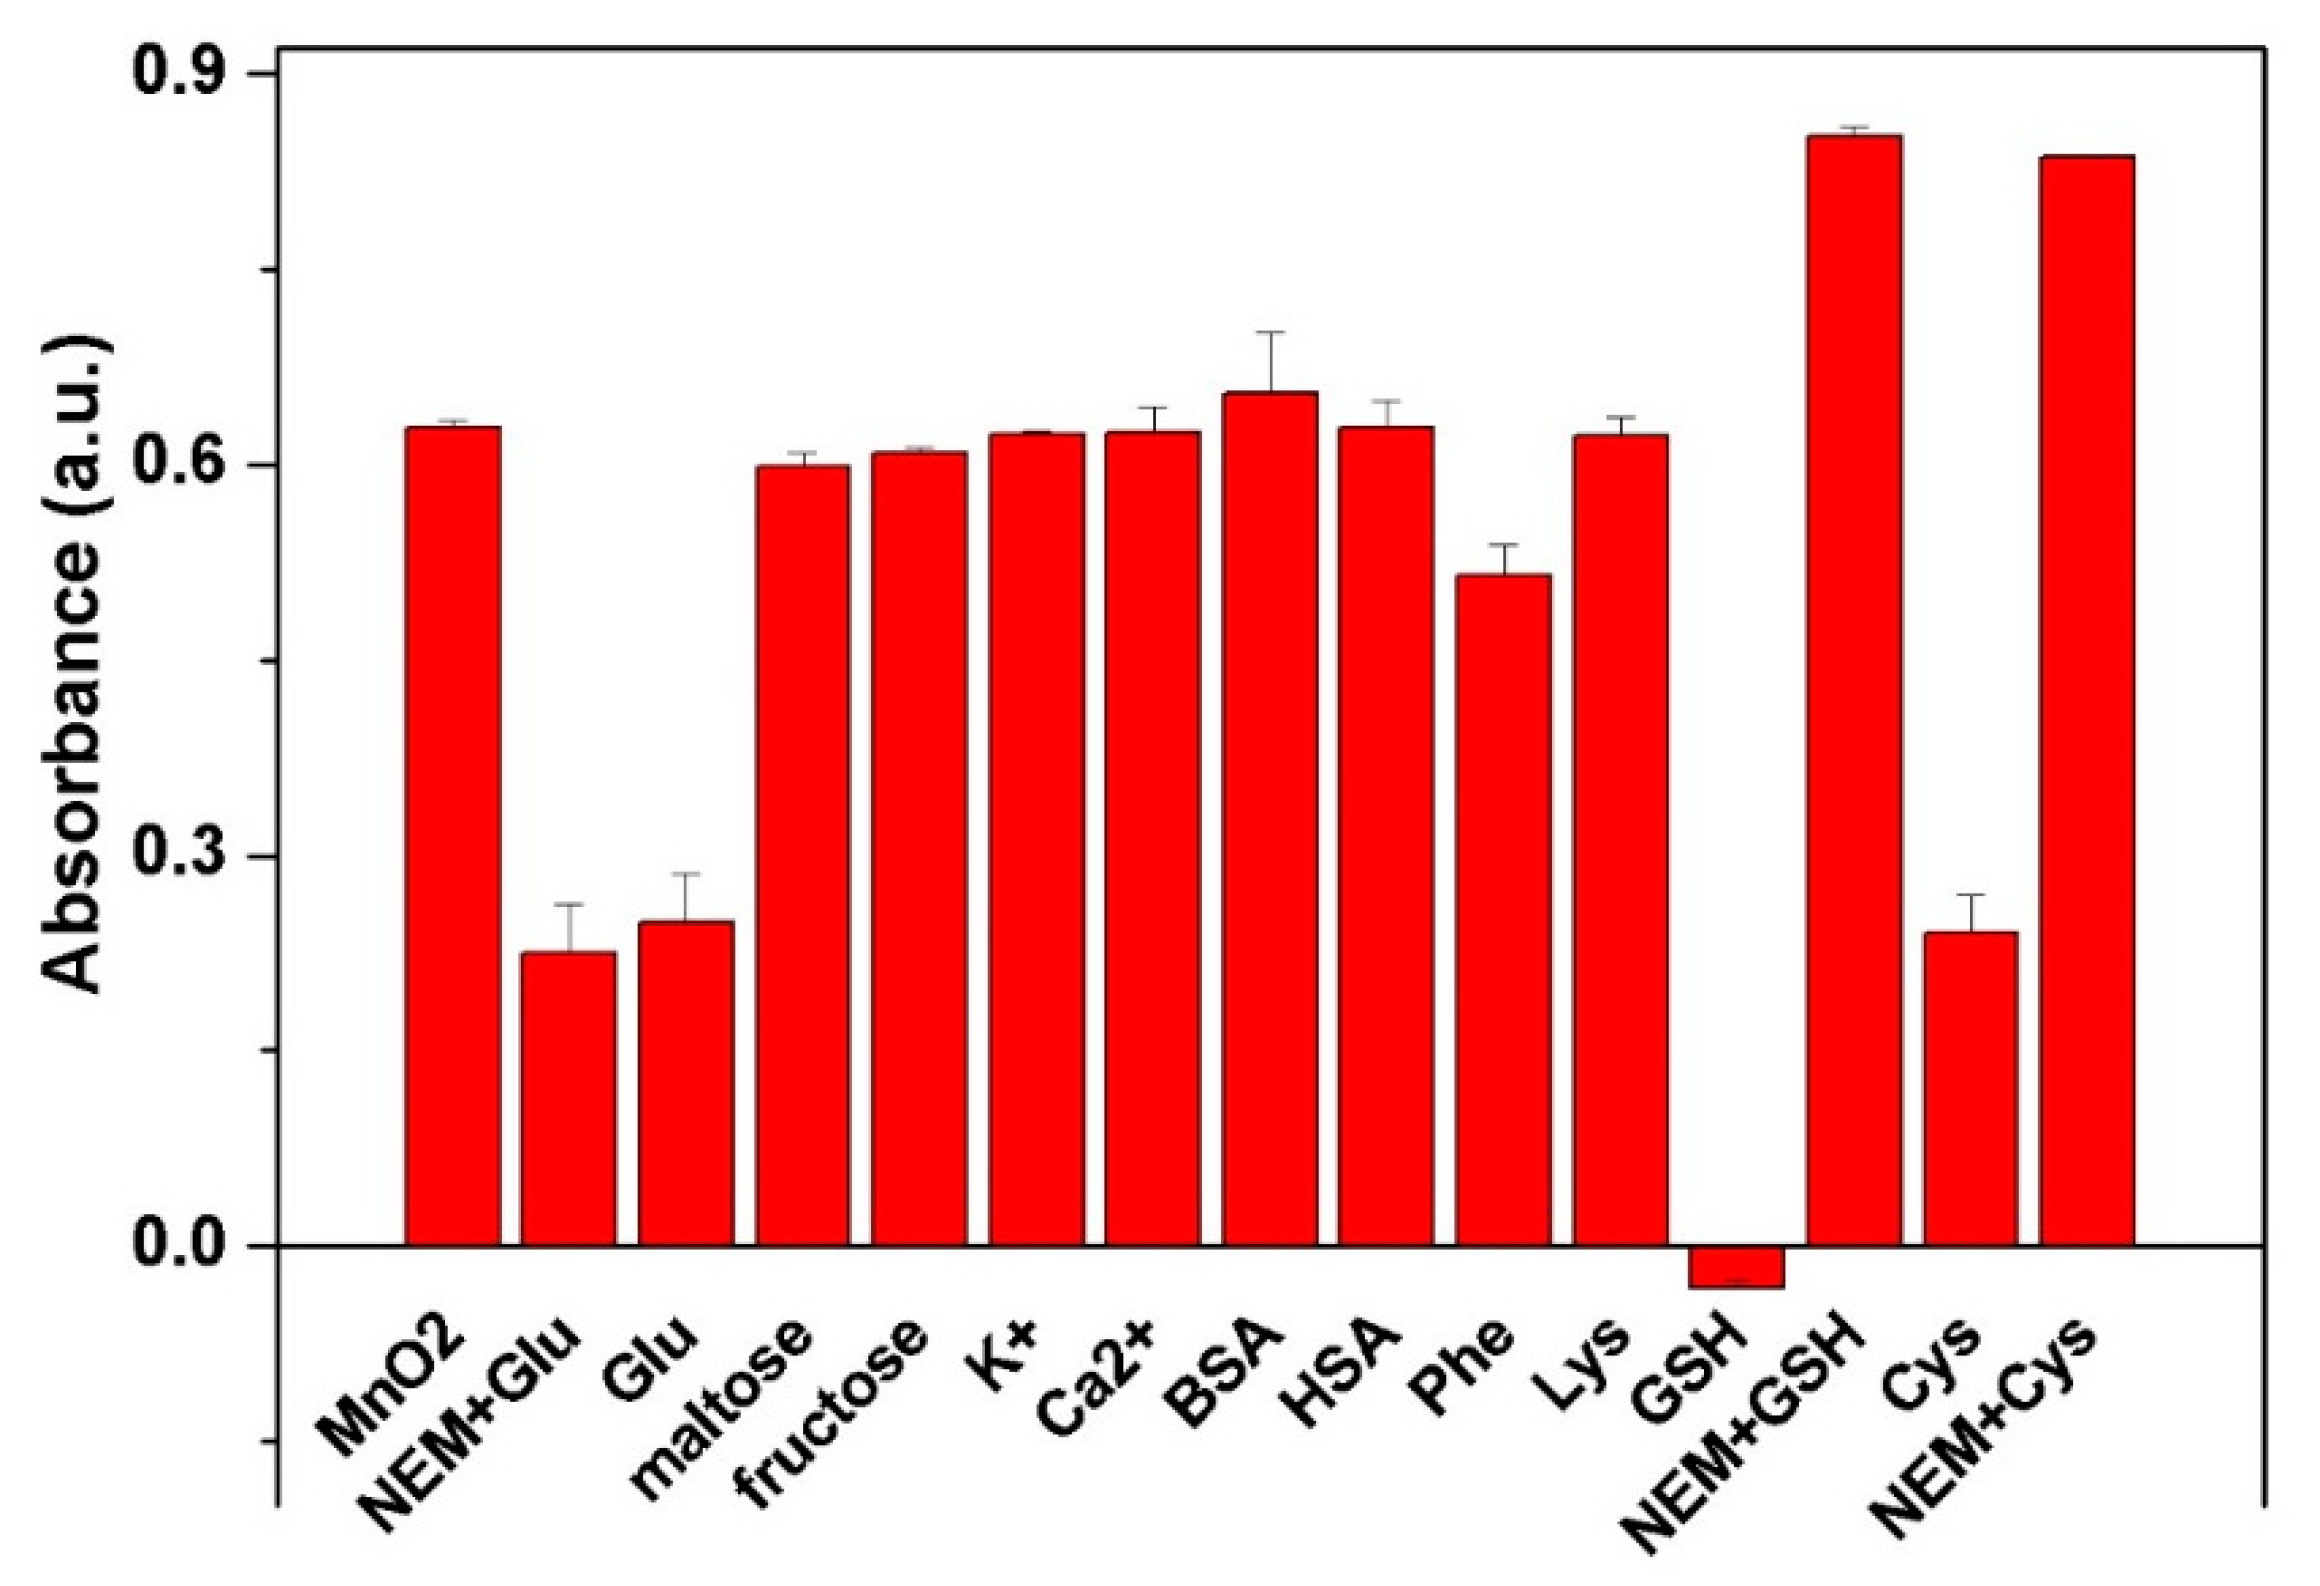
Figure 6.
Statistics, correlation and the paired t-test of the proposed method and clinical biochemical determination. Error bars showed the varied concentration of glucose in different clinical samples.
Figure 6.
Statistics, correlation and the paired t-test of the proposed method and clinical biochemical determination. Error bars showed the varied concentration of glucose in different clinical samples.

Table 1.
Comparison of test results of the proposed method with clinical biochemical determination.
| Samples | Found by the Proposed Method (mmol/L) | RSD (%) (n = 3) | Found by Clinical Biochemical Determination (mmol/L) | Relative Errors (%) |
|---|---|---|---|---|
| 1 | 5.64 | 8.1 | 5.52 | 2.17 |
| 2 | 4.58 | 4.3 | 4.52 | 0.88 |
| 3 | 8.68 | 2.0 | 8.99 | 3.34 |
| 4 | 9.72 | 1.4 | 9.98 | −2.61 |
| 5 | 9.74 | 1.4 | 10.03 | −2.19 |
| 6 | 6.91 | 1.5 | 6.52 | 5.37 |
| 7 | 7.87 | 3.1 | 7.86 | 0.13 |
© 2018 by the authors. Licensee MDPI, Basel, Switzerland. This article is an open access article distributed under the terms and conditions of the Creative Commons Attribution (CC BY) license (http://creativecommons.org/licenses/by/4.0/).
Share and Cite
MDPI and ACS Style
Huang, Z.; Zheng, L.; Feng, F.; Chen, Y.; Wang, Z.; Lin, Z.; Lin, X.; Weng, S. A Simple and Effective Colorimetric Assay for Glucose Based on MnO2 Nanosheets. Sensors 2018, 18, 2525. https://doi.org/10.3390/s18082525
AMA Style
Huang Z, Zheng L, Feng F, Chen Y, Wang Z, Lin Z, Lin X, Weng S. A Simple and Effective Colorimetric Assay for Glucose Based on MnO2 Nanosheets. Sensors. 2018; 18(8):2525. https://doi.org/10.3390/s18082525
Chicago/Turabian StyleHuang, Zhengjun, Linlin Zheng, Feng Feng, Yuyuan Chen, Zhenzhen Wang, Zhen Lin, Xinhua Lin, and Shaohuang Weng. 2018. "A Simple and Effective Colorimetric Assay for Glucose Based on MnO2 Nanosheets" Sensors 18, no. 8: 2525. https://doi.org/10.3390/s18082525
Note that from the first issue of 2016, this journal uses article numbers instead of page numbers. See further details here.