Paper-Based Sensors: Emerging Themes and Applications
by
Amrita Tribhuwan Singh
1,2, 
Darlin Lantigua
2,3,
Akhil Meka
1,2,
Shainlee Taing
1,2,
Manjot Pandher
2,3 and
Gulden Camci-Unal
2,* 1
Department of Biological Sciences, University of Massachusetts Lowell, One University Avenue, Lowell, MA 01854, USA
2
Department of Chemical Engineering, University of Massachusetts Lowell, One University Avenue, Lowell, MA 01854, USA
3
Biomedical Engineering and Biotechnology Program, University of Massachusetts Lowell, One University Avenue, Lowell, MA 01854, USA
*
Author to whom correspondence should be addressed.
Sensors 2018, 18(9), 2838; https://doi.org/10.3390/s18092838
Submission received: 10 July 2018
/
Revised: 21 August 2018
/
Accepted: 23 August 2018
/
Published: 28 August 2018
(This article belongs to the Special Issue Paper-Based Sensors)
Abstract
:Paper is a versatile, flexible, porous, and eco-friendly substrate that is utilized in the fabrication of low-cost devices and biosensors for rapid detection of analytes of interest. Paper-based sensors provide affordable platforms for simple, accurate, and rapid detection of diseases, in addition to monitoring food quality, environmental and sun exposure, and detection of pathogens. Paper-based devices provide an inexpensive technology for fabrication of simple and portable diagnostic systems that can be immensely useful in resource-limited settings, such as in developing countries or austere environments, where fully-equipped facilities and highly trained medical staff are absent. In this work, we present the different types of paper that are currently utilized in fabrication of paper-based sensors, and common fabrication techniques ranging from wax printing to origami- and kirigami-based approaches. In addition, we present different detection techniques that are employed in paper-based sensors such as colorimetric, electrochemical, and fluorescence detection, chemiluminescence, and electrochemiluminescence, as well as their applications including disease diagnostics, cell cultures, monitoring sun exposure, and analysis of environmental reagents including pollutants. Furthermore, main advantages and disadvantages of different types of paper and future trends for paper-based sensors are discussed.
1. Introduction
Rapid, simple, accurate, and low-cost detection of analytes such as biomarkers and environmental reagents is an important need in biochemical research. For example, methods currently utilized in immunological assays (e.g., enzyme-linked immunosorbent assay (ELISA)) for the detection of biomarkers in bodily fluids (e.g., blood, urine, serum) provide sensitive and reliable results. Similarly, spectrophotometric methods and conventional ELISA used to quantitatively analyze environmental reagents (e.g., heavy metal ions in industrial wastewater) also yield consistent and accurate results. However, the sophisticated and long procedures, requirement of highly trained personnel to execute the experiments and evaluate the results, and the need for large amounts of reagents and samples prevent the use of these analytical tools in resource-poor environments [1]. Therefore, there is an unmet need for development of simple and low-cost detection systems to provide unskilled users with the ability to easily detect analytes and evaluate results in resource-limited settings. Applications of paper-based biosensors include diagnosis of diseases, monitoring health conditions, environmental agents or sun exposure, detection of pathogens (e.g., bacteria, fungi) [2], and controlling water and food safety and quality [3,4,5].
Paper-based microfluidic approaches enable the fabrication of low-cost, simple, flexible, and portable diagnostic platforms [6]. This simple technology uses paper as a substrate to create microfluidic channels by patterning hydrophobic materials on hydrophilic paper [7]. To test a biological substance (e.g., blood, urine, saliva, sweat, tear) or an environmental reagent (e.g., heavy metal ion, hydrogen sulfide gas) that contains an analyte of interest, the sample is applied to the device and wicked to a detection zone by capillary action without the need to use an external pump [8,9]. Analyte detection from the sample is facilitated by a chemical reaction which induces a change in color, electrochemical properties and light absorption or emission. Among these methods, the most frequently used detection approach is based on colorimetric change. In this method, results can be simply evaluated by formation of a color product generated by ligand-analyte binding (e.g., antibody-antigen) which can be quantified using low-cost benchtop scanners, single-lens reflex cameras, or cellphones [10]. The main advantages of paper include (i) high surface to volume ratio; (ii) adsorption properties; (iii) capillary action; (iv) compatibility with biological samples; (v) chemical functional groups for immobilization of proteins and antibodies, and vi) straightforward sterilization [11,12]. Paper also allows for easy disposal via incineration. Furthermore, the ability to store and transport reagents within the paper matrix eliminates the need for users to handle chemical solutions. In addition, paper is lightweight and accessible globally [13]. Finally, paper-based microfluidic devices can be easily fabricated at a low-cost using practical fabrication techniques such as wax printing [14].
Paper-based dipstick assays, lateral flow, and vertical flow immunoassays are routinely performed for rapid detection of target analytes [15]. Simple dipstick techniques were initially utilized to quantify the glucose in urine in 1956 [16]. Although the dipstick technique was convenient and easy to interpret, its main drawbacks included long analysis times and inaccuracy. Therefore, in 1980s several lateral flow devices were developed to achieve better performance parameters. These devices were mainly used for pregnancy tests [17]. Over time, lateral flow assays became standard platforms for other applications including screening blood coagulation [18], detection of pesticides in beverage and food sample [19] and detection of pathogens (e.g., Pseudomonas aeruginosa, Staphylococcus aureus) [20]. In the lateral flow configuration, fluid is drawn towards a sample detection zone horizontally, whereas fluid flow is directed vertically in the vertical flow immunoassays. Although the direction of fluid flow is the most apparent difference between these two assay formats, vertical flow provides detection more rapidly (as short as 5 min) with a higher detection sensitivity in nanograms per mL. Moreover, Hook’s effect (a phenomenon that is caused by the presence of excess amount of antibodies preventing agglutination), which can lead to inaccurate results in lateral flow assays, is also eliminated in the vertical flow configuration [21]. Thus, more recent studies use vertical flow assays for detection of analytes. For example, Rivas et al. fabricated a paper-based vertical-flow device to analyze microarrays of DNA for detection of N. meningitidis [22].
Despite the promising applications of paper-based devices and sensors, there are some limitations regarding sensitivity, accuracy, and detection of multiple analytes at the same time. Recently, paper-based sensors have been fabricated via patterning to address these drawbacks. In addition to the colorimetric techniques, other detection approaches such as chemiluminescence, electrochemiluminescence, fluorescence, and electrochemistry have been employed for monitoring analytes. These analytical approaches have been implemented in paper-based microfluidic platforms; however, these techniques also exhibit disadvantages associated with cost, simplicity, and sensitivity [23].
In this review, we present different types of paper used in the fabrication of biosensors and the current fabrication techniques ranging from wax printing to origami- and kirigami-inspired approaches (Figure 1) which present unique advantages in detection of analytes. In addition, we introduce different detection mechanisms used by paper-based sensors and their applications in various fields ranging from medical diagnostics to analysis of environmental pollutants, sensing analytes in cell cultures, and for monitoring sun exposure. Lastly, we conclude by discussing the potential future applications of paper-based sensors. Overall, we systematically cover the most recent developments and new applications of paper-based sensors. The examples included in this paper demonstrate that inexpensive and portable paper-based sensors have the ability to monitor and detect analytes at low concentrations (up to fM). These devices are useful not only in fully equipped research institutions but also in resource-limited environments.
2. Paper Types
There are different types of paper employed in paper-based sensors depending on the fabrication method and the application of the sensor. The most extensively used material is Whatman brand chromatography paper due to its superior wicking ability [24,25,26,27]. This particular type of paper has medium retention and flow rate owing to its thickness (180 μm) and pore size (11 μm). Other types of paper such as the Whatman filter paper No. 4, was used due to its larger pore size of 20–25 μm and higher retention rate [28]. More recently, filter paper has been used in paper-based sensors [24,25,26], which is also manufactured by Whatman (Maidstone, United Kingdom). This type of paper has been used for its relatively uniform thickness and wicking properties as well as superior adsorption and retention of reagents compared to the similar types of paper [25].
Because different physical and/or chemical characteristics may be required for biosensors, other categories of paper have been explored depending on the target application. Nitrocellulose membranes have been used due to their chemical functional groups that enable covalent immobilization of biomolecules. Nitrocellulose allows for charge-charge interactions, weak hydrogen bonds, and van der Waals interactions with protein-based substrates [27,29]. As a result of their high protein-binding abilities, these membranes are commonly used in ELISA and gold nanoparticle-based assays [30]. These membranes have also been used because they prevent diffusion and leaching of samples through the membrane, which allows for a higher degree of retention and subsequently a longer reaction time within the sensor [28]. Nitrocellulose membranes are smooth and have a uniform pore size of 0.45 μm. These membranes can be modified via wax printing that is followed by heating [28], however wax penetration through the nitrocellulose membrane is slow when compared to that of the filter paper.
In addition to these paper types, bioactive paper has also been used in biosensors. In the bioactive paper, the paper matrix is modified with biomolecules. Without modification, only cationic molecules adsorb onto the wet cellulose fibers that make up paper. In addition, while proteins are adsorbed on cellulose, the rate and extent of this process has not been effective when compared to other hydrophilic surface [31]; thus, the cellulose fibers must be modified in a way that allows them to absorb biomolecules. This can be done first by activating the surface of the paper (e.g., aldehyde, amide) and then covalently conjugating biomolecules. Furthermore, a bioactive paper-based device was produced via piezoelectric inkjet printing of enzymes within biocompatible sol-gel silica layers, which were supported by paper [32]. It has also been shown that the graft copolymerization of glycidal methacrylate onto cellulose filter paper has allowed for the immobilization of biomolecules, which allowed for dot ELISA and gold nanoparticle based tests [33].
Glossy paper has also been studied as a viable option for paper-based sensors. Glossy paper is composed of cellulose fibers and inorganic fillers that are blended into the paper matrix. Arena et al. used glossy paper in order to develop a flexible paper-based sensing device for detection of ethanol [34]. This specific type of paper is used in lieu of filter paper as it is easier to alter the surface properties of the glossy paper.
Different types of common paper have also been successfully used in the production of paper-based sensors. Conventional printing paper was selected for use in a wearable device, intended to be foldable and flexible [35]. The paper was subject to wax printing and then carbon black ink was spread along the surface of the paper. In addition, paper towel has been utilized as a surface for printing of carbon black-modified electrodes [36]. Paper towel has also been used as wicking layer for a biosensor produced from filter paper [37]. Paper towel is cheaper than filter paper and possesses a high porosity, which makes it a viable material for analysis of a wide range of analytes.
3. Fabrication and Printing
The fabrication method that is used to produce the biosensors can impact the simplicity and their applications. There are numerous approaches available that involve chemical modification or physical deposition onto the paper, both of which alter the material characteristics of the cellulose matrix. The approaches that will be covered in this review are wax printing, photolithography, inkjet printing, laser cutting, polydimethyl-siloxane (PDMS), hot embossing, hydrophobic silanization, and the use of origami- and kirigami-based approaches. Several advantages and disadvantages of each procedure are listed in Table 1.
3.1. Wax Printing
Wax printing can be used to create microfluidic channels for paper-based sensors. This procedure is widely used due to its simplicity, non-toxicity, and low cost compared to the other techniques. In one study, wax printing was performed for fabrication of paper-based microfluidic devices due to the low cost of wax printers [38]. The wax patterns are directly printed on the paper, which are then used to control the flow of the fluid that includes the samples and the reagents. Dungchai et al. wax patterned chromatography paper and subsequently melted the wax using a hot plate in three dimensions (3D) of the paper in order to form hydrophobic barriers. Namwong et al. used a home hair dryer to melt the wax into the paper [39]. In another study, wax microstructures were printed on a nitrocellulose membrane, and then baked to enable the printed wax to penetrate the wax and create hydrophobic channels in the device [29]. The fabrication process took only 10 min. However, the use of wax printing is not suitable for high resolution printing and the patterns are not stable at high temperatures as the wax easily melts.
3.2. Photolithography
Photolithography can be used to fabricate paper-based sensors with high resolution, and is a suitable approach for large-scale production. Paper-based microfluidic devices that are capable of detecting multiple biomarkers were generated using photolithography [40]. First, photoresist was poured onto the paper, evenly distributed, and then paper was baked. Afterwards, the paper was covered with a patterned transparent film that was generated with a laser printer and irradiated with UV. Following baking, the unpolymerized photoresist was removed using acetone, and after drying the paper was exposed to air plasma to create hydrophilic areas. This procedure requires the use of expensive processing equipment and involves long and complex steps. In another study, photolithography was utilized to fabricate patterned sensors without the use of air plasma for generation of hydrophilic channels [41]. The group first fabricated the microfluidic channels in a 1:1 mixture of an acryloxy-terminated siloxane polymer and an acrylate based polymer. The solution was then degassed in an ultrasonic bath and slowly pipetted onto paper. Acetone was used to remove the uncrosslinked polymer. This procedure took only 3 min to fabricate the sensor. Ouyang et al. fabricated an electrochromatographic microfluidic paper-based analytical device (μPAD) for detection of multiple metal complexes by using photolithography [42]. Chromatography paper was treated with a thinned photoresist and dried for 1 min. A photomask and the treated paper was combined through exposure of UV light. The combined paper was then washed with acetone. Cathodes were incorporated into the device to allow detection of specifically targeted metal analytes. However, sensors produced using photolithography can be subject to damage when bended or folded.
3.3. Polydimethyl-Siloxane (PDMS) Printing
Printing a solution of PDMS on paper, due to its hydrophobic nature, offers a solution to the inflexibility of sensors that are fabricated by photolithography. A low-cost method was developed for fabricating flexible sensors via PDMS patterning on paper [43]. PDMS-patterned paper allows for the sensor to be bended or folded without damaging the microfluidic channels. In order to fabricate sensor patterns with this method, PDMS along with hexanes in a 3:1 (PDMS:hexanes) ratio, was loaded into a plotter and printed onto the paper. PDMS has many advantages over photolithography: it costs less than SU-8 photoresist, does not require UV light to crosslink, cures rapidly, and requires no post printing steps. However, the plotter must be modified with custom printer cartridges in order to load the PDMS, which yields a low resolution during printing. Gervais and Delamarche captured antibodies by patterning PDMS substrates using stencils under a humidity chamber to prevent evaporation of reagents [44]. The device was washed with purified water, PBS solution, ethanol, and O2 plasma and dried under a stream of N2. Shangguan et al. fabricated a PDMS on paper device by integrating two layers of PDMS—a channel layer and a patterned layer [45]. The base precursor and the curing agent in a 10:1 (w/w) ratio were used to prepare PDMS. PDMS was then poured over a stencil to generate patterns. The patterned layer and channel layer were combined to produce microfluidic channels. The PDMS polymer was cured by heating.
3.4. Inkjet Printing
Inkjet printing has allowed researchers to streamline the fabrication process by only relying on the use of inkjet printing equipment without the need for additional instrumentation. Inkjet printing became popular due to its non-contact operation and reduced cross-contamination between samples and reagents. Typically, commercially available printers are used with or without modification to print biomolecules for sensors. For example, a Canon inkjet printer and ink cartridges were modified for fabrication of paper-based microfluidic devices [46]. In another work, a thermal inkjet printing method was used to print proteins and enzymes on paper chips. Similarly, Gaspar et al. used inkjet printing to create silver interdigitated electrodes on the surface of paper substrates [47]. Ko et al. fabricated an electrochemical sensor by simply utilizing carbon nanotubes as conductive ink and printed electrodes using a commercial office inkjet printer [48]. The use of inkjet printing has allowed groups to rapidly fabricate devices, however, either an expensive bio-ink printer or a modified inkjet printer is necessary.
3.5. Laser Cutting
Laser cutting is used as a simple and inexpensive way to produce patterns on paper-based devices. Chitnis et al. used a CO2 laser cutter to create hydrophilic patterns on paper, which was modified with a hydrophobic coating [49]. This group was able to convert hydrophobic regions that are present on the surface and in the interior of the paper into hydrophilic regions by laser cutting. This process resulted in generation of carbonyl and hydroxyl groups at the paper surface. It is important to optimize the cutting parameters so that the laser cutter does not cut through the paper completely. Spicar-Mihalic et al. also used a commercial CO2 laser to easily cut through backed and unbacked nitrocellulose membrane, glass fibers, and Mylar-based substrates [50]. The laser was also used to pattern chromatography paper. Mahmud et al. reported that laser cutting produces small-scale channels in μPADs, allowing a small amount of sample to flow through [51]. They used different types of paper including nitrocellulose, filter, and chromatography paper, and an adhesive film to pair the aluminum foil and paper together. A CO2 laser was used to produce barriers by stripping the hydrophilic material in the paper. Although laser cutting is a simple method, it requires the use of specialized equipment such as laser cutter or engraver, 2D graphics production software, and double-sided adhesive for assembly of the paper devices.
3.6. Hot Embossing
The use of hot embossing for fabrication of paper-based sensors yields hydrophilic channels that are hollow, which allows for spontaneous capillary flow. This method is efficient, as the roll-to-roll process of hot embossing allows for high throughput due to low cycle times. A microfluidic device was fabricated by embossing PowerCoat® HD paper (Boulogne-Billancourt, Paris, France) coated with a layer of rubber for water-resistance and poly(vinyl alcohol) for hydrophilicity [52]. Embossing was performed with an Eitre Nano Imprint Lithography device, in which the embossing chamber was heated up, and pressure was applied to the device for 60 s. The chamber was then cooled and the pressure was set back to atmospheric levels. The device was able to detect glucose in 12 min. Kim et al. introduced two methods in production of μPADs by slightly or completely infusing parafilm to the device, in which resulted in laminated paper (slightly infused) or infused paper (completely infused) [53]. Thermally pressing parafilm into the paper caused it to bond together. The laminated paper was formed by hot-pressing at 45 °C for 3 min, while the infused paper was pressed for longer at a higher temperature. Patterns were then constructed by irradiation using a CO2 laser engraver. Yu et al. had a similar design utilizing parafilm for paper-based devices [54]. Although their techniques differed by bonding, parafilm and the paper were pressed between aluminum foils and glass slides, where it was then heated in an oven at 120 °C for 2–5 min. Afterward, the device was irradiated by a UV lamp. Although the use of hot embossing can be efficient, it requires the use of specialized equipment.
3.7. Hydrophobic Silanization
Silanization is the process of covering the surface of a substrate with alkoxysilane molecules. Yang et al. have shown that silanizing paper with trichloromethylsilane enables the formation of hydrophobic substrates [55]. The process is simple, low-cost, and rapidly executed. A filter paper sheet was silanized by soaking it in 2.0% trimethoxy(octadecyl)silane and then heating it for an hour. Afterwards, the hydrophobic paper was aligned onto a paper mask, printed with a readily available laser printer. The mask was saturated with sodium hydroxide (NaOH), turning masked regions hydrophilic via wet etching. Using this device, a glucose assay for artificial urine was carried out, which provided promising detection results. An alternative glucose assay was developed using trimethoxyoctadecylsilane (TMOS) as a hydrophobic reagent instead of silanizing the filter paper [56]. The paper substrate was soaked in TOS solution in n-hexane for 10 s and dried for 1 min afterwards. Microchannels were printed onto the hydrophilic substrate using a mask. Both paper and mask were compressed between two glass slides for 5 min and was readily available for use. This process is cost-effective as it did not involve expensive equipment and can be immediately fabricated within 7 min.
3.8. Origami and Kirigami
The use of origami (folding of paper) [57] and kirigami (cutting of paper) [26] techniques during the fabrication of microfluidic devices has given researchers new opportunities for fabricating their devices (Figure 2). The principles of origami were used to create a unique device in which two zones are separated by a crease [57]. One zone is the detection zone and the other is the enzyme immobilization zone. In this work, the researchers designed a paper-based analytical device to electrochemically detect glucose using an origami-inspired device [58].
Electrodes in the detection zone were drawn by a pencil and an electron transfer mediator (ferrocenecarboxylic acid) was incorporated to catalytically oxidize glucose. The immobilization zone contained a circle of hydrophobic barriers. The two zones were combined by folding along the crease allowing the electrodes to meet with the reaction mixture. Lin et al. produced a highly stretchable paper-based photodetector array by printing ZnO nanowires and carbon electrodes on printing paper [59]. This was achieved by the Miura origami folding technique. One of the benefits of the origami-based method is the ability to reuse the device without degradation. These approaches are favorable due to their simplicity, reliability, and affordability. In addition to origami, kirigami was also employed for fabrication of 2D and 3D vertical flow paper-based devices [26]. Specifically, kiragami was used to achieve duplicate patterns using only one series of cuts, in which paper was folded, cut, and then unfolded. The main fabrication techniques for paper-based sensors is provided in Table 2.
4. Detection Techniques
Different techniques such as colorimetric assays, chemiluminescence, electrochemiluminescence, electrochemical, and fluorescence based techniques can be employed in paper-based sensors to detect the presence of an analyte of interest [60]. These techniques have been extensively used since they provide highly sensitive results rapidly compared to traditional techniques such as the ELISA.
4.1. Colorimetric Techniques
Colorimetric assays include methods utilized to detect the presence and concentration of an analyte by evaluating the color formation or color change via i) direct imaging using a single-lens reflex (SLR) camera, mobile devices, or low-cost desktop scanners in combination with software such as MATLAB for quantification [25], or ii) traditional spectrophotometers by measuring the absorbance of the sample at specific wavelengths. This detection technique is the most commonly used one as it provides accurate results at a lower cost. Color formation or color change can be induced by using enzymes, ELISA-based immunoassays, or gold nanoparticles (Figure 3).
4.1.1. Enzymatic Techniques
Enzymatic detection is achieved by a reaction between an enzyme and a specific substrate forming an enzyme-substrate complex, which produces a color change [4,6,12,16,17,58]. Martinez et al. detected proteins and glucose in artificial urine samples in a paper device, which was fabricated via photolithography [62]. They studied the oxidation of glucose to gluconic acid and formation of hydrogen peroxide in the presence of the glucose oxidase enzyme. Hydrogen peroxide was reduced by horseradish peroxidase (HRP) oxidizing iodide to iodine, which resulted in the formation of a brown color. Simultaneously, proteins were detected using tetra-bromophenol blue (TBP), which electrostatically interacted with proteins to change their color from yellow to blue. In another report, detection of active ingredients of antibiotics of β-lactams was studied by a competitive enzymatic assay using nitrocefin [63]. A color change from yellow to red indicated presence of antibiotics.
4.1.2. ELISA-based Immunoassays
An immunoassay demonstrates the interaction between an antigen and an antibody that is specific to a particular antigen. Conventional ELISA requires large volume of reagents, long procedures, and tedious washing steps. The paper-based ELISA approach is advantageous due to the superior adsorbent properties of paper, significantly smaller volume (1–5 µL) of sample requirement, and rapid blocking step [64]. In one study, rabbit IgG was immobilized on paper and blocked using bovine serum albumin (BSA). Alkaline phosphatase (ALP)-conjugated IgG antibody was then added to bind the rabbit IgG [65]. Yellow colored substrate 5-bromo-4-chloro-3-indolyl phosphate/nitro blue tetrazolium (BCIP/NBT) was placed on the sample zone to form a conjugate which subsequently produced a purple precipitate. A desktop scanner was used to scan the colorimetric result, which was then quantified using the NIH ImageJ software (Bethesda, MD, USA).
4.1.3. Gold Nanoparticles
Gold nanoparticles (GNPs) are typically used to label secondary antibodies as detection components in immunoassays. A color formation takes place due to aggregation of gold nanoparticles based on their specific interactions with the analyte (e.g., antigen) of interest. Imaging software can be used to quantify the color information in which the pixel values correlate with analyte concentrations. In a research study by Tsai et al. tuberculosis was diagnosed using gold nanoparticle-tagged antibodies [66]. The changes in the aggregation properties of gold nanoparticles were quantified using the surface plasmon resonance (SPR) effect. This technique utilizes plasmons, which are a quantum wave produced by a large number of electrons when disturbed from their equilibrium. This technique was utilized to study the effect of a single-stranded DNA hybridized with a target causing aggregation. The colorimetric change was quantified using a mobile device and yielded a detection limit of 1.95 × 10⁻² ng/mL. GNP sensors have various merits such as biological compatibility and high surface area for affinity reactions. However, GNPs might leak from the paper membranes upon washing. To address this issue, Li et al. used chitosan to stabilize the GNPs [67]. The paper-based sensor was coated with TiO2 to indicate that GNPs were leaching out. Ferreira et al. demonstrated the use of silver nanoparticles (AgNPs) for quantification of ascorbic acid (AA) using paper-based sensors [68]. Ascorbic acid was detected by a color change from light yellow to grey upon reacting with AgNPs that were impregnated in the device. The color change was imaged by a desktop scanner or a custom made scanner that measures the transmittance of light, and color intensity was quantified in the test regions.
4.2. Chemiluminescence
Chemiluminescence involves the detection of light generated from a chemical reaction, when reactive intermediate molecules generate an emission upon returning to ground state from their excited state. Chemiluminescent detection of uric acid was performed via an enzymatic reaction that produced hydrogen peroxide as a by-product while decomposing the substrate [69]. Hydrogen peroxide then reacted with rhodamine derivatives, which were added to the microfluidic channels of the sensor. Luminescence was observed after injecting luminol and iodophenol using a computerized RFL-200 detector (Xi’an Yima Opto-Electrical Technology Co., Ltd., Xi’an, Shaanxi, China), producing a signal with the peak height representing its concentration. Chemiluminescence is considered one of the simplest detection techniques because it does not rely heavily on sophisticated instruments. In addition, chemiluminescence is one of the most precise and sensitive detection technique [70]. However, it requires a high concentration of enzymes, which might block the porous structure of paper and can possibly reduce the overall efficiency of detection.
4.3. Electrochemistry
Electrochemical sensors consist of three electrodes: a working electrode, a reference electrode, and a counter electrode [5,35,71,72,73,74]. The sample is detected when the working electrode and the counter electrode makes a connection with the electrolytic solution to provide current to the sample on the working electrode [71,72,75,76]. These electrodes can easily be screen printed on chromatography paper using carbon ink and silver/silver chloride (Ag/AgCl) ink [73,74,77,78]. Recent developments utilize graphite pencils as an alternative source for fabrication of electrodes [79]. High concentrations of metals in the body, such as lead and cadmium, can lead to tumor formation, therefore, their detection is critical for evaluating different health conditions. Such heavy metal concentrations can be accurately detected using electrochemical approaches. This technique has been used for detection of cancer biomarkers, for which tumor cells were tagged with gold nanoparticles [78].
In additon to amperometric devices, the presence and quantity of analytes can also be measured potentiometrically [71,80]. Furthermore, conductomeric sensors can measure the capability of an analyte to produce a current between electrodes. These types of electrochemical devices have been used for detection via enzymatic reactions. The conductance of a solution changes following an enzymatic reaction making it possible to correlate the amount of the analyte with conductance [80].
Paper-based electrochemical sensors were also utilized for multiplexed detection of glucose, lactate, and uric acid [81]. For detection of these analytes, corresponding enzymes and electron-transfer mediators were stored in test zones to react with the analytes and produce electrical signals. The carbon electrodes were connected with screen-printed silver strips which served as contact pads for electrical interfacing with the metal clips of the potentiostat. The limit of detection (LOD) for this device was found to be 0.35 mM for glucose, 1.76 mM for lactate and 0.52 mM for uric acid.
4.4. Fluorescence
Fluorescence-based techniques involve the detection of luminescence from fluorophores, resulting from interactions with the sample molecule. A fluorometry device is used in order to quantify the luminescence [82]. Petruci et al. built a paper device using the principles of fluorescence which detected a toxic compound, hydrogen sulfide (H2S) [83]. It consisted of a light emitting diode (LED) and a spectrometer, and a paper-based device with fluorescein mercury acetate (FMA) infused on the surface. The reaction between H2S and FMA was recorded at 470 nm wavelength. The response time of the device was within 60 s and the limit of detection of H2S was found to be 3 parts per billion (ppb). Fluorescent dyes are biocompatible, however, they must be monitored regularly as they can undergo photobleaching, which causes the loss of their fluorescence intensity.
4.5. Electrochemiluminescence (ECL)
Luminescence is produced as a result of electrochemical reactions in the electrochemiluminescence (ECL) technique [84]. A reagent that can produce luminescence is oxidized at the working electrode (usually screen-printed carbon) with triethylamine (TEA) or hydrogen peroxide obtained by reduction of the sample. This reaction produces photons resulting in a luminescent color change. An image evaluation software (e.g., Python, NIH Image J) can be employed to study the pixel intensity for each color, indicating the concentrations of the analyte. In a study conducted by Mani et al., it was demonstrated that ruthenium polyvinylpyridine (RuPVP), an electrochemical luminophore, was activated via oxidation, resulting in luminescence observed using a charged coupled device camera [85].
5. Applications of Paper-Based Sensors for Medical Diagnostics
Microfluidic paper-based analytical devices reduce high costs and allow for rapid diagnosis of diseases in resource-deprived settings. These devices are alternatives to standard laboratory tests and have been extensively studied due to their sensitivity and reliability. Disease diagnostics can be studied using various biological fluids such as blood, urine, sweat, and tears in paper-based microanalytical devices (μPADs) [86,87].
5.1. Detection using Blood Samples
Cellular components of blood interfere with the analysis in diagnostic tests making it essential to separate the plasma portion from the rest of the blood (Figure 4). The most familiar techniques of blood separation include agglutination or centrifugation. To improve these techniques, a paper-based microfluidic device was fabricated to separate plasma from a blood sample and evaluated the separation efficiency with a colorimetric assay [88].
The device was fabricated by a wax patterning method and used different blood separation membranes. The device performed remarkably well compared to existing paper-based blood separation devices due to incorporation of two different types of paper that provided a single step separation. This microfluidic device was capable of separating the plasma from a single drop of blood (15 μL–22 μL) which contained the normal human hematocrit content (24%–55%). Albumin from the separated plasma was detected using a bromocresol green (BCG) assay. Plasma was directed to flow in the detection zone where BCG was added, and a color change was observed within 2 min from clear to deep blue. Images of the detection zones were captured using a digital camera and the color intensity was analyzed using Adobe Photoshop CS2 in the “gray scale” mode for quantification of the results.
Similarly, a portable biosensor was fabricated on paper to measure two enzymatic markers of the liver (aspartate aminotransferase (AST) and alkaline phosphatase (ALP)) and total serum proteins (Figure 4) [89]. Blood contains the common markers of liver function, which are absent in urine, making blood a suitable medium for examining the levels of analytes of interest. A healthy liver will yield low concentrations of AST (5–40 U/L) and ALP (30–120 U/L), whereas a damaged liver will release higher concentrations into the bloodstream, which can be monitored using the paper-based device. The onset of liver disease also decreases the total serum protein in the blood, which normally ranges from 60–83 g/L. A multiplexed vertical-flow device was fabricated via wax printing. The microfluidic device enabled the separation of plasma from the red blood cells (RBCs). This biosensor demonstrated formation of a red color for AST, green for serum protein, and blue for ALP. The concentrations in the samples were found as −4000 U/L for AST, ∼26000 U/L for ALP, and ∼50 g/L for protein indicating liver dysfunction.
5.2. Detection using Urine Samples
Diagnosis of kidney disorders is typically conducted using the concentration of creatinine in the urine. Creatinine has a normal concentration range of 2.48–22.92 mM/µL in healthy individuals [90]. Sununta et al. detected creatinine in urine samples using a paper based-sensor [90]. The urine samples, gathered from healthy volunteers, were centrifuged at 5000 rpm for 30 min and diluted 25 folds using distilled water. In the detection zone of a µPAD, alkaline picrate reagent was added, followed by the addition of the diluted creatinine solution in the sample zone, which took 25 min to react and generate a color change. In this reaction, creatinine reacted with picric acid and formed a creatinine-picrate complex. A visible color change from yellow to orange was observed using a camera in a light-controlled box in order to detect the change in color intensity. The color intensity in the image was quantified using NIH ImageJ to determine the concentration of creatinine in the urine sample. Typically, color formation or color change in paper-based sensors is quantified by analyzing the images acquired with a cellphone camera, desktop scanner, or single-lens reflex camera (Figure 5) [91].
Diabetes is a prevalent disease that occurs when blood glucose levels become abnormally high. Urinalysis is a common method employed to detect glucose and protein levels in the body. Paper-based microfluidic devices have been shown to be useful in urinalysis. Quantitative measurements of protein and glucose levels in urine was performed utilizing a paper-based colorimetric assay to diagnose diabetes [92]. When mixed with urine on a µPAD, the sample detection zone changed color from clear to brown, while the protein assay caused a color change from brown to yellow. Adobe Photoshop was employed to quantify the color intensities. The authors analyzed different concentrations of glucose and proteins in synthetic urine to obtain the standard data for internal calibration [93]. Urine tests from healthy and diabetic patients were then evaluated. The results demonstrated that protein and glucose concentrations were in normal ranges for healthy individuals. The glucose levels for patients with diabetes were observed to be over the normal range while the protein levels were in the normal range.
5.3. Detection Using Tear Samples
Human tear contains different molecules ranging from enzymes, proteins, and lipids to electrolytes. Therefore, tear offers immense potential for detection of diseases. In one study, the amount of lactoferrin, which is a glycoprotein in human tear, was detected and quantified (as low as 0.30 mg/mL) from tear samples using an antibody-free paper-based microfluidic device [94]. The lightweight, portable, and inexpensive μPAD provided rapid and accurate results. When lactoferrin formed a complex with terbium chloride hexahydrate, the resulting compound emitted a fluorescence, which was then quantified to determine the concentration of the lactoferrin present in the tear sample. The decreased levels of lactoferrin can possibly indicate presence of diseases, therefore, monitoring the concentration of lactoferrin is a clinical need.
In addition to protein-based molecules, electrolytes can also be analyzed using PADs. In a recent study, quantification of tear electrolytes was performed because they can be indicative of various eye conditions [95]. A device was designed and fabricated to contain channels with a rapid wicking time (3 min). Fluorescent sensors, diaza-15-crown-5 and diaza-18-crown-6, were utilized for selective sensing Na+ and K+ ions. A smartphone application was used to detect the emitted fluorescence and provided a concentration value for the electrolytes.
5.4. Detection Using Sweat Samples
Sweat is another bodily fluid which has been used to diagnose health conditions on paper-based sensors [96]. Hypoglycemia is a condition in which blood glucose levels are lower than normal. It results from the decrease in insulin secretion during or after physical exercise. By measuring glucose levels in patients’ blood after exercise, hypoglycemic episodes may be averted. Cho et al. fabricated a self-powered and wearable flexible device that detects glucose from sweat [97]. The paper-based device is used non-invasively and can easily be disposed. Sweat has previously been shown to be a suitable biofluid for non-obtrusive glucose detection, as the glucose levels in sweat is directly related to glucose levels in blood. Sweat-based glucose detection is useful for monitoring exercise-prompted hypoglycemia, because detection is performed during or right after exercise when there is sufficient amount of sweat to acquire as a sample. In this study, the researchers were able to rapidly estimate blood glucose levels 30 min after the start of exercise.
6. Additional Applications of Paper-Based Sensors
6.1. Detection of Environmental Reagents
Environmental contaminants, pesticides, heavy metals, and toxins are the major components that contribute to water pollution, and are harmful to the environment and human health [98]. Providing access to safe water depends on proper detection of such pollutants in water. Although there are various methods used for water analysis including spectrophotometry and conventional ELISA, assessing the quality of water with these techniques are costly, time-consuming, and require sophisticated instruments and highly-trained personnel [6,99]. Therefore, there is a need for simple, inexpensive, and efficient strategies for analyzing environmental sources including water. One way to determine the presence and amount of water contaminants is through the use of μPADS [100].
Detection of nitrite, ammonia, and heavy metals can be performed through colorimetric and chemical detection [98,99]. A low-cost paper-based-capacitive sensor was developed for identification of chemicals according to their dielectric properties [99]. The capacitive sensor was built by stacking filter paper and aluminum. The aluminum acts as a conductor, in which liquid current flows through a multimeter, where its capacitance can be quantified. By measuring capacitance, the chemical can be identified based on its dielectric constant [99].
Heavy metal ions derived from industrial wastewater are also harmful to ecosystems when their concentrations exceed the standard limit. Feng et al. developed a fluorometric paper-based sensor to monitor heavy metal cations (Hg2+, Co2+, Ag2+, and Zn2+) from wastewater [101]. Similarly, a 3D paper-based vertical assay device was fabricated for colorimetric determination of metal contaminants in water, allowing four tests to be carried out in parallel [102]. The device was comprised of four layers of paper and three layers of tape. A wax printer was used to generate the hydrophobic patterns. Hydrophilic regions were the sample testing zones, which allowed the liquid to flow through. The metal specific chromogenic reagents were stored in each sample zone based on the metal ion that they can detect (Ni2+, Cd3+, Cr4+, Cu2+). A mobile phone camera was used to image the color change and the color intensity was subsequently quantified.
Hydrogen sulfide is a flammable gas and can be dangerous to human health even if it is present in low concentrations in the blood [88,89]. A paper-based sensor that can detect hydrogen sulfide gas at low concentrations was developed [103]. The sensor employed filter paper which included palladium (II) and ethylene glycol in it. Palladium (II) was found to bind to sulfide ligands efficiently, which then formed PdS. A spectrophotometer was used to measure the fluorescence spectra and quantify the results.
6.2. Analysis of Cell Cultures
The development of wax-printed paper-based diagnostic platforms has become increasingly popular to those aiming to grow cells, test drugs, or regenerate tissues [104,105,106,107,108]. For example, a paper-based microfluidic cell culture model was designed to observe cell proliferation in a three-dimensional (3D) microenvironment, in comparison to the standard 2D cell culture in a petri dish [109].
Because paper-based devices are biocompatible and can be conveniently fabricated for cell cultures, they were used to analyze small molecules that were secreted by cells. Seoung et al. monitored cell growth conditions by utilizing PADs for the analysis of glucose and lactate concentrations in a cell culture medium (Figure 6) [91]. The fabricated paper device consisted of three laminated layers, with each sheet being separated by a layer of tape, hydrophobic region, and a branched fluidic channel. A sample flowed through the branched fluidic pattern and reacted with glucose and lactate oxidases, where also a colorless chromophore (horseradish peroxidase) was embedded into the sample analysis zone. As a result, the chromophore converted into a blue color. The concentrations of glucose and lactate were quantified using a smartphone which had a custom-built application that can determine the concentrations in real-time. In addition to analysis of small molecules, PADs can also be used in therapeutic applications for personalized medicine.
Lung cancer is one of the common causes of death in the USA [110]. Radiation therapy is a prevalent treatment used to target carcinogenic cells. Hypoxia occurs when tissues are unable to get sufficient oxygen and, in some cases, would lead to the growth of malignant tumors. Oxygen produces free-radical species that lead to DNA damage depending on the placement of cells, in which the cells can be no more than 150–250 µm away from a capillary. Therefore, it is crucial to monitor cancer cells to prevent them from proliferating after radiation therapy. A personalized cancer treatment approach was developed using PADs to observe the metabolic activity of lung tumor cells in response to ionizing radiation [110]. It was found that decreased levels of oxygen displayed a reduction of proliferation and metabolic activity of the lung tumor cells. The paper-based 3D cell culture system provided a metabolic understanding of how tumor cells would grow after radiotherapy in vivo.
6.3. Monitoring Sun Exposure
UV radiation from sun exposure damages epithelial skin cells, which can have taxing effects on the body, such as melanoma or other forms of skin cancer. Development of paper-based sensors has been helpful in detecting sun exposure without the use of technological devices. The sun exposure sensor works by testing for chemicals that are sensitive to sunlight. The device contains several layers of halogenic compounds that change pH levels after UV exposure. Khiabani et al. combined a photocatalyst (titanium dioxide (TiO2)) and a food dye (brilliant blue FCF) into a single layer paper-based sensor [111]. As UV light penetrated the TiO2 on the film, its color intensity decreased. Discoloration on the film was an indicator of UV exposure. Depending on the ratio of TiO2 to brilliant blue FCF and the thickness of the TiO2 film, the discoloration rate can be adjusted to match different skin types [111]. The sun exposure sensor is cost-effective and practical for all skin types, and can potentially be commercialized.
7. Conclusions
Paper-based sensors represent an emerging approach with applications ranging from disease diagnostics, and detection of environmental agents to monitoring forensic samples. These inexpensive and portable devices have the ability to detect analytes with high sensitivity up to fM. Due to their low fabrication cost, they are not only useful in fully equipped laboratories but also in resource limited settings and austere environments. The paper-based devices present various advantages because they (i) are simple and user-friendly; (ii) are equipment-free (limiting energy expenses because pumps or external apparatus are not required for driving the fluid flow); (iii) are portable; (iv) are easy to dispose of; (v) require only small volumes of analytes (in the microliter range); and (vi) have the ability to detect multiple analytes at the same time (multiplexed analysis). Furthermore, biosensing approaches presented in this review, such as the color change, provides a simple and practical detection, which eliminates the need of highly-trained medical staff to execute and evaluate the results of the diagnostic test.
However, it is important to note that there are still limitations of paper-based sensors that must be addressed before their commercialization. Paper sensors can pose an issue regarding the accuracy and sensitivity of analytes [52]. This drawback must be removed before these sensors can be relied upon for an accurate disease diagnosis. In addition, the efficiency of the production of paper sensors must be improved before mass manufacturing of these devices. Currently, some of these devices require complicated manufacturing procedures [40,41,42] that must be simplified before commercialization. Similarly, the cost of these devices must be lowered in order to truly make an impact in resource-depleted environments.
In addition to the applications of paper-based biosensors for detection and diagnosis of biomarkers related to diabetes, and liver and kidney disorders, the inexpensive and portable POC devices can also serve as a resourceful tool in other areas such as monitoring food quality or in agricultural applications. Paper-based sensors also make it possible to monitor toxins and heavy metals in environmental samples, such as in contaminated water sources. Paper microfluidics has not only made simple diagnostic devices readily available globally, but also became a key enabling technology for biomedical research.
Author Contributions
G.C.-U. conceived of the study; G.C.-U., A.T.S., D.L., A.M., and S.T. wrote, revised, and edited the manuscript.
Funding
This work was partially funded by the University of Massachusetts Lowell start-up funds. D.L. was partially supported by the U.S. Army Medical Research (Defense Health Agency) Award # W81XWH-18-C-003. The views, opinions and/or findings contained in this report are those of the author(s) and should not be construed as an official Department of the Army position, policy or decision unless so designated by other documentation.
Acknowledgments
The authors acknowledge Dr. Baris Unal for commenting on the outline of the manuscript. S.T. and A.M. acknowledge scholarships from the Urban Massachusetts Alliance for Minority Participation (UMLSAMP) program.
Conflicts of Interest
The authors declare no conflict of interest.
References
- Nie, J.; Zhang, Y.; Lin, L.; Zhou, C.; Li, S.; Zhang, L.; Li, J. Low-cost fabrication of paper-based microfluidic devices by one-step plotting. Anal. Chem. 2012, 84, 6331–6335. [Google Scholar] [CrossRef] [PubMed]
- Katis, I.; He, P.; Eason, R.; Sones, C. Bacterial pathogen detection using laser-structured paper-based diagnostic sensors. In Proceedings of the 2017 E-MRS Spring Meeting and Exhibit 2017 E-MRS Spring Meeting and Exhibit, Strasbourg, France, 22–26 May 2017. [Google Scholar]
- Gong, M.M.; Sinton, D. Turning the page: Advancing paper-based microfluidics for broad diagnostic application. Chem. Rev. 2017, 117, 8447–8480. [Google Scholar] [CrossRef] [PubMed]
- Nilghaz, A.; Guan, L.; Tan, W.; Shen, W. Advances of paper-based microfluidics for diagnostics—The original motivation and current status. ACS Sensors 2016, 1, 1382–1393. [Google Scholar] [CrossRef]
- Li, X.; Ballerini, D.R.; Shen, W. A perspective on paper-based microfluidics: Current status and future trends. Biomicrofluidics 2012, 6, 011301. [Google Scholar] [CrossRef] [PubMed] [Green Version]
- Hu, J.; Wang, S.; Wang, L.; Li, F.; Pingguan-Murphy, B.; Lu, T.J.; Xu, F. Advances in paper-based point-of-care diagnostics. Biosens. Bioelectron. 2014, 54, 585–597. [Google Scholar] [CrossRef] [PubMed]
- Costa, M.; Veigas, B.; Jacob, J.; Santos, D.; Gomes, J.; Baptista, P.; Martins, R.; Inácio, J.; Fortunato, E. A low cost, safe, disposable, rapid and self-sustainable paper-based platform for diagnostic testing: Lab-on-paper. Nanotechnology 2014, 25, 094006. [Google Scholar] [CrossRef] [PubMed]
- Warren, A.D.; Kwong, G.A.; Wood, D.K.; Lin, K.Y.; Bhatia, S.N. Point-of-care diagnostics for noncommunicable diseases using synthetic urinary biomarkers and paper microfluidics. PNAS 2014, 111, 3671–3676. [Google Scholar] [CrossRef] [PubMed] [Green Version]
- Grau, G. Low-cost fabrication of paper-based systems: Microfluidics, sensors, electronics and deployment. In Proceedings of the IEEE 60th International Midwest Symposium on Circuits and Systems (MWSCAS), Boston, MA, USA, 6–9 August 2017. [Google Scholar] [CrossRef]
- San Park, T.; Li, W.; McCracken, K.E.; Yoon, J.-Y. Smartphone quantifies salmonella from paper microfluidics. Lab Chip 2013, 13, 4832–4840. [Google Scholar] [CrossRef] [PubMed]
- Pelton, R. Bioactive paper provides a low-cost platform for diagnostics. TrAC, Trends Anal. Chem. 2009, 28, 925–942. [Google Scholar] [CrossRef]
- Cate, D.M.; Adkins, J.A.; Mettakoonpitak, J.; Henry, C.S. Recent developments in paper-based microfluidic devices. Anal. Chem. 2014, 87, 19–41. [Google Scholar] [CrossRef] [PubMed]
- Nery, E.W.; Kubota, L.T. Sensing approaches on paper-based devices: A review. Anal. Bioanal.Chem. 2013, 405, 7573–7595. [Google Scholar] [CrossRef] [PubMed]
- Lu, Y.; Shi, W.; Qin, J.; Lin, B. Fabrication and characterization of paper-based microfluidics prepared in nitrocellulose membrane by wax printing. Anal. Chem. 2009, 82, 329–335. [Google Scholar] [CrossRef] [PubMed]
- Park, M.; Kang, B.-H.; Jeong, K.-H. Based biochip assays and recent developments: A review. BioChip J. 2018, 12, 1–10. [Google Scholar] [CrossRef]
- Free, A.H.; Adams, E.C.; Kercher, M.L.; Free, H.M.; Cook, M.H. Simple specific test for urine glucose. Clin. Chem. 1957, 3, 163–168. [Google Scholar] [PubMed]
- Yetisen, A.K.; Akram, M.S.; Lowe, C.R. Paper-based microfluidic point-of-care diagnostic devices. Lab Chip 2013, 13, 2210–2251. [Google Scholar] [CrossRef] [PubMed]
- Li, H.; Han, D.; Pauletti, G.M.; Steckl, A.J. Blood coagulation screening using a paper-based microfluidic lateral flow device. Lab Chip 2014, 14, 4035–4041. [Google Scholar] [CrossRef] [PubMed]
- Hossain, S.M.Z.; Luckham, R.E.; McFadden, M.J.; Brennan, J.D. Reagentless bidirectional lateral flow bioactive paper sensors for detection of pesticides in beverage and food samples. Anal. Chem. 2009, 81, 9055–9064. [Google Scholar] [CrossRef] [PubMed]
- Li, C.-Z.; Vandenberg, K.; Prabhulkar, S.; Zhu, X.; Schneper, L.; Methee, K.; Rosser, C.J.; Almeide, E. Paper based point-of-care testing disc for multiplex whole cell bacteria analysis. Biosens. Bioelectron. 2011, 26, 4342–4348. [Google Scholar] [CrossRef] [PubMed]
- Fu, E.; Downs, C. Progress in the development and integration of fluid flow control tools in paper microfluidics. Lab Chip 2017, 17, 614–628. [Google Scholar] [CrossRef] [PubMed]
- Rivas, L.; Reuterswärd, P.; Rasti, R.; Herrmann, B.; Mårtensson, A.; Alfvén, T.; Gantelius, J.; Andersson-Svahn, H. A vertical flow paper-microarray assay with isothermal DNA amplification for detection of neisseria meningitidis. Talanta 2018, 183, 192–200. [Google Scholar] [CrossRef] [PubMed]
- Liana, D.D.; Raguse, B.; Gooding, J.J.; Chow, E. Recent advances in paper-based sensors. Sensors 2012, 12, 11505–11526. [Google Scholar] [CrossRef] [PubMed]
- Martinez, A.W.; Phillips, S.T.; Whitesides, G.M.; Carrilho, E. Diagnostics for the developing world: Microfluidic paper-based analytical devices. Anal. Chem. 2010, 82, 3–10. [Google Scholar] [CrossRef] [PubMed]
- Ellerbee, A.K.; Phillips, S.T.; Siegel, A.C.; Mirica, K.A.; Martinez, A.W.; Striehl, P.; Jain, N.; Prentiss, M.; Whitesides, G.M. Quantifying colorimetric assays in paper-based microfluidic devices by measuring the transmission of light through paper. Anal. Chem. 2009, 81, 8447–8452. [Google Scholar] [CrossRef] [PubMed]
- Gao, B.; Chi, J.; Liu, H.; Gu, Z. Vertical paper analytical devices fabricated using the principles of quilling and kirigami. Sci. Rep. 2017, 7, 7255. [Google Scholar] [CrossRef] [PubMed]
- Cretich, M.; Sedini, V.; Damin, F.; Pelliccia, M.; Sola, L.; Chiari, M. Coating of nitrocellulose for colorimetric DNA microarrays. Anal. Biochem. 2010, 397, 84–88. [Google Scholar] [CrossRef] [PubMed]
- Ali, M.M.; Brown, C.L.; Jahanshahi-Anbuhi, S.; Kannan, B.; Li, Y.; Filipe, C.D.M.; Brennan, J.D. A printed multicomponent paper sensor for bacterial detection. Sci. Rep. 2017, 7, 12335. [Google Scholar] [CrossRef] [PubMed]
- Lu, Y.; Shi, W.; Qin, J.; Lin, B. Fabrication and characterization of paper-based microfluidics prepared in nitrocellulose membrane by wax printing. Anal. Chem. 2010, 82, 329–335. [Google Scholar] [CrossRef] [PubMed]
- Lisa, M.; Chouhan, R.S.; Vinayaka, A.C.; Manonmani, H.K.; Thakur, M.S. Gold nanoparticles based dipstick immunoassay for the rapid detection of dichlorodiphenyltrichloroethane: An organochlorine pesticide. Biosens. Bioelectron. 2009, 25, 224–227. [Google Scholar] [CrossRef] [PubMed]
- Brash, J.L.; Ten Hove, P. Protein adsorption studies on ‘standard’ polymeric materials. J. Biomater. Sci. Polym. Ed. 1993, 4, 591–599. [Google Scholar] [CrossRef]
- Hossain, S.M.; Luckham, R.E.; McFadden, M.J.; Brennan, J.D. Reagentless bidirectional lateral flow bioactive paper sensors for detection of pesticides in beverage and food samples. Anal. Chem. 2009, 81, 9055–9064. [Google Scholar] [CrossRef] [PubMed]
- Tyagi, C.; Tomar Lomas, K.; Singh, H. Surface modification of cellulose filter paper by glycidyl methacrylate grafting for biomolecule immobilization: Influence of grafting parameters and urease immobilization. J. Appl. Polym. Sci. 2008, 111, 1381–1390. [Google Scholar] [CrossRef]
- Arena, A.; Donato, N.; Saitta, G.; Bonavita, A.; Rizzo, G.; Neri, G. Flexible ethanol sensors on glossy paper substrates operating at room temperature. Sens. Actuators B 2010, 145, 488–494. [Google Scholar] [CrossRef]
- Santhiago, M.; Correa, C.C.; Bernardes, J.S.; Pereira, M.P.; Oliveira, L.J.M.; Strauss, M.; Bufon, C.C.B. Flexible and foldable fully-printed carbon black conductive nanostructures on paper for high-performance electronic, electrochemical, and wearable devices. ACS Appl. Mater. Interfaces 2017, 9, 24365–24372. [Google Scholar] [CrossRef] [PubMed]
- Cinti, S.; Mazzaracchio, V.; Cacciotti, I.; Moscone, D.; Arduini, F. Carbon black-modified electrodes screen-printed onto paper towel, waxed paper and parafilm M®. Sensors 2017, 17, 2267. [Google Scholar] [CrossRef] [PubMed]
- Ostrov, N.; Jimenez, M.; Billerbeck, S.; Brisbois, J.; Matragrano, J.; Ager, A.; Cornish, V.W. A modular yeast biosensor for low-cost point-of-care pathogen detection. Sci. Adv. 2017, 3, e1603221. [Google Scholar] [CrossRef] [PubMed]
- Dungchai, W.; Chailapakul, O.; Henry, C.S. A low-cost, simple, and rapid fabrication method for paper-based microfluidics using wax screen-printing. Analyst 2011, 136, 77–82. [Google Scholar] [CrossRef] [PubMed]
- Namwong, P.; Jarujamrus, P.; Amatatongchai, M.; Chairam, S. Fabricating simple wax screen-printing paper-based analytical devices to demonstrate the concept of limiting reagent in acid- base reactions. J. Chem. Educ. 2018, 95, 305–309. [Google Scholar] [CrossRef]
- Dungchai, W.; Chailapakul, O.; Henry, C.S. Use of multiple colorimetric indicators for paper-based microfluidic devices. Anal. Chim. Acta 2010, 674, 227–233. [Google Scholar] [CrossRef] [PubMed]
- Klasner, S.A.; Price, A.K.; Hoeman, K.W.; Wilson, R.S.; Bell, K.J.; Culbertson, C.T. Paper-based microfluidic devices for analysis of clinically relevant analytes present in urine and saliva. Anal. Bioanal. Chem. 2010, 397, 1821–1829. [Google Scholar] [CrossRef] [PubMed]
- OuYang, L.; Wang, C.; Du, F.; Zheng, T.; Liang, H. Electrochromatographic separations of multi-component metal complexes on a microfluidic paper-based device with a simplified photolithography. RSC Adv. 2014, 4, 1093–1101. [Google Scholar] [CrossRef]
- Bruzewicz, D.A.; Reches, M.; Whitesides, G.M. Low-cost printing of poly(dimethylsiloxane) barriers to define microchannels in paper. Anal. Chem. 2008, 80, 3387–3392. [Google Scholar] [CrossRef] [PubMed]
- Gervais, L.; Delamarche, E. Toward one-step point-of-care immunodiagnostics using capillary-driven microfluidics and pdms substrates. Lab Chip 2009, 9, 3330–3337. [Google Scholar] [CrossRef] [PubMed]
- Shangguan, J.-W.; Liu, Y.; Pan, J.-B.; Xu, B.-Y.; Xu, J.-J.; Chen, H.-Y. Microfluidic pdms on paper (pop) devices. Lab Chip 2017, 17, 120–127. [Google Scholar] [CrossRef] [PubMed]
- Khan, M.S.; Fon, D.; Li, X.; Tian, J.; Forsythe, J.; Garnier, G.; Shen, W. Biosurface engineering through ink jet printing. Colloids Surf. B 2010, 75, 441–447. [Google Scholar] [CrossRef] [PubMed]
- Gaspar, C.; Olkkonen, J.; Passoja, S.; Smolander, M. Paper as active layer in inkjet-printed capacitive humidity sensors. Sensors 2017, 17, 1464. [Google Scholar] [CrossRef] [PubMed]
- Ko, H.; Lee, J.; Kim, Y.; Lee, B.; Jung, C.-H.; Choi, J.-H.; Kwon, O.-S.; Shin, K. Active digital microfluidic paper chips with inkjet-printed patterned electrodes. Adv. Mater. 2014, 26, 2335–2340. [Google Scholar] [CrossRef] [PubMed]
- Chitnis, G.; Ding, Z.; Chang, C.L.; Savran, C.A.; Ziaie, B. Laser-treated hydrophobic paper: an inexpensive microfluidic platform. Lab Chip 2011, 11, 1161–1165. [Google Scholar] [CrossRef] [PubMed]
- Spicar-Mihalic, P.; Toley, B.; Houghtaling, J.; Liang, T.; Yager, P.; Fu, E. Co2 laser cutting and ablative etching for the fabrication of paper-based devices. J. Micromech. Microeng. 2013, 23, 067003. [Google Scholar] [CrossRef]
- Mahmud, M.; Blondeel, E.; Kaddoura, M.; MacDonald, B. Features in microfluidic paper-based devices made by laser cutting: How small can they be? Micromachines 2018, 9, 220. [Google Scholar] [CrossRef]
- Gosselin, D.; Belgacem, M.N.; Joyard-Pitiot, B.; Baumlin, J.M.; Navarro, F.; Chaussy, D.; Berthier, J. Low-cost embossed-paper micro-channels for spontaneous capillary flow. Sens. Actuators B 2017, 248, 395–401. [Google Scholar] [CrossRef]
- Kim, Y.S.; Yang, Y.; Henry, C.S. Laminated and infused parafilm® – paper for paper-based analytical devices. Sens. Actuators B 2018, 255, 3654–3661. [Google Scholar] [CrossRef] [PubMed]
- Yu, L.; Shi, Z.Z. Microfluidic paper-based analytical devices fabricated by low-cost photolithography and embossing of parafilm®. Lab Chip 2015, 15, 1642–1645. [Google Scholar] [CrossRef] [PubMed]
- Yang, J.; Li, H.; Lan, T.; Peng, L.; Cui, R.; Yang, H. Preparation, characterization, and properties of fluorine-free superhydrophobic paper based on layer-by-layer assembly. Carbohydr. Polym. 2017, 178, 228–237. [Google Scholar] [CrossRef] [PubMed]
- Cai, L.; Xu, C.; Lin, S.; Luo, J.; Wu, M.; Yang, F. A simple paper-based sensor fabricated by selective wet etching of silanized filter paper using a paper mask. Biomicrofluidics 2014, 8, 056504. [Google Scholar] [CrossRef] [PubMed] [Green Version]
- Mohammadifar, M.; Zhang, J.; Yazgan, I.; Sadik, O.; Choi, S. Power-on-paper: Origami-inspired fabrication of 3-D microbial fuel cells. Renew. Energy 2018, 118, 695–700. [Google Scholar] [CrossRef]
- Li, W.; Qian, D.; Wang, Q.; Li, Y.; Bao, N.; Gu, H.; Yu, C. Fully-drawn origami paper analytical device for electrochemical detection of glucose. Sens. Actuators B 2016, 231, 230–238. [Google Scholar] [CrossRef]
- Lin, C.H.; Tsai, D.S.; Wei, T.C.; Lien, D.H.; Ke, J.J.; Su, C.H.; Sun, J.Y.; Liao, Y.C.; He, J.H. Highly deformable origami paper photodetector arrays. ACS NANO 2017, 11, 10230–10235. [Google Scholar] [CrossRef] [PubMed]
- Sher, M.; Zhuang, R.; Demirci, U.; Asghar, W. Paper-based analytical devices for clinical diagnosis: Recent advances in the fabrication techniques and sensing mechanisms. Expert Rev. Mol. Diagnostic 2017, 17, 351–366. [Google Scholar] [CrossRef] [PubMed]
- Tsai, T.-T.; Shen, S.-W.; Cheng, C.-M.; Chen, C.-F. Paper-based tuberculosis diagnostic devices with colorimetric gold nanoparticles. Sci. Technol. Adv. Mater. 2013, 14, 044404. [Google Scholar] [CrossRef] [PubMed] [Green Version]
- Martinez, A.W.; Phillips, S.T.; Carrilho, E.; Thomas, S.W.; Sindi, H.; Whitesides, G.M. Simple telemedicine for developing regions: Camera phones and paper-based microfluidic devices for real-time, off-site diagnosis. Anal. Chem. 2008, 80, 3699–3707. [Google Scholar] [CrossRef] [PubMed]
- Boehle, K.E.; Carrell, C.S.; Caraway, J.; Henry, C.S. Paper-based enzyme competition assay for detecting falsified beta-lactam antibiotics. ACS Sens. 2018, 3, 1299–1307. [Google Scholar] [CrossRef] [PubMed]
- Cheng, C.M.; Martinez, A.W.; Gong, J.; Mace, C.R.; Phillips, S.T.; Carrilho, E.; Mirica, K.A.; Whitesides, G.M. Paper-based elisa. Angew. Chem. Int. Ed. Engl 2010, 49, 4771–4774. [Google Scholar] [CrossRef] [PubMed]
- Zhu, X.; Xiong, S.; Zhang, J.; Zhang, X.; Tong, X.; Kong, S. Improving paper-based elisa performance through covalent immobilization of antibodies. Sens. Actuators B 2018, 255, 598–604. [Google Scholar] [CrossRef]
- Tsai, T.T.; Huang, C.Y.; Chen, C.A.; Shen, S.W.; Wang, M.C.; Cheng, C.M.; Chen, C.F. Diagnosis of tuberculosis using colorimetric gold nanoparticles on a paper-based analytical device. ACS Sens. 2017, 2, 1345–1354. [Google Scholar] [CrossRef] [PubMed]
- Li, J.-J.; Wang, X.-F.; Huo, D.-Q.; Hou, C.-J.; Fa, H.-B.; Yang, M.; Zhang, L. Colorimetric measurement of fe 3+ using a functional paper-based sensor based on catalytic oxidation of gold nanoparticles. Sens. Actuators B 2017, 242, 1265–1271. [Google Scholar] [CrossRef]
- Ferreira, D.C.; Giordano, G.F.; Soares, C.C.; de Oliveira, J.F.; Mendes, R.K.; Piazzetta, M.H.; Gobbi, A.L.; Cardoso, M.B. Optical paper-based sensor for ascorbic acid quantification using silver nanoparticles. Talanta 2015, 141, 188–194. [Google Scholar] [CrossRef] [PubMed]
- Yu, J.; Wang, S.; Ge, L.; Ge, S. A novel chemiluminescence paper microfluidic biosensor based on enzymatic reaction for uric acid determination. Biosens. Bioelectron. 2011, 26, 3284–3289. [Google Scholar] [CrossRef] [PubMed]
- Wang, S.; Ge, L.; Song, X.; Yu, J.; Ge, S.; Huang, J.; Zeng, F. Paper-based chemiluminescence elisa: Lab-on-paper based on chitosan modified paper device and wax-screen-printing. Biosens. Bioelectron. 2012, 31, 212–218. [Google Scholar] [CrossRef] [PubMed]
- Punjiya, M.; Mostafalu, P.; Sonkusale, S. Low-cost paper-based electrochemical sensors with cmos readout IC. In Proceedings of the 2014 IEEE Biomedical Circuits and Systems Conference (BioCAS), Lausanne, Switzerland, 22–24 October 2014; pp. 324–327. [Google Scholar]
- Mettakoonpitak, J.; Boehle, K.; Nantaphol, S.; Teengam, P.; Adkins, J.A.; Srisa-Art, M.; Henry, C.S. Electrochemistry on paper-based analytical devices: A review. Electroanalysis 2016, 28, 1420–1436. [Google Scholar] [CrossRef]
- Lamas-Ardisana, P.J.; Casuso, P.; Fernandez-Gauna, I.; Martínez-Paredes, G.; Jubete, E.; Añorga, L.; Cabañero, G.; Grande, H.J. Disposable electrochemical paper-based devices fully fabricated by screen-printing technique. Electrochem. Commun. 2017, 75, 25–28. [Google Scholar] [CrossRef]
- Nie, Z.; Nijhuis, C.A.; Gong, J.; Chen, X.; Kumachev, A.; Martinez, A.W.; Narovlyansky, M.; Whitesides, G.M. Electrochemical sensing in paper-based microfluidic devices. Lab Chip 2010, 10, 477–483. [Google Scholar] [CrossRef] [PubMed] [Green Version]
- Liana, D.D.; Raguse, B.; Gooding, J.J.; Chow, E. Recent advances in paper-based sensors. Sensors 2012, 12, 11505. [Google Scholar] [CrossRef] [PubMed]
- Busa, L.; Mohammadi, S.; Maeki, M.; Ishida, A.; Tani, H.; Tokeshi, M. Advances in microfluidic paper-based analytical devices for food and water analysis. Micromachines 2016, 7, 86. [Google Scholar] [CrossRef]
- Jang, H.; Kim, K.; Park, C.W.; Lee, G.; Choi, S. A low-cost ion detecting device with paper-based disposal sensor. In Proceedings of the 15th International Conference on Control, Automation and Systems (ICCAS), Busan, South Korea, 13–16 October 2015; pp. 1860–1862. [Google Scholar]
- Lee, V.B.C.; Mohd-Naim, N.F.; Tamiya, E.; Ahmed, M.U. Trends in paper-based electrochemical biosensors: From design to application. Anal. Sci. 2018, 34, 7–18. [Google Scholar] [CrossRef] [PubMed]
- Silveira, C.; Monteiro, T.; Almeida, M. Biosensing with paper-based miniaturized printed electrodes–a modern trend. Biosensors 2016, 6, 51. [Google Scholar] [CrossRef] [PubMed]
- Grieshaber, D.; MacKenzie, R.; Voros, J.; Reimhult, E. Electrochemical biosensors - sensor principles and architectures. Sensors 2008, 8, 1400–1458. [Google Scholar] [CrossRef] [PubMed]
- Zhao, C.; Thuo, M.M.; Liu, X. Corrigendum: A microfluidic paper-based electrochemical biosensor array for multiplexed detection of metabolic biomarkers. Sci. Technol. Adv. Mater. 2015, 16, 049501. [Google Scholar] [CrossRef] [PubMed]
- Wu, M.; Lai, Q.; Ju, Q.; Li, L.; Yu, H.D.; Huang, W. Paper-based fluorogenic devices for in vitro diagnostics. Biosens. Bioelectron. 2018, 102, 256–266. [Google Scholar] [CrossRef] [PubMed]
- Petruci, J.F.; Cardoso, A.A. Portable and disposable paper-based fluorescent sensor for in situ gaseous hydrogen sulfide determination in near real-time. Anal. Chem. 2016, 88, 11714–11719. [Google Scholar] [CrossRef] [PubMed]
- Li, L.; Li, W.; Ma, C.; Yang, H.; Ge, S.; Yu, J. Paper-based electrochemiluminescence immunodevice for carcinoembryonic antigen using nanoporous gold-chitosan hybrids and graphene quantum dots functionalized Au@Pt. Sens. Actuators B 2014, 202, 314–322. [Google Scholar] [CrossRef]
- Mani, V.; Kadimisetty, K.; Malla, S.; Joshi, A.A.; Rusling, J.F. Paper-based electrochemiluminescent screening for genotoxic activity in the environment. Environ. Sci. Technol. 2013, 47, 1937–1944. [Google Scholar] [CrossRef] [PubMed]
- Ahmed, S.; Bui, M.P.; Abbas, A. Paper-based chemical and biological sensors: Engineering aspects. Biosens. Bioelectron. 2016, 77, 249–263. [Google Scholar] [CrossRef] [PubMed]
- Lopez-Marzo, A.M.; Merkoci, A. Paper-based sensors and assays: A success of the engineering design and the convergence of knowledge areas. Lab Chip 2016, 16, 3150–3176. [Google Scholar] [CrossRef] [PubMed]
- Songjaroen, T.; Dungchai, W.; Chailapakul, O.; Henry, C.S.; Laiwattanapaisal, W. Blood separation on microfluidic paper-based analytical devices. Lab Chip 2012, 12, 3392–3398. [Google Scholar] [CrossRef] [PubMed]
- Vella, S.J.; Beattie, P.; Cademartiri, R.; Laromaine, A.; Martinez, A.W.; Phillips, S.T.; Mirica, K.A.; Whitesides, G.M. Measuring markers of liver function using a micropatterned paper device designed for blood from a fingerstick. Anal. Chem. 2012, 84, 2883–2891. [Google Scholar] [CrossRef] [PubMed] [Green Version]
- Sununta, S.; Rattanarat, P.; Chailapakul, O.; Praphairaksit, N. Microfluidic paper-based analytical devices for determination of creatinine in urine samples. Anal. Sci. 2018, 34, 109–113. [Google Scholar] [CrossRef] [PubMed]
- Im, S.H.; Kim, K.R.; Park, Y.M.; Yoon, J.H.; Hong, J.W.; Yoon, H.C. An animal cell culture monitoring system using a smartphone-mountable paper-based analytical device. Sens. Actuators B 2016, 229, 166–173. [Google Scholar] [CrossRef]
- Sechi, D.; Greer, B.; Johnson, J.; Hashemi, N. Three-dimensional paper-based microfluidic device for assays of protein and glucose in urine. Anal. Chem. 2013, 85, 10733–10737. [Google Scholar] [CrossRef] [PubMed]
- Martinez, A.W.; Phillips, S.T.; Whitesides, G.M. Three-dimensional microfluidic devices fabricated in layered paper and tape. Proc. Natl. Acad. Sci. USA 2008, 105, 19606–19611. [Google Scholar] [CrossRef] [PubMed] [Green Version]
- Yamada, K.; Takaki, S.; Komuro, N.; Suzuki, K.; Citterio, D. An antibody-free microfluidic paper-based analytical device for the determination of tear fluid lactoferrin by fluorescence sensitization of Tb3+. Analyst 2014, 139, 1637–1643. [Google Scholar] [CrossRef] [PubMed]
- Yetisen, A.K.; Jiang, N.; Tamayol, A.; Ruiz-Esparza, G.U.; Zhang, Y.S.; Medina-Pando, S.; Gupta, A.; Wolffsohn, J.S.; Butt, H.; Khademhosseini, A.; et al. Paper-based microfluidic system for tear electrolyte analysis. Lab Chip 2017, 17, 1137–1148. [Google Scholar] [CrossRef] [PubMed] [Green Version]
- Wang, S.; Chinnasamy, T.; Lifson, M.A.; Inci, F.; Demirci, U. Flexible substrate-based devices for point-of-care diagnostics. Trends Biotechnol. 2016, 34, 909–921. [Google Scholar] [CrossRef] [PubMed]
- Cho, E.; Mohammadifar, M.; Choi, S. A single-use, self-powered, paper-based sensor patch for detection of exercise-induced hypoglycemia. Micromachines 2017, 8, 265. [Google Scholar]
- Almeida, M.I.G.S.; Jayawardane, B.M.; Kolev, S.D.; McKelvie, I.D. Developments of microfluidic paper-based analytical devices (μpads) for water analysis: A review. Talanta 2018, 177, 176–190. [Google Scholar] [CrossRef] [PubMed]
- Hu, J.; Yew, C.-H.T.; Chen, X.; Feng, S.; Yang, Q.; Wang, S.; Wee, W.-H.; Pingguan-Murphy, B.; Lu, T.J.; Xu, F. Paper-based capacitive sensors for identification and quantification of chemicals at the point of care. Talanta 2017, 165, 419–428. [Google Scholar] [CrossRef] [PubMed]
- Sicard, C.; Glen, C.; Aubie, B.; Wallace, D.; Jahanshahi-Anbuhi, S.; Pennings, K.; Daigger, G.T.; Pelton, R.; Brennan, J.D.; Filipe, C.D.M. Tools for water quality monitoring and mapping using paper-based sensors and cell phones. Water Res. 2015, 70, 360–369. [Google Scholar] [CrossRef] [PubMed]
- Feng, L.; Li, H.; Niu, L.-Y.; Guan, Y.-S.; Duan, C.-F.; Guan, Y.-F.; Tung, C.-H.; Yang, Q.-Z. A fluorometric paper-based sensor array for the discrimination of heavy-metal ions. Talanta 2013, 108, 103–108. [Google Scholar] [CrossRef] [PubMed] [Green Version]
- Wang, H.; Li, Y.-J.; Wei, J.-F.; Xu, J.-R.; Wang, Y.-H.; Zheng, G.-X. Paper-based three-dimensional microfluidic device for monitoring of heavy metals with a camera cell phone. Anal. Bioanal. Chem. 2014, 406, 2799–2807. [Google Scholar] [CrossRef] [PubMed]
- da Silveira Petruci, J.F.; Cardoso, A.A. Sensitive luminescent paper-based sensor for the determination of gaseous hydrogen sulfide. Anal. Methods 2015, 7, 2687–2692. [Google Scholar] [CrossRef]
- Wu, X.; Suvarnapathaki, S.; Walsh, K.; Camci-Unal, G. Paper as a scaffold for cell cultures: Teaching an old material new tricks. MRS Commun. 2018, 8, 1–14. [Google Scholar] [CrossRef]
- Lantigua, D.; Kelly, Y.-N.; Unal, B.; Camci-Unal, G. Engineered paper-based cell culture platforms. Adv. Healthcare Mater. 2017, 6, 1700619. [Google Scholar] [CrossRef] [PubMed]
- Camci-Unal, G.; Laromaine, A.; Hong, E.; Derda, R.; Whitesides, G.M. Biomineralization guided by paper templates. Sci. Rep. 2016, 6, 27693. [Google Scholar] [CrossRef] [PubMed]
- Camci-Unal, G.; Newsome, D.; Eustace, B.K.; Whitesides, G.M. Fibroblasts enhance migration of human lung cancer cells in a paper-based coculture system. Adv. Healthcare Mater. 2016, 5, 641–647. [Google Scholar] [CrossRef] [PubMed]
- Juvonen, H.; Määttänen, A.; Laurén, P.; Ihalainen, P.; Urtti, A.; Yliperttula, M.; Peltonen, J. Biocompatibility of printed paper-based arrays for 2-D cell cultures. Acta Biomater. 2013, 9, 6704–6710. [Google Scholar] [CrossRef] [PubMed]
- Tao, F.F.; Xiao, X.; Lei, K.F.; Lee, I.-C. Paper-based cell culture microfluidic system. BioChip J. 2015, 9, 97–104. [Google Scholar] [CrossRef]
- Simon, K.A.; Mosadegh, B.; Minn, K.T.; Lockett, M.R.; Mohammady, M.R.; Boucher, D.M.; Hall, A.B.; Hillier, S.M.; Udagawa, T.; Eustace, B.K.; et al. Metabolic response of lung cancer cells to radiation in a paper-based 3d cell culture system. Biomaterials 2016, 95, 47–59. [Google Scholar] [CrossRef] [PubMed]
- Khiabani, P.S.; Soeriyadi, A.H.; Reece, P.J.; Gooding, J.J. Paper-Based Sensor for Monitoring Sun Exposure. ACS Sens. 2016, 1, 775–780. [Google Scholar] [CrossRef]
Figure 1.
Overview of the analytical capabilities that are employed in paper-based sensors. Paper-based assays with strategies for fluid and analyte handling, sample processing and analysis, and quantification. Reproduced with permission from [3].
Figure 1.
Overview of the analytical capabilities that are employed in paper-based sensors. Paper-based assays with strategies for fluid and analyte handling, sample processing and analysis, and quantification. Reproduced with permission from [3].

Figure 2.
Construction of paper-based devices using origami and kirigami. (a) Quilling and kirigami processes are depicted. (b) Schematic for the creation of 2D and 3D sensors using origami and kirigami. (c) Photographs show 2D sensor before and after the introduction of 0.10 M PBS solution containing 0.010 M coomassie brilliant blue. Solution is introduced at point of red arrow. (d) Photographs show 3D sensor before and after the introduction of 0.010 M coomassie brilliant blue, 0.010 M rhodamine B, 0.010 M methyl orange and 0.010 M bromocresol green. Solutions are introduced at points of red arrows. Scale bars represent 10 mm. Reproduced with permission from [26].

Figure 3.
The mechanism of TB diagnosis using a paper-based sensor. If extracted DNA sequences contain IS6110 sequences (specific to Mycobacterium tuberculosis complex), detection oligonucleotide sequences will hybridize with the sequences. If IS6110 sequences are not present, the color of the mixture does not change, and stays red after hybridization with DNA. The color change can be quantified through the analysis of a picture taken via smartphone. Reproduced with permission from [61].

Figure 4.
A paper-based microfluidic device that can separate blood plasma from the erythrocytes, and then filter the plasma to the bottom side of the device. The bottom side has the necessary reagents for the assays. A cell phone can be used to quantify the results, and incineration of the device allows for easy disposal. Reproduced with permission from [89].

Figure 5.
The color change in paper-based sensors can be quantified through the analysis of a picture taken via smartphone. Reproduced with permission from [91]. An overview of the paper-based sensor that was used to detect glucose and lactate. (a) Two detection zones and the sample zone are contained in the top layer. The bottom layer contains a fluidic channel, and both of these layers are connected using double-sized adhesive tape. (b) The process of wax-printing used to construct the sensor. (c) The anterior and posterior sides of the sensor.

Figure 6.
The process of wax-printing used to construct the sensor. (c) The anterior and posterior sides of the sensor. Reproduced with permission from [91]. An overview of glucose and lactate assays. (a) Glucose concentrations between 0-16 mM. (b) Lactate concentrations between 0–1 mM. (c) Calibration curve of glucose assay plotted using data collected at a reaction time of 60 s. (d) Calibration curve of lactate assay.


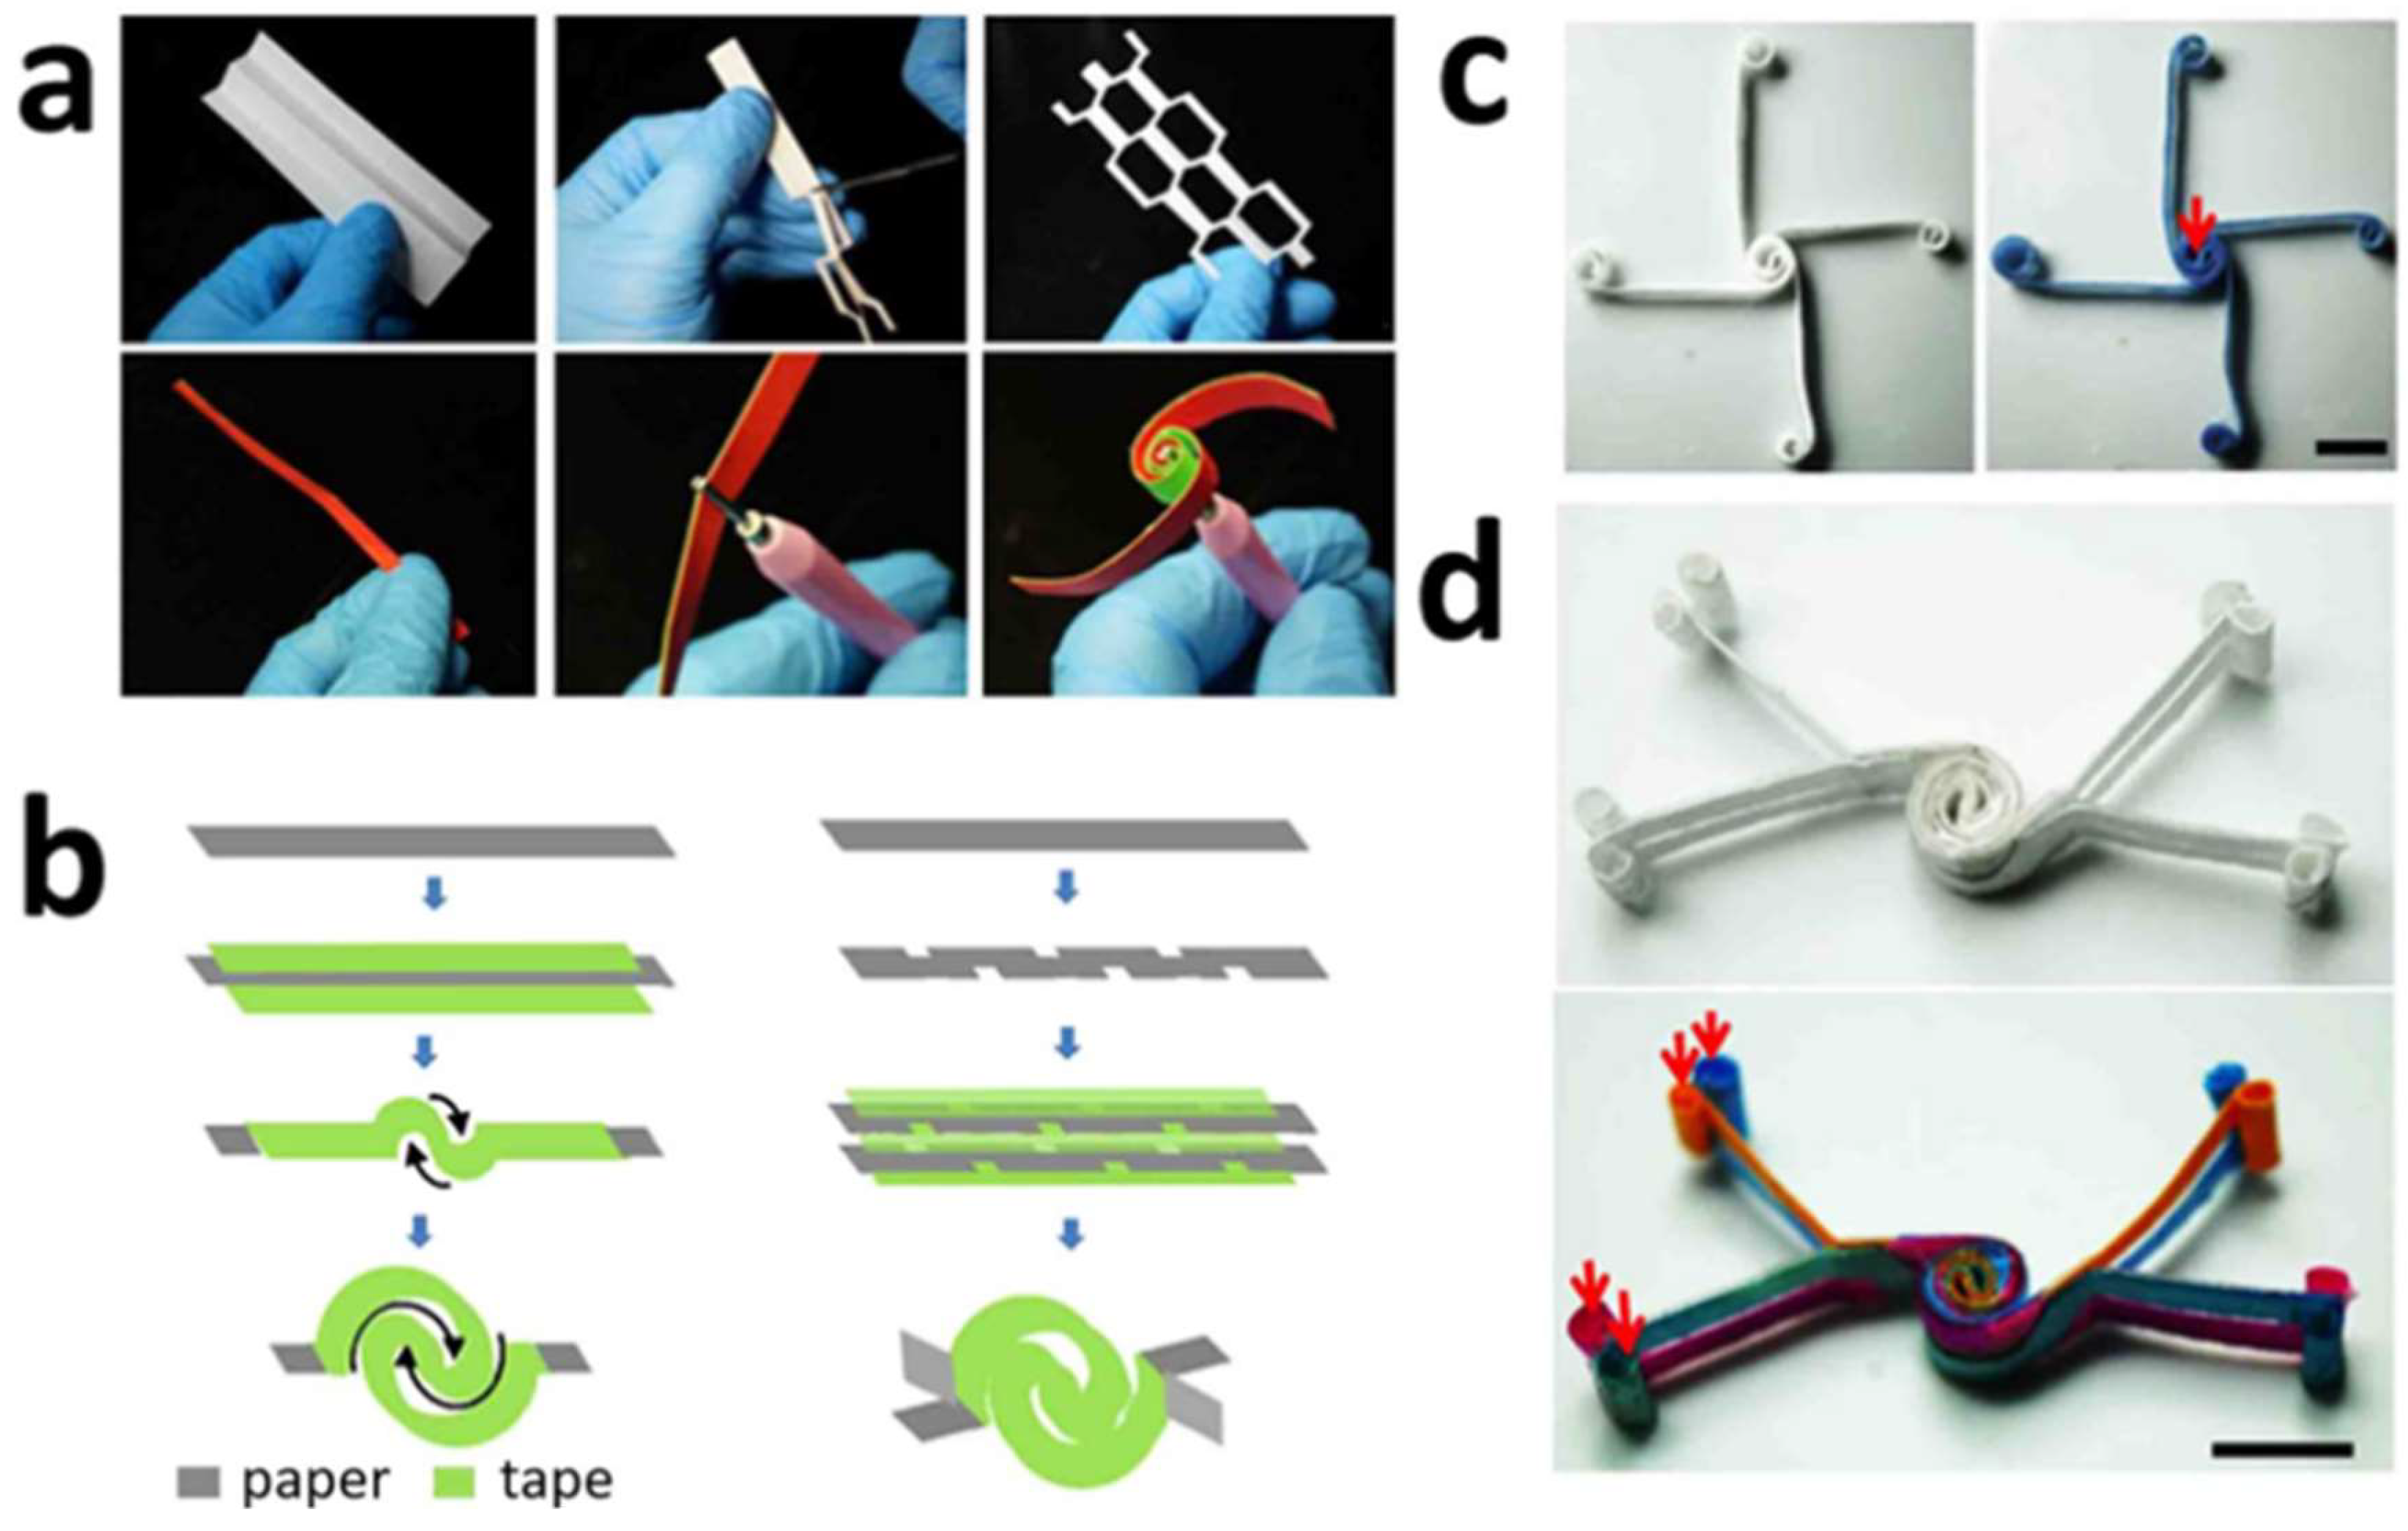
Table 1.
Advantages and disadvantages of the main fabrication techniques for paper-based sensors.
| Procedure | Advantages | Disadvantages |
|---|---|---|
| Wax Printing | Low-cost, easy fabrication, short fabrication time | Low resolution, unstable upon heating |
| Photolithography | High resolution, suitable for large-scale production | Expensive and sophisticated equipment, unstability against bending or folding |
| Inkjet Printing | Efficient, reduced cross-contamination, rapid fabrication, high resolution | Expensive bio-ink printer |
| Laser Cutting | Simple, inexpensive | Specialized equipment |
| PDMS | Low-cost, flexible | Low resolution, sophisticated equipment for fabrication of molds |
| Hot Embossing | Short fabrication time, efficient | Specialized equipment |
| Hydrophobic Silanization | Low-cost, rapid fabrication | Limitation with simple designs |
| Origami and Kirigami | Intricate and innovative designs, simple fabrication |
Table 2.
Main fabrication techniques for paper-based sensors.
| Fabrication Technique | Procedure | Detection Method | Recognition Element | Analyte Detected | Reference |
|---|---|---|---|---|---|
| Wax printing | Melted wax | Electrochemical | Glucose oxidase | Glucose | [38] |
| Melted wax | Colorimetric | Ascorbic acid and 1,10-phenanthroline | Iron | [38] | |
| Melted wax | Colorimetric | Phenolphthalein | Limiting reagent of acid-base reaction | [39] | |
| Melted wax | Colorimetric | Anti-Human IgG | Human IgG | [29] | |
| Photolithography | Hydrophobic photoresist | Colorimetric | Oxidase enzymes that produce H2O2 | Glucose, lactate, uric acid | [40] |
| Hydrophobic photoresist | Colorimetric | Glucose oxidase, potassium iodide, trehalose, horseradish peroxide | Glucose | [41] | |
| Hydrophobic photoresist | Colorimetric | Glycine, sodium nitroprusside | Acetoacetate | [41] | |
| Hydrophobic photoresist | Colorimetric | Sulfanilamide, citric acid, and n-(1-napthyl)ethylenedi-amine | Nitrite | [41] | |
| PDMS | Hydrophobic PDMS | Colorimetric | Glucose oxidase, potassium iodide, horseradish peroxide | Glucose | [43] |
| Hydrophobic PDMS | Colorimetric | Bromothymol Blue | pH | [43] | |
| Hydrophobic PDMS | Colorimetric | Tetrabromophenol blue | Proteins | [43] | |
| Hydrophobic PDMS | Fluorescence | Tetrabromophenol blue and NBT alkaline Phosphatase Color Development Kit | Total serum protein, alkaline phosphatase, aspartate aminotransferase | [45] | |
| Hydrophobic PDMS | Colorimetric | Detection antibodies and capture antibodies | C-reactive protein (from human serum) | [44] | |
| Inkjet printing | Printed biomolecules | Colorimetric | 3,3′-diaminobenzidine | Horseradish peroxidase | [46] |
| Printed conductive electrodes | Electrochemical | Change in capacitance | Humidity | [47] | |
| Laser cutting | Hydrophilic patterns printed using CO2 laser cutter | Chemiluminescence | Catalytic action of iron in hemoglobin | Luminol-based hemoglobin | [49] |
| Hot embossing | Embossed paper with layer of rubber and poly(vinyl)alcohol | Colorimetric | Glucose oxidase, horseradish peroxidase, and o-Dianisidine | Glucose | [52] |
| Parafilm and paper heated in an oven | Colorimetric | Cholinesterase and dithiodipropionic nitrobenzene acid | Methomyl | [54] | |
| Parafilm and paper heated in an oven | Colorimetric | Uricase, horseradish peroxidase, tetra-methyl benzidine | Uric acid | [54] | |
| Hydrophobic silanization | Selective wet etching of hydrophobic filter paper | Colorimetric | Glucose oxidase, potassium iodide, horseradish peroxide | Glucose | [56] |
| Origami | Printed electrodes followed by baking | Electrochemical | Glucose oxidase | Glucose | [57] |
© 2018 by the authors. Licensee MDPI, Basel, Switzerland. This article is an open access article distributed under the terms and conditions of the Creative Commons Attribution (CC BY) license (http://creativecommons.org/licenses/by/4.0/).
Share and Cite
MDPI and ACS Style
Singh, A.T.; Lantigua, D.; Meka, A.; Taing, S.; Pandher, M.; Camci-Unal, G. Paper-Based Sensors: Emerging Themes and Applications. Sensors 2018, 18, 2838. https://doi.org/10.3390/s18092838
AMA Style
Singh AT, Lantigua D, Meka A, Taing S, Pandher M, Camci-Unal G. Paper-Based Sensors: Emerging Themes and Applications. Sensors. 2018; 18(9):2838. https://doi.org/10.3390/s18092838
Chicago/Turabian StyleSingh, Amrita Tribhuwan, Darlin Lantigua, Akhil Meka, Shainlee Taing, Manjot Pandher, and Gulden Camci-Unal. 2018. "Paper-Based Sensors: Emerging Themes and Applications" Sensors 18, no. 9: 2838. https://doi.org/10.3390/s18092838
Note that from the first issue of 2016, this journal uses article numbers instead of page numbers. See further details here.