A Study of Diagnostic Accuracy Using a Chemical Sensor Array and a Machine Learning Technique to Detect Lung Cancer

 and
and
Abstract
:1. Introduction
2. Materials and Methods
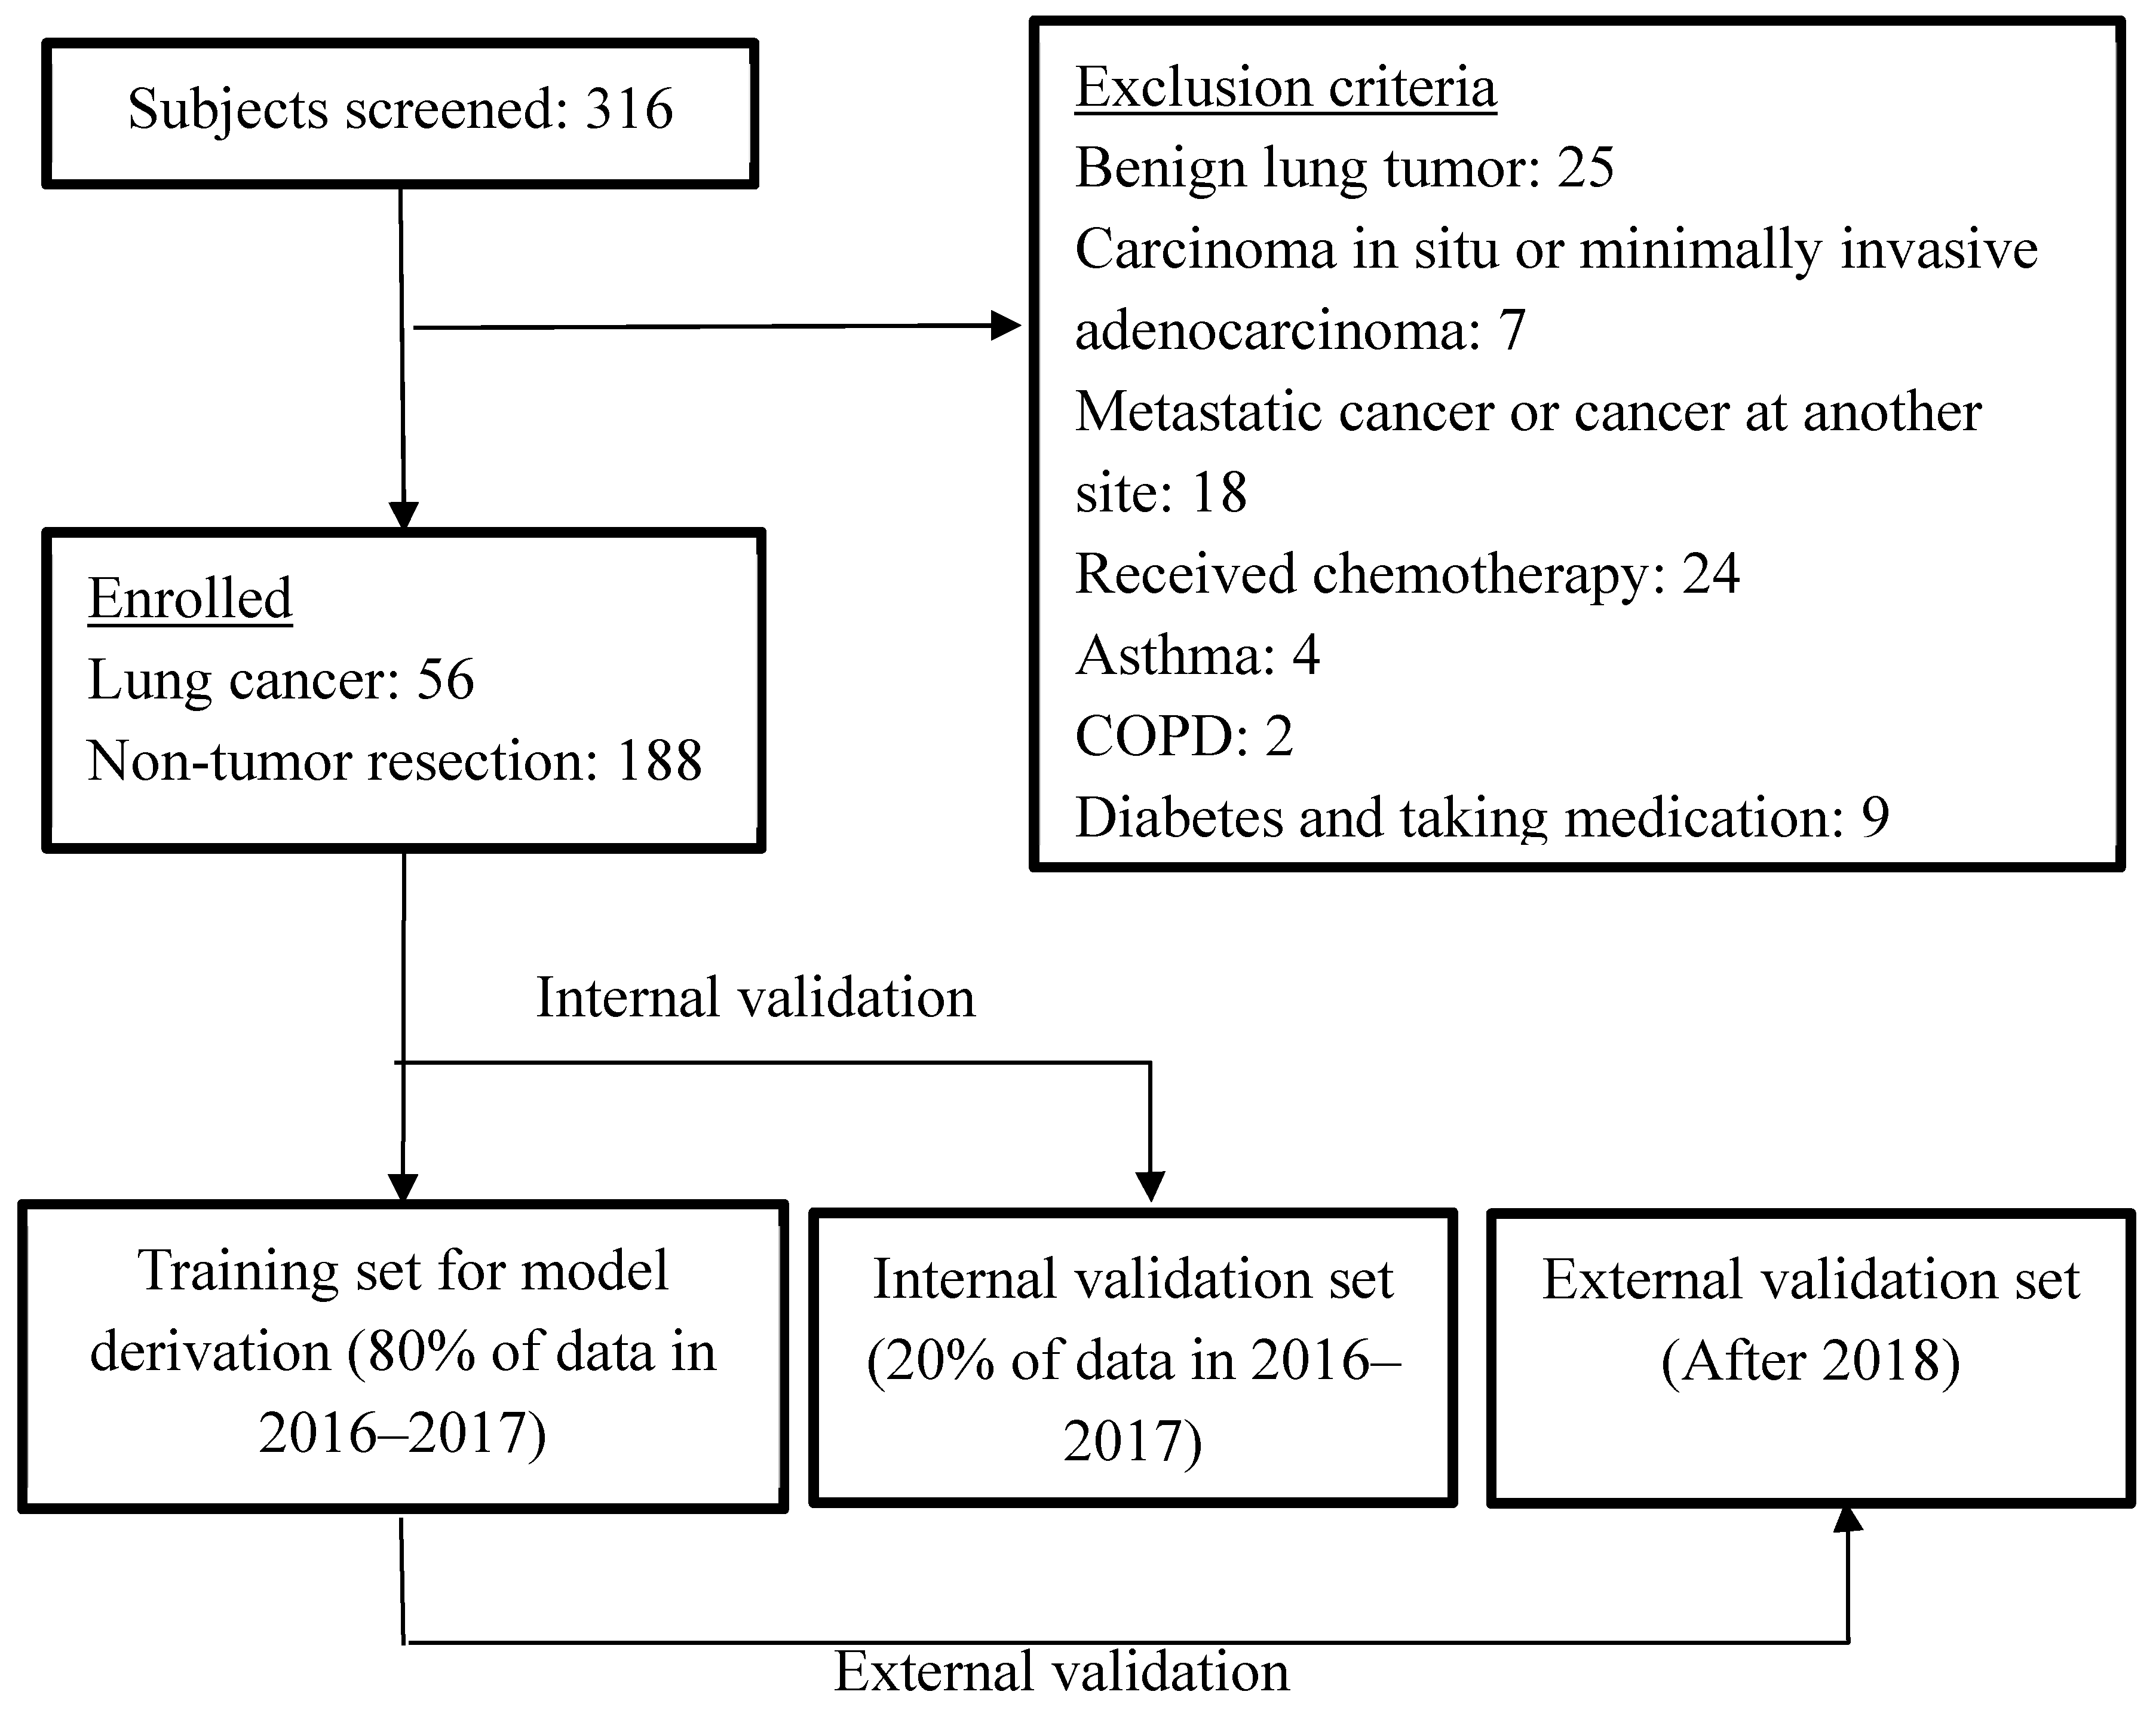
2.1. Participants
2.2. Exclusion Criteria
2.3. Test Methods
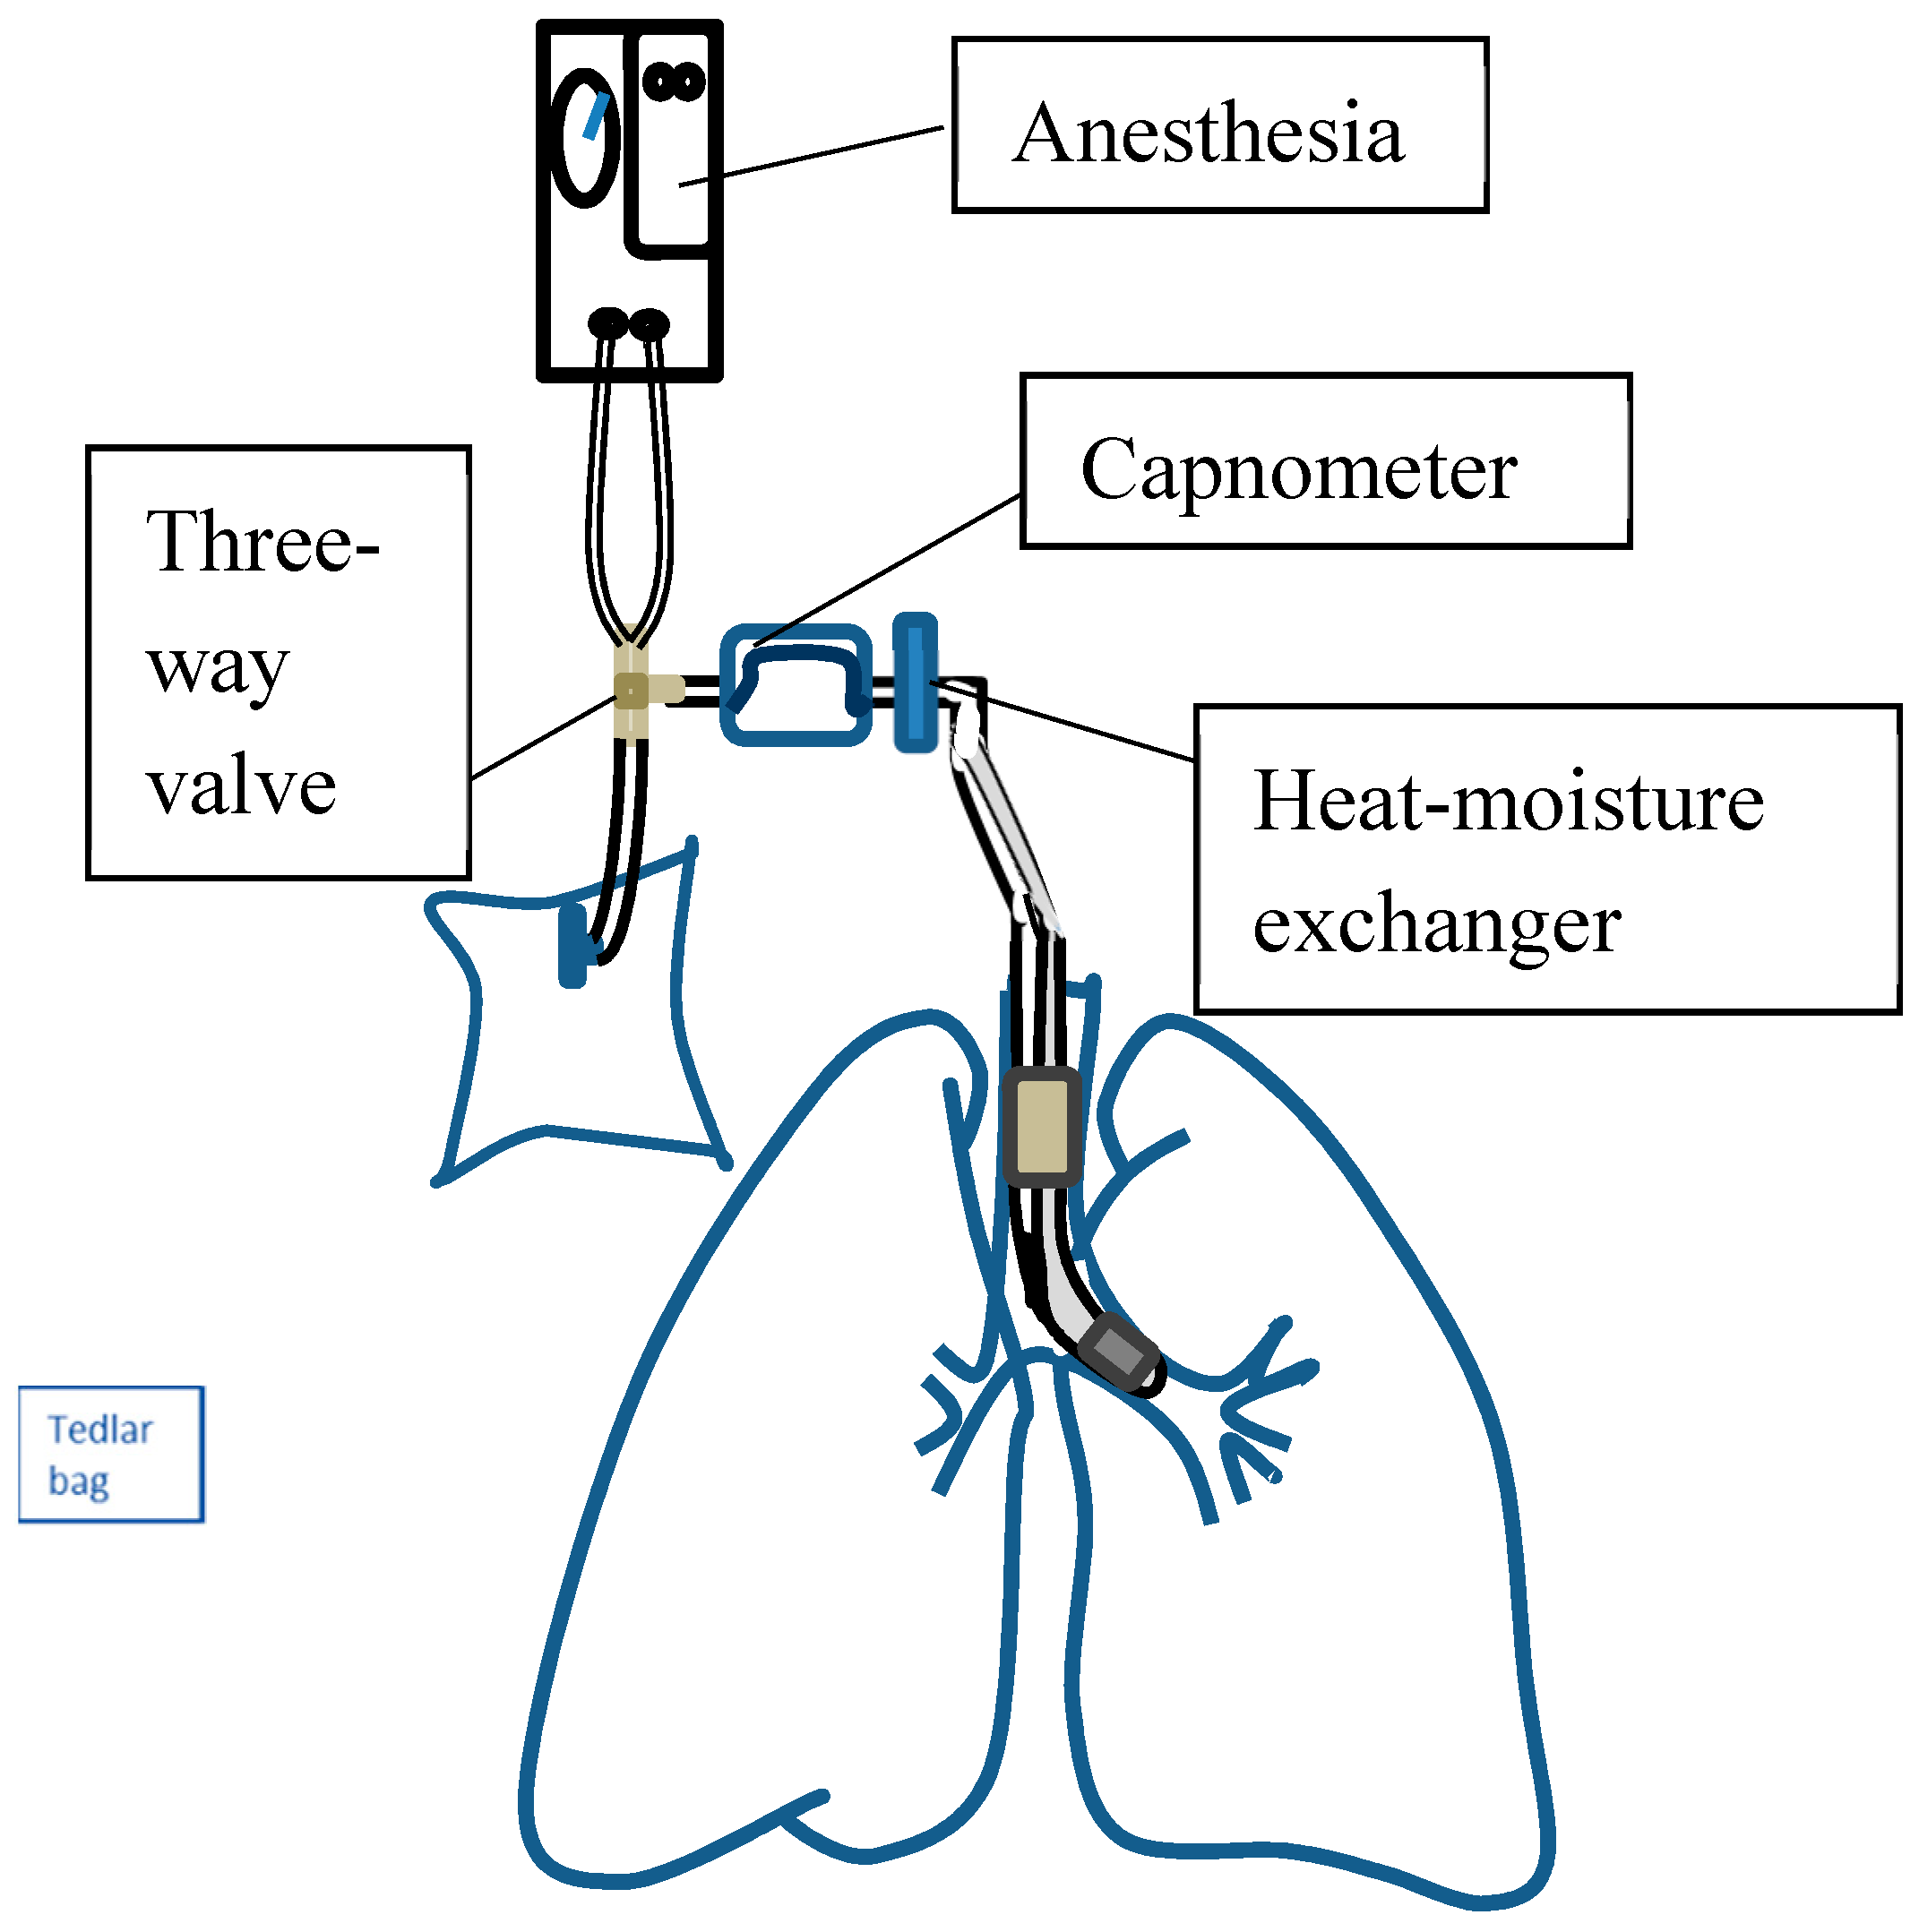
2.3.1. Collection of Alveolar Air Breath Samples
2.3.2. Measurement Set-Up
2.4. Sensors
2.5. Statistics
2.6. Sample Size Estimation
3. Results
4. Discussion
5. Conclusions
Supplementary Materials
Author Contributions
Funding
Acknowledgments
Conflicts of Interest
References
- World Health Organization. Cancer. Available online: http://www.who.int/mediacentre/factsheets/fs297/en/ (accessed on 26 October 2017).
- Oken, M.M.; Hocking, W.G.; Kvale, P.A.; Andriole, G.L.; Buys, S.S.; Church, T.R.; Crawford, E.D.; Fouad, M.N.; Isaacs, C.; Reding, D.J.; et al. Screening by chest radiograph and lung cancer mortality: The Prostate, Lung, Colorectal, and Ovarian (PLCO) randomized trial. JAMA 2011, 306, 1865–1873. [Google Scholar] [CrossRef] [PubMed]
- Gavelli, G.; Giampalma, E. Sensitivity and specificity of chest X-ray screening for lung cancer. Cancer 2000, 89, 2453–2456. [Google Scholar] [CrossRef]
- Moyer, V.A.; U.S. Preventive Services Task Force. Screening for lung cancer: U.S. Preventive Services Task Force recommendation statement. Ann. Intern. Med. 2014, 160, 330–338. [Google Scholar] [PubMed]
- Kalluri, U.; Naiker, M.; Myers, M.A. Cell culture metabolomics in the diagnosis of lung cancer—The influence of cell culture conditions. J. Breath Res. 2014, 8, 027109. [Google Scholar] [CrossRef] [PubMed]
- Hakim, M.; Broza, Y.Y.; Barash, O.; Peled, N.; Phillips, M.; Amann, A.; Haick, H. Volatile organic compounds of lung cancer and possible biochemical pathways. Chem. Rev. 2012, 112, 5949–5966. [Google Scholar] [CrossRef] [PubMed]
- Buszewski, B.; Ligor, T.; Jezierski, T.; Wenda-Piesik, A.; Walczak, M.; Rudnicka, J. Identification of volatile lung cancer markers by gas chromatography–mass spectrometry: Comparison with discrimination by canines. Anal. Bioanal. Chem. 2012, 404, 141–146. [Google Scholar] [CrossRef] [PubMed]
- Filipiak, W.; Filipiak, A.; Sponring, A.; Schmid, T.; Zelger, B.; Ager, C.; Klodzinska, E.; Denz, H.; Pizzini, A.; Lucciarini, P.; et al. Comparative analyses of volatile organic compounds (VOCs) from patients, tumors and transformed cell lines for the validation of lung cancer-derived breath markers. J. Breath Res. 2014, 8, 027111. [Google Scholar] [CrossRef] [PubMed]
- Gasparri, R.; Santonico, M.; Valentini, C.; Sedda, G.; Borri, A.; Petrella, F.; Maisonneuve, P.; Pennazza, G.; D’Amico, A.; Di Natale, C.; et al. Volatile signature for the early diagnosis of lung cancer. J. Breath Res. 2016, 10, 016007. [Google Scholar] [CrossRef] [PubMed]
- Schallschmidt, K.; Becker, R.; Jung, C.; Bremser, W.; Walles, T.; Neudecker, J.; Leschber, G.; Frese, S.; Nehls, I. Comparison of volatile organic compounds from lung cancer patients and healthy controls-challenges and limitations of an observational study. J. Breath Res. 2016, 10, 046007. [Google Scholar] [CrossRef] [PubMed]
- Wojnowski, W.; Majchrzak, T.; Dymerski, T.; Gebicki, J.; Namiesnik, J. Electronic noses: Powerful tools in meat quality assessment. Meat Sci. 2017, 131, 119–131. [Google Scholar] [CrossRef] [PubMed]
- Szulczyński, B.; Gębicki, J. Currently Commercially Available Chemical Sensors Employed for Detection of Volatile Organic Compounds in Outdoor and Indoor Air. Environments 2017, 4, 21. [Google Scholar] [CrossRef]
- Bossuyt, P.M.; Reitsma, J.B.; Bruns, D.E.; Gatsonis, C.A.; Glasziou, P.P.; Irwig, L.M.; Lijmer, J.G.; Moher, D.; Rennie, D.; de Vet, H.C.; et al. Towards complete and accurate reporting of studies of diagnostic accuracy: The STARD initiative. Standards for Reporting of Diagnostic Accuracy. Clin. Chem. Lab. Med. 2003, 41, 68–73. [Google Scholar] [CrossRef] [PubMed]
- Edge, S.B.; Compton, C.C. The American Joint Committee on Cancer: The 7th edition of the AJCC cancer staging manual and the future of TNM. Ann. Surg. Oncol. 2010, 17, 1471–1474. [Google Scholar] [CrossRef] [PubMed]
- Wu, S.G.; Liu, Y.N.; Tsai, M.F.; Chang, Y.L.; Yu, C.J.; Yang, P.C.; Yang, J.C.; Wen, Y.F.; Shih, J.Y. The mechanism of acquired resistance to irreversible EGFR tyrosine kinase inhibitor-afatinib in lung adenocarcinoma patients. Oncotarget 2016, 7, 12404–12413. [Google Scholar] [CrossRef] [PubMed] [Green Version]
- Schubert, J.K.; Spittler, K.H.; Braun, G.; Geiger, K.; Guttmann, J. CO2-controlled sampling of alveolar gas in mechanically ventilated patients. J. Appl. Physiol. 2001, 90, 486–492. [Google Scholar] [CrossRef] [PubMed]
- Wang, T.; Pysanenko, A.; Dryahina, K.; Spanel, P.; Smith, D. Analysis of breath, exhaled via the mouth and nose, and the air in the oral cavity. J. Breath Res. 2008, 2, 037013. [Google Scholar] [CrossRef] [PubMed]
- Bikov, A.; Hernadi, M.; Korosi, B.Z.; Kunos, L.; Zsamboki, G.; Sutto, Z.; Tarnoki, A.D.; Tarnoki, D.L.; Losonczy, G.; Horvath, I. Expiratory flow rate, breath hold and anatomic dead space influence electronic nose ability to detect lung cancer. BMC Pulm. Med. 2014, 14, 202. [Google Scholar] [CrossRef] [PubMed] [Green Version]
- Miekisch, W.; Schubert, J.K.; Noeldge-Schomburg, G.F. Diagnostic potential of breath analysis—Focus on volatile organic compounds. Clin. Chim. Acta 2004, 347, 25–39. [Google Scholar] [CrossRef] [PubMed]
- Bofan, M.; Mores, N.; Baron, M.; Dabrowska, M.; Valente, S.; Schmid, M.; Trove, A.; Conforto, S.; Zini, G.; Cattani, P.; et al. Within-day and between-day repeatability of measurements with an electronic nose in patients with COPD. J. Breath Res. 2013, 7, 017103. [Google Scholar] [CrossRef] [PubMed]
- Lu, Y.; Partridge, C.; Meyyappan, M.; Li, J. A carbon nanotube sensor array for sensitive gas discrimination using principal component analysis. J. Electroanal. Chem. 2006, 593, 105–110. [Google Scholar] [CrossRef]
- Lampson, B.D.; Han, Y.J.; Khalilian, A.; Greene, J.K.; Degenhardt, D.C.; Hallstrom, J.O. Development of a portable electronic nose for detection of pests and plant damage. Comput. Electron. Agric. 2014, 108, 87–94. [Google Scholar] [CrossRef]
- Lewis, N.S. Comparisons between Mammalian and Artificial Olfaction Based on Arrays of Carbon Black−Polymer Composite Vapor Detectors. Acc. Chem. Res. 2004, 37, 663–672. [Google Scholar] [CrossRef] [PubMed]
- Venables, W.N. Modern Applied Statistics with S; Springer Science & Business Media: New York, NY, USA, 2002; pp. 183–206. [Google Scholar]
- Karatzoglou, A.; Smola, A.; Hornik, K.; Zeileis, A. kernlab-an S4 package for kernel methods in R. J. Stat. Softw. 2004, 11, 1–20. [Google Scholar] [CrossRef]
- Dragonieri, S.; Quaranta, V.N.; Carratu, P.; Ranieri, T.; Resta, O. Influence of age and gender on the profile of exhaled volatile organic compounds analyzed by an electronic nose. J. Bras. Pneumol. 2016, 42, 143–145. [Google Scholar] [CrossRef] [PubMed] [Green Version]
- Ransohoff, D.F.; Feinstein, A.R. Problems of spectrum and bias in evaluating the efficacy of diagnostic tests. N. Engl. J. Med. 1978, 299, 926–930. [Google Scholar] [CrossRef] [PubMed]
- Willis, B.H. Empirical evidence that disease prevalence may affect the performance of diagnostic tests with an implicit threshold: A cross-sectional study. BMJ Open 2012, 2, e000746. [Google Scholar] [CrossRef] [PubMed]
- Marco, S. The need for external validation in machine olfaction: Emphasis on health-related applications. Anal. Bioanal. Chem. 2014, 406, 3941. [Google Scholar] [CrossRef] [PubMed]
- Peng, G.; Trock, E.; Haick, H. Detecting simulated patterns of lung cancer biomarkers by random network of single-walled carbon nanotubes coated with nonpolymeric organic materials. Nano Lett. 2008, 8, 3631–3635. [Google Scholar] [CrossRef] [PubMed]
- Weir, J.P. Quantifying test-retest reliability using the intraclass correlation coefficient and the SEM. J. Strength Cond. Res. 2005, 19, 231–240. [Google Scholar] [PubMed]
- Bruton, A.; Conway, J.H.; Holgate, S.T. Reliability: What is it, and how is it measured? Physiotherapy 2000, 86, 94–99. [Google Scholar] [CrossRef]
- Lourenco, C.; Turner, C. Breath analysis in disease diagnosis: Methodological considerations and applications. Metabolites 2014, 4, 465–498. [Google Scholar] [CrossRef] [PubMed]
- Horvath, I.; Barnes, P.J.; Loukides, S.; Sterk, P.J.; Hogman, M.; Olin, A.C.; Amann, A.; Antus, B.; Baraldi, E.; Bikov, A.; et al. A European Respiratory Society technical standard: Exhaled biomarkers in lung disease. Eur. Respir. J. 2017, 49, 1600965. [Google Scholar] [CrossRef] [PubMed]
- Mochalski, P.; Wzorek, B.; Sliwka, I.; Amann, A. Suitability of different polymer bags for storage of volatile sulphur compounds relevant to breath analysis. J. Chromatogr. B 2009, 877, 189–196. [Google Scholar] [CrossRef] [PubMed]
- Kischkel, S.; Miekisch, W.; Fuchs, P.; Schubert, J.K. Breath analysis during one-lung ventilation in cancer patients. Eur. Respir. J. 2012, 40, 706–713. [Google Scholar] [CrossRef] [PubMed] [Green Version]
- Wang, C.; Dong, R.; Wang, X.; Lian, A.; Chi, C.; Ke, C.; Guo, L.; Liu, S.; Zhao, W.; Xu, G.; et al. Exhaled volatile organic compounds as lung cancer biomarkers during one-lung ventilation. Sci. Rep. 2014, 4, 7312. [Google Scholar] [CrossRef] [PubMed] [Green Version]
- Amorim, L.C.A.; Cardeal, Z.D.L. Breath air analysis and its use as a biomarker in biological monitoring of occupational and environmental exposure to chemical agents. J. Chromatogr. B 2007, 853, 1–9. [Google Scholar] [CrossRef] [PubMed]
- Capuano, R.; Santonico, M.; Pennazza, G.; Ghezzi, S.; Martinelli, E.; Roscioni, C.; Lucantoni, G.; Galluccio, G.; Paolesse, R.; Di Natale, C.; et al. The lung cancer breath signature: A comparative analysis of exhaled breath and air sampled from inside the lungs. Sci. Rep. 2015, 5, 16491. [Google Scholar] [CrossRef] [PubMed]
- Amann, A.; Corradi, M.; Mazzone, P.; Mutti, A. Lung cancer biomarkers in exhaled breath. Expert Rev. Mol. Diagn. 2011, 11, 207–217. [Google Scholar] [CrossRef] [PubMed]
- Smolinska, A.; Hauschild, A.C.; Fijten, R.R.; Dallinga, J.W.; Baumbach, J.; van Schooten, F.J. Current breathomics—A review on data pre-processing techniques and machine learning in metabolomics breath analysis. J. Breath Res. 2014, 8, 027105. [Google Scholar] [CrossRef] [PubMed]
- Saalberg, Y.; Wolff, M. VOC breath biomarkers in lung cancer. Clin. Chim. Acta 2016, 459, 5–9. [Google Scholar] [CrossRef] [PubMed]
- Kalantar-Zadeh, K.; Ha, N.; Ou, J.Z.; Berean, K.J. Ingestible Sensors. ACS Sens. 2017, 2, 468–483. [Google Scholar] [CrossRef] [PubMed]


| Characteristics | Lung Cancer Cases (n = 56) | Non-Tumour Controls (n = 188) |
|---|---|---|
| Age (year), mean (SD) | 65.3 (8.8) | 53.5 (16.1) |
| Male, no. (%) | 12 (21.4) | 106 (56.4) |
| Cigarette smoking | ||
| Pack-years, mean (SD) | 21.0 (10.7) | 20.6(18.3) |
| Smoking status | ||
| Current smokers, no. (%) | 2 (3.6) | 25 (13.3) |
| Former smokers, no. (%) | 8 (14.3) | 11 (5.9) |
| Never smoked, no. (%) a | 44 (78.6) | 150 (79.8) |
| Second-hand smokers (%) | 2 (3.6) | 2 (1.1) |
| Tumour histological type | ||
| Squamous cell carcinoma, no. (%) | 1 (1.8%) | |
| Adenocarcinoma, no. (%) | 52 (92.9%) | |
| Small cell lung cancer, no. (%) | 1 (1.8%) | |
| Other carcinomas, no. (%) | 2 (3.6%) | |
| Clinical stage | ||
| I | 37 (66.1%) | |
| II | 7 (12.5%) | |
| III | 11 (19.6%) | |
| IV | 1 (1.8%) | |
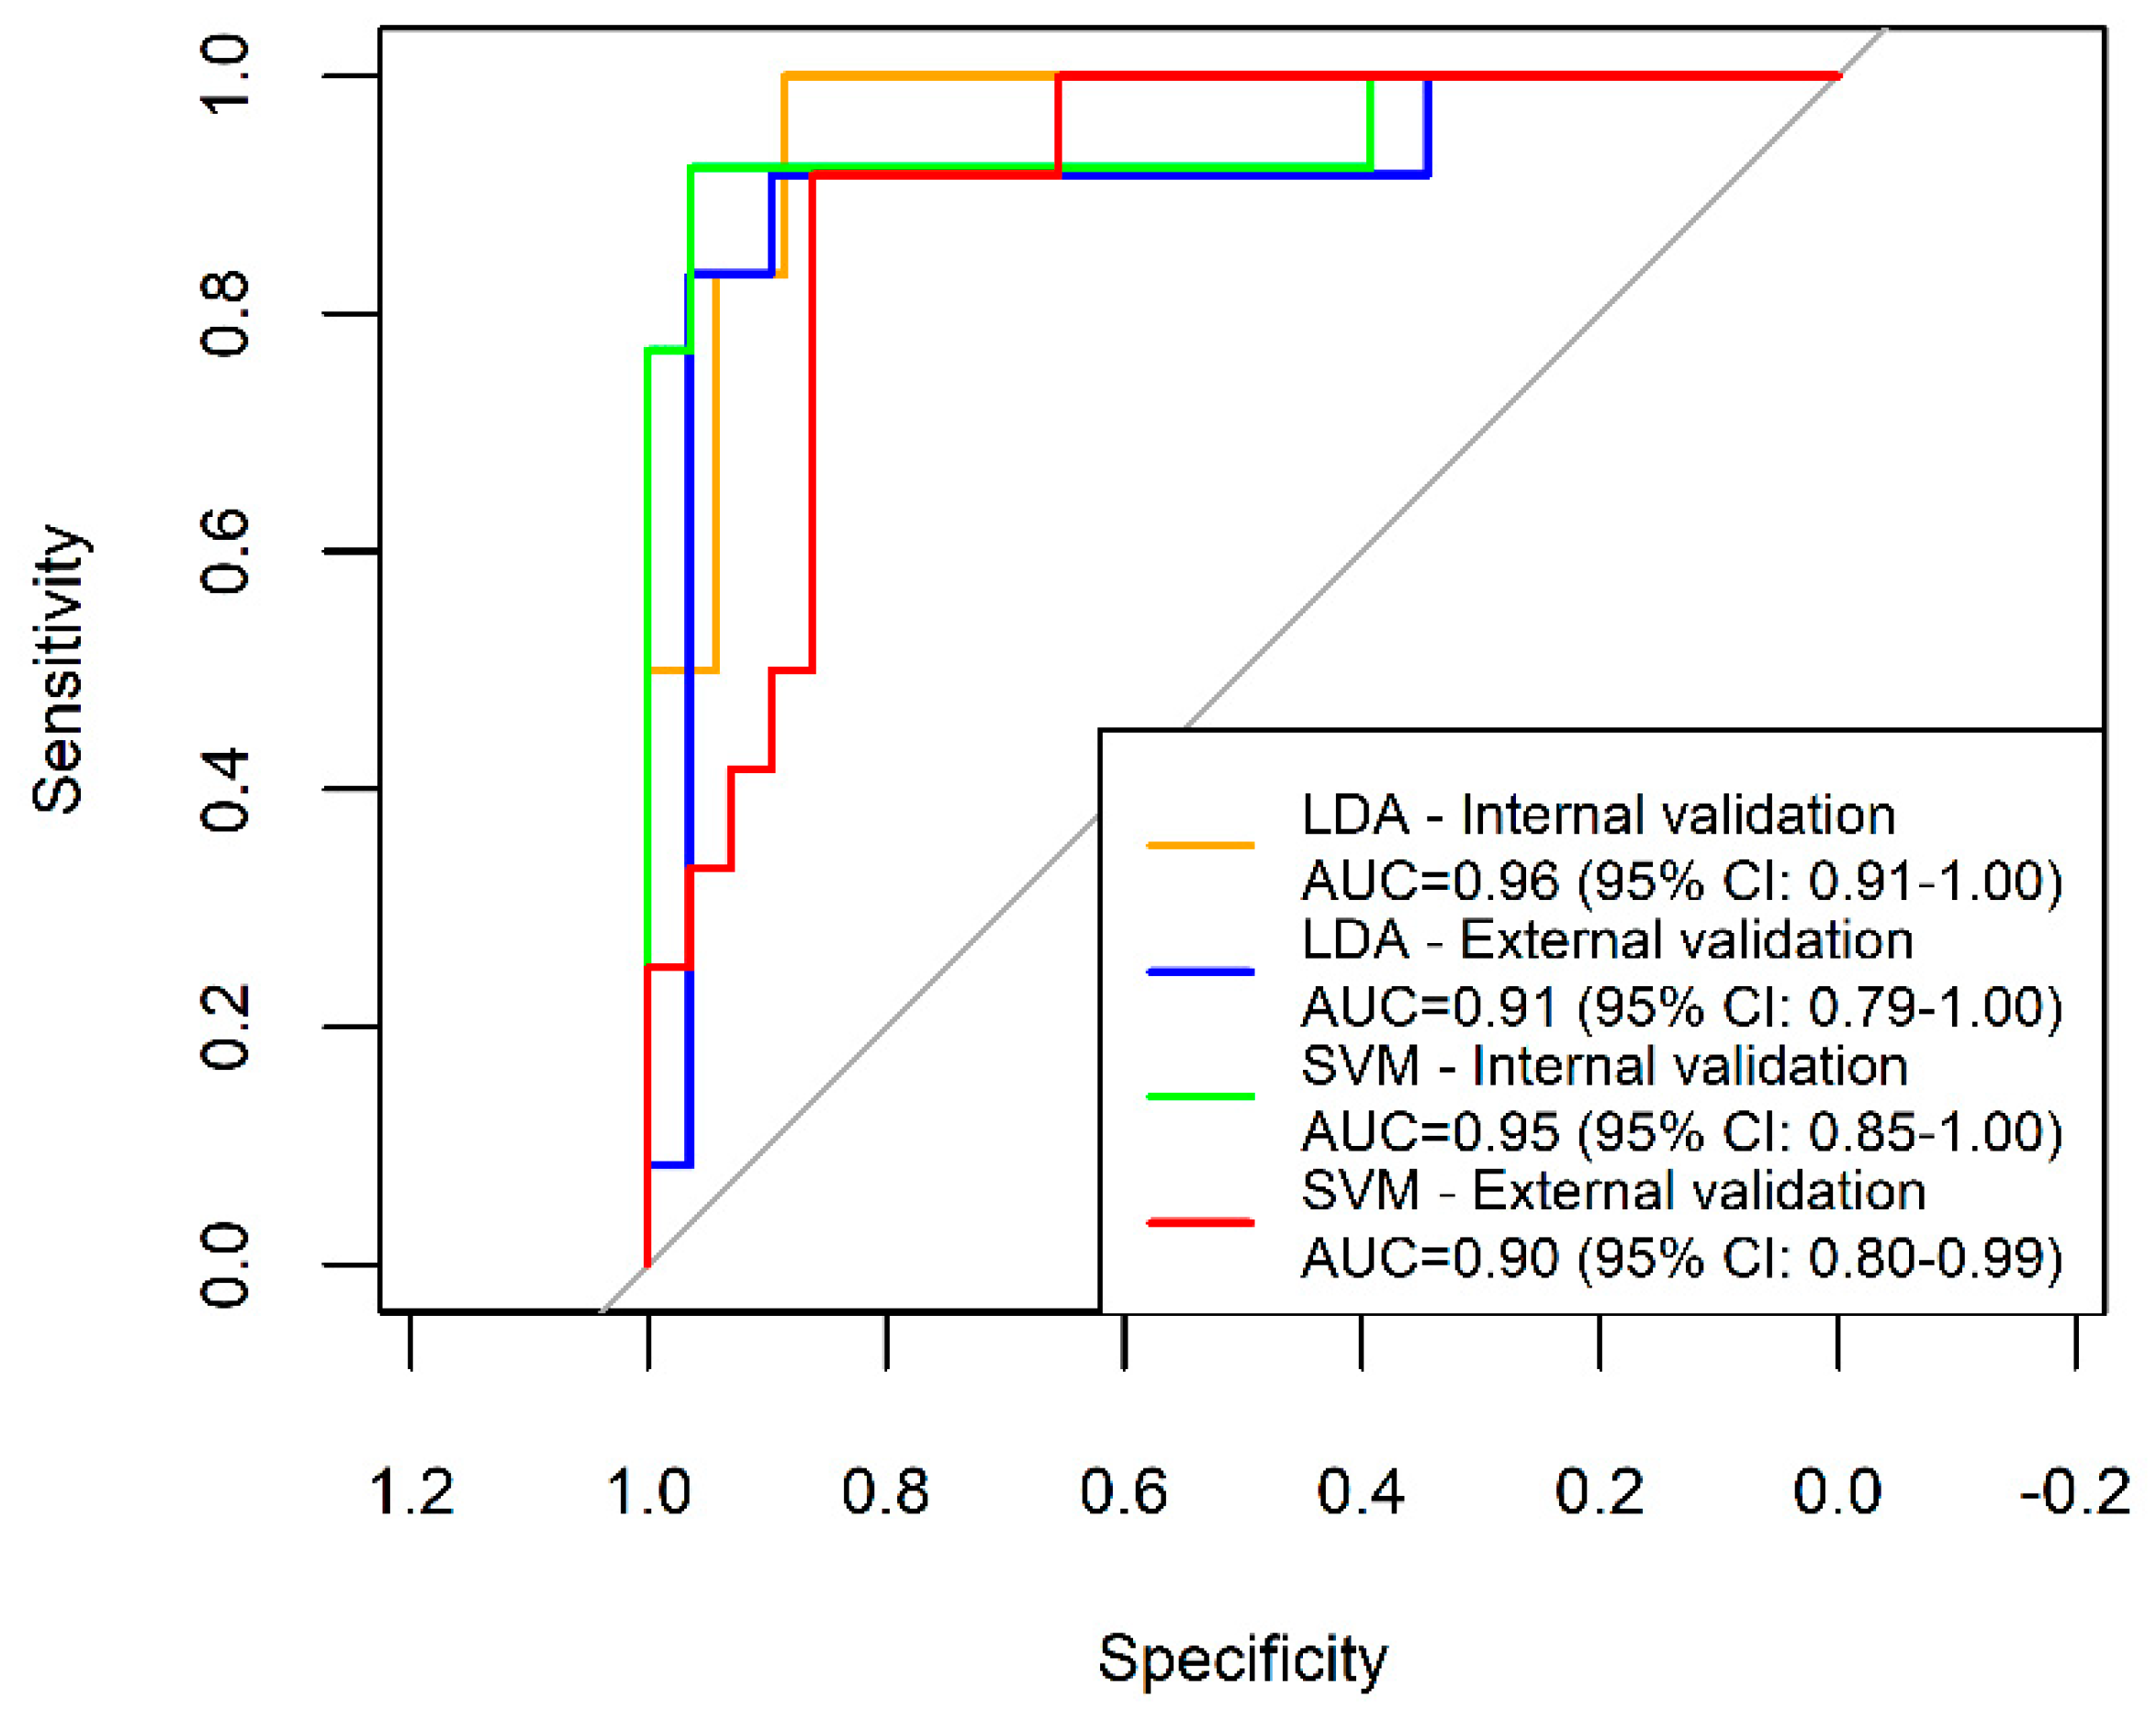
| Model | Sensitivity | Specificity | PPV | NPV | FP | FN | Accuracy |
|---|---|---|---|---|---|---|---|
| LDA internal validation | 100.0% | 88.6% | 60.0% | 100.0% | 12.4% | 0.0% | 90.2% |
| LDA external validation | 75.0% | 96.6% | 90.0% | 90.3% | 3.4% | 25.0% | 85.4% |
| SVM internal validation | 92.3% | 92.9% | 85.7% | 96.3% | 7.1% | 7.7% | 92.7% |
| SVM external validation | 83.3% | 86.2% | 71.4% | 92.6% | 13.8% | 16.7% | 85.4% |
© 2018 by the authors. Licensee MDPI, Basel, Switzerland. This article is an open access article distributed under the terms and conditions of the Creative Commons Attribution (CC BY) license (http://creativecommons.org/licenses/by/4.0/).
Share and Cite
Huang, C.-H.; Zeng, C.; Wang, Y.-C.; Peng, H.-Y.; Lin, C.-S.; Chang, C.-J.; Yang, H.-Y. A Study of Diagnostic Accuracy Using a Chemical Sensor Array and a Machine Learning Technique to Detect Lung Cancer. Sensors 2018, 18, 2845. https://doi.org/10.3390/s18092845
Huang C-H, Zeng C, Wang Y-C, Peng H-Y, Lin C-S, Chang C-J, Yang H-Y. A Study of Diagnostic Accuracy Using a Chemical Sensor Array and a Machine Learning Technique to Detect Lung Cancer. Sensors. 2018; 18(9):2845. https://doi.org/10.3390/s18092845
Chicago/Turabian StyleHuang, Chi-Hsiang, Chian Zeng, Yi-Chia Wang, Hsin-Yi Peng, Chia-Sheng Lin, Che-Jui Chang, and Hsiao-Yu Yang. 2018. "A Study of Diagnostic Accuracy Using a Chemical Sensor Array and a Machine Learning Technique to Detect Lung Cancer" Sensors 18, no. 9: 2845. https://doi.org/10.3390/s18092845