An Impedimetric Biosensor Based on Ionic Liquid-Modified Graphite Electrodes Developed for microRNA-34a Detection


Abstract
:
1. Introduction
2. Materials and Methods
2.1. Apparatus
2.2. Chemicals
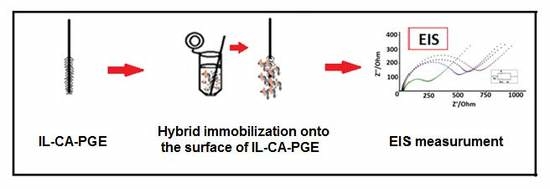
2.3. Procedure
- (i)
- pretreatment of PGE (+1.4 V, 30 s)
- (ii)
- chemical activation of PGE surface using covalent agents (CA)
- (iii)
- IL modification onto CA/PGE surfaces
- (iv)
- characterization of IL/CA/PGEs
- (v)
- hybridization of miRNA-34a specific DNA probe with miRNA-34a RNA target, or non-complementary RNAs (miRNA-155/miRNA-181b)
- (vi)
- immobilization of hybrid onto the surface of IL/CA modified electrode
- (vii)
- electrochemical measurement
2.3.1. Preparation of CA Solution and Formation of Chemically Activated PGEs
2.3.2. Modification of IL onto the Surface of CA/PGEs
2.3.3. Microscopic Characterization of the Electrodes by Scanning Electron Microscopy (SEM)
2.3.4. Hybridization of miRNA-34a Specific DNA Probe with miRNA-34a Target or Non-Complementary miRNAs
2.3.5. Immobilization of DNA-RNA Hybrids onto the Surface of IL/CA/PGEs
2.3.6. Cyclic Voltammetry Measurements
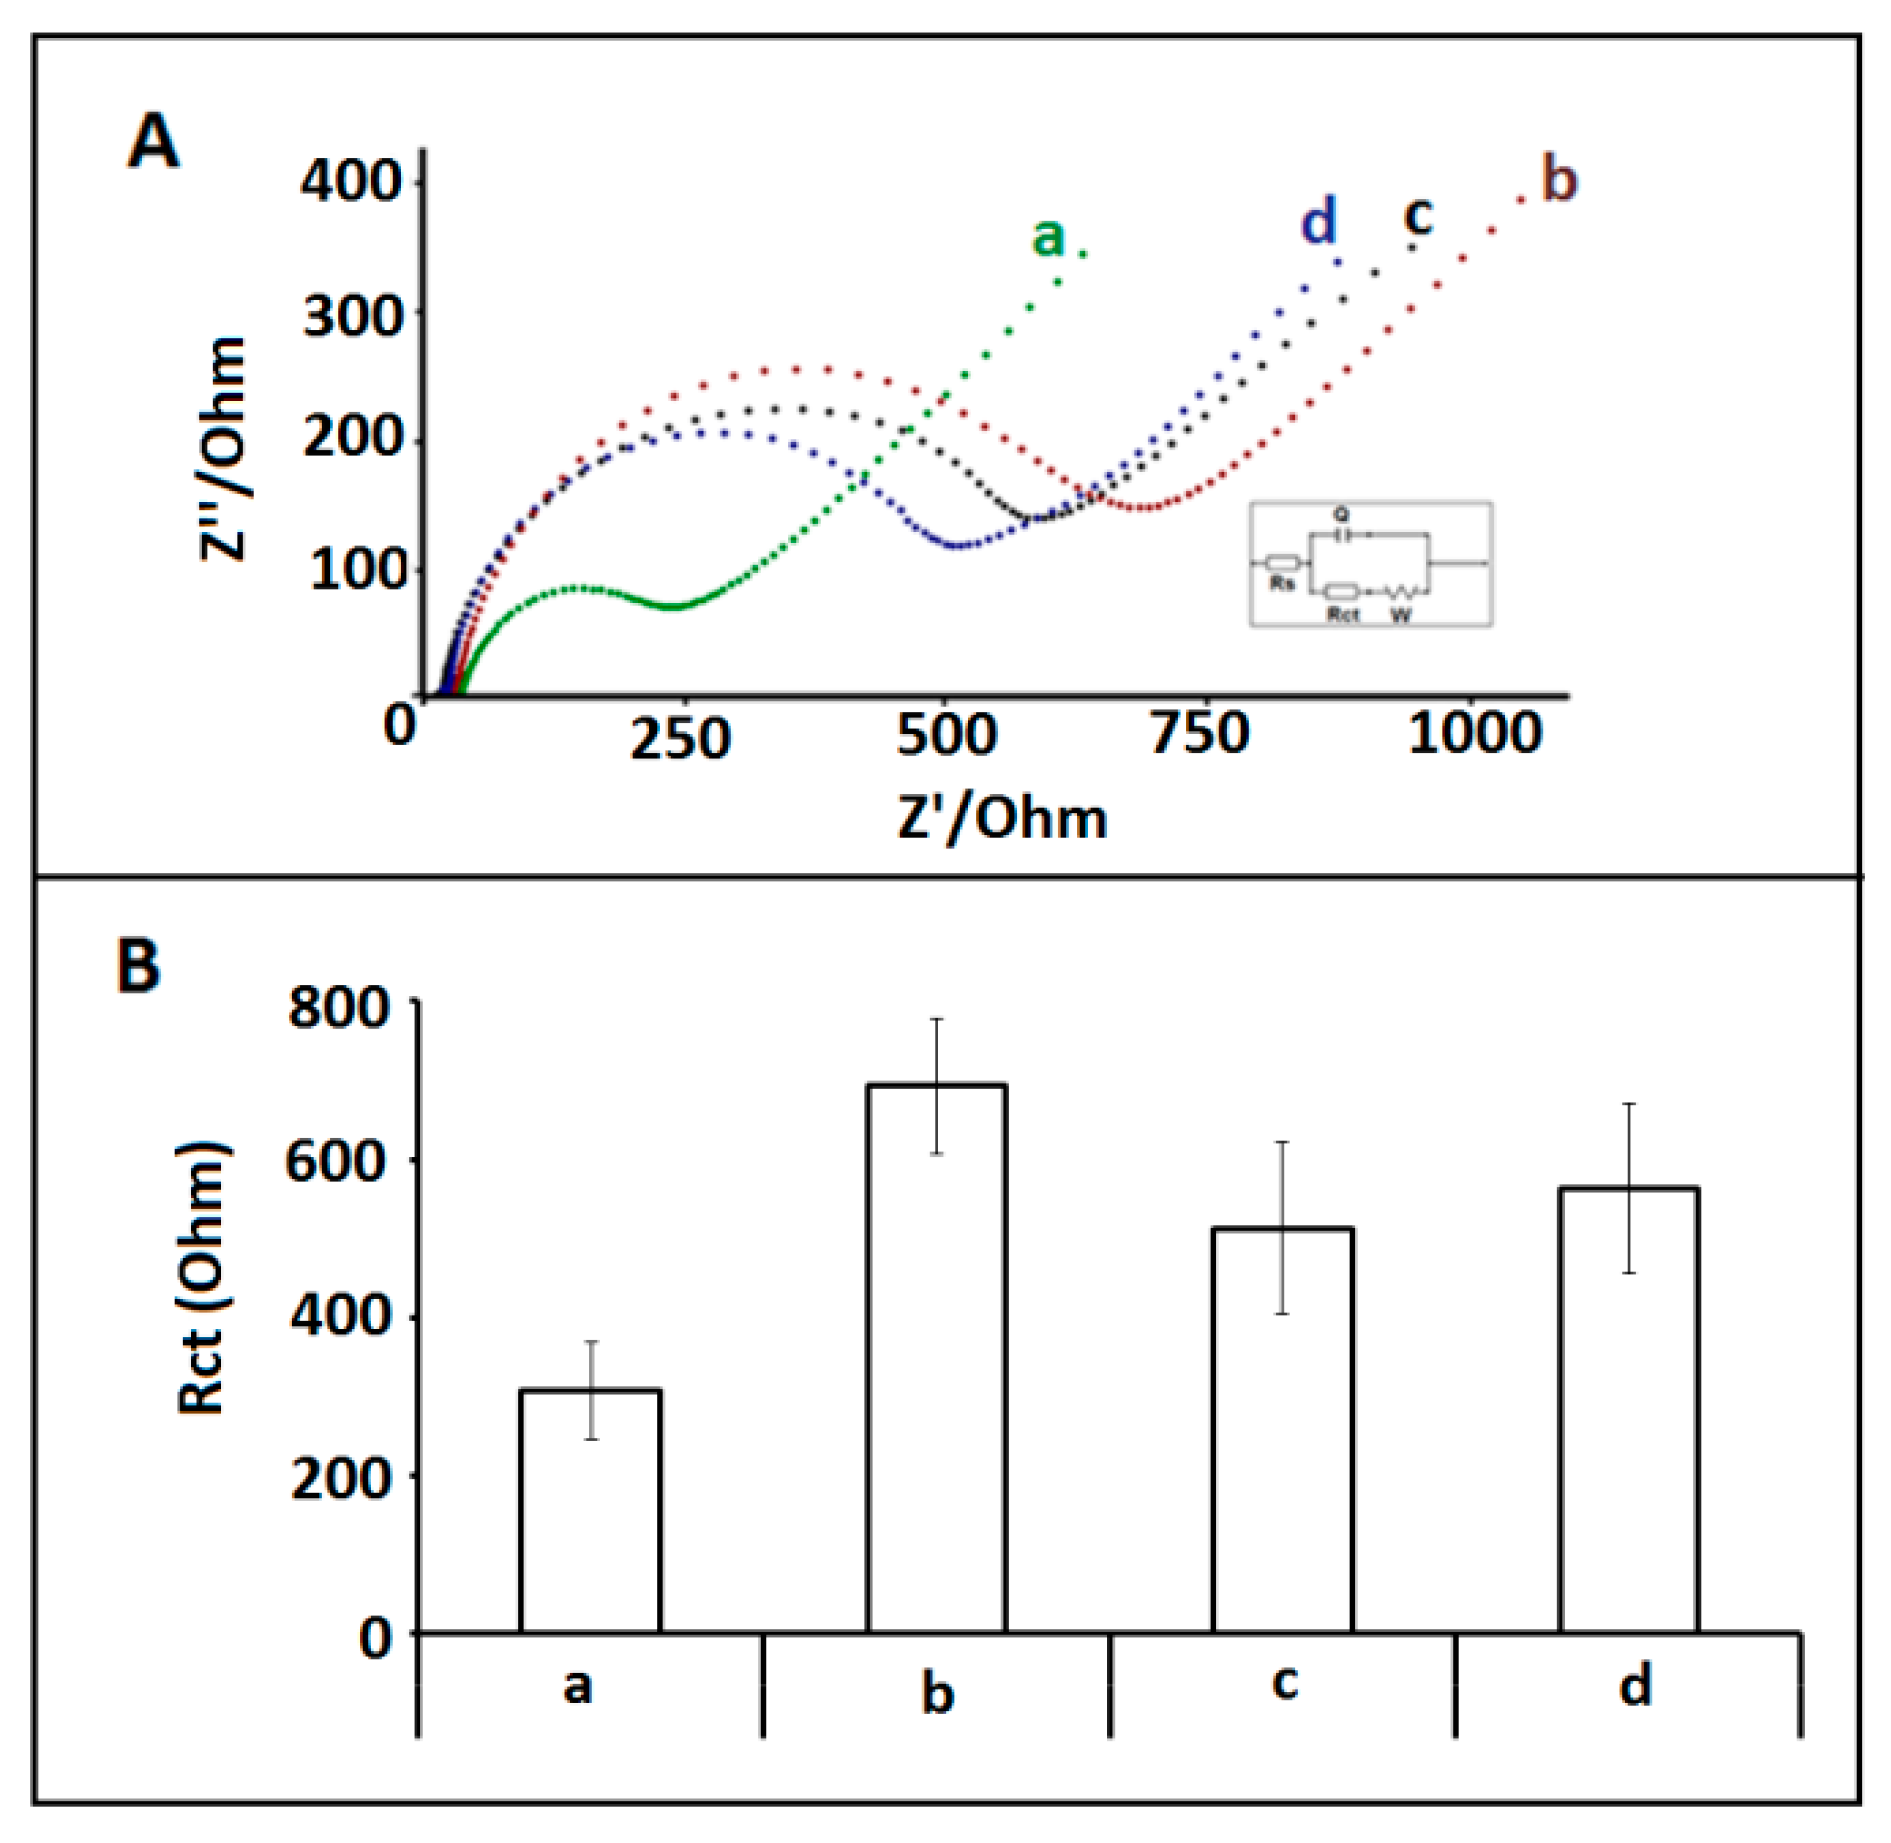
2.3.7. Impedimetric Measurements
3. Results and Discussion
4. Conclusions
Supplementary Materials
Author Contributions
Funding
Acknowledgments
Conflicts of Interest
References
- Wang, J.; Kawde, A.N. Pencil-based renewable biosensor for label-free electrochemical detection of DNA hybridization. Anal. Chim. Acta 2001, 431, 219–224. [Google Scholar] [CrossRef]
- Palecek, E.; Bartosik, M. Electrochemistry of nucleic acids. Chem. Rev. 2012, 112, 3427–3481. [Google Scholar] [CrossRef] [PubMed]
- Lu, C.-H.; Willner, B.; Willner, I. DNA nanotechnology: From sensing and DNA machines to drug-delivery systems. ACS Nanotechnol. 2013, 7, 8320–8332. [Google Scholar] [CrossRef] [PubMed]
- Ping, J.; Wang, Y.; Fan, K.; Wu, J.; Ying, Y. Direct electrochemical reduction of graphene oxide on ionic liquid doped screen-printedelectrode and its electrochemical biosensing applications. Biosens. Bioelectron. 2011, 28, 204–209. [Google Scholar] [CrossRef] [PubMed]
- Espinoza-Castañeda, M.; de la Escosura-Munñiz, A.; Merkoçi, A. Nanoparticle/nanochannels-based electrochemical biosensors. In Electrospinning for High Performance Sensors; Springer International Publishing: Cham, Switzerland, 2015; pp. 205–223. [Google Scholar]
- Erdem, A. Nanomaterial based electrochemical DNA sensing strategies. Talanta 2007, 74, 318–325. [Google Scholar] [CrossRef] [PubMed]
- Erdem, A.; Muti, M.; Mese, F.; Eksin, E. Chitosan-ionic liquid modified single-use sensor for electrochemical monitoring of sequence-selective DNA hybridization. Colloids Surf. B 2014, 114, 261–268. [Google Scholar] [CrossRef] [PubMed]
- Yu, P.; Lin, Y.; Xiang, L.; Su, L.; Zhang, J.; Mao, L. Molecular films of water-miscible ionic liquids formed onto glassy carbon electrode: characterization and electrochemical applications. Langmuir 2005, 21, 9000–9006. [Google Scholar] [CrossRef] [PubMed]
- Wei, D.; Ivaska, A. Applications of ionic liquids in electrochemical sensors. Anal. Chim. Acta 2008, 607, 126–135. [Google Scholar] [CrossRef] [PubMed]
- Wei, Z.L.; Li, Z.J.; Sun, X.L.; Fang, Y.J.; Liu, J.K. Synergistic contributions of fullerene, ferrocene, chitosan and ionic liquid towards improved performance for a glucose sensor. Biosens. Bioelectron. 2010, 25, 1434–1438. [Google Scholar]
- Zhang, Y.; Liu, Y.; Chu, Z.; Shi, S.; Jin, W. Amperometric glucose biosensor based on direct assembly of Prussian blue film with ionic liquid-chitosan matrix assisted enzyme immobilization. Sens. Actuators B Chem. 2013, 176, 978–984. [Google Scholar] [CrossRef]
- Xi, F.; Liu, L.; Wu, Q.; Lin, X. One-step construction of biosensor based on chitosan-ionic liquid-horseradish peroxidase biocomposite formed by electrodeposition. Biosens. Bioelectron. 2008, 24, 29–34. [Google Scholar] [CrossRef] [PubMed]
- Eksin, E.; Muti, M.; Erdem, A. Chitosan/Ionic liquid composite electrode for electrochemical monitoring of the surface-confined interaction between mitomycin C and DNA. Electroanalysis 2013, 25, 1–9. [Google Scholar] [CrossRef]
- She, Y.; Tang, Y.; Liu, H.; He, P. Electrochemical determination of hydroquinone using hydrophobic ionic liquid-type carbon paste electrodes. Chem. Cent. J. 2010, 4, 17–25. [Google Scholar] [CrossRef] [PubMed]
- Ren, R.; Leng, C.; Zhang, S. A chronocoulometric DNA sensor based on screen-printed electrode doped with ionic liquid and polyaniline nanotubes. Biosens. Bioelectron. 2010, 25, 2089–2094. [Google Scholar] [CrossRef] [PubMed]
- Sengiz, C.; Congur, C.; Erdem, A. Development of Ionic Liquid Modified Disposable Graphit Electrodes for Label-Free Electrochemical Detection of DNA Hybridization Related to Microcystis spp. Sensors 2015, 15, 22737–22749. [Google Scholar] [CrossRef] [PubMed]
- Bernstein, E.; Kim, S.Y.; Carmell, M.A.; Murchison, E.P.; Alcorn, H.; Li, M.Z.; Mills, A.A.; Elledge, S.J.; Anderson, K.V.; Hannon, G.J. Dicer is essential for mouse development. Nat. Genet. 2003, 35, 215–217. [Google Scholar] [CrossRef] [PubMed]
- Wienholds, E.; Kloosterman, W.P.; Miska, E.; Alvarez-Saavedra, E.; Berezikov, E.; de Bruijn, E.; Horvitz, R.H.; Kauppinen, S.; Plasterk, R.H. MicroRNA expression in zebrafish embryonic development. Science 2005, 309, 310–311. [Google Scholar] [CrossRef] [PubMed]
- Hunt, E.A.; Goulding, A.M.; Deo, S.K. Direct detection and quantification of microRNAs. Anal. Biochem. 2009, 387, 1–12. [Google Scholar] [CrossRef] [Green Version]
- Tüfekci, K.U.; Öner, M.G.; Meuwissen, R.L.J.; Genç, Ş. The Role of MicroRNAs in Human Diseases. In miRNomics: MicroRNA Biology and Computational Analysis. Methods in Molecular Biology (Methods and Protocols); Yousef, M., Allmer, J., Eds.; Humana Press: Totowa, NJ, USA, 2014; Volume 1107, pp. 33–50. [Google Scholar]
- Jin, H.Y.; Xiao, C. MicroRNA Mechanisms of Action: What have We Learned from Mice? Front. Genet. 2015. [Google Scholar] [CrossRef] [PubMed]
- Waldman, S.A.; Terzic, A. Applications of microRNA in cancer: Exploring the advantages of miRNA. Clin. Transl. Sci. 2009, 2, 248–249. [Google Scholar] [CrossRef] [PubMed]
- Bettazzi, F.; Hamid-Asl, E.; Esposito, C.L.; Quintavalle, C.; Formisano, N.; Laschi, S.; Catuogno, S.; Iaboni, M.; Marrazza, G.; Mascini, M.; et al. Electrochemical detection of miRNA-222 by use of a magnetic bead-based bioassay. Anal. Bioanal. Chem. 2013, 405, 1025–1034. [Google Scholar] [CrossRef] [PubMed]
- Da Costa Martins, P.A.; Leptidis, S.; Salic, K.; De Windt, L.J. MicroRNA regulation in cardiovascular disease. In Currebt Drug Targets; Bentham Science Publishers: Emirate of Sharjah, UAE, 2010; Volume 11, pp. 900–906. [Google Scholar]
- Schonrock, N.; Matamales, M.; Ittner, L.M.; Götz, J. MicroRNA networks surrounding APP and amyloid-β metabolism-implications for Alzheimer’s disease. Exp. Neurol. 2012, 235, 447–454. [Google Scholar] [CrossRef] [PubMed] [Green Version]
- Kilic, T.; Erdem, A.; Ozsoz, M.; Carrara, S. microRNA biosensors: Opportunities and challenges among conventional and commercially available techniques. Biosens. Bioelectron. 2018, 99, 525–546. [Google Scholar] [CrossRef] [PubMed]
- Munoz, J.; Montes, R.; Baeza, M. Trends in electrochemical impedance spectroscopy involving nanocomposite transducers: Characterization, architecture surface and bio-sensing. TrAC Trends Anal. Chem. 2017, 97, 201–215. [Google Scholar] [CrossRef]
- Cogswell, J.P.; Taylor, J.I.A.; Waters, M.; Shi, Y.; Cannon, B.; Kelnar, K.; Kemppainen, J.; Brown, D.; Chen, C.; Prinjha, R.K.; et al. Identification of miRNA changes in Alzheimer’s disease brain and CSF yields putative biomarkers and insights into disease pathways. J. Alzheimer’s Dis. 2008, 14, 27–41. [Google Scholar] [CrossRef]
- Patel, A.; Boufraqech, M.; Jain, M.; Zhang, L.; He, M.; Gesuwan, K.; Gulati, N.; Nilubol, N.; Fojo, T.; Kebebew, E. MiR-34a and miR-483–5p are candidate serum biomarkers for adrenocortical tumors. Surgery 2013, 154, 1224–1229. [Google Scholar] [CrossRef] [PubMed]
- Zhao, J.; Guerrero, A.; Kelnar, K.; Peltier, H.J.; Bader, A.G. Synergy between next generation EGFR tyrosine kinase inhibitors and miR-34a in the inhibition of non-small cell lung cancer. Lung Cancer 2017, 108, 96–102. [Google Scholar] [CrossRef] [PubMed]
- Erdem, A.; Eksin, E.; Isin, D.; Polat, D. Graphene Oxide Modified Chemically Activated Graphite Electrodes for Detection of microRNA. Electroanalysis 2017, 29, 1350–1358. [Google Scholar] [CrossRef]
- Janek, R.P.; Fawcett, W.R. Impedance spectroscopy of self-assembled monolayers on Au(111): Sodium ferrocyanide charge transfer at modified electrodes. Langmuir 1998, 14, 3011–3018. [Google Scholar] [CrossRef]
- Miller, J.N.; Miller, J.C. Statistics and Chemometrics for Analytical Chemistry; Harlow, England: London, UK, 2000; pp. 213–240. [Google Scholar]
- Erdem, A.; Eksin, E.; Congur, G. Indicator-free electrochemical biosensor for microRNA detection based on carbon nanofibers modified screen printed electrodes. J. Electroanal. Chem. 2015, 755, 167–173. [Google Scholar] [CrossRef]
- Tao, Y.; Yin, D.; Jin, M.; Fang, J.; Dai, T.; Li, Y.; Li, Y.-X.; Pu, Q.; Xie, G. Double-loop hairpin probe and doxorubicin-loaded gold nanoparticles for the ultrasensitive electrochemical sensing of microRNA. Biosens. Bioelectron. 2017, 96, 99–105. [Google Scholar] [CrossRef] [PubMed]
- Cai, W.; Xie, S.; Tang, Y.; Chai, Y.; Yuan, R.; Zhang, J. A label-free electrochemical biosensor for microRNA detection based on catalytic hairpin assembly and in situformation of molybdophosphate. Talanta 2017, 163, 65–71. [Google Scholar] [CrossRef] [PubMed]
- Azzouzi, S.; Mak, W.C.; Kor, K.; Turner, A.P.F.; Ali, M.B.; Beni, V. An integrated dual functional recognition/amplification bio-label for the one-step impedimetric detection of Micro-RNA-21. Biosens. Bioelectron. 2017, 92, 154–161. [Google Scholar] [CrossRef] [PubMed]
- Shuai, H.L.; Huang, K.J.; Chen, Y.X.; Fang, L.X.; Jia, M.P. Au nanoparticles/hollow molybdenum disulfide microcubes based biosensor for microRNA-21 detection coupled with duplex-specific nuclease and enzyme signal amplification. Biosens. Bioelectron. 2017, 89, 989–997. [Google Scholar] [CrossRef] [PubMed]
- Mandli, J.; Amine, A. Impedimetric genosensor for miRNA-34a detection in cell lysates using polypyrrole. J. Solid State Electrochem. 2018, 22, 1007–1014. [Google Scholar] [CrossRef]
- Isin, D.; Eksin, E.; Erdem, A. Graphene oxide modified single-use electrodes and their application for voltammetric miRNA analysis. Mater. Sci. Eng. C 2017, 75, 1242–1249. [Google Scholar] [CrossRef] [PubMed]
- Tran, H.V.; Piro, B.; Reisberg, S.; Nguyen, L.H.; Nguyen, T.D.; Duc, H.T.; Pham, M.C. An electrochemical ELISA-like immunosensor for miRNAs detection based on screen-printed gold501 electrodes modified with reduced graphene oxide and carbon nanotubes. Biosens. Bioelectron. 2014, 62, 25–30. [Google Scholar] [CrossRef] [PubMed]
- Souza, C.D.; Zrig, S.; Wang, D.; Pham, M.C.; Piro, B. Electrocatalytic miRNA Detection Using Cobalt Porphyrin-Modified Reduced Graphene Oxide. Sensors 2014, 14, 9984–9994. [Google Scholar] [CrossRef] [PubMed] [Green Version]
- Liu, L.; Jiang, S.; Wang, L.; Zhang, Z.; Xie, G. Direct detection of microRNA-126 at a femtomolar level using a glassy carbon electrode modified with chitosan, graphene sheets, and a poly (amidoamine) dendrimer composite with gold and silver nanoclusters. Microchim. Acta 2015, 182, 77–84. [Google Scholar] [CrossRef]
- Vaisocherová, H.; Šípová, H.; Víšová, I.; Bocková, M.; Špringer, T.; Ermini, M.L.; Song, X.; Krejčík, Z.; Chrastinová, L.; Pastva, O.; et al. Rapid and sensitive detection of multiple microRNAs in cell lysate by low-fouling surface plasmon resonance biosensor. Biosens. Bioelectron. 2015, 70, 226–231. [Google Scholar] [CrossRef] [PubMed]


| Electrode | miRNA | Method | DL | Reference |
|---|---|---|---|---|
| GO/CA/PGE | miRNA-34a | EIS | 82.36 nM | [31] |
| CNFs/SPE | miRNA-34a | DPV, EIS | 3.12 µM | [34] |
| AuNPs/AuE | miRNA let-7d | EIS, CV, SWV, | 0.17 pM | [35] |
| MWCNT modified GCE | miRNA-155 | CV, DPV | 1.64 fM | [36] |
| specific biotinylated DNA/LNA/MB/AuNPs/GCE | miRNA-21 | EIS | 0.3 pM | [37] |
| AuNPs/MoS2/GCE | miRNA-21 | CV, DPV, EIS | 0.086 fM | [38] |
| PPy-PGE | miRNA-34a | EIS | 0.20 µg/mL | [39] |
| GO/CA/PGE | miRNA-34a | DPV | 1.07 µM | [40] |
| IL/CA/PGE | miRNA-34a | EIS | 0.772 µg/mL (0.109 µM) | This study |
© 2018 by the authors. Licensee MDPI, Basel, Switzerland. This article is an open access article distributed under the terms and conditions of the Creative Commons Attribution (CC BY) license (http://creativecommons.org/licenses/by/4.0/).
Share and Cite
Kesici, E.; Eksin, E.; Erdem, A. An Impedimetric Biosensor Based on Ionic Liquid-Modified Graphite Electrodes Developed for microRNA-34a Detection. Sensors 2018, 18, 2868. https://doi.org/10.3390/s18092868
Kesici E, Eksin E, Erdem A. An Impedimetric Biosensor Based on Ionic Liquid-Modified Graphite Electrodes Developed for microRNA-34a Detection. Sensors. 2018; 18(9):2868. https://doi.org/10.3390/s18092868
Chicago/Turabian StyleKesici, Ece, Ece Eksin, and Arzum Erdem. 2018. "An Impedimetric Biosensor Based on Ionic Liquid-Modified Graphite Electrodes Developed for microRNA-34a Detection" Sensors 18, no. 9: 2868. https://doi.org/10.3390/s18092868