Assessment of Ultra-Short Heart Variability Indices Derived by Smartphone Accelerometers for Stress Detection

 , and
, and
Abstract
:1. Introduction
- (1)
- The ballistocardiogram (BCG), measuring the displacement of the mass of ejected blood from the ventricles through the aorta and then towards the peripheral circulation, represented by a series of systolic (I, J, K) waves describing the forces associated to the shifting of the center of body mass [1,2,3];
- (2)
2. Materials and Methods
2.1. Study Population
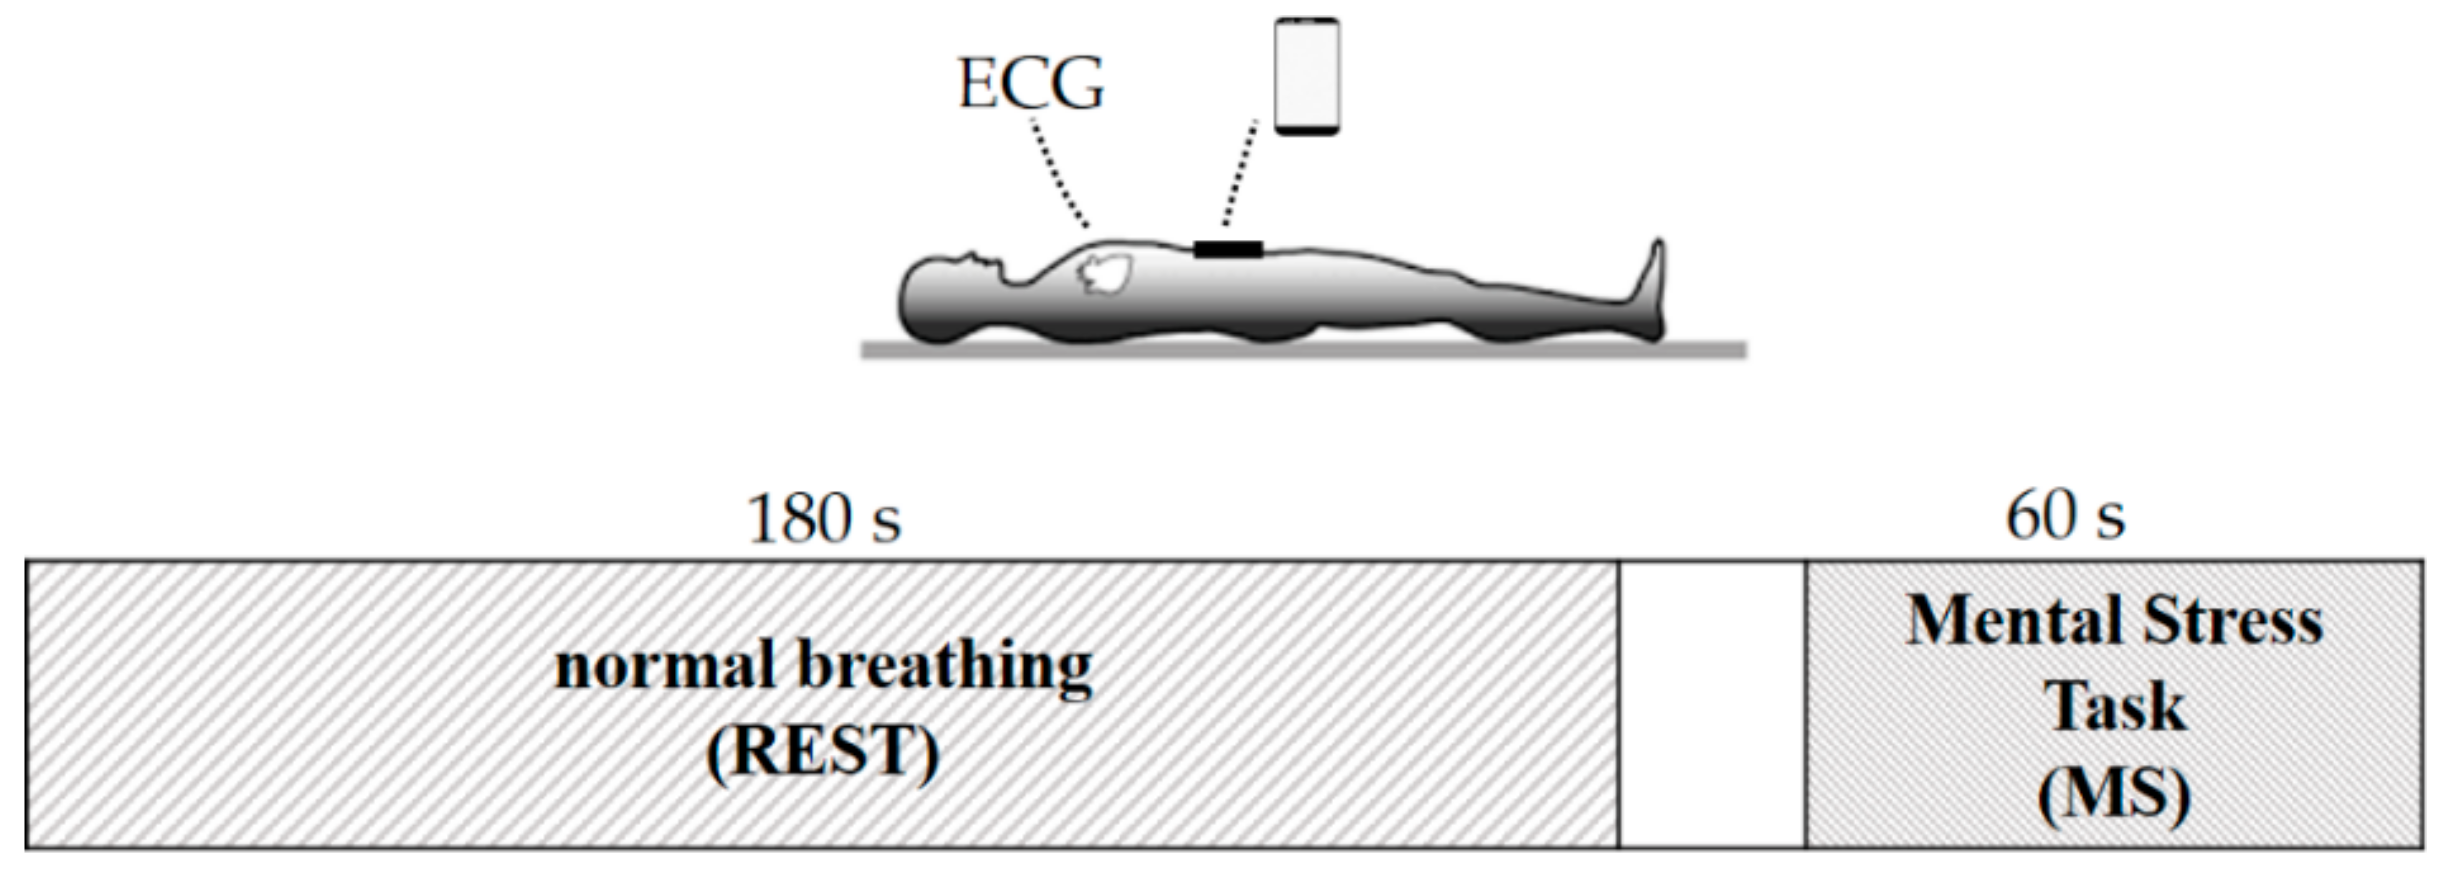
2.2. Accelerometric Signal Acquisition
2.3. Signal Processing
2.3.1. Pre-Processing
2.3.2. Heartbeat Detection and Algorithm Performance
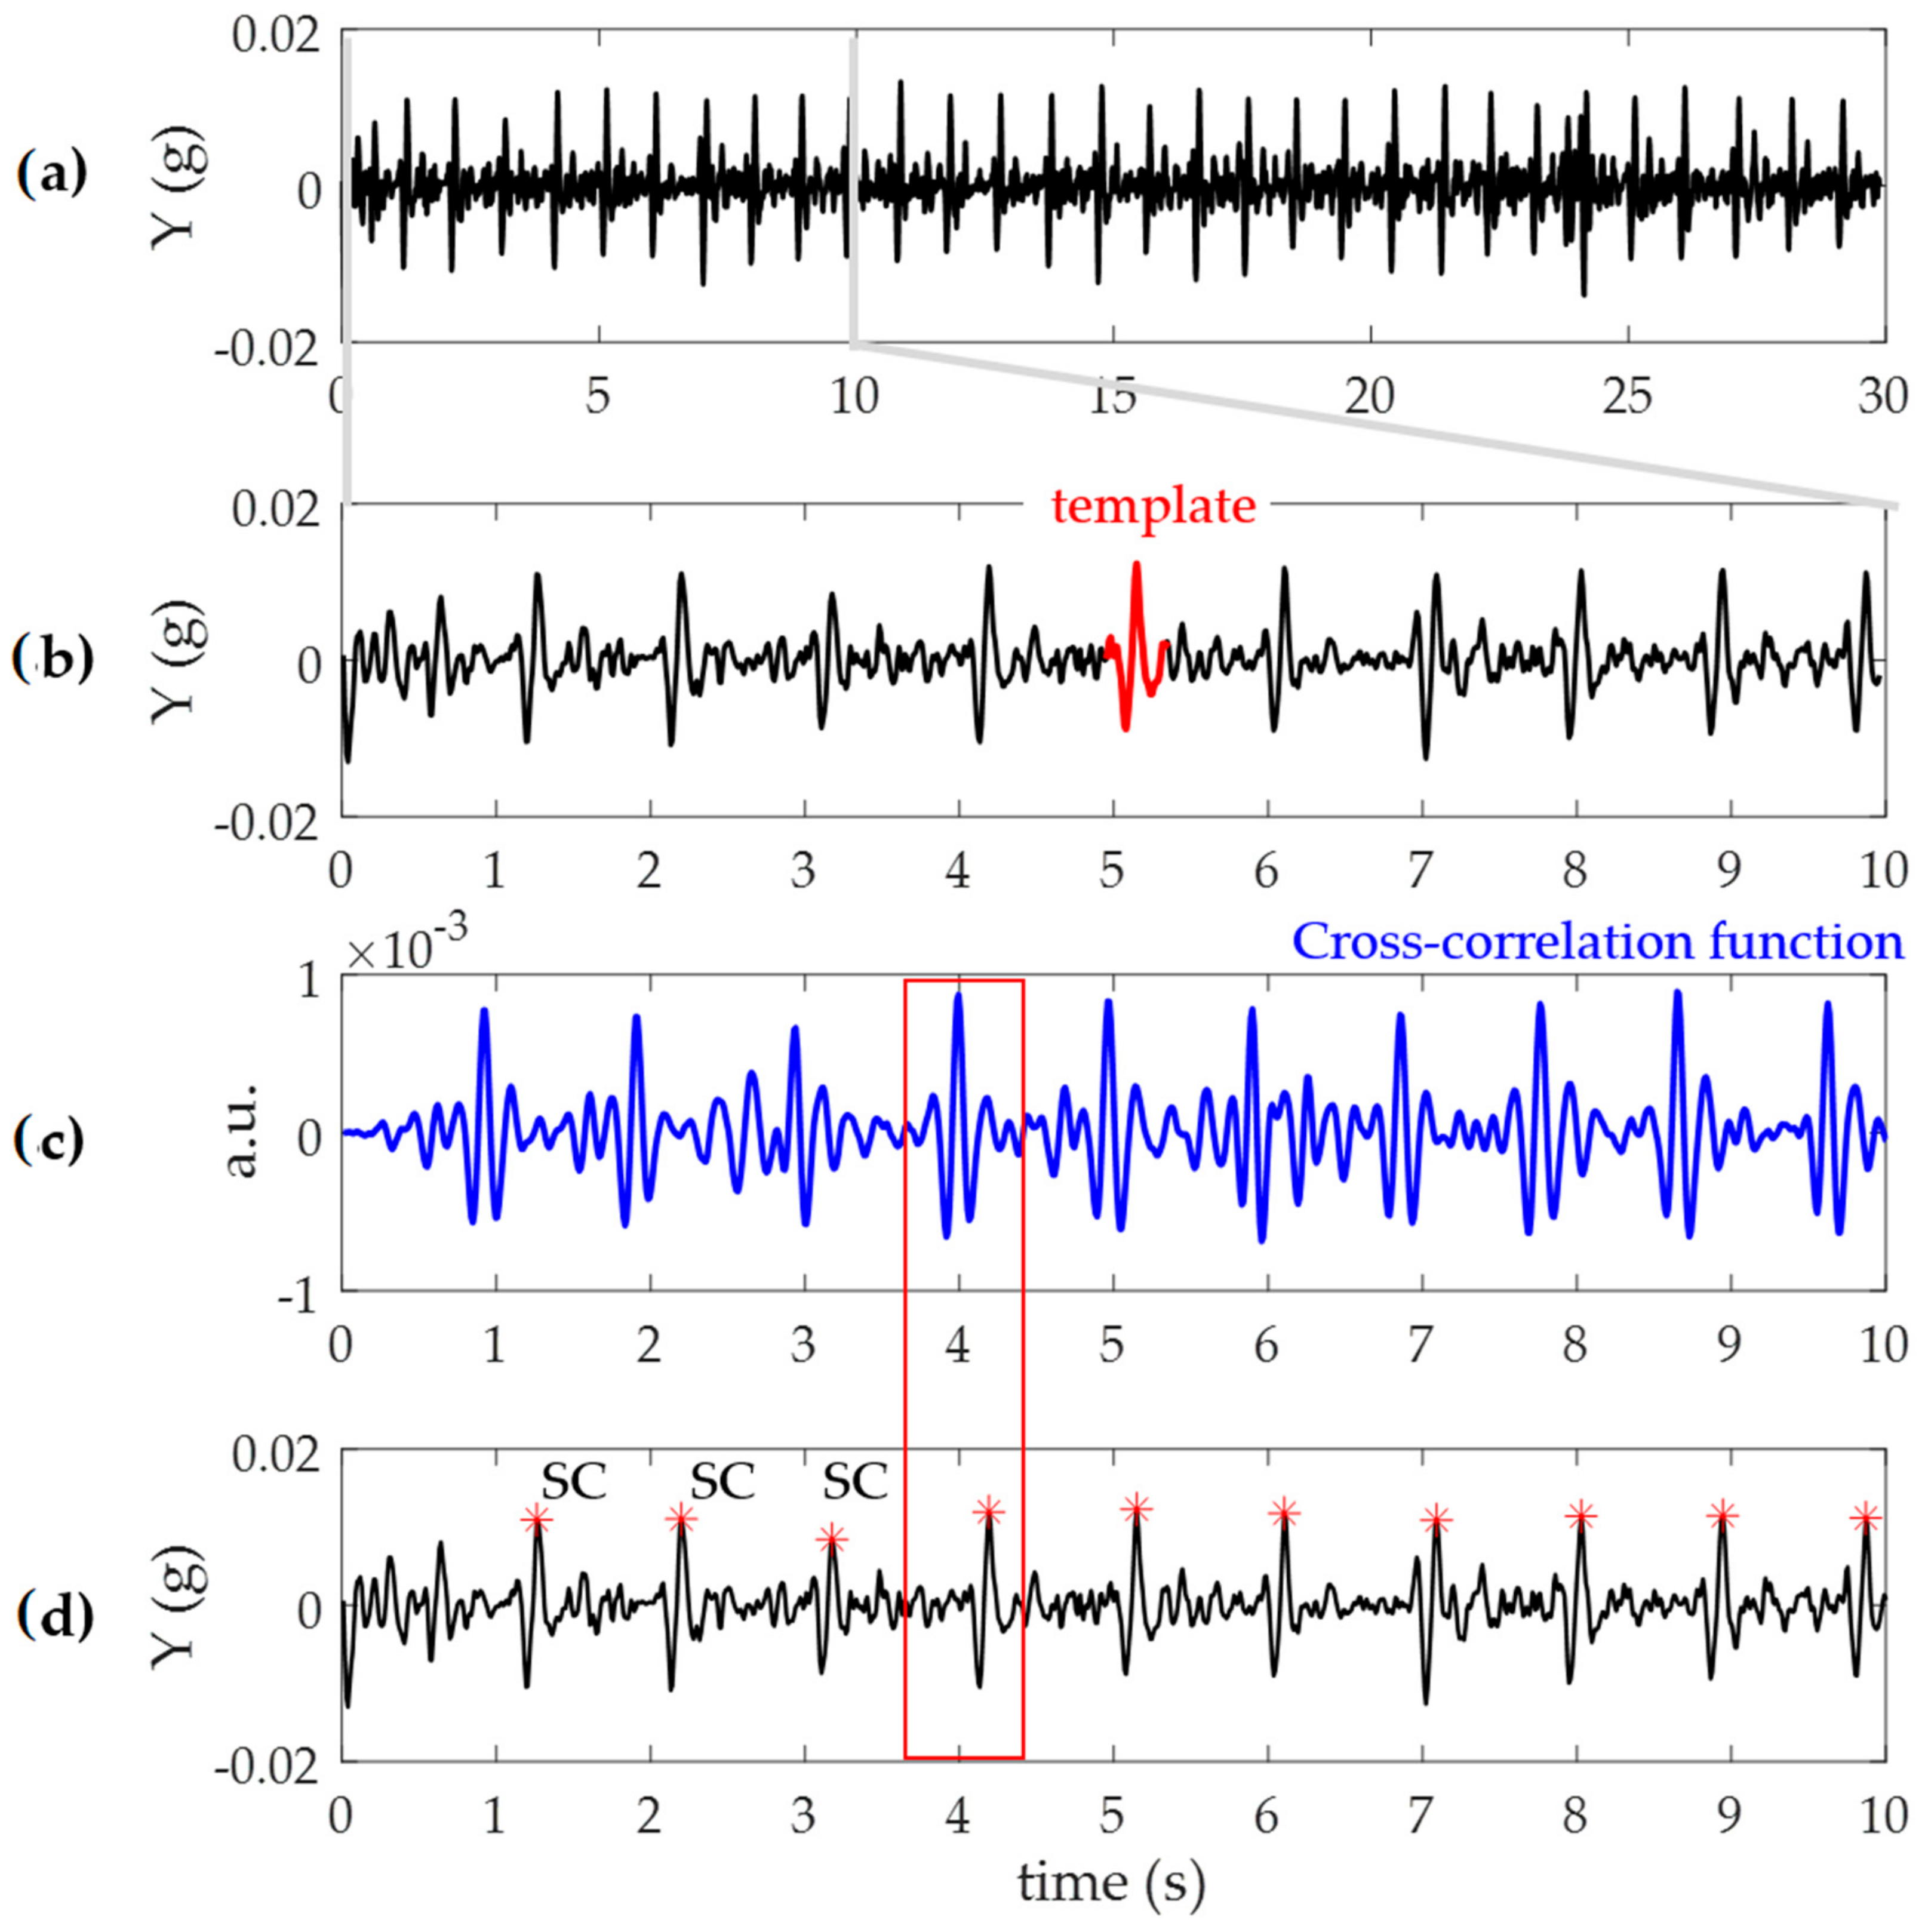
- Signals were divided into 30 s segments (Figure 3a);
- For each segment, centered at the absolute maximum within the first 10 s, a template of 400 ms duration was extracted (Figure 3b): Such duration was chosen keeping into consideration the possible minimum duration of the heart cycle interval in case of a fast heart rate (~150 bpm);
- Computation of the cross-correlation between the identified template and the 30 s signal segment (Figure 3c);
- Searching windows centered at each maxima of the cross-correlation function (Figure 3c), dashed red) were defined and used to precisely locate each SC (red dot) as the wave with the maximum absolute amplitude on the m-ACC signal (black; Figure 3d). The length of the search window was calculated taking into consideration the mean of the previous three heartbeats durations.
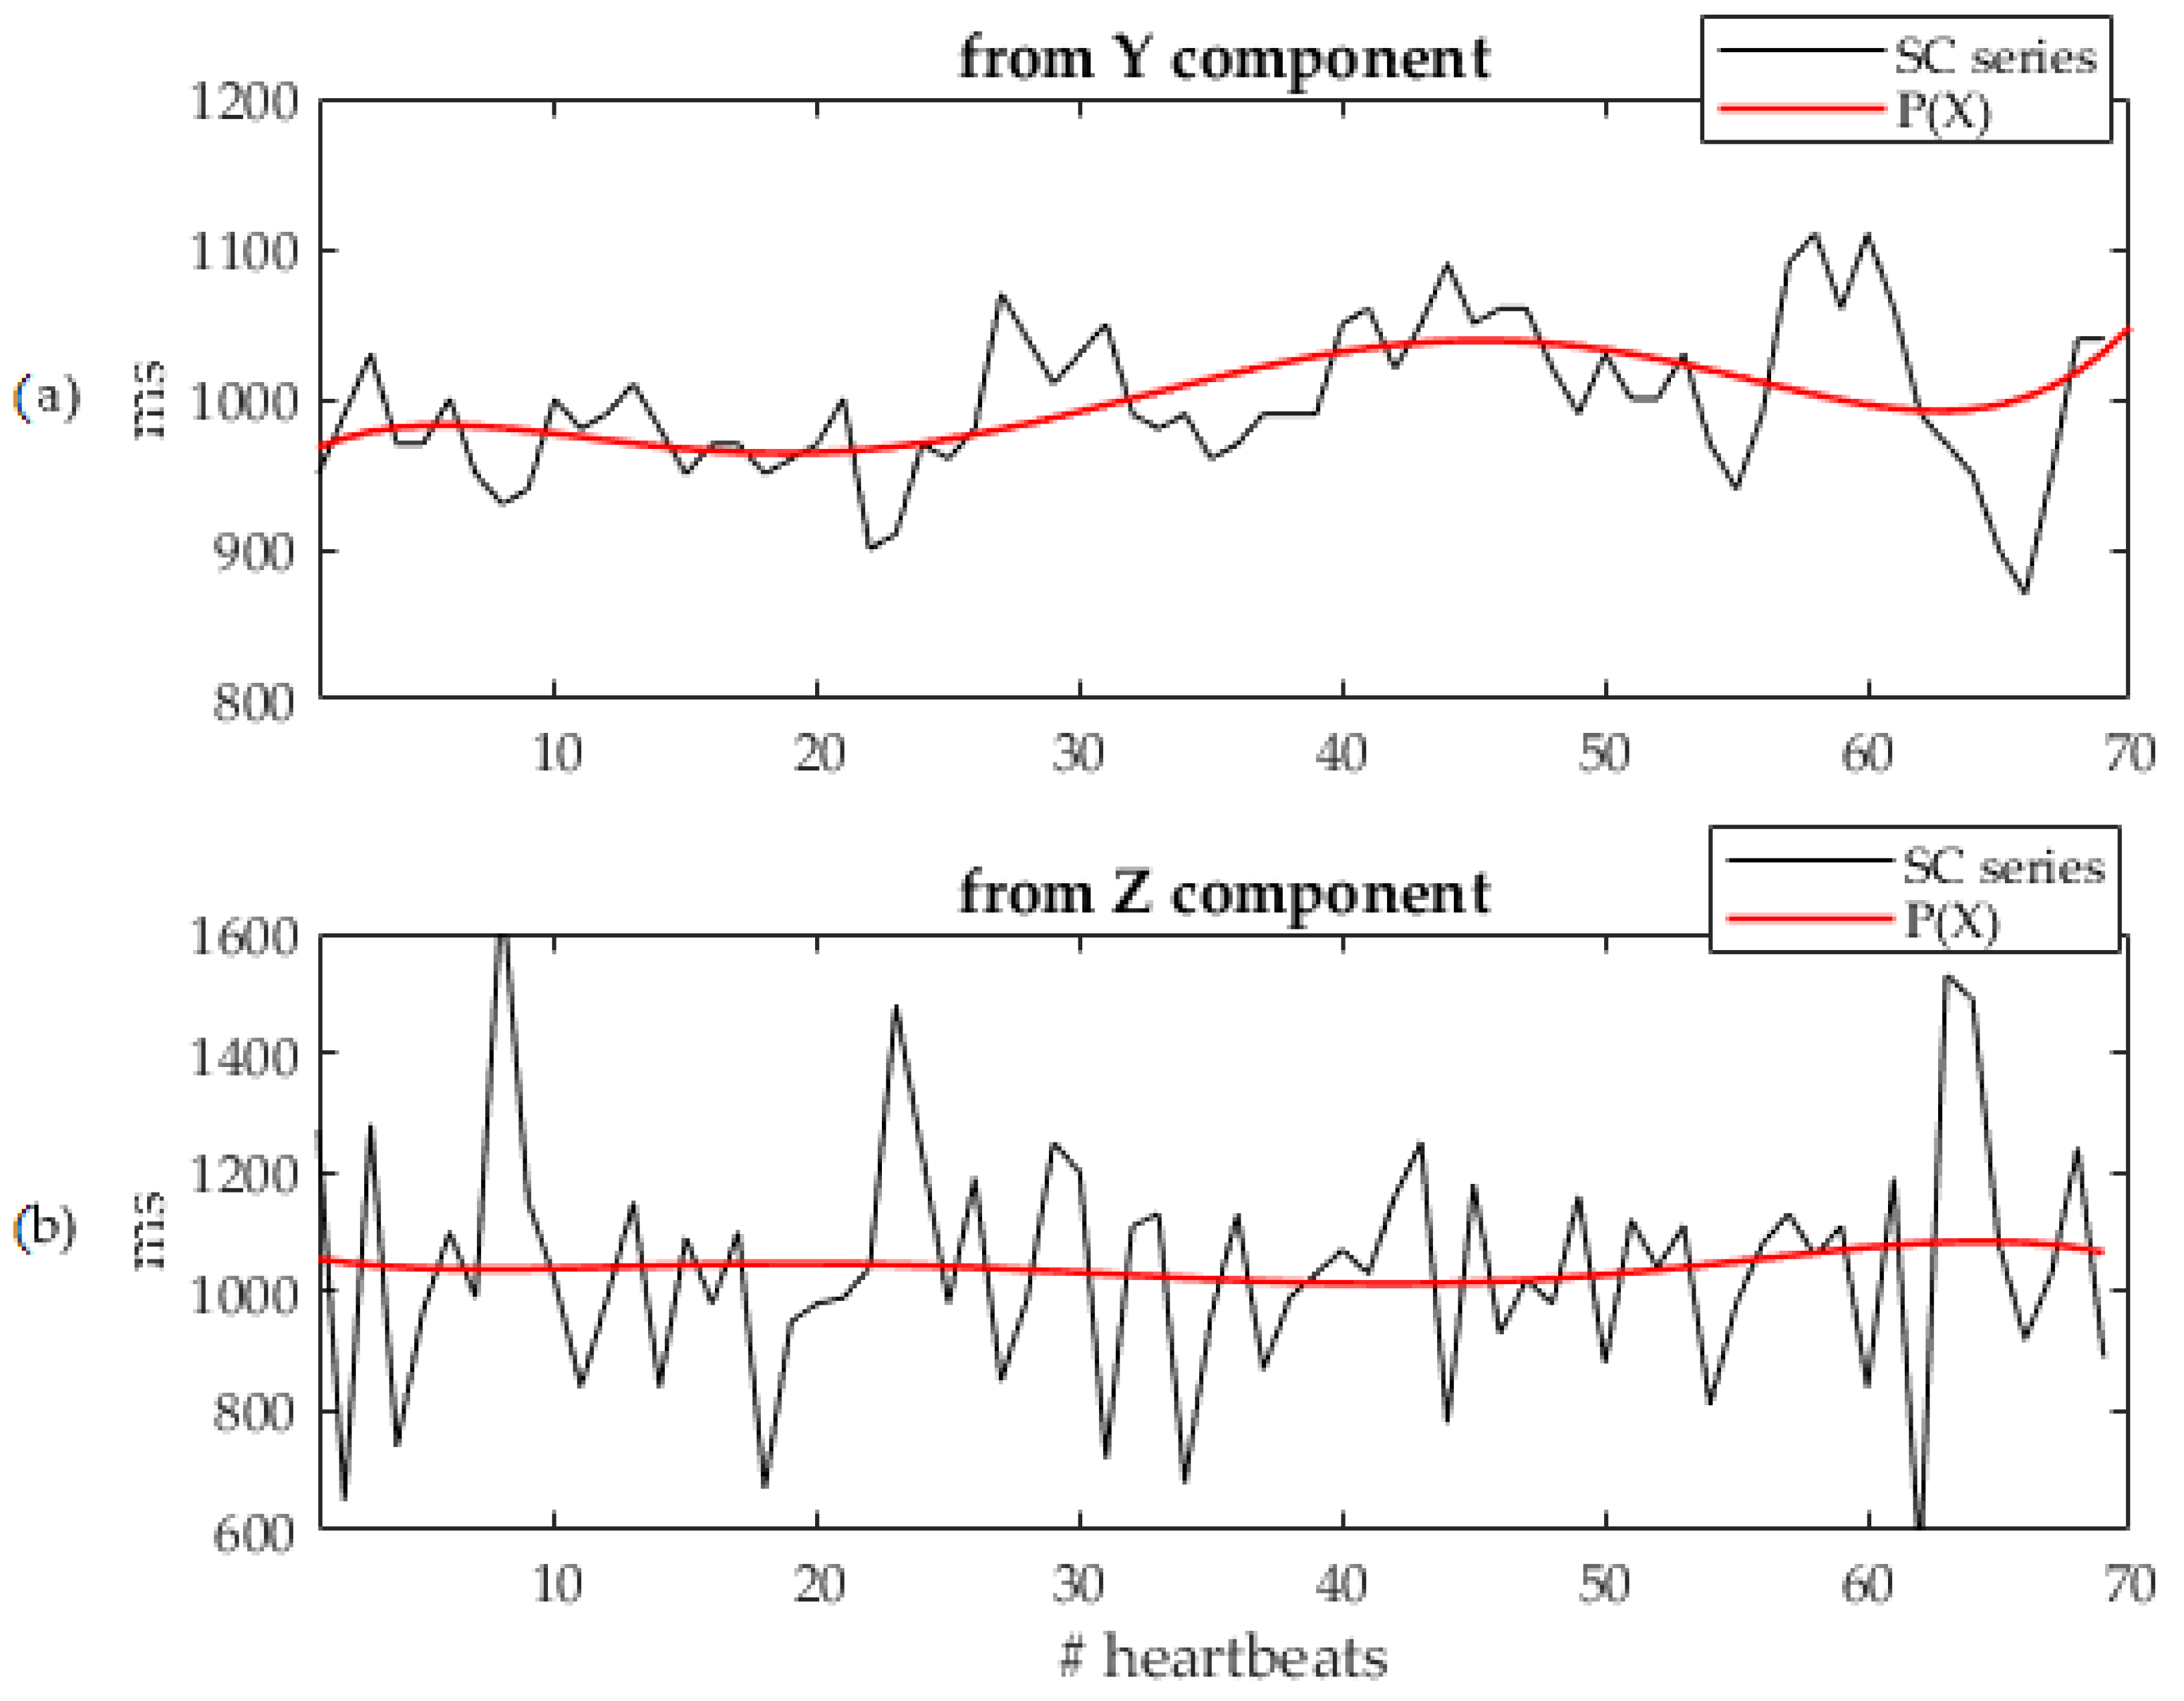
- Least-squares fitting with a 5th order polynomial P(X) of the calculated SCs series for the Y and Z components (see Figure 4a,b, respectively);
- For each component, computation of the mean distance value between the SCs and the P(X) corresponding value;
- The component with the lowest distance was selected for further processing.
2.3.3. Ultra-Short Heart Rate Variability Indices
2.4. Statistical Analysis
3. Results
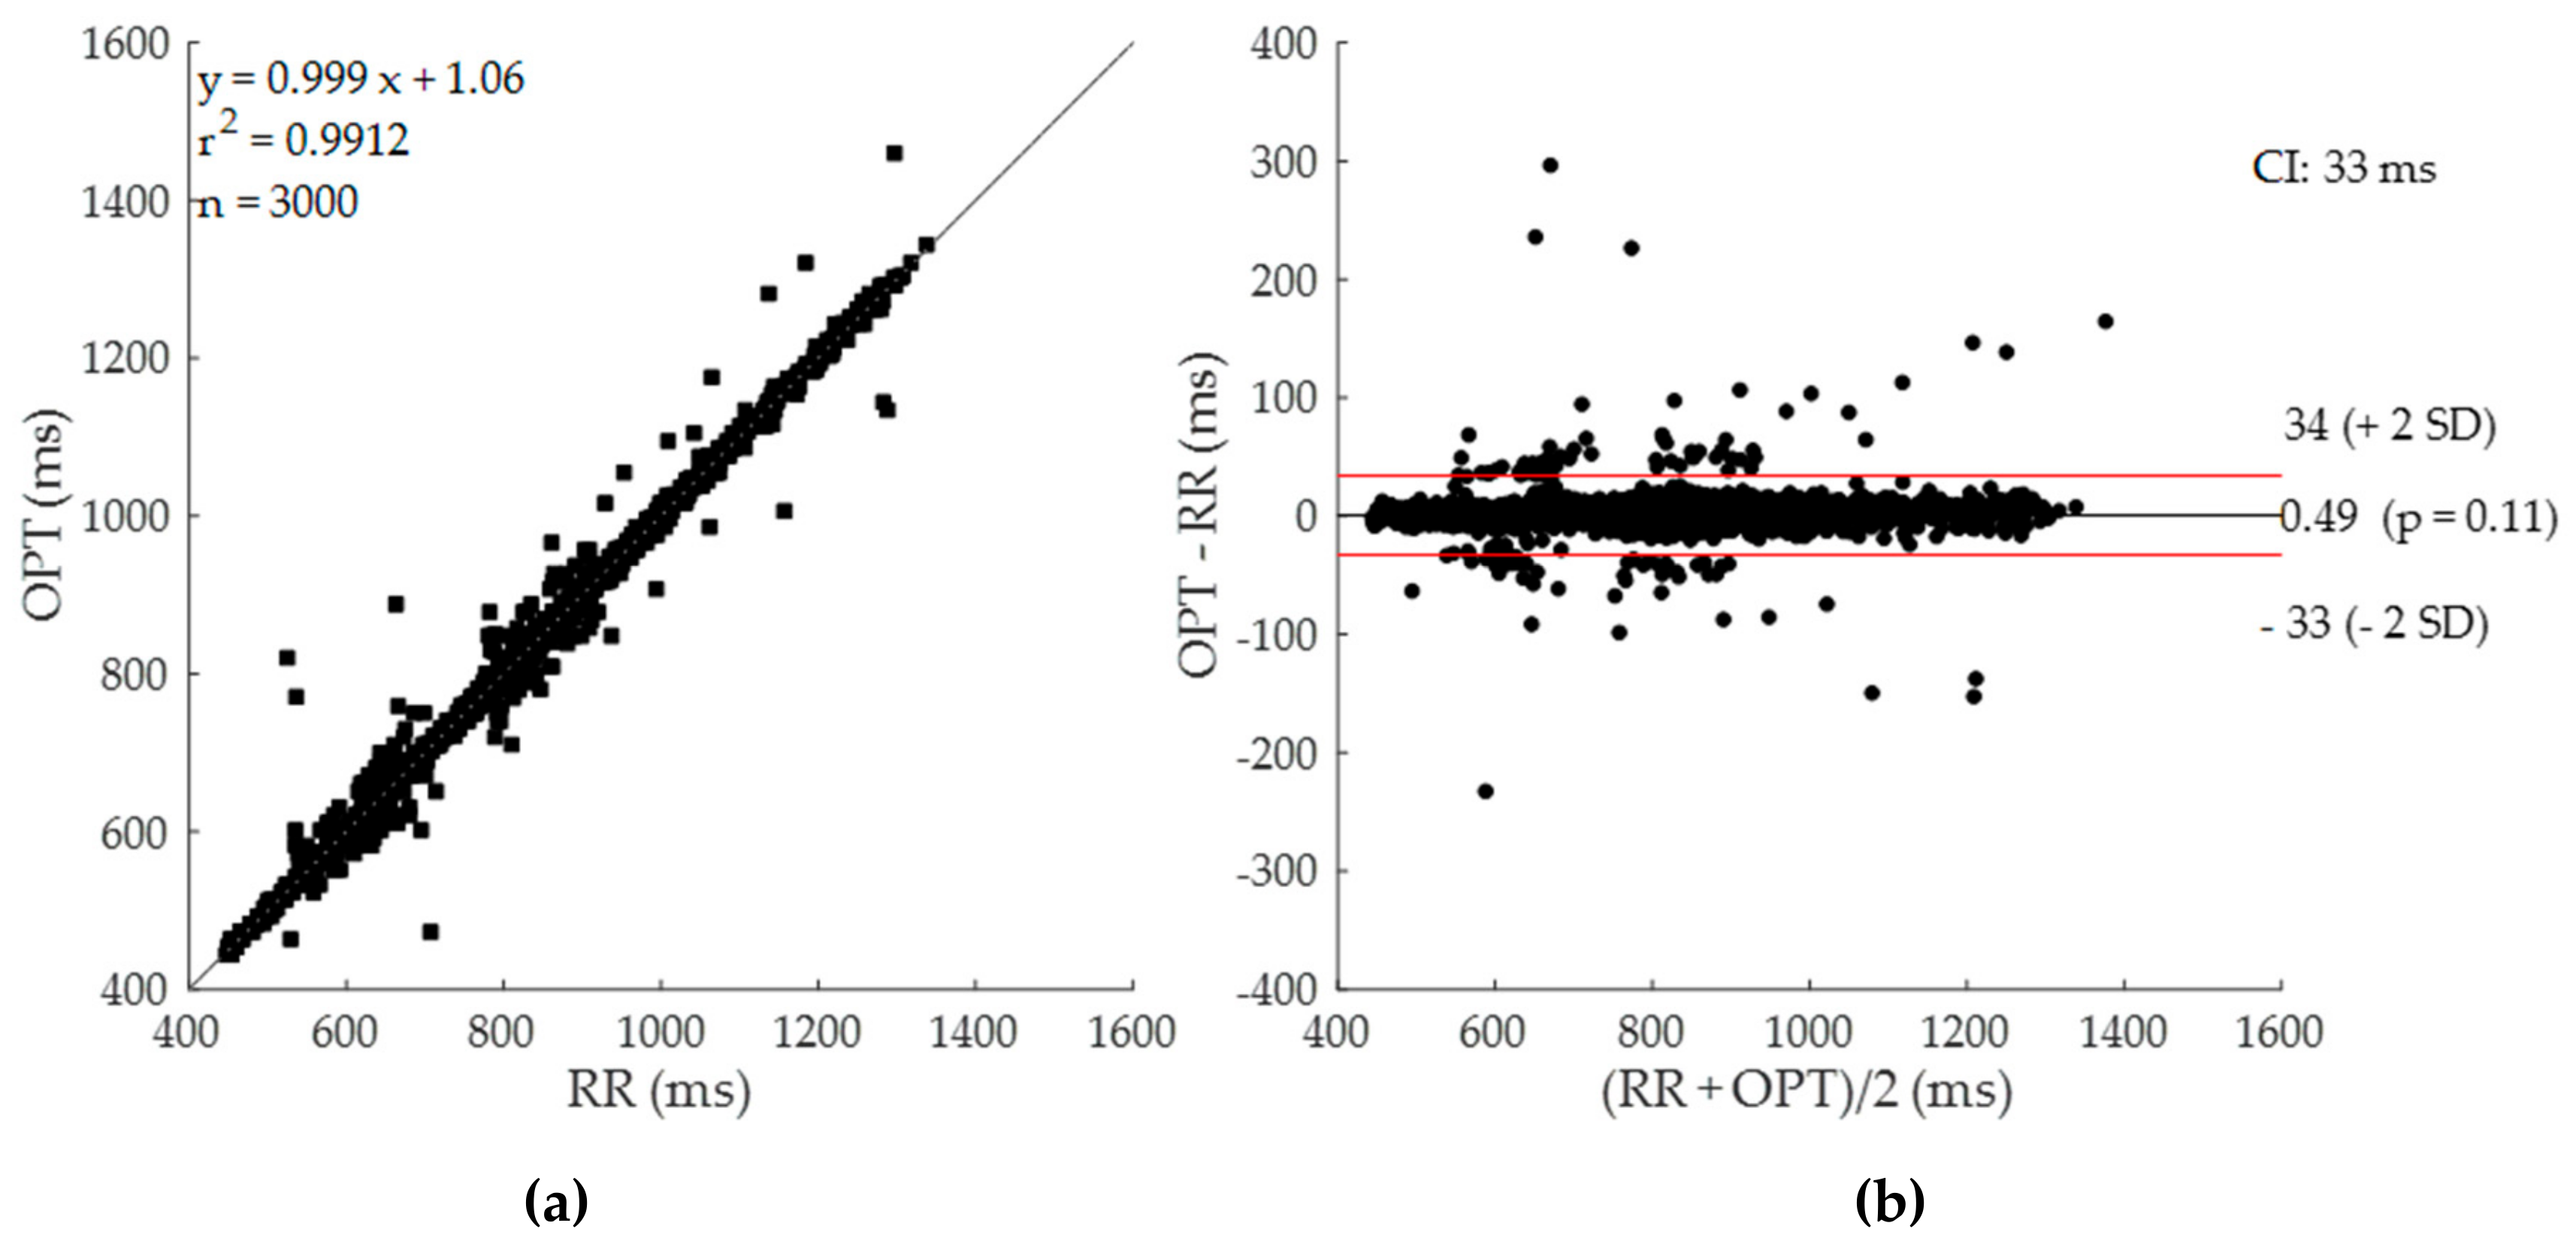
3.1. Algorithm Perfomance
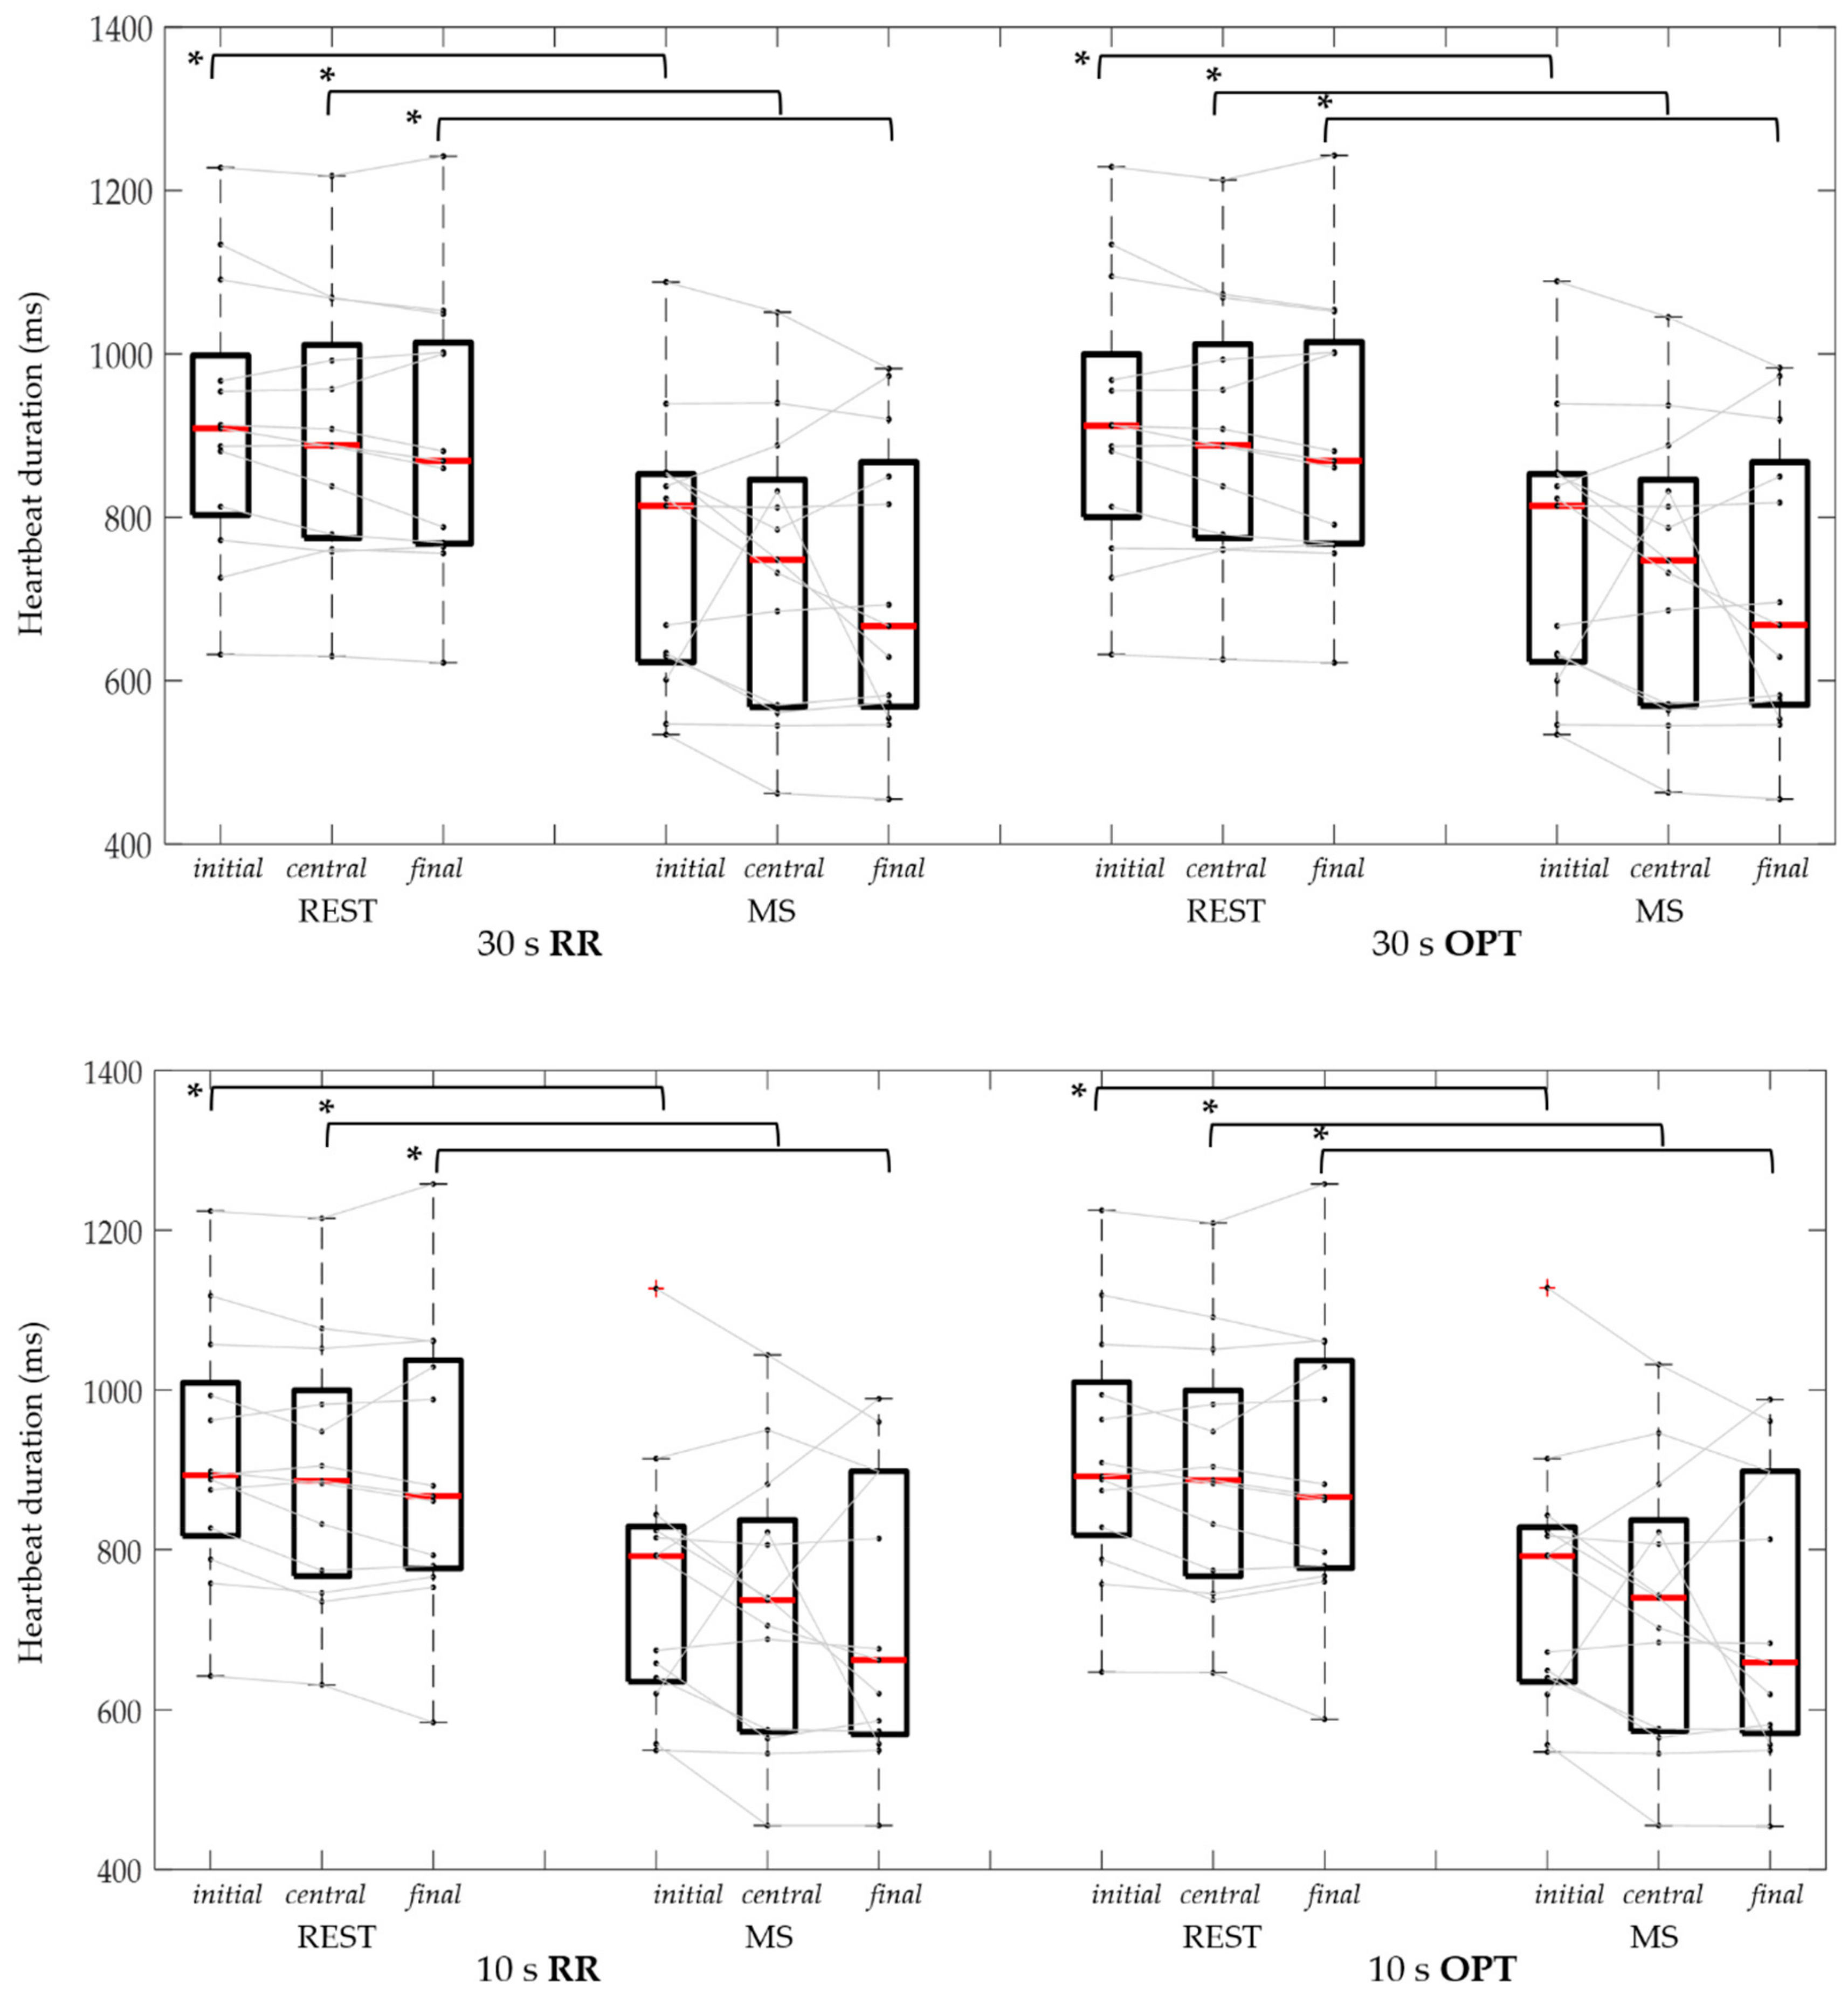
3.2. Cardiac Cycle Duration
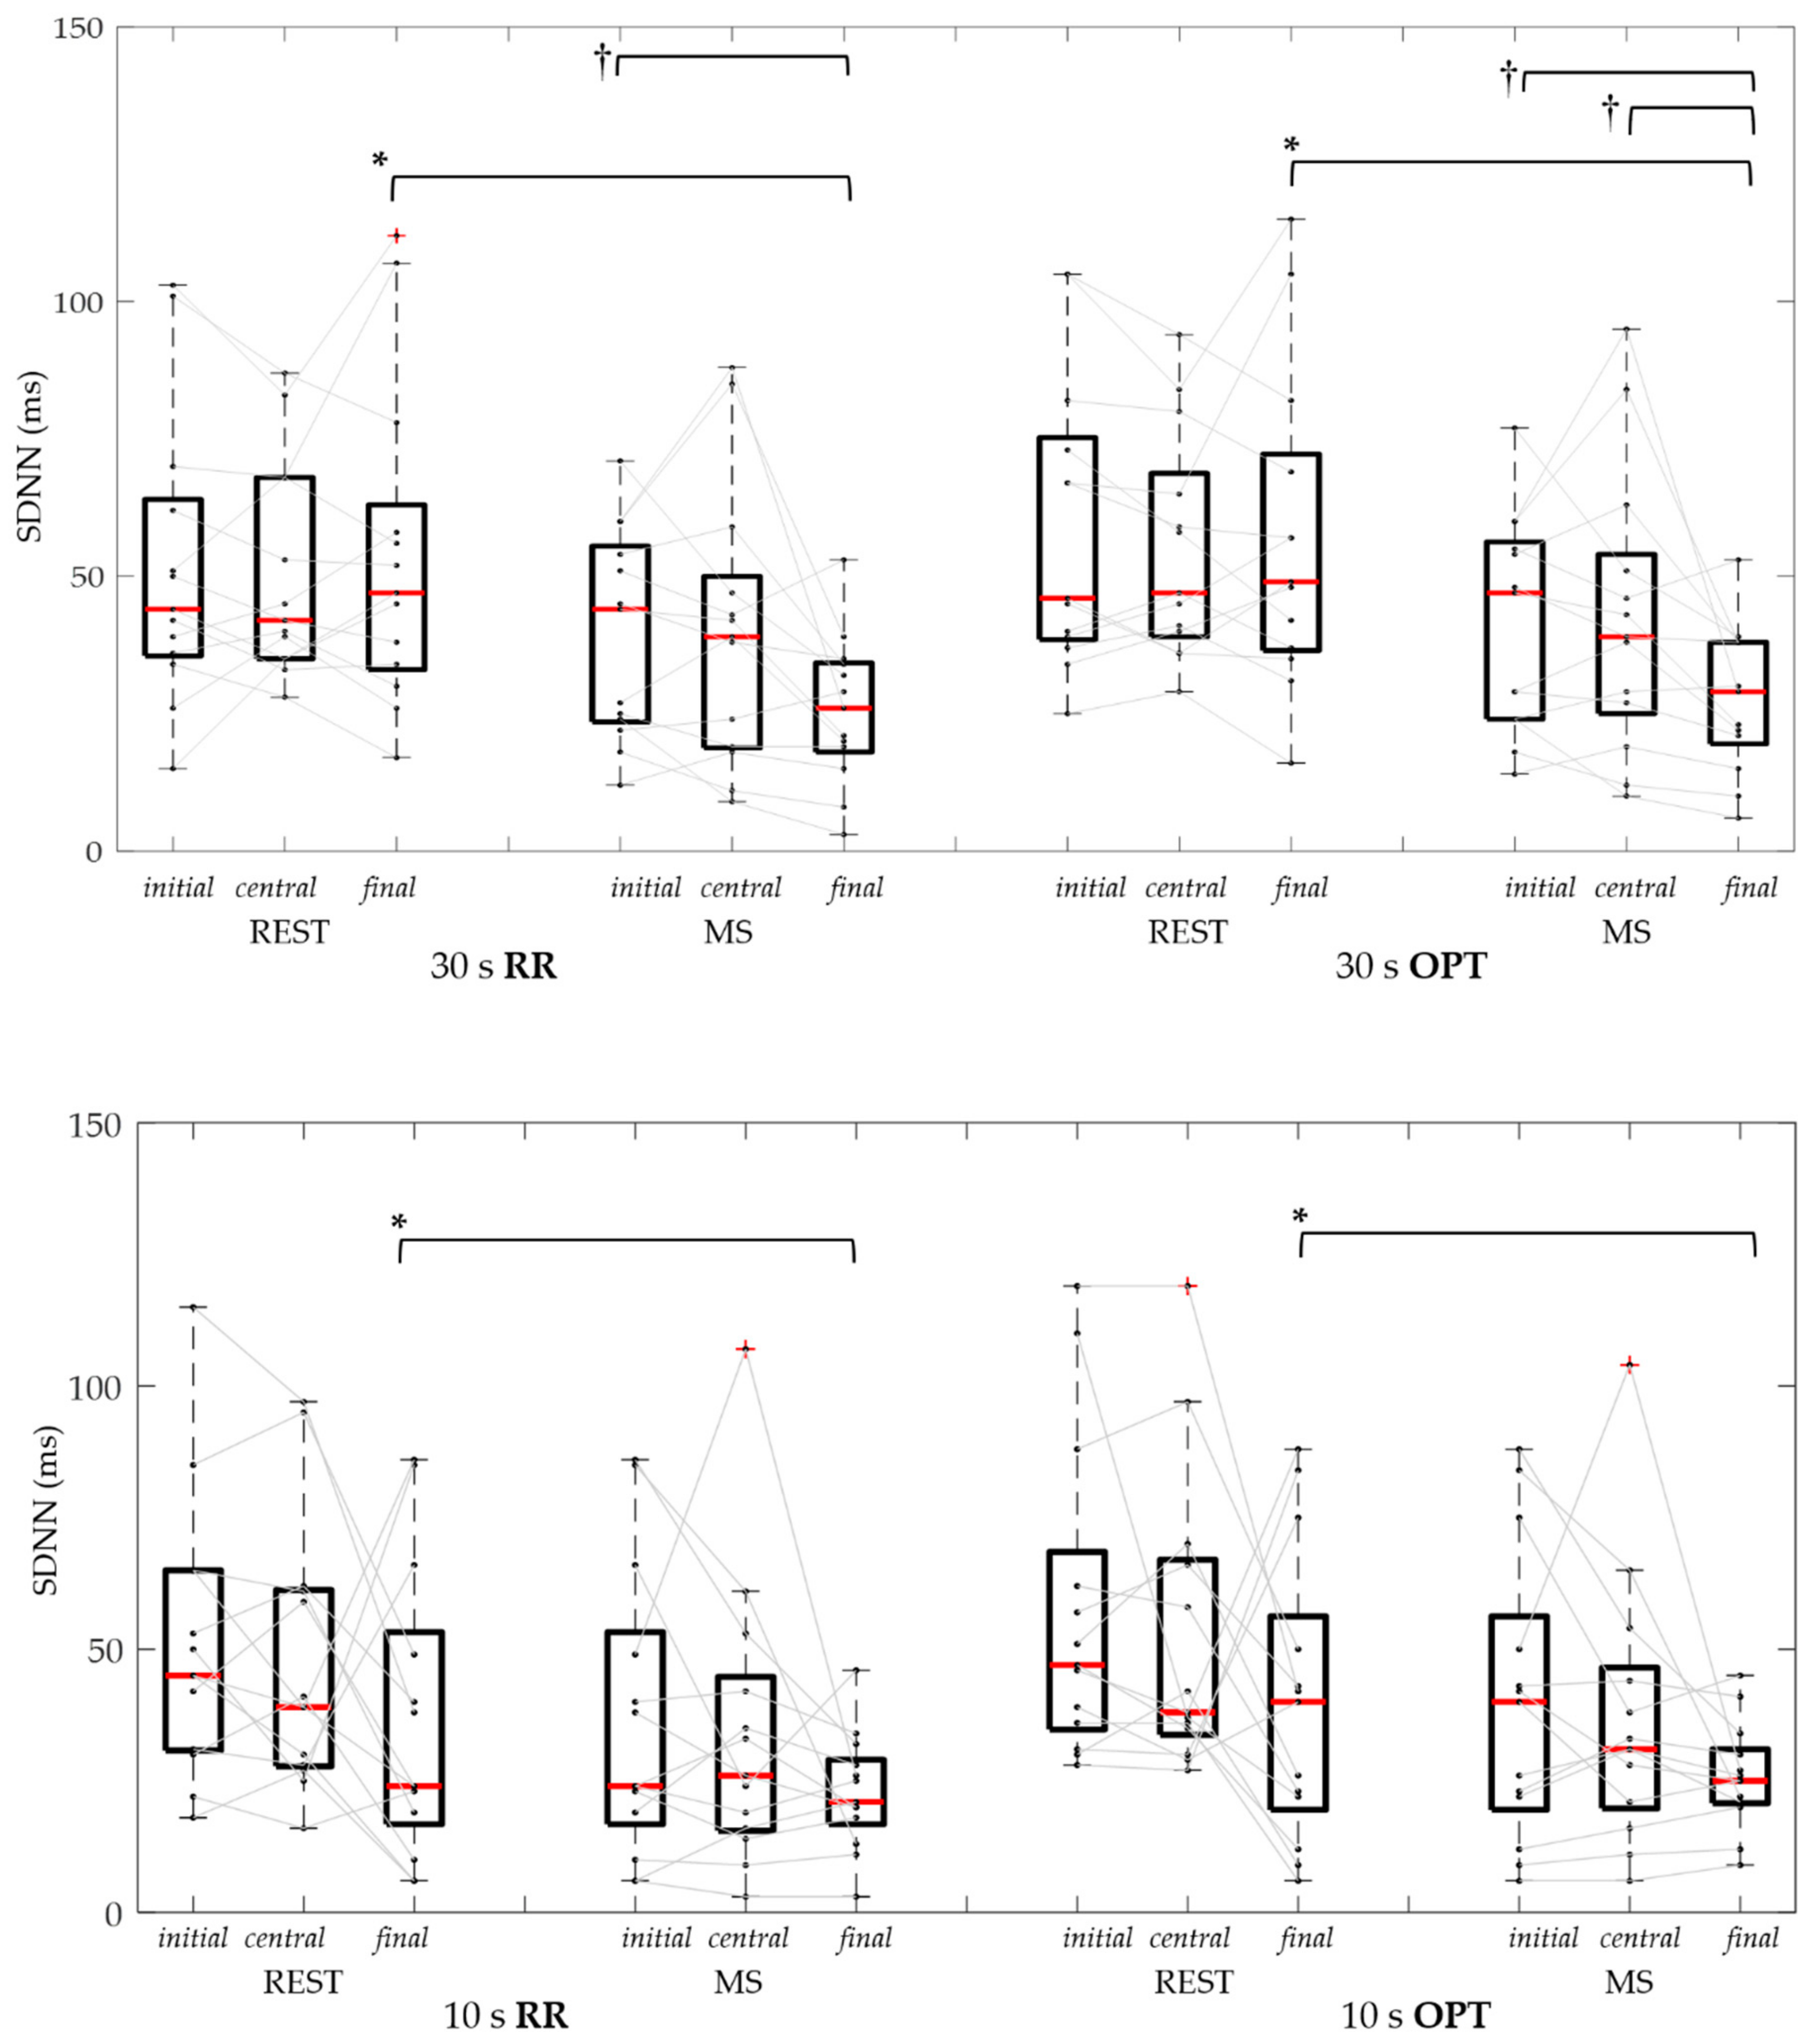
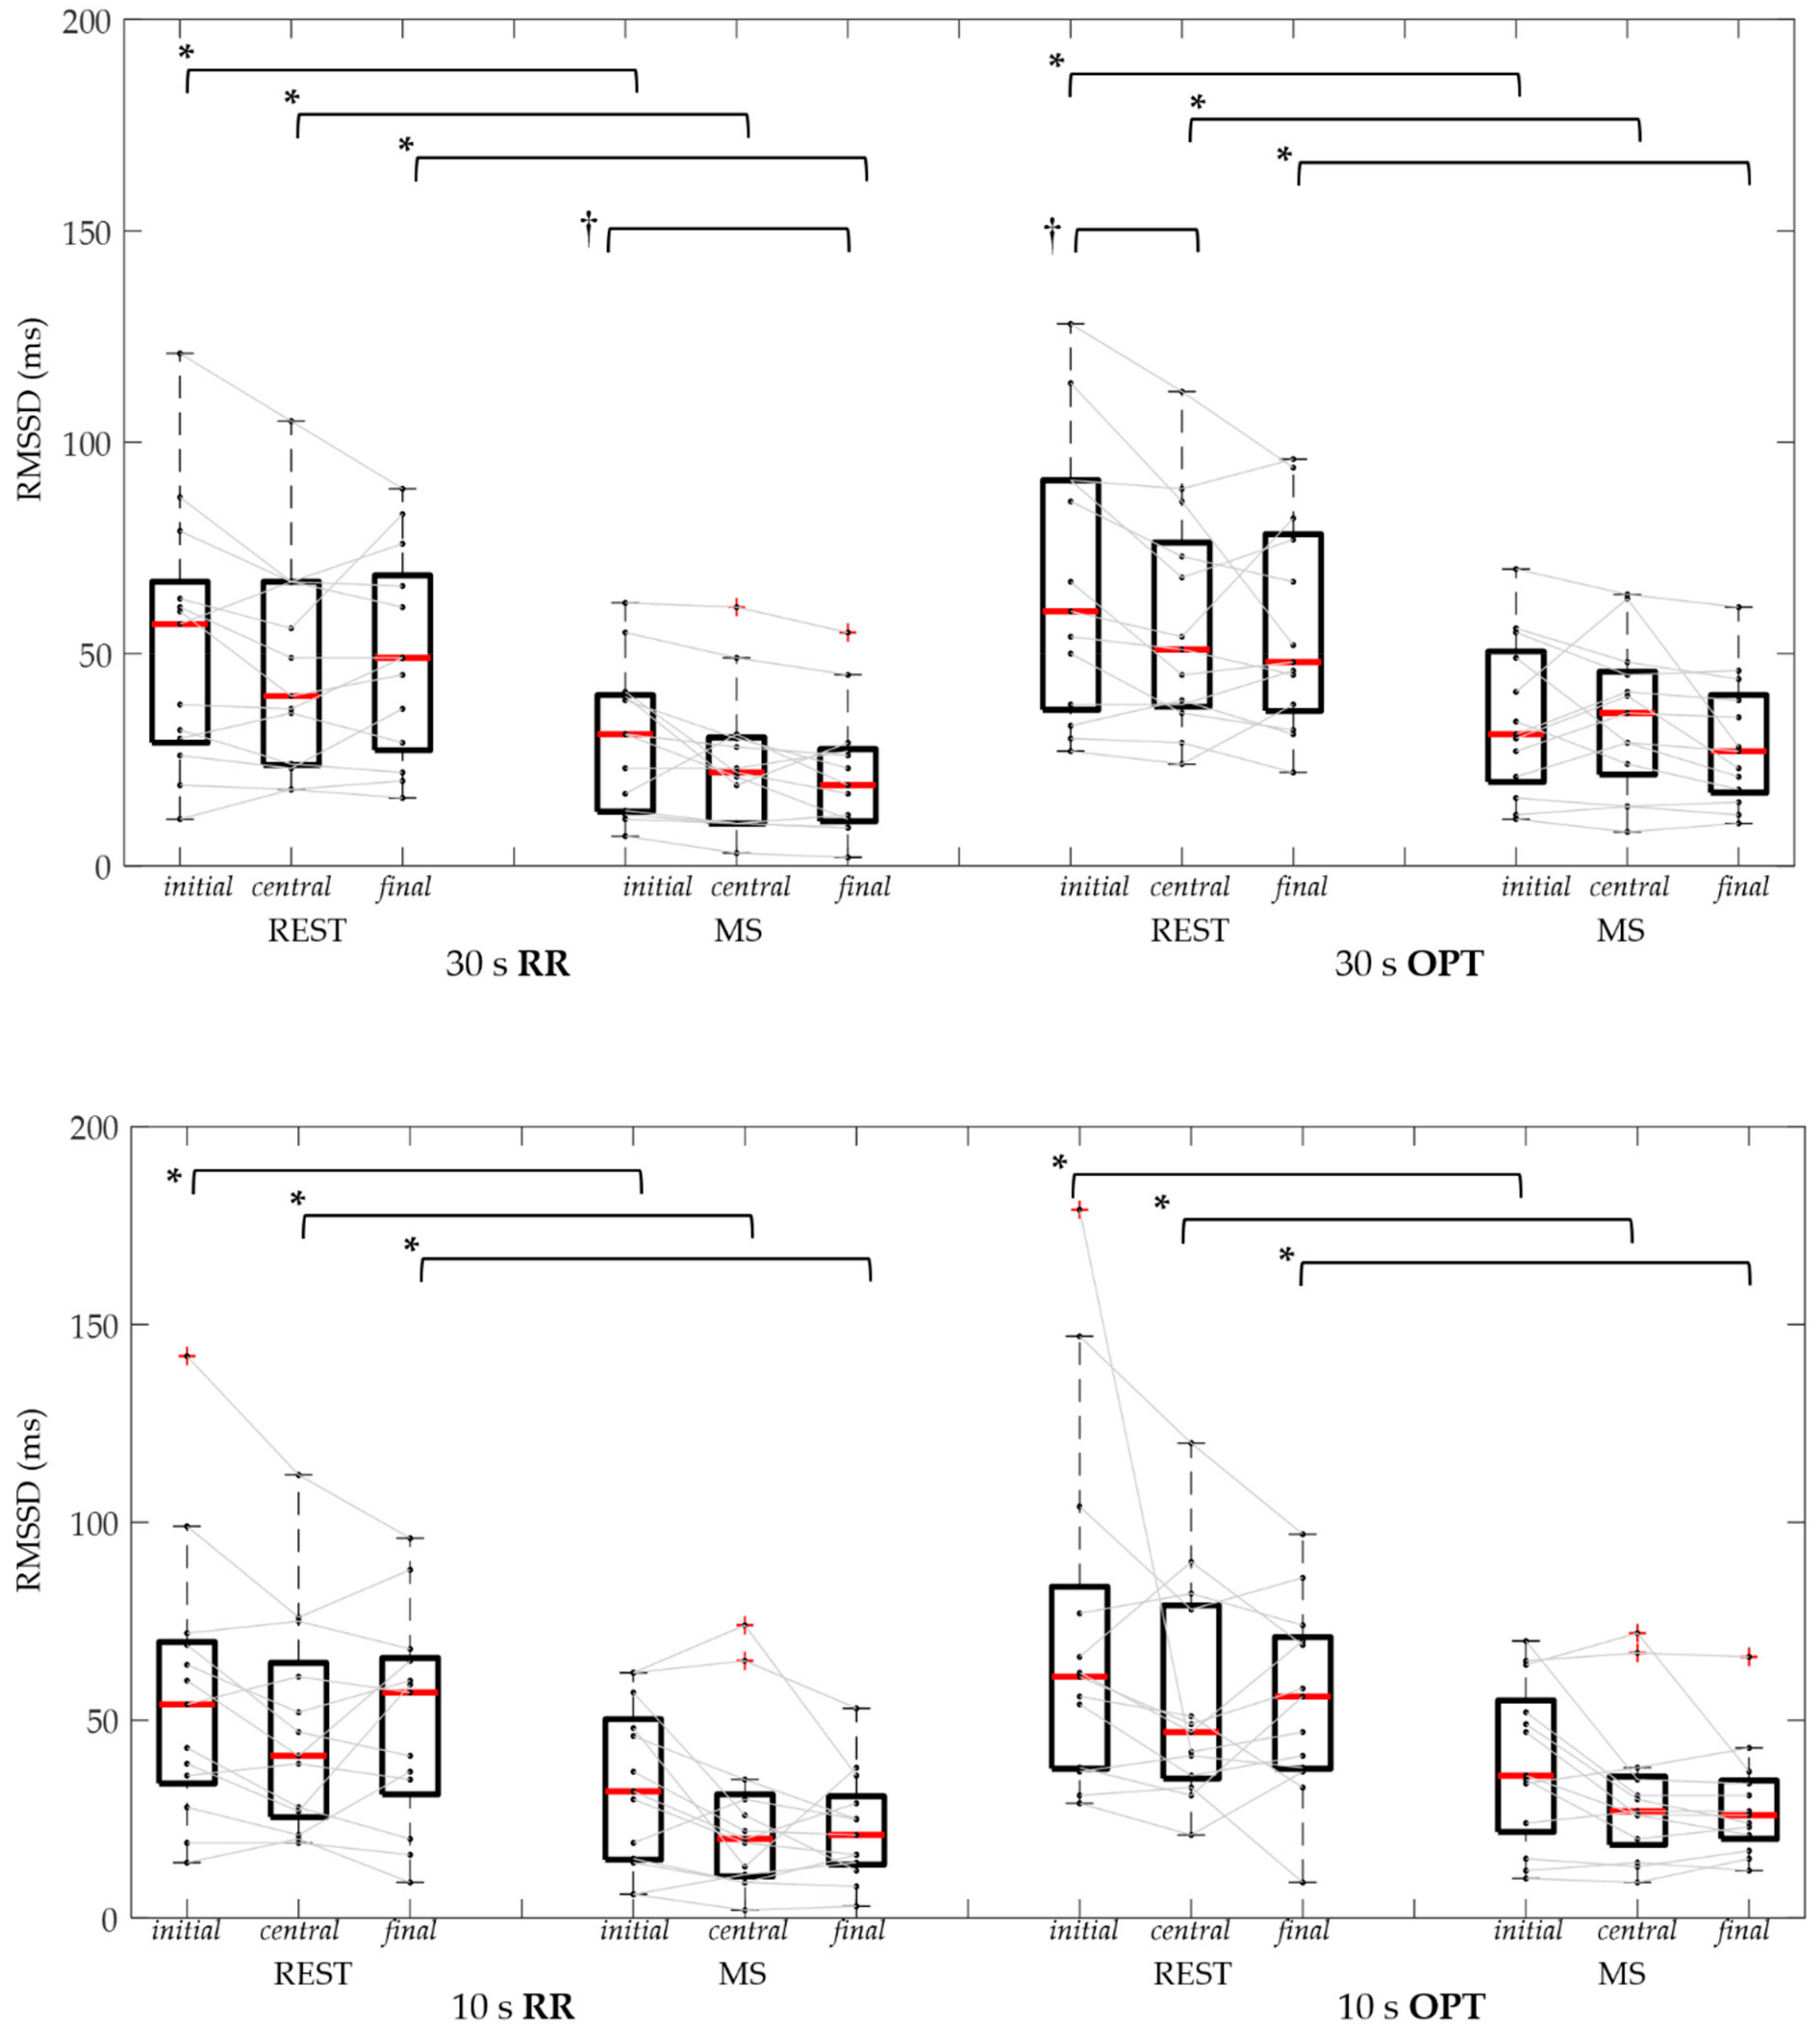
3.3. Ultra-Short Heart Rate Variability Indices
4. Discussion
5. Conclusions
Author Contributions
Funding
Acknowledgments
Conflicts of Interest
References
- Starr, I.; Rawson, A.J.; Schroeder, H.A.; Joseph, N.R. Studies on the estimation of cardiac ouptut in man, and of abnormalities in cardiac function, from the heart’s recoil and the blood’s impacts; The ballistocardiogram. Am. J. Physiol-Legacy Content 1939, 127, 1–28. [Google Scholar] [CrossRef]
- Gubner, R.S.; Rodstein, M.; Ungerleider, H.E. Ballistocardiography; An appraisal of technic, physiologic principles, and clinical value. Circulation 1953, 7, 268–286. [Google Scholar] [CrossRef] [PubMed]
- Inan, O.T.; Migeotte, P.F.; Park, K.S.; Etemadi, M.; Tavakolian, K.; Casanella, R.; Di Rienzo, M. Ballistocardiography and seismocardiography: A review of recent advances. IEEE J-BHI 2015, 19, 1414–1427. [Google Scholar] [CrossRef] [PubMed]
- Salerno, D.M.; Zanetti, J. Seismocardiography for monitoring changes in left ventricular function during ischemia. Chest 1991, 100, 991–993. [Google Scholar] [CrossRef] [PubMed]
- Zanetti, J.M.; Salerno, D.M. Seismocardiography: A technique for recording precordial acceleration. In Proceedings of the Fourth Annual IEEE Symposium on Computer-Based Medical Systems, Baltimore, MD, USA, 12–13 May 1991; pp. 4–9. [Google Scholar] [CrossRef]
- Zanetti, J.M.; Tavakolian, K. Seismocardiography: Past, present and future. In Proceedings of the 35th Annual International Conference of the IEEE Engineering in Medicine and Biology Society (EMBC), Osaka, Japan, 3–7 July 2013; pp. 7004–7007. [Google Scholar] [CrossRef]
- Landreani, F.; Martin-Yebra, A.; Casellato, C.; Pavan, E.; Frigo, C.; Migeotte, P.F.; Caiani, E.G. Feasibility study for beat-to-beat heart rate detection by smartphone’s accelerometers. In Proceedings of the E-Health and Bioengineering Conference (EHB), Iasi, Romania, 19–21 November 2015; pp. 3–6. [Google Scholar] [CrossRef]
- Landreani, F.; Martin-Yebra, A.; Casellato, C.; Frigo, C.; Pavan, E.; Migeotte, P.F.; Caiani, E.G. Beat-to-beat heart rate detection by smartphone’s accelerometers: Validation with ECG. In Proceedings of the 38th Annual International Conference of the IEEE Engineering in Medicine and Biology Society (EMBC), Orlando, FL, USA, 16–20 August 2016; pp. 525–528. [Google Scholar] [CrossRef]
- Landreani, F.; Caiani, E.G. Smartphone accelerometers for the detection of heart rate. Expert Rev. Med. Devic. 2017, 14, 935–948. [Google Scholar] [CrossRef] [PubMed]
- Sieciński, S.; Kostka, P. Determining Heart Rate Beat-to-Beat from Smartphone Seismocardiograms: Preliminary Studies. In Proceedings of the Innovations in Biomedical Engineering (IBE), Zabrze, Poland, 19–20 October 2017; Gzik, M., Tkacz, E., Paszenda, Z., Piętka, E., Eds.; Springer: Cham, Switzerland, 2018; Volume 623, pp. 133–140. [Google Scholar] [CrossRef]
- Gavriel, C.; Parker, K.H.; Faisal, A.A. Smartphone as an ultra-low cost medical tricorder for real-time cardiological measurements via ballistocardiography. In Proceedings of the IEEE 12th International Conference on Wearable and Implantable Body Sensor Networks (BSN), Cambridge, MA, USA, 9–12 June 2015. [Google Scholar] [CrossRef]
- Ramos-Castro, J.; Moreno, J.; Miranda-Vidal, H.; Garcia-Gonzalez, M.A.; Fernandez-Chimeno, M.; Rodas, G.; Capdevila, L. Heart rate variability analysis using a seismocardiogram signal. In Proceedings of the Annual International Conference of the IEEE Engineering in Medicine and Biology Society, San Diego, CA, USA, 28 August–1 September 2012; pp. 5642–5645. [Google Scholar] [CrossRef]
- Koivisto, T.; Lahdenoja, O.; Hurnanen, T.; Knuutila, T.; Vasankari, T.; Kiviniemi, T.; Pankaala, M. Detecting atrial fibrillation via existing smartphones without any add-ons. In Proceedings of the ESC Congress, Rome, Italy, 27–31 August 2016. [Google Scholar]
- Rodriguez, J.; Blaber, A.P.; Kneihsl, M.; Ruedl, R.; Green, D.A.; Broadbent, J.; Goswami, N. Poststroke alterations in heart rate variability during orthostatic challenge. Medicine 2017, 96, e5989. [Google Scholar] [CrossRef] [PubMed] [Green Version]
- Heart rate variability. Standards of measurement, physiological interpretation, and clinical use. Task Force of the European Society of Cardiology and the North American Society of Pacing and Electrophysiology. Eur. Heart J. 1996, 17, 354–381. [CrossRef]
- Thayer, J.F.; Yamamoto, S.S.; Brosschot, J.F. The relationship of autonomic imbalance, heart rate variability and cardiovascular disease risk factors. Int. J. Cardiol. 2010, 141, 122–131. [Google Scholar] [CrossRef] [PubMed]
- Chessa, M.; Butera, G.; Lanza, G.A.; Bossone, E.; Delogu, A.; De Rosa, G.; Carminati, M. Role of heart rate variability in the early diagnosis of diabetic autonomic neuropathy in children. Herz 2002, 27, 785–790. [Google Scholar] [CrossRef]
- Pagani, M.; Malfatto, G.; Pierini, S.; Casati, R.; Masu, A.M.; Poli, M.; Malliani, A. Spectral analysis of heart rate variability in the assessment of autonomic diabetic neuropathy. J. Auton. Nervous Syst. 1988, 23, 143–153. [Google Scholar] [CrossRef]
- Nolan, J.; Flapan, A.D.; Capewell, S.; MacDonald, T.M.; Neilson, J.M.; Ewing, D.J. Decreased cardiac parasympathetic activity in chronic heart failure and its relation to left ventricular function. Br Heart J. 1992, 67, 482–485. [Google Scholar] [CrossRef] [PubMed]
- Taelman, J.; Vandeput, S.; Spaepen, A.; Van Huffel, S. Influence of Mental Stress on Heart Rate and Heart Rate Variability. In Proceedings of the 4th European Conference of the International Federation for Medical and Biological Engineering (IFMBE); Vander Sloten, J., Verdonck, P., Nyssen, M., Haueisen, J., Eds.; Springer: Berlin/Heidelberg, Germany, 2009; Volume 22, pp. 395–400. [Google Scholar] [CrossRef]
- Munoz, M.L.; Van Roon, A.; Riese, H.; Thio, C.; Oostenbroek, E.; Westrik, I.; Snieder, H. Validity of (Ultra-)Short recordings for heart rate variability measurements. PLoS ONE 2015, 10, 1–15. [Google Scholar] [CrossRef] [PubMed]
- Baek, H.J.; Cho, C.-H.; Cho, J.; Woo, J.-M. Reliability of Ultra-Short-Term Analysis as a Surrogate of Standard 5-Min Analysis of Heart Rate Variability. Telemed. E-Health 2015, 21. [Google Scholar] [CrossRef] [PubMed]
- Pecchia, L.; Castaldo, R.; Montesinos, L.; Melillo, P. Are ultra-short heart rate variability features good surrogates of short-term ones? State-of-the-art review and recommendations. Heal. Tech. Lett. 2018, 5, 94. [Google Scholar] [CrossRef] [PubMed]
- Castaldo, R.; Montesinos, L.; Melillo, P.; James, C.; Pecchia, L. Ultra-short term HRV features as surrogates of short term HRV: A case study on mental stress detection in real life. BMC Med. Inform. Decis. Mak. 2019, 19, 12. [Google Scholar] [CrossRef] [PubMed]
- Sloan, R.P.; Korten, J.B.; Myers, M.M. Components of heart rate reactivity during mental arithmetic with and without speaking. Physiol. Behav. 1991, 50, 1039–1045. [Google Scholar] [CrossRef]
- Brown, T.G.; Szabo, A.; Seraganian, P. Physical versus psychological determinants of heart rate reactivity to mental arithmetic. Psychophysiology 1988, 25, 532–537. [Google Scholar] [CrossRef]
- Sharpley, C.F.; Kamen, P.; Galatsis, M.; Heppel, R.; Veivers, C.; Claus, K. An examination of the relationship between resting heart rate variability and heart rate reactivity to a mental arithmetic stressor. Appl. Psychophysiol. Biofeedback 2000, 25, 143–153. [Google Scholar] [CrossRef]
- Pan, J.; Tompkins, W.J. A Real-Time QRS Detection Algorithm. IEEE Trans. Biomed. Eng 1985, BME-32, 230–236. [Google Scholar] [CrossRef]
- Sedghamiz, H. Matlab Implementation of Pan Tompkins ECG QRS Detector. 2014. Available online: https://www.researchgate.net/publication/313673153_Matlab_Implementation_of_Pan_Tompkins_ECG_QRS_detector. (accessed on 25 August 2019).
- Landreani, F.; Morri, M.; Martin-Yebra, A.; Casellato, C.; Pavan, E.; Frigo, C.; Caiani, E.G. Ultra-short-term heart rate variability analysis on accelerometric signals from mobile phone. In Proceedings of the E-Health and Bioengineering Conference (EHB), Sinaia, Romania, 22–24 June 2017; pp. 241–244. [Google Scholar] [CrossRef]
- Salahuddin, L.; Cho, J.; Jeong, M.G.; Kim, D. Ultra short term analysis of heart rate variability for monitoring mental stress in mobile settings. In Proceedings of the 29th Annual International Conference of the IEEE Engineering in Medicine and Biology Society, Lyon, France, 22–26 August 2007; pp. 4656–4659. [Google Scholar] [CrossRef]
- Elghozi, J.-L.; Julien, C. Sympathetic control of short-term heart rate variability and its pharmacological modulation. Fundam. Clin. Pharmacol. 2007, 21, 337–347. [Google Scholar] [CrossRef]
- Brasier, N.; Raichle, C.J.; Dörr, M.; Becke, A.; Nohturfft, V.; Weber, S.; Eckstein, J. Detection of atrial fibrillation with a smartphone camera: First prospective, international, two-centre, clinical validation study (DETECT AF PRO). Europace 2019, 21, 41–47. [Google Scholar] [CrossRef] [PubMed]
- Mohamed, R.; Youssef, M. HeartSense: Ubiquitous Accurate Multi-Modal Fusion-based Heart Rate Estimation Using Smartphones. In Proceedings of the ACM on Interactive, Mobile, Wearable and Ubiquitous Technologies; ACM: New York, NY, USA, 2017; Volume 1, pp. 1–18. [Google Scholar] [CrossRef]
- Böhm, M.; Reil, J.-C.; Deedwania, P.; Kim, J.B.; Borer, J.S. Resting heart rate: risk indicator and emerging risk factor in cardiovascular disease. Am. J. Medic. 2015, 128, 219–228. [Google Scholar] [CrossRef]
- Hamill, V.; Ford, I.; Fox, K.; Böhm, M.; Borer, J.S.; Ferrari, R.; Swedberg, K. Repeated heart rate measurement and cardiovascular outcomes in left ventricular systolic dysfunction. Am. J. Medic. 2015, 128, 1102–1108.e6. [Google Scholar] [CrossRef] [PubMed]
- Landreani, F.; Hossein, A.; Golier, D.; Caiani, E.; Van de Borne, P.; Rabineau, J.; Migeotte, P.-F. Heartbeat detection using three-axial seismocardiogram acquired by mobile phone. In Proceedings of the Computing in Cardiology Conference (CinC), Maastricht, The Netherlands, 23–26 September 2018. [Google Scholar] [CrossRef]
- Nussinovitch, U.; Cohen, O.; Kaminer, K.; Ilani, J.; Nussinovitch, N. Evaluating reliability of ultra-short ECG indices of heart rate variability in diabetes mellitus patients. J. Diabetes Complicat. 2012, 26, 450–453. [Google Scholar] [CrossRef] [PubMed]
- Stein, P.K.; Carney, R.M.; Freedland, K.E.; Skala, J.A.; Jaffe, A.S.; Kleiger, R.E.; Rottman, J.N. Severe depression is associated with markedly reduced heart rate variability in patients with stable coronary heart disease. J. Psychosom. Res. 2000, 48, 493–500. [Google Scholar] [CrossRef]
- La Rovere, M.T.; Pinna, G.D.; Maestri, R.; Mortara, A.; Capomolla, S.; Febo, O.; Cobelli, F. Short-term heart rate variability strongly predicts sudden cardiac death in chronic heart failure patients. Circulation 2003, 107, 565–570. [Google Scholar] [CrossRef] [PubMed]
- Carney, R.M.; Saunders, R.D.; Freedland, K.E.; Stein, P.; Rich, M.W.; Jaffe, A.S. Association of depression witk reduced heart rate variability in coronary artery disease. Am. J. Cardiol. 1995, 76, 562–564. [Google Scholar] [CrossRef]
- Kupari, M.; Virolainen, J.; Koskinen, P.; Tikkanen, M.J. Short-term heart rate variability and factors modifying the risk of coronary artery disease in a population sample. Am. J. Cardiol. 1993, 72, 897–903. [Google Scholar] [CrossRef]
- Kwon, O.; Jeong, J.; Kim, H.B.; Kwon, I.H.; Park, S.Y.; Kim, J.E.; Choi, Y. Electrocardiogram sampling frequency range acceptable for heart rate variability analysis. Healthc. Inform. Res. 2018, 24, 198. [Google Scholar] [CrossRef]


| Age (y) | Weight (Kg) | Height (m) | BMI (Kg/m2) |
|---|---|---|---|
| 22 (21–23) | 67.5 (61–75.5) | 180 (169–184) | 21.5 (20.3–22.9) |
| Heart Cycle Duration (ms) | ||||||
|---|---|---|---|---|---|---|
| REST | MS | REST | MS | REST | MS | |
| 60 ‘’ | ||||||
| RR | 887 (780–985) | 740 * (580–827) | ||||
| OPT | 887 (780–987) | 741 * (584–830) | ||||
| 30 ″ | ||||||
| initial | central | final | ||||
| RR | 909 (813-967) | 814 * (630–852) | 888 (779–992) | 748 * (570–832) | 869 (769–1002) | 667 * (573–850) |
| OPT | 912 (813–968) | 814 * (631–852) | 888 (779–993) | 747 * (571–832) | 869 (768–1002) | 668 * (576–850) |
| 10 ″ | ||||||
| RR | 893 (827–993) | 792 * (640–824) | 886 (774–982) | 737 * (575–822) | 867 (780–1029) | 662 * (573–898) |
| OPT | 892 (828–924) | 792 * (640–823) | 887 (774–982) | 740 * (576–822) | 866 (780–1029) | 659 * (575–898) |
| SDNN (ms) | ||||||
|---|---|---|---|---|---|---|
| REST | MS | REST | MS | REST | MS | |
| 60 ″ | ||||||
| RR | 48 (41–64) | 42 (27–72) | ||||
| OPT | 54 (43–66) | 45 (32–72) | ||||
| 30 ″ | ||||||
| initial | central | final | ||||
| RR | 44 (36–62) | 44 † (24–54) | 42 (35–68) | 39 #, † (28–61) | 47 (34–58) | 26 *, † (19–34) |
| OPT | 46 (39–73) | 47 † (24–55) | 47 (40–65) | 39 #, † (27–51) | 49 (37–69) | 29 *, † (21–38) |
| 10 ″ | ||||||
| RR | 45 (31–65) | 24 (19–49) | 39 (19–47) | 26 # (16–42) | 44 (29-78) | 21 * (18–28) |
| OPT | 47 (36–62) | 40 (22–50) | 38 (35–66) | 31 # (21–44) | 46 (33–79) | 25 * (21–30) |
| RMSSD (ms) | |||||||
|---|---|---|---|---|---|---|---|
| REST | MS | REST | MS | REST | MS | ||
| 60 ″ | |||||||
| RR | 39 (30–65) | 23 * (14–23) | |||||
| OPT | 48 (38–76) | 36 * (25–48) | |||||
| 30 ″ | |||||||
| initial | Central | final | |||||
| RR | 57 (30–63) | 31 *† (13–40) | 40 (24–67) | 22 * (10–30) | 49 (29–66) | 19 *† (11–27) | |
| OPT | 60 † (38–91) | 31 * (21–49) | 51 † (38-73) | 36 * (24-45) | 48 # (38–77) | 27 * (18–39) | |
| 10 ″ | |||||||
| RR | 54 (36–69) | 32 * (15-48) | 41 (27-61) | 20 * (11–30) | 57 (35-65) | 21 * (14-29) | |
| OPT | 61 (38–77) | 36 * (24–52) | 47 (36–78) | 27 * (20–35) | 56 (38–70) | 26 * (21–24) | |
© 2019 by the authors. Licensee MDPI, Basel, Switzerland. This article is an open access article distributed under the terms and conditions of the Creative Commons Attribution (CC BY) license (http://creativecommons.org/licenses/by/4.0/).
Share and Cite
Landreani, F.; Faini, A.; Martin-Yebra, A.; Morri, M.; Parati, G.; Caiani, E.G. Assessment of Ultra-Short Heart Variability Indices Derived by Smartphone Accelerometers for Stress Detection. Sensors 2019, 19, 3729. https://doi.org/10.3390/s19173729
Landreani F, Faini A, Martin-Yebra A, Morri M, Parati G, Caiani EG. Assessment of Ultra-Short Heart Variability Indices Derived by Smartphone Accelerometers for Stress Detection. Sensors. 2019; 19(17):3729. https://doi.org/10.3390/s19173729
Chicago/Turabian StyleLandreani, Federica, Andrea Faini, Alba Martin-Yebra, Mattia Morri, Gianfranco Parati, and Enrico Gianluca Caiani. 2019. "Assessment of Ultra-Short Heart Variability Indices Derived by Smartphone Accelerometers for Stress Detection" Sensors 19, no. 17: 3729. https://doi.org/10.3390/s19173729