Flexural Capacity and Deflection of Fiber-Reinforced Lightweight Aggregate Concrete Beams Reinforced with GFRP Bars

School of Civil Engineering, Chang’an University, Xi’an 710061, China
*
Author to whom correspondence should be addressed.
Sensors 2019, 19(4), 873; https://doi.org/10.3390/s19040873
Submission received: 18 January 2019
/
Revised: 31 January 2019
/
Accepted: 13 February 2019
/
Published: 20 February 2019
(This article belongs to the Special Issue Advances in FRP Composites: Applications, Sensing, and Monitoring)
Abstract
:Adding fibers is highly effective to enhance the deflection and ductility of fiber-reinforced polymer (FRP)-reinforced beams. In this study, the stress and strain conditions of FRP-reinforced lightweight aggregate concrete (LWC) beams with and without fibers at ultimate load level were specified. Based on the sectional analyses, alternative equations to predict the balanced reinforcement ratio and flexural capacity for beams failed by balanced failure and concrete crushing were established. A rational equation for estimating the short-term stiffness of FRP–LWC beams at service-load levels was suggested based on Zhu’s model. In addition, the contribution of the steel fibers on the short-term stiffness was quantified incorporating the effects of FRP reinforcement ratio. The proposed short-term stiffness model was validated with measured deflections from an experimental database for fiber-reinforced normal weight concrete (FNWC) beams reinforced with FRP bars. Furthermore, six glass fiber-reinforced polymer (GFRP)-reinforced LWC beams with and without steel fibers were tested under four-point bending. Based on the test results, the proposed models and procedures according to current design codes ACI 440.1R, ISIS-M03, GB 50608, and CSA S806 were linked together by comparing their predictions. The results showed that increasing the reinforcement ratio and adding steel fibers decreased the strain of the FRP bars. The flexural capacity of the LWC beams with and without steel fibers was generally underestimated by the design codes, while the proposed model provided accurate ultimate moment predictions. Moreover, the proposed short-term stiffness model yielded reasonable estimations of deflection for both steel fiber-reinforced lightweight aggregate concrete (SFLWC) and FNWC beams.
1. Introduction
Steel reinforcement corrodes rapidly when exposed. With the urgency of the sustainable infrastructure development and the innovation of structural system, fiber-reinforced polymer (FRP) bar has become increasingly applied in engineering construction as a substitute to conventional steel reinforcement, due to its lightweight, high tensile strength and non-corrosive properties [1,2,3,4,5]. On the other hand, the artificial lightweight aggregates constitute promising alternatives to natural aggregates due to their environmentally-friendly production process [6]. Moreover, the reduced mass of lightweight aggregate concrete (LWC) allows for a reduction in cross section and reinforcement amount in the concrete structural members, and thus exerts a favorable effect on both seismic resistance and economy [7]. In view of the characteristics of FRP and fiber-reinforced lightweight aggregate concrete (FLWC), their combined use could be beneficial not only in improving the strength-to-weight ratio, but also in decreasing the overall life cost of the structures [8].
FRP bars display linear elastic behavior in tension until failure and exhibit no yielding. Therefore, for FRP-reinforced concrete (FRP-RC) beams, the over-reinforced section design is recommended by most of the design codes [9,10], since the failure mode of concrete crushing is less catastrophic than FRP rupture. However, the strong brittleness of the LWC could bring adverse impacts on the ductility performance of the FRP-RC beams. Furthermore, the FRP-RC beams tend to experience large deflection due to the low elastic modulus of the FRP bars. The incorporation of fibers in concrete has been proved to be effective in enhancing the deflection and ductility performance altogether [11]. It should be mentioned that the use of steel fibers in FRP-RC beams was found to be valid because the corrosion of the steel fibers had a marginal effect on the performance of the members, even for high concentrations of chloride solutions [12].
Numerous research studies have been conducted on the prediction of ultimate moment and deflection of FRP-RC beams reinforced with steel fibers. Yang et al. [13] investigated the accuracy of ultimate capacity models based on test results of carbon fiber-reinforced polymer (CFRP)-reinforced beams with steel fibers and confirmed that the ultimate moment could be correctly estimated by ACI 544.4R and Campione when the ultimate concrete compressive strain was assumed as 0.004. Issa et al. [14] compared the test results of fibrous glass fiber-reinforced polymer (GFRP)-reinforced concrete beams to the available models and concluded that the ultimate moment capacity was strongly underestimated by ACI 440.1R, while the effective moment of inertia equation proposed by Faza and Ganga Rao [15] yielded the best deflection predictions through comparison. Yoo et al. [16] carried out flexural tests on ultra-high-performance fiber-reinforced concrete beams reinforced with GFRP bars, and modified the deflection model in ACI 440.1R considering the fiber reinforcement in the tensile zone after cracking.
Up to now, research concerning bearing capacity and deformation of FRP-reinforced beams fabricated using LWC, especially FLWC, was still limited. This paper aims to establish the balanced reinforcement ratio, ultimate moment and deflection equations of LWC beams with and without fibers.
2. Balanced Reinforcement Ratio and Ultimate Moment Model of FRP–FLWC Beams
2.1. Strain and Stress Conditions
The balanced failure refers to the failure mode in which the FRP tendons reach their ultimate tensile strain (εfu) and the concrete reaches its ultimate compressive strain (εcu) simultaneously. The corresponding reinforcement ratio is the balanced reinforcement ratio (ρfb), which is the theoretical demarcation point to identify the failure mode of FRP-RC flexural members. At maximum load levels, FRP-reinforced beams generally experienced significant flexural cracking, although the fibers were added in the concrete [13,17]. Considering the fact that the fibers were pulled out or ruptured in cracked section, the tensile loads could not be transferred across the cracks by the bridging of fibers. Therefore, it is assumed that the concrete tensile stress in pre-cracking tensile zone (γ2d) distributes linearly, while concrete tensile strength in cracked section (d(1 − γ1 − γ2)) is ignored (Figure 1). In addition, the following assumptions are made for the calculation of the ρfb and the ultimate moment (Mu) of FRP–FLWC beams:
- (1)
- Strain in the concrete and the FRP reinforcement is proportional to the distance from the neutral axis;
- (2)
- The tensile behavior of the FRP reinforcement is linearly elastic;
- (3)
- (4)
- The reinforcing steel rebar in the compression zone is yielded;
- (5)
- A perfect bond exists between concrete and FRP reinforcement.
2.2. Prediction for Balanced Failure Mode
Based on the strain and stress conditions for balanced failure mode displayed in Figure 1, the ρfb can be determined using strain compatibility approach:
where is the area of compressive reinforcement; b is the beam width; d is the beam effective depth; fc is the prism compressive strength of concrete; ffu is the tensile strength of the FRP bars; ft−F is the tensile strength of the fiber-reinforced concrete; is the yield strength of the steel rebars; εct is the peak tensile strain of the concrete; εcu is the ultimate compressive strain of the concrete which assumed to be 0.0033 according to GB 50608 [20]; γ1 is the coefficient of neutral axis depth; γ2 is the coefficient of effective tensile concrete depth; α1, β1 are the stress-block factors for concrete, which can be determined by Equation (2), respectively.
where fcu is the cube compressive strength of concrete.
Combining Equations (1) and (2), the unknown value γ1 and γ2 can be obtained. Thereafter, the ρfb and the Mu can be expressed by Equations (3) and (4), respectively.
where is the concrete cover measured from the centroid of compressive reinforcement to the extreme compressive surface.
2.3. Prediction for Concrete Crushing Failure Mode
For beams that are damaged due to concrete crushing, based on the strain and stress conditions displayed in Figure 2, strain compatibility and force equilibrium are considered as follows:
where ff is the tensile stress of the FRP bars; εf is the tensile strain of the FRP bars; ρf is the reinforcement ratio of the FRP bars.
As for the ultimate moment, Equation (4) can be also employed in the concrete crushing case since similar simplification of the stress distribution of concrete in the tension and compression zone is adopted.
3. Deflection Model of FRP-Reinforced Beams
3.1. Prediction for Beams without Fibers
The curvature of FRP-RC members can be calculated based on the εf, considering its nonuniform distribution between cracks, as shown in Figure 3.
where εc is the compressive strain of the concrete; is the average compressive strain of the concrete; is the average tensile strain of the FRP bars; ψ is the nonuniformity coefficient of strain.
In GB 50608, the semi-empirical equation of the short-term stiffness (Bs) was established by solving first the curvature (Equation (7)), based on the stiffness analytic method shown in Figure 3.
where Af is the area of tension FRP bars; αfE is the ratio of modulus of elasticity of FRP bars to modulus of elasticity of concrete; Ef is the modulus of elasticity of the FRP bars; η is the coefficient of the internal lever arm length, which is 0.87 and 0.85 for normal weight concrete and LWC beams, respectively. The ψ was given as
where ft is the tensile strength of concrete; M is the actual bending moment; ρte is the reinforcement ratio of the FRP bars on the basis of the effective cross-sectional area of concrete. It should be mentioned that the empirical parameters employed in Equations (7) and (8) were the same as those for steel reinforced beams.
Since the parameter ψ was included to reflect the variation in strain along the longitudinal reinforcement, accounting for the distinctive material properties of FRP reinforcements as compared with steel rebars, the ψ in Equation (8) might not be applicable to beams reinforced with FRP bars. Through regression analysis on experimental deflections of GFRP-reinforced flexural members at service-load levels, the empirical formula of the nonuniformity coefficient of strain in FRP bars (ψf) was presented in the following Equation [21]:
By substituting Equation (9) into Equation (7), the short-term stiffness of beams reinforced with FRP bars (Bs,f) can be expressed by
3.2. Prediction for Beams Reinforced with Fibers
It has been proven that the concrete tensile strength increases with the volume fraction (ρfi) and aspect ratio (lfi/dfi) of the fibers [22]. Based on this, the conversion between the tensile strengths of the concrete with and without fibers can be performed according to Equation (11).
where αt is the influence coefficient of fiber on the tensile strength of the concrete; λfi is the feature parameter of fiber, which can be calculated by
where lfi and dfi are the length and the diameter of fiber, respectively.
However, in the case of FRP-RC beams, it was observed that the improvement of their stiffness from the bridging effect of the fibers was reduced with the increasing reinforcement ratio [23]. With this in mind, the form of the amplification factor (1 + αtλf) in Equation (11) is modified and the stiffness of FRP–FLWC beams (Bs,f−F) can be expressed as
Based on the tensile tests on the plain and fibrous LWC, the αt can be determined by Equation (14), which is derived from Equation (11).
3.3. Verification Based on Fiber-Reinforced Normal Weight Concrete (FNWC) Beams
In order to evaluate the accuracy of the short-term stiffness model proposed, the measured and predicted deflections under service load levels (Ms) of FNWC beams reinforced with FRP bars tested in the literature are compared in Table 1 and Figure 4. It should be mentioned that the tensile strength of the concrete was ignored in the calculation of ρfb due to its absence in most literature. Furthermore, since the ratio between the cracking moment of the beams was considered close to that between the tensile strength of the concrete used [23], the factor (ft−F − ft)/ft in Equation (14) was replaced by (Mcr−F − Mcr)/Mcr, where Mcr−F and Mcr are the cracking moments of the FRP-reinforced beams with and without fibers, respectively.
The results in Figure 4 indicated that the estimations were generally in good agreement with the experimental results, although the definition of the service load given by the researchers was not unified. However, specimens with higher ρf/ρfb tended to yield higher experimental-to-predicted deflection ratios (ΔExp/ΔPred). It can be derived that the influence of ρf/ρfb on the Bs,f−F presented in Equation (13) was overestimated.
4. Models Recommended by Design Codes
4.1. Balanced Reinforcement Ratio and Ultimate Moment
Strain compatibility approaches were used to calculate ρfb and Mu in current design codes. The ρfb was determined from Equation (15) for ACI 440.1R and CSA S806, and Equation (16) for GB 50608, respectively. Moreover, stress-block factors for concrete (α1, β1) were computed by Equation (2), Equation (17) and Equation (18) for GB 50608, ACI 440.1R and CSA S806, respectively.
In ACI 440.1R, the Mu is given by Equation (19) when ρf ≥ ρfb
where the tensile strength of FRP bars (ff) could be calculated using the following equation:
In ISIS M03 [26], the Mu for beams with ρf ≥ ρfb could be obtained according to Equation (21).
where c is the neutral axis depth from the top compression fiber, which was determined using Equation (22) as follows:
Based on semiempirical considerations, GB 50608 recommended Mu equation as:
The experienced formula of ff was expressed as a piecewise function:
4.2. Deflection
In design codes GB 50608, ISIS-M03 and ACI 440.1R, the procedures to calculate the deflections of simply supported FRP-RC beams under four-point bending entailed the calculation of the average stiffness throughout the beam length.
where a is the beam shear span; P is the applied concentrated load; Δ is the midspan deflection; A represents the beam average stiffness, which is Bs in GB 50608, and is the product of the elastic modulus of the concrete (Ec) and the effective moment of inertia (Ie) in ISIS-M03 and ACI 440.1R.
ACI 440.1R employed the Ie in predicting the deflection of FRP-RC beams. The formula for Ie was modified Bischoff’s expression [27,28]:
where Icr is the cracked moment of inertia; Ig is the gross moment of inertia; Ma is the actual bending moment; The reduction factor γ was included to account for the variation in stiffness along the length of the member
The alternative expression for Ie suggested by ISIS-M03 was confirmed to be conservative over the entire range of the test specimens by Mota et al. [29]:
where It is the second moment of area of the uncracked section transformed to concrete.
CSA S806 predicted the deflection of FRP-RC members using moment–curvature method:
where Lg is the uncracked beam length.
5. Experimental Study of GFRP-Reinforced LWC Beams
5.1. Test Specimens and Material Properties
To study the influence of steel fibers and FRP reinforcement ratio, six GFRP-reinforced LWC beams were constructed and tested under four-point bending. Beam geometry and the loading and support arrangement are illustrated in Figure 5 and Figure 6, respectively. Strain gauges were installed on the FRP reinforcement at midspan and on the top surface of the concrete in the constant moment region to monitor their strain during the loading process.
LWC with steel fiber contents of 0% and 0.6%, respectively, were used to fabricate the specimens. The properties of steel fibers are listed in Table 2. The cube compressive strength fcu were obtained from testing three 100 mm cubes for each beam on the day of testing. The tensile strengths of the LWC and steel fiber-reinforced lightweight aggregate concrete (SFLWC) were 5.12 MPa and 8.16 MPa, respectively.
Sand coated GFRP bars with a diameter of 13.77 mm were used as longitudinal reinforcements. The diameters and mechanical properties of the GFRP bars were determined according to ACI 440.3R [30]. Steel rebars with diameter, tensile strength and elastic modulus of 10.62 mm, 445 MPa and 204 GPa, respectively, were used as transverse and top reinforcements. Table 3 presents the mechanical properties of the GFRP bars and the details of the tested specimens.
The beams were labeled as following: LC or SL for lightweight aggregate concrete or steel fiber-reinforced lightweight aggregate concrete; then G for GFRP bars; finally, the reinforcement ratio (percent). For instance, LCG–0.92 indicates a lightweight aggregate concrete beam with GFRP reinforcement ratio of 0.92%.
5.2. Test Results
The test results are shown in Table 3, and the typical failure shapes of the specimens are depicted in Figure 7. Crushing of lightweight aggregates (LWAs) could be observed at the fractured surface in the compression zone (Figure 7b–d), owing to their low compressive strength. This was a distinctive fracture pattern of LWC beams as compared with the ordinary concrete ones. Figure 8 shows the strains in the tensile FRP bars and the compressive concrete against the applied moment of the specimens. The reinforcement strain of beam SLC–0.92 is not presented since the strain gauges were broken down. Both the moment–FRP and concrete strain responses could be divided into two segments. The first stage was a steep linear curve corresponding to the behavior before cracking, wherein the FRP bars and concrete exhibited little strain, while the second was a basically linear segment represented the post-cracking behavior. In addition, increasing the reinforcement ratio and adding steel fibers could restrain the deformation of the FRP bars, indicating their benefit achieved in flexural stiffness of the beams. Figure 8 also illustrates that the concrete strain at the maximum load level generally exceeded the assumed concrete compressive strain recommended by GB 50608.
6. Comparison between the Experimental and Predicted Results
6.1. Balanced Reinforcement Ratio and Ultimate Moment of LWC Beams
The relative reinforcement ratio ρf/ρfb of the tested specimens according to GB 50608, CSA S806, ACI 440.1R and Equation (3) are presented in Table 4. It is to be noted that the tensile strength of the LWC without steel fibers was ignored. The results indicated that specimens with ρf/ρfb close to 1 all possibly damaged by balanced failure, which could be attributed to the discreteness of material strength. In addition, the greater ρf/ρfb lent a higher degree of concrete crushing when FRP bars ruptured (Figure 7a–c). As presented in Table 4, CSA S806 provided more conservative ρf/ρfb than ACI 440.1R although the same ρfb equation was used. This could be ascribed to the higher concrete compressive strain assumed. Additionally, the proposed model provided the lowest ρf/ρfb among all the models since the contribution of the compressive reinforcements was included.
Based on the actual failure mode, the experimental-to-predicted ultimate capacity ratios (Mu,Exp/Mu,Pred) of the specimens according to design codes and the proposed model are summarized in Table 4. Unfilled and filled points are used to represent the Mu,Exp/Mu,Pred of the LWC and SFLWC specimens in Figure 9, respectively. As shown in Figure 9, the estimated Mu according to the design codes were generally lower than the experimental results since the contribution of the steel fibers and the reinforcement in the compression zone was ignored.
For LWC beams, the average Mu,Exp/Mu,Pred based on GB 50608, CSA S806, and ACI 440.1R were 1.06 ± 0.07, 1.10 ± 0.05, 1.20 ± 0.1, respectively. Additionally, the predictions obtained from the proposed model were in good agreement with the experimental results with an average Mu,Exp/Mu,Pred of 1.01 ± 0.10.
In the case of the SFLWC specimens, GB 50608, CSA S806, and ACI 440.1R provided conservative ultimate capacities with average Mu,Exp/Mu,Pred of 1.19 ± 0.01, 1.21 ± 0.04, 1.31 ± 0.09, respectively. On the other hand, the proposed model yielded most accurate predictions with an average Mu,Exp/Mu,Pred of 1.02 ± 0.13.
As a perfect bond between concrete and FRP reinforcement was assumed, the deformation caused by relative slip between the LWC and the FRP reinforcement was ignored. Based on the plane section assumption, the actual depth of the compression zone was lower than the calculated value. Therefore, this assumption would result in overestimation of the ultimate capacity.
6.2. Deflection of LWC Beams
Bischoff et al. [31] recommended a load corresponding to 30% of the Mu as service load (Ms) for FRP-RC beams. Table 5 and Figure 10 compare the experimental deflections with the theoretical results estimated by design codes ACI 440.1R, CSA S806, ISIS-M03 and GB 50608 and the proposed model. The ΔExp/ΔPred of the LWC and SFLWC specimens with varied ρf are represented by unfilled and filled points in Figure 10, respectively. For LWC beams, CSA S806 and ISIS-M03 overestimated the deflections with average ΔExp/ΔPred of 0.83 ± 0.06 and 0.86 ± 0.04, respectively. On the other hand, GB 50608 gave unconservative predictions with an average ΔExp/ΔPred of 1.34 ± 0.20. Moreover, ACI 440.1R and the proposed model showed accurate predictions with average ΔExp/ΔPred of 1.01 ± 0.06 and 1.07 ± 0.13, respectively.
In the case of the SFLWC specimens, the measured results were generally lower compared to the predicted deflections based on the design codes, owing to the benefits offered by the steel fibers. At Ms, CSA S806 and ISIS-M03 provided significantly conservative estimations with average ΔExp/ΔPred of 0.56 ± 0.20 and 0.59 ± 0.20, respectively. ACI 440.1R and GB 50608 slightly overestimated the deflections with average ΔExp/ΔPred of 0.73 ± 0.17 and 0.88 ± 0.08, respectively. Furthermore, it was confirmed that the deflections could be reasonably estimated by the proposed model with an average ΔExp/ΔPred of 1.06 ± 0.04. Similarly, the results in Figure 10 could be taken as an evidence for the overestimation of the influence of ρf/ρfb in Equation (12). Considering the overall predictions of LWC and SFLWC beams, the proposed model provided the lowest COV among the equations used, namely, 7%.
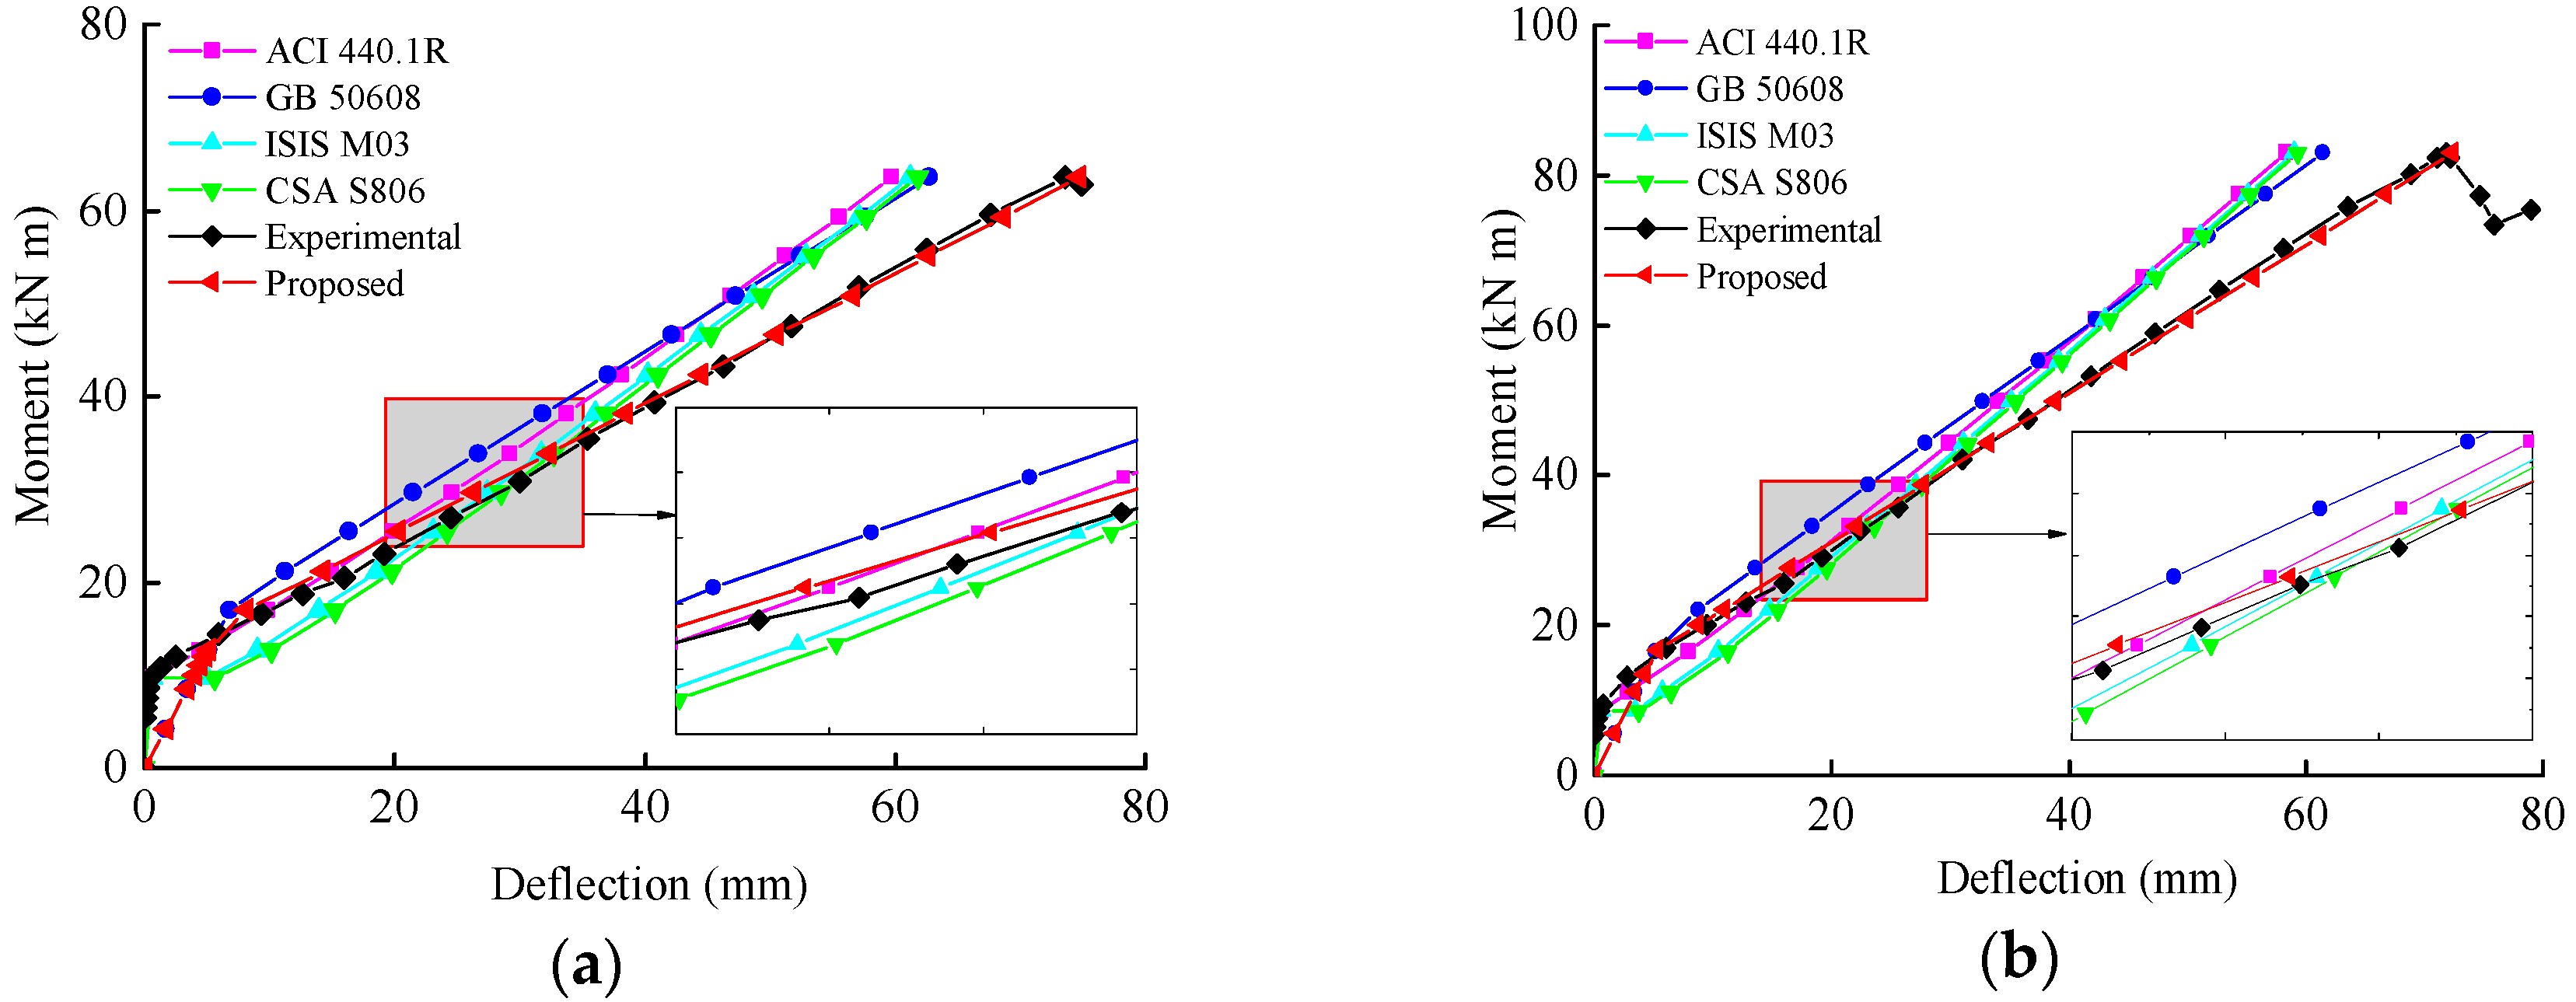
Figure 11 compares the experimental and theoretical moment–deflection responses of the tested specimens. As the figure shows, for the LWC beams, the proposed equation yielded similar load versus midspan deflection behaviors with the test data during the entire loading period. However, for beams reinforced with steel fibers, the proposed model yielded accurate estimations only at service-load levels. This could be attributed to the fact that the improvement of the stiffness from the steel fibers gradually diminished as the fibers pulled out in succession at high-load levels.
7. Conclusions
This paper establishes the balanced reinforcement ratio, ultimate moment and deflection equations of LWC beams with and without fibers. The accuracy of the proposed models was investigated based on experimental results. The following conclusions can be drawn:
- (1)
- Increasing the reinforcement ratio and adding steel fibers were shown to be effective in decreasing the FRP strain of FRP-reinforced LWC beams.
- (2)
- Design codes ACI 440.1R, ISIS-M03, GB 50608, and CSA S806 generally underestimated the flexural capacity of the GFRP-LWC beams with and without steel fibers. The predictions obtained from the proposed ultimate moment equation were in good agreement with the experimental results.
- (3)
- For GFRP-SFLWC beams, the design codes showed conservative deflection values at Ms, while the proposed short-term stiffness model provided reasonable predictions with low dispersion degree.
- (4)
- In both case of SFLWC and FNWC beams, specimens with higher ρf/ρfb tended to yield higher experimental-to-predicted deflection ratios based on the proposed model. Further research will be conducted involving rational consideration of the FRP reinforcement amount in the deflection model of fiber-reinforced beams.
Author Contributions
Conceptualization, X.L.; Data curation, X.L. and Y.S.; Formal analysis, Y.S.; Funding acquisition, X.L. and T.W.; Investigation, X.L.; Supervision, T.W.; Visualization, Y.S.; Writing—original draft, X.L.; Writing—review & editing, X.L., Y.S. and T.W.
Funding
This research was funded by National Natural Science Foundation of China (Grants No. 51878054, 51578072 and 51708036), the Natural Science Foundation of Shaanxi Province (Grant No. 2017JQ5092), and the Fundamental Research Funds for the Central Universities (Grant No. 300102288401).
Conflicts of Interest
The authors declare no conflicts of interest.
References
- Dong, Z.; Wu, G.; Xu, Y. Experimental study on the bond durability between steel-FRP composite bars (SFCBs) and sea sand concrete in ocean environment. Constr. Build. Mater. 2016, 115, 277–284. [Google Scholar] [CrossRef]
- Zheng, Y.; Yu, T.; Yang, J.; Li, Y.; Sun, C. Investigation of the behaviour of reinforcement-free concrete deck slabs restrained by FRP rods. Eng. Struct. 2017, 135, 191–208. [Google Scholar] [CrossRef]
- Zheng, Y.; Li, C.; Yang, J.; Yu, T.; Sun, C. Influence of arching action on shear behaviour of laterally restrained concrete slabs reinforced with GFRP bars. Compos. Struct. 2015, 132, 20–34. [Google Scholar] [CrossRef]
- Xia, L.; Zheng, Y. Deep embedment (DE) FRP shear strengthening of concrete bridge slabs under loads close to supports. Appl. Sci. 2018, 8, 721. [Google Scholar] [CrossRef]
- Xu, K.; Ren, C.; Deng, Q.; Jin, Q.; Chen, X. Real-time monitoring of bond slip between GFRP bar and concrete structure using piezoceramic transducer-enabled active sensing. Sensors 2018, 18, 2653. [Google Scholar] [CrossRef] [PubMed]
- Kayali, O. Fly ash lightweight aggregates in high performance concrete. Constr. Build. Mater. 2008, 22, 2393–2399. [Google Scholar] [CrossRef]
- Bogas, J.A.; Brito, J.D.; Cabaço, J. Long-term behaviour of concrete produced with recycled lightweight expanded clay aggregate concrete. Constr. Build. Mater. 2014, 65, 470–479. [Google Scholar] [CrossRef]
- Li, P.; Sui, L.; Xing, F.; Huang, X.; Zhou, Y.; Yun, Y. Effects of aggregate types on the stress-strain behavior of fiber reinforced polymer (FRP)-confined lightweight concrete. Sensors 2018, 18, 3525. [Google Scholar] [CrossRef]
- ACI 440.1R. Guide for the Design and Construction of Structural Concrete Reinforced with Fiber-Reinforced Polymer Bars; American Concrete Institute: Farmington Hills, MI, USA, 2015. [Google Scholar]
- CSA S806. Design and Construction of Building Structures with Fibre-Reinforced Polymers; Canadian Standards Association: Toronto, ON, Canada, 2012. [Google Scholar]
- Wang, H.Z.; Belarbi, A. Flexural durability of FRP bars embedded in fiber-reinforced-concrete. Constr. Build. Mater. 2013, 44, 541–550. [Google Scholar] [CrossRef]
- Lambrechts, A.; Nemegeer, D.; Vanbrabant, J.; Stang, H. Durability of steel fibre reinforced concrete. Spec. Publ. 2003, 212, 667–684. [Google Scholar]
- Yang, J.M.; Min, K.H.; Shin, H.O.; Yoon, Y.S. Effect of steel and synthetic fibers on flexural behavior of high-strength concrete beams reinforced with FRP bars. Compos. Part. B Eng. 2012, 43, 1077–1086. [Google Scholar] [CrossRef]
- Issa, M.S.; Metwally, I.M.; Elzeiny, S.M. Influence of fibers on flexural behavior and ductility of concrete beams reinforced with GFRP rebars. Eng. Struct. 2011, 33, 1754–1763. [Google Scholar] [CrossRef]
- Faza, S.S.; Ganga Rao, H.V.S. Bending and bond behavior of concrete beams reinforced with plastic rebars. Transport. Res. Rec. 1990, 1, 185–193. [Google Scholar]
- Yoo, D.Y.; Banthia, N.; Yoon, Y.S. Predicting service deflection of ultra-high-performance fiber reinforced concrete beams reinforced with GFRP bar. Compos. Part B 2016, 99, 381–397. [Google Scholar] [CrossRef]
- Zhu, H.T.; Cheng, S.Z.; Gao, D.Y.; Neaz, S.M.; Li, C. Flexural behavior of partially fiber-reinforced high-strength concrete beams reinforced with FRP bars. Constr. Build. Mater. 2018, 161, 587–597. [Google Scholar] [CrossRef]
- ACI 544.4R. Guide to Design with Fiber-Reinforced Concrete; American Concrete Institute: Farmington Hills, MI, USA, 2018. [Google Scholar]
- JGJ12-2006. Technical Specification for Lightweight Aggregate Concrete Structures; China Engineering and Construction Society Press: Beijing, China, 2006. [Google Scholar]
- GB 50608. Technical Code for Infrastructure Application of FRP Composites; China Planning Press: Beijing, China, 2010. [Google Scholar]
- Zhu, H.; Dong, Z.Q.; Wu, G.; Wu, Z.S. Experimental study and theoretical calculation on the flexural stiffness of concrete beams reinforced with FRP bars. Chin. Civ. Eng. J. 2015, 48, 44–53. [Google Scholar]
- Oh, B.H. Flexural Analysis of Reinforced Concrete Beams Containing Steel Fibers. J. Struct. Eng. 1992, 118, 2821–2836. [Google Scholar] [CrossRef]
- El-Nemr, A.; Ahmed, E.A.; Benmokrane, B. Flexural behavior and serviceability of normal- and high-strength concrete beams reinforced with glass fiber-reinforced polymer bars. ACI Struct. J. 2013, 110, 1077–1087. [Google Scholar]
- Rashid, M.A.; Mansur, M.A.; Paramasivam, P. Behavior of aramid fiber-reinforced polymer reinforced high strength concrete beams under bending. J. Compos. Constr. 2005, 9, 117–127. [Google Scholar] [CrossRef]
- Saikia, B.; Kumar, P.; Thomas, J.; Rao, K.S.N.; Ramaswamy, A. Strength and serviceability performance of beams reinforced with GFRP bars in flexure. Constr. Build. Mater. 2007, 21, 1709–1719. [Google Scholar] [CrossRef] [Green Version]
- ISIS-M03. Reinforcing Concrete Structures with Fibre Reinforced Polymers; Intelligent Sensing for Innovative Structures: Manitoba, MB, Canada, 2007. [Google Scholar]
- Bischoff, P.H. Reevaluation of deflection prediction for concrete beams reinforced with steel and fiber reinforced polymer bars. J. Struct. Eng. 2005, 131, 752–767. [Google Scholar] [CrossRef]
- Bischoff, P.H.; Gross, S.P. Equivalent moment of inertia based on integration of curvature. J. Compos. Constr. 2011, 15, 263–273. [Google Scholar] [CrossRef]
- Mota, C.; Alminar, S.; Svecova, D. Critical review of deflection formulas for FRP-RC members. J. Compos. Constr. 2006, 10, 183–194. [Google Scholar] [CrossRef]
- ACI 440.3R. Guide Test Methods for Fiber-Reinforced Polymers (FRPs) for Reinforcing or Strengthening Concrete Structures; American Concrete Institute: Farmington Hills, MI, USA, 2004. [Google Scholar]
- Bischoff, P.H.; Gross, S.; Ospina, C.E. The story behind proposed changes to ACI 440 deflection requirements for FRP-reinforced concrete. Spec. Publ. 2009, 264, 53–76. [Google Scholar]
Figure 1.
Strain and stress conditions for balanced failure mode.

Figure 2.
Strain and stress conditions for concrete crushing failure mode.

Figure 3.
Calculation of curvature based on the fiber-reinforced polymer (FRP) tensile strain.
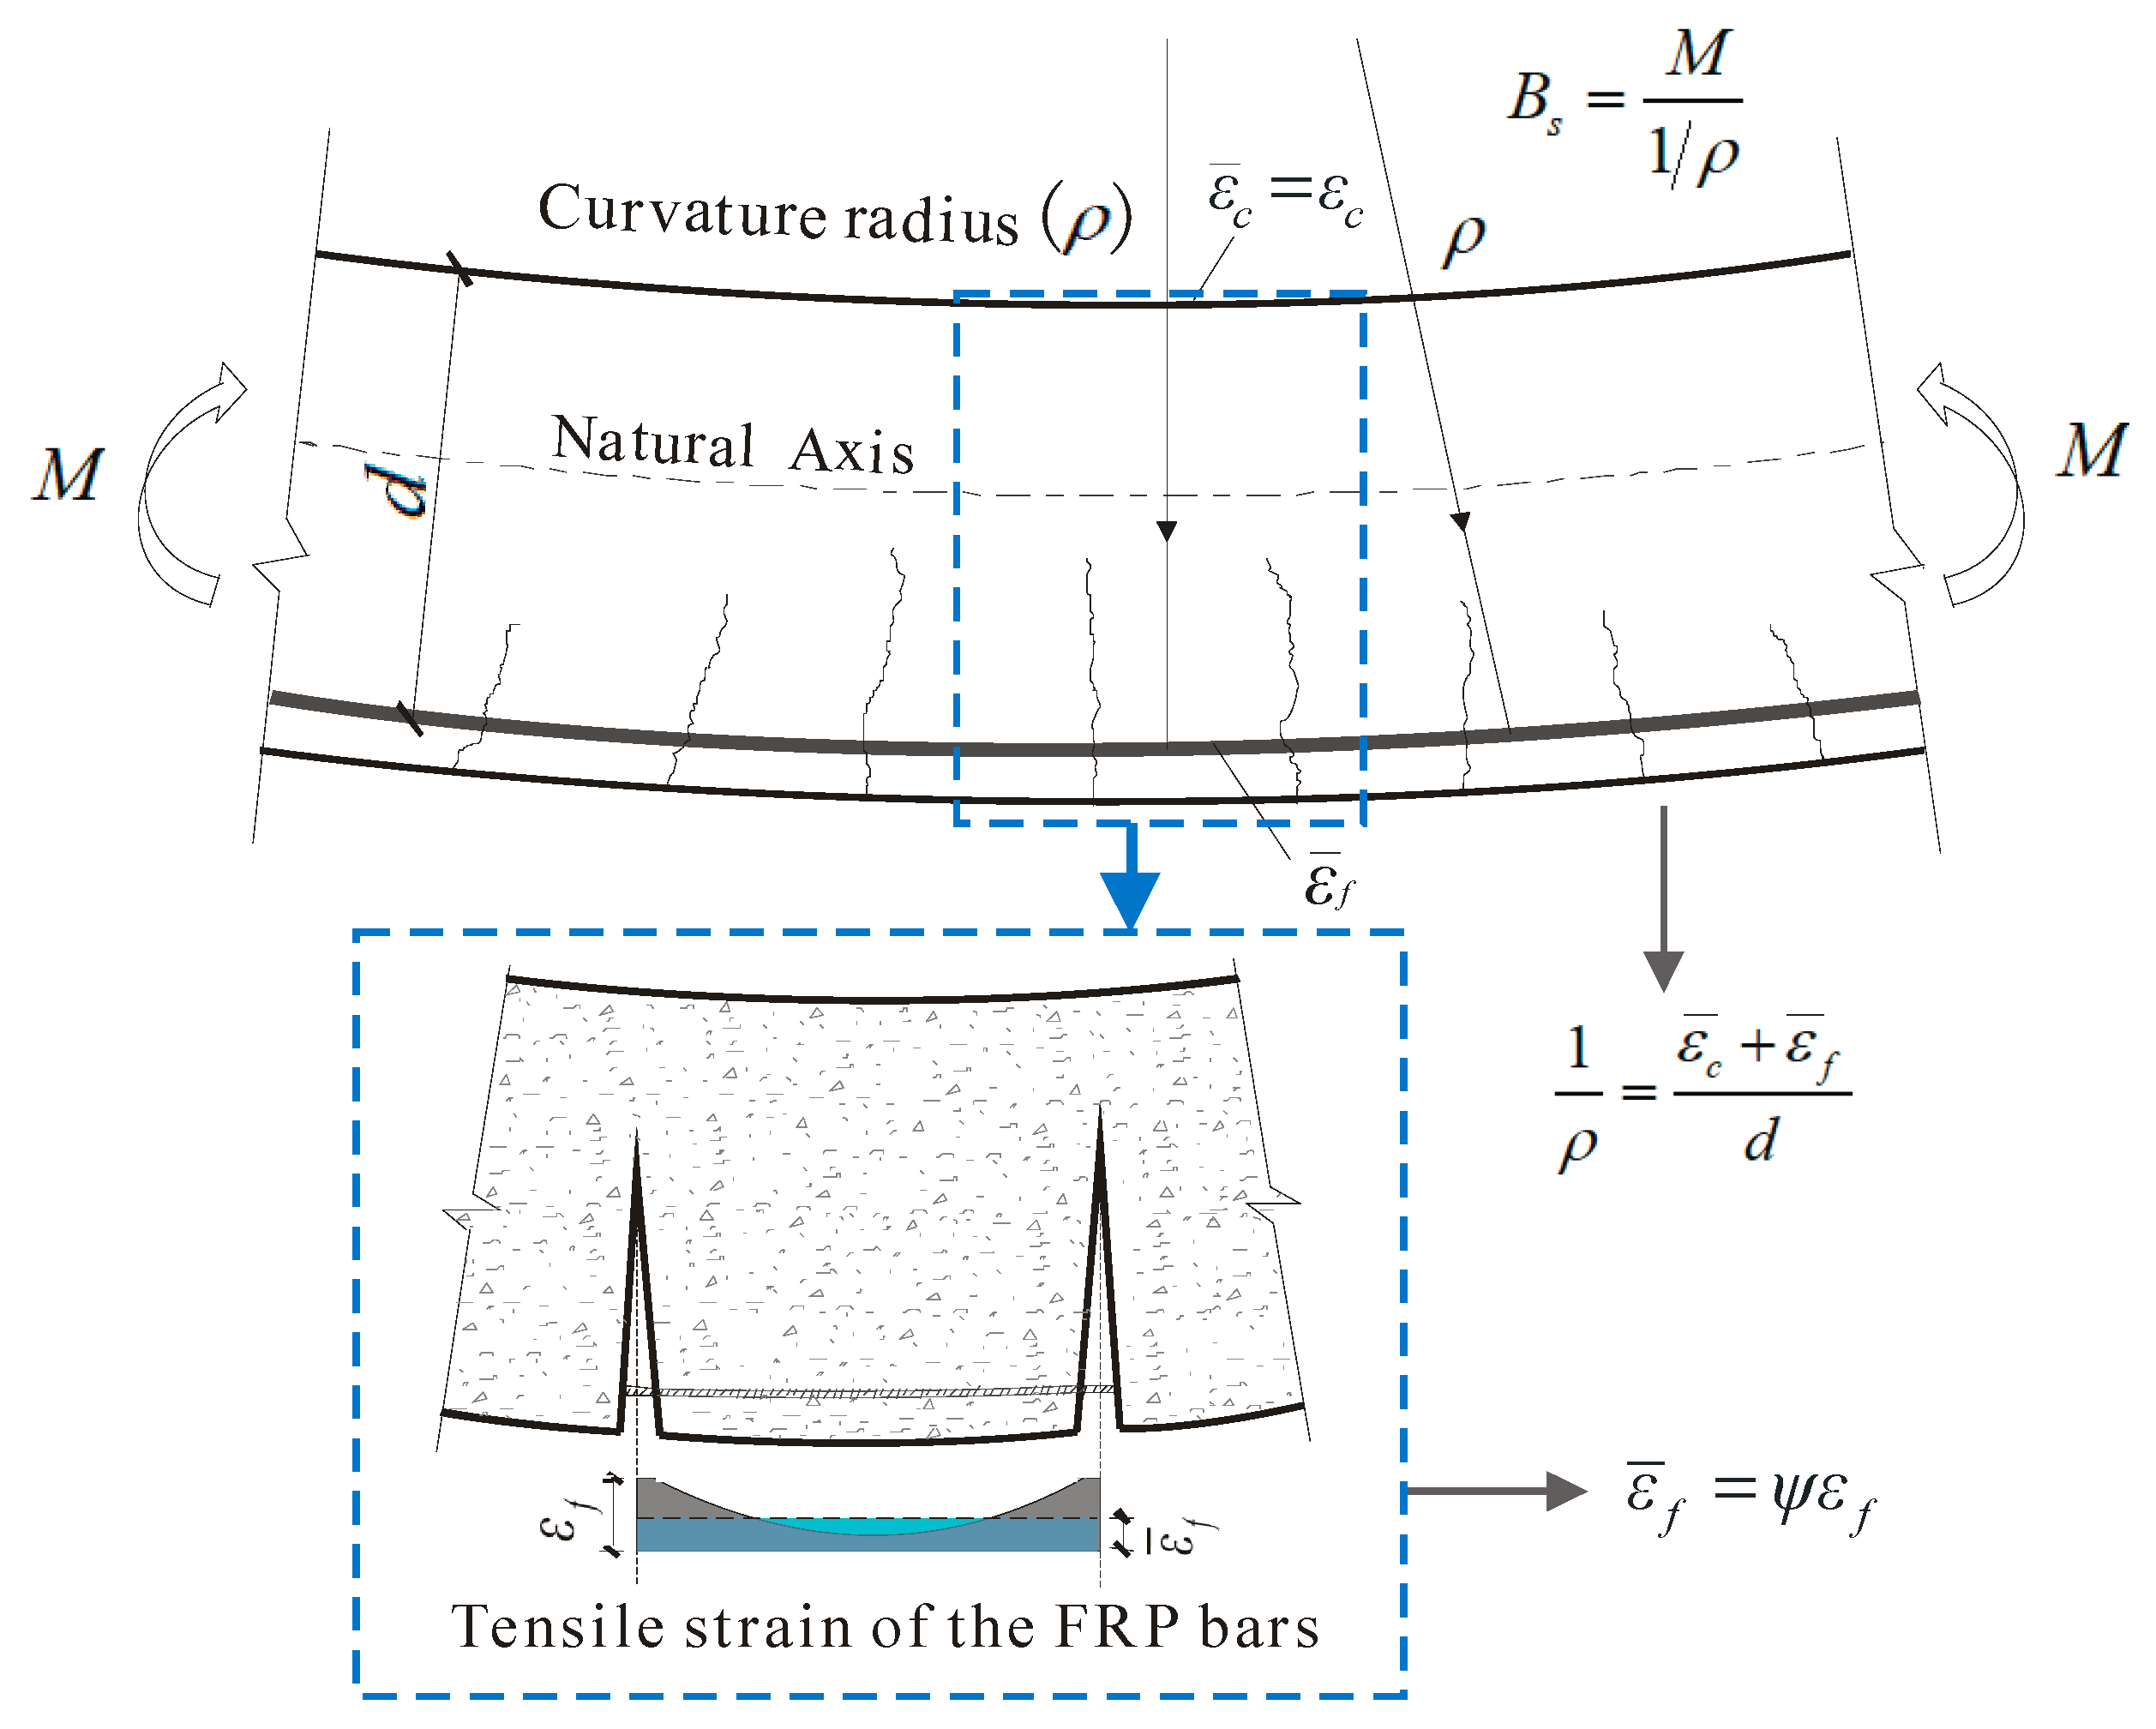
Figure 4.
Ratios of experimental-to-predicted deflections for fiber-reinforced normal weight concrete (FNWC) beams.
Figure 4.
Ratios of experimental-to-predicted deflections for fiber-reinforced normal weight concrete (FNWC) beams.
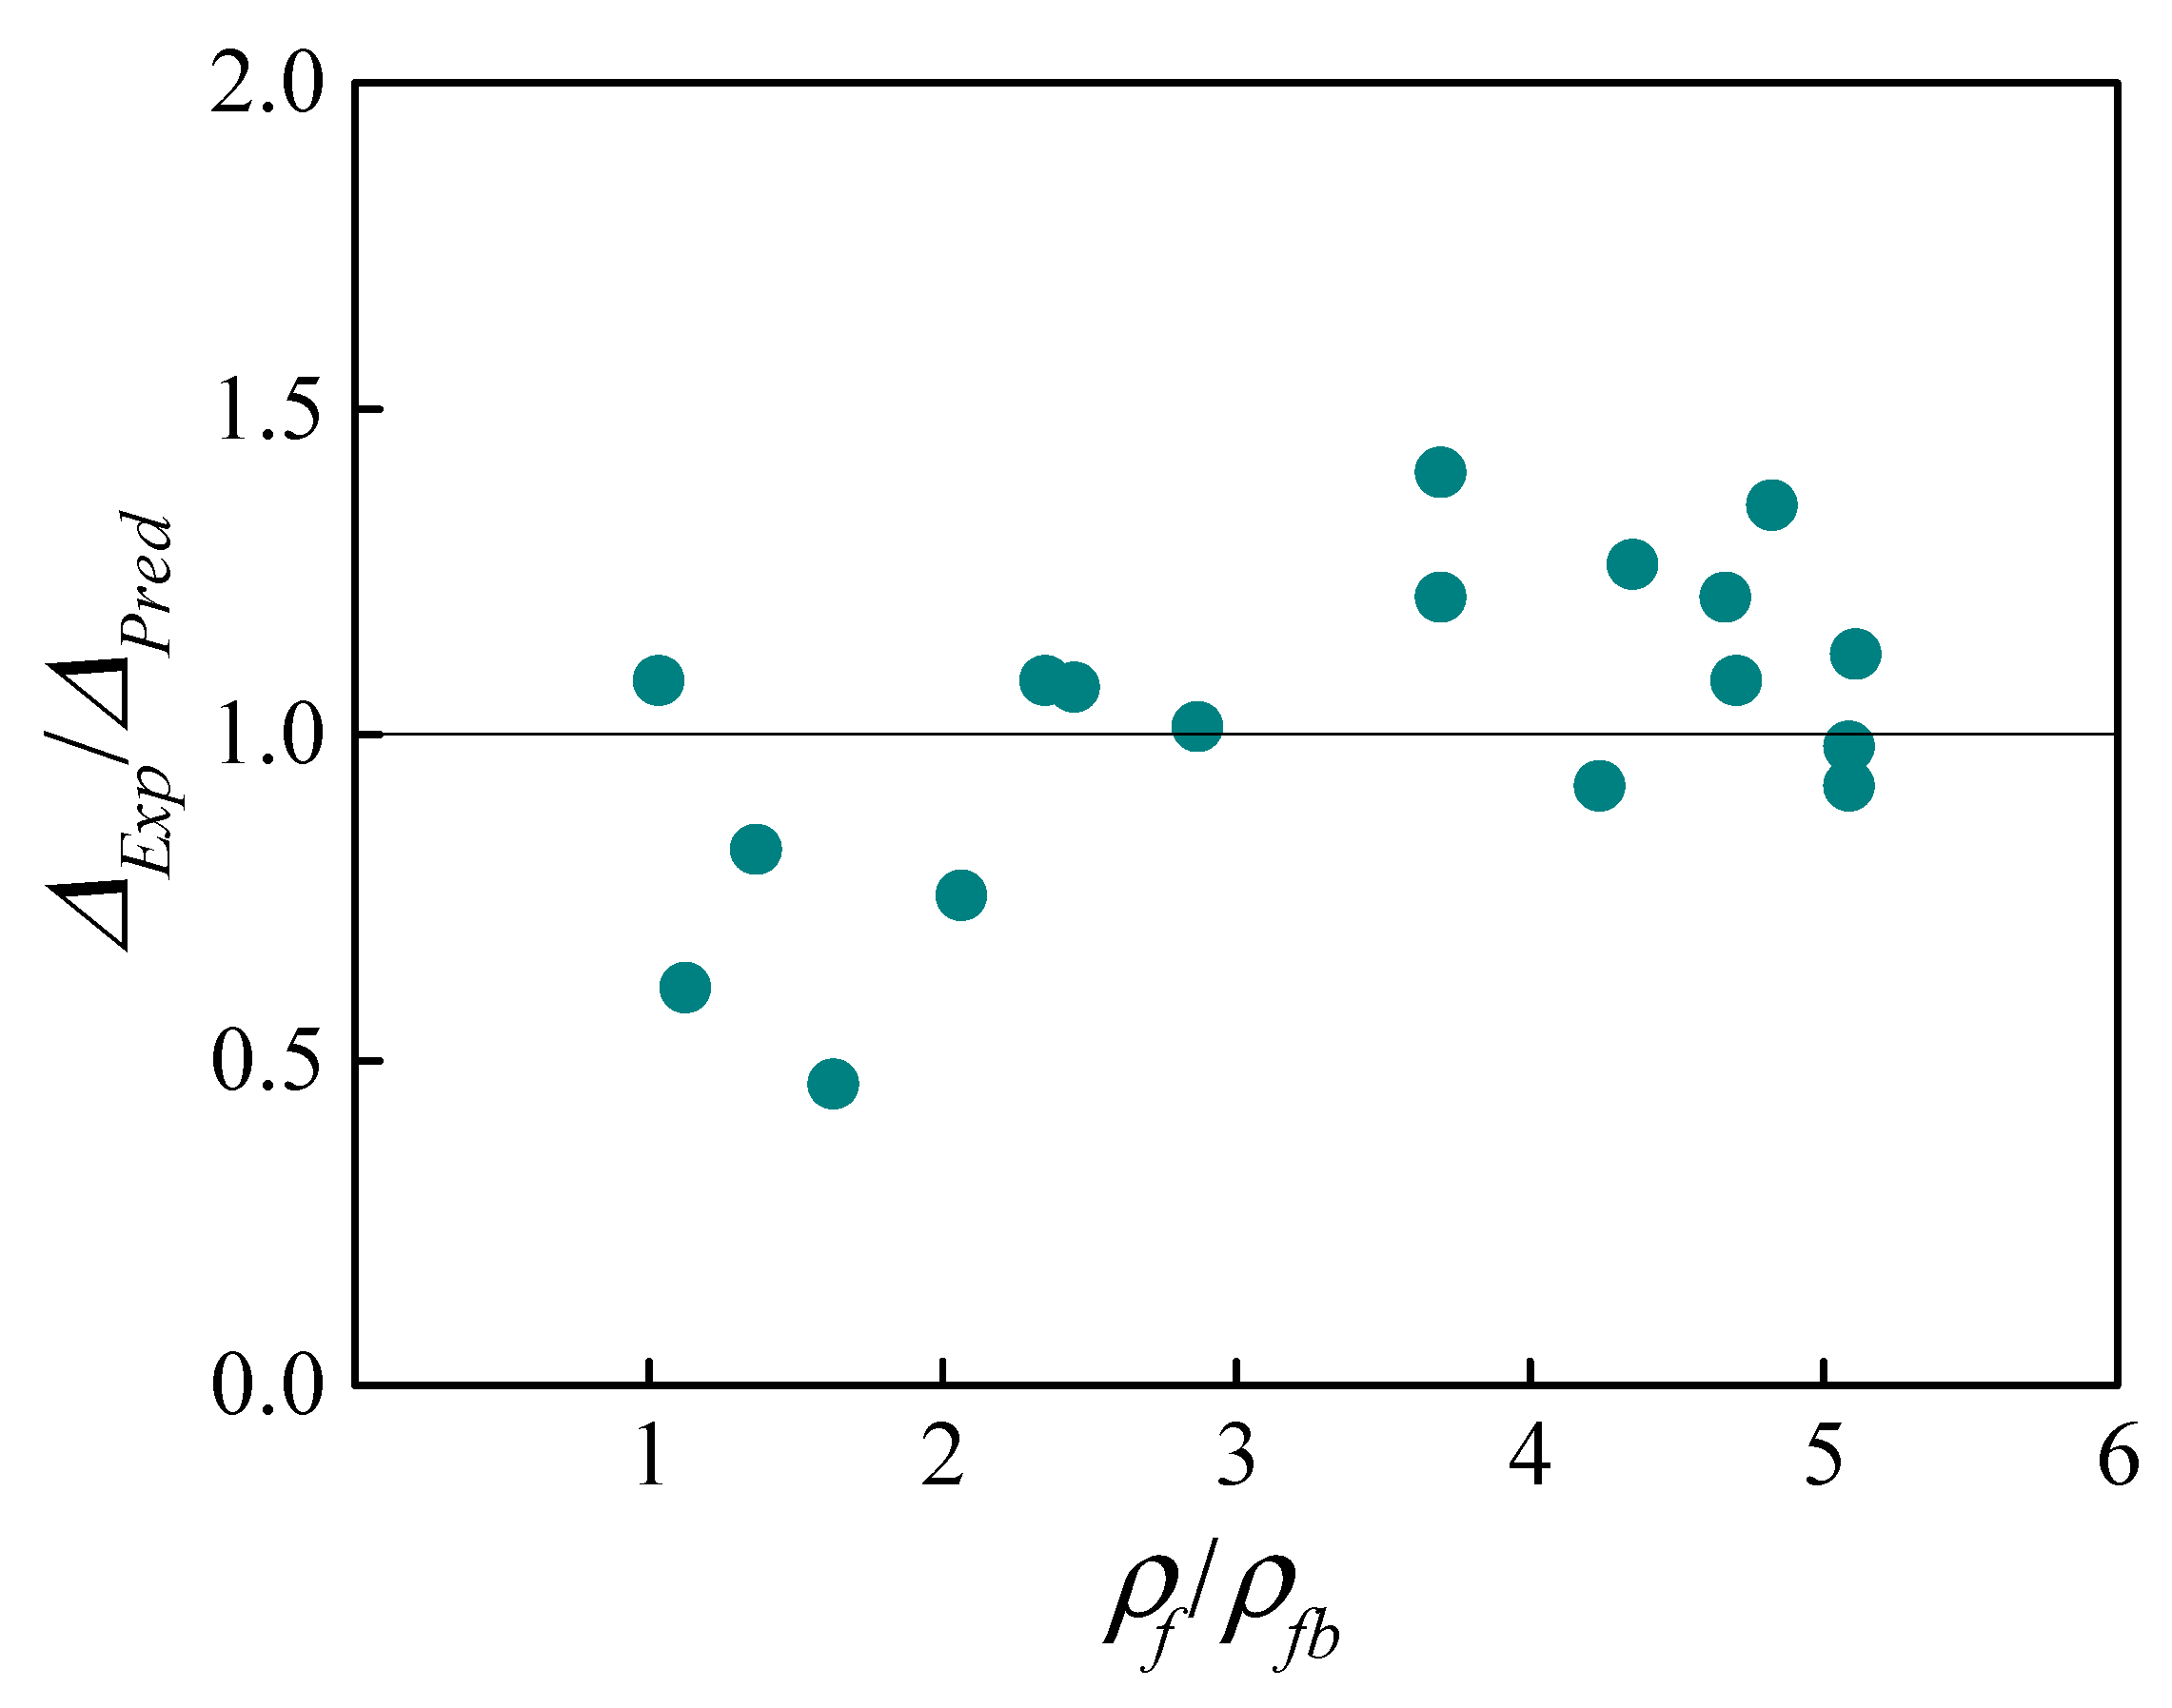
Figure 5.
Specimen details (dimensions in millimeters).
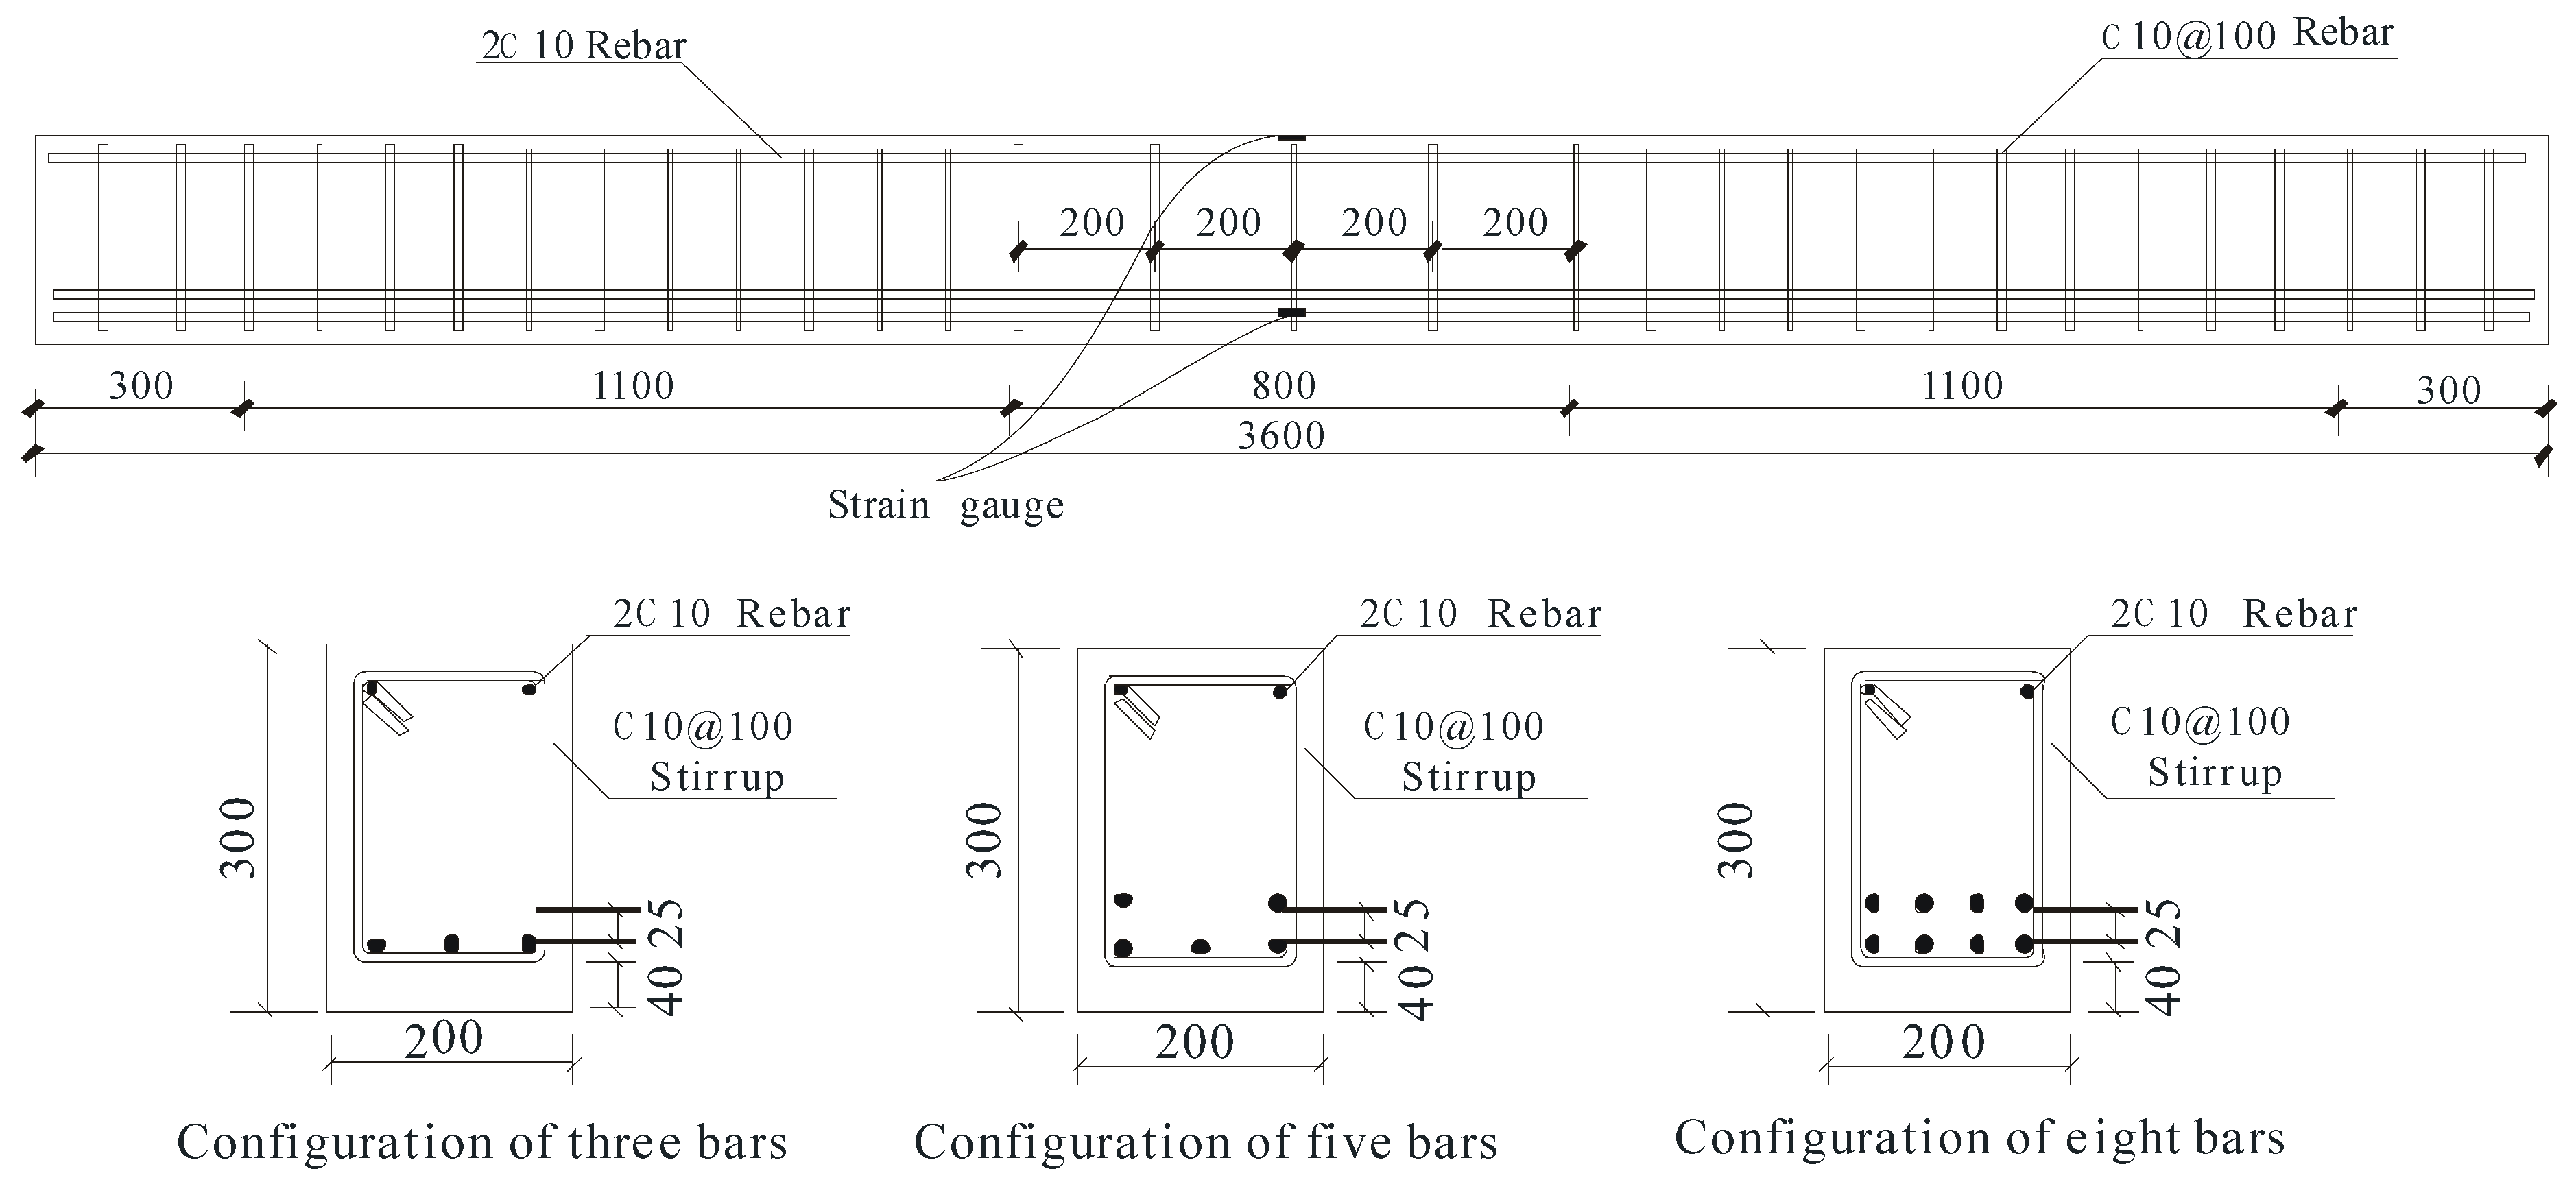
Figure 6.
Test setup.

Figure 7.
Typical failure shapes: (a) SLG–0.92; (b) LCG–0.92; (c) SLG–1.64; (d) SLG–2.66 (dimensions in millimeters).
Figure 7.
Typical failure shapes: (a) SLG–0.92; (b) LCG–0.92; (c) SLG–1.64; (d) SLG–2.66 (dimensions in millimeters).

Figure 8.
Moment–FRP and concrete strain relationships.

Figure 9.
Ratios of experimental-to-predicted ultimate capacity.
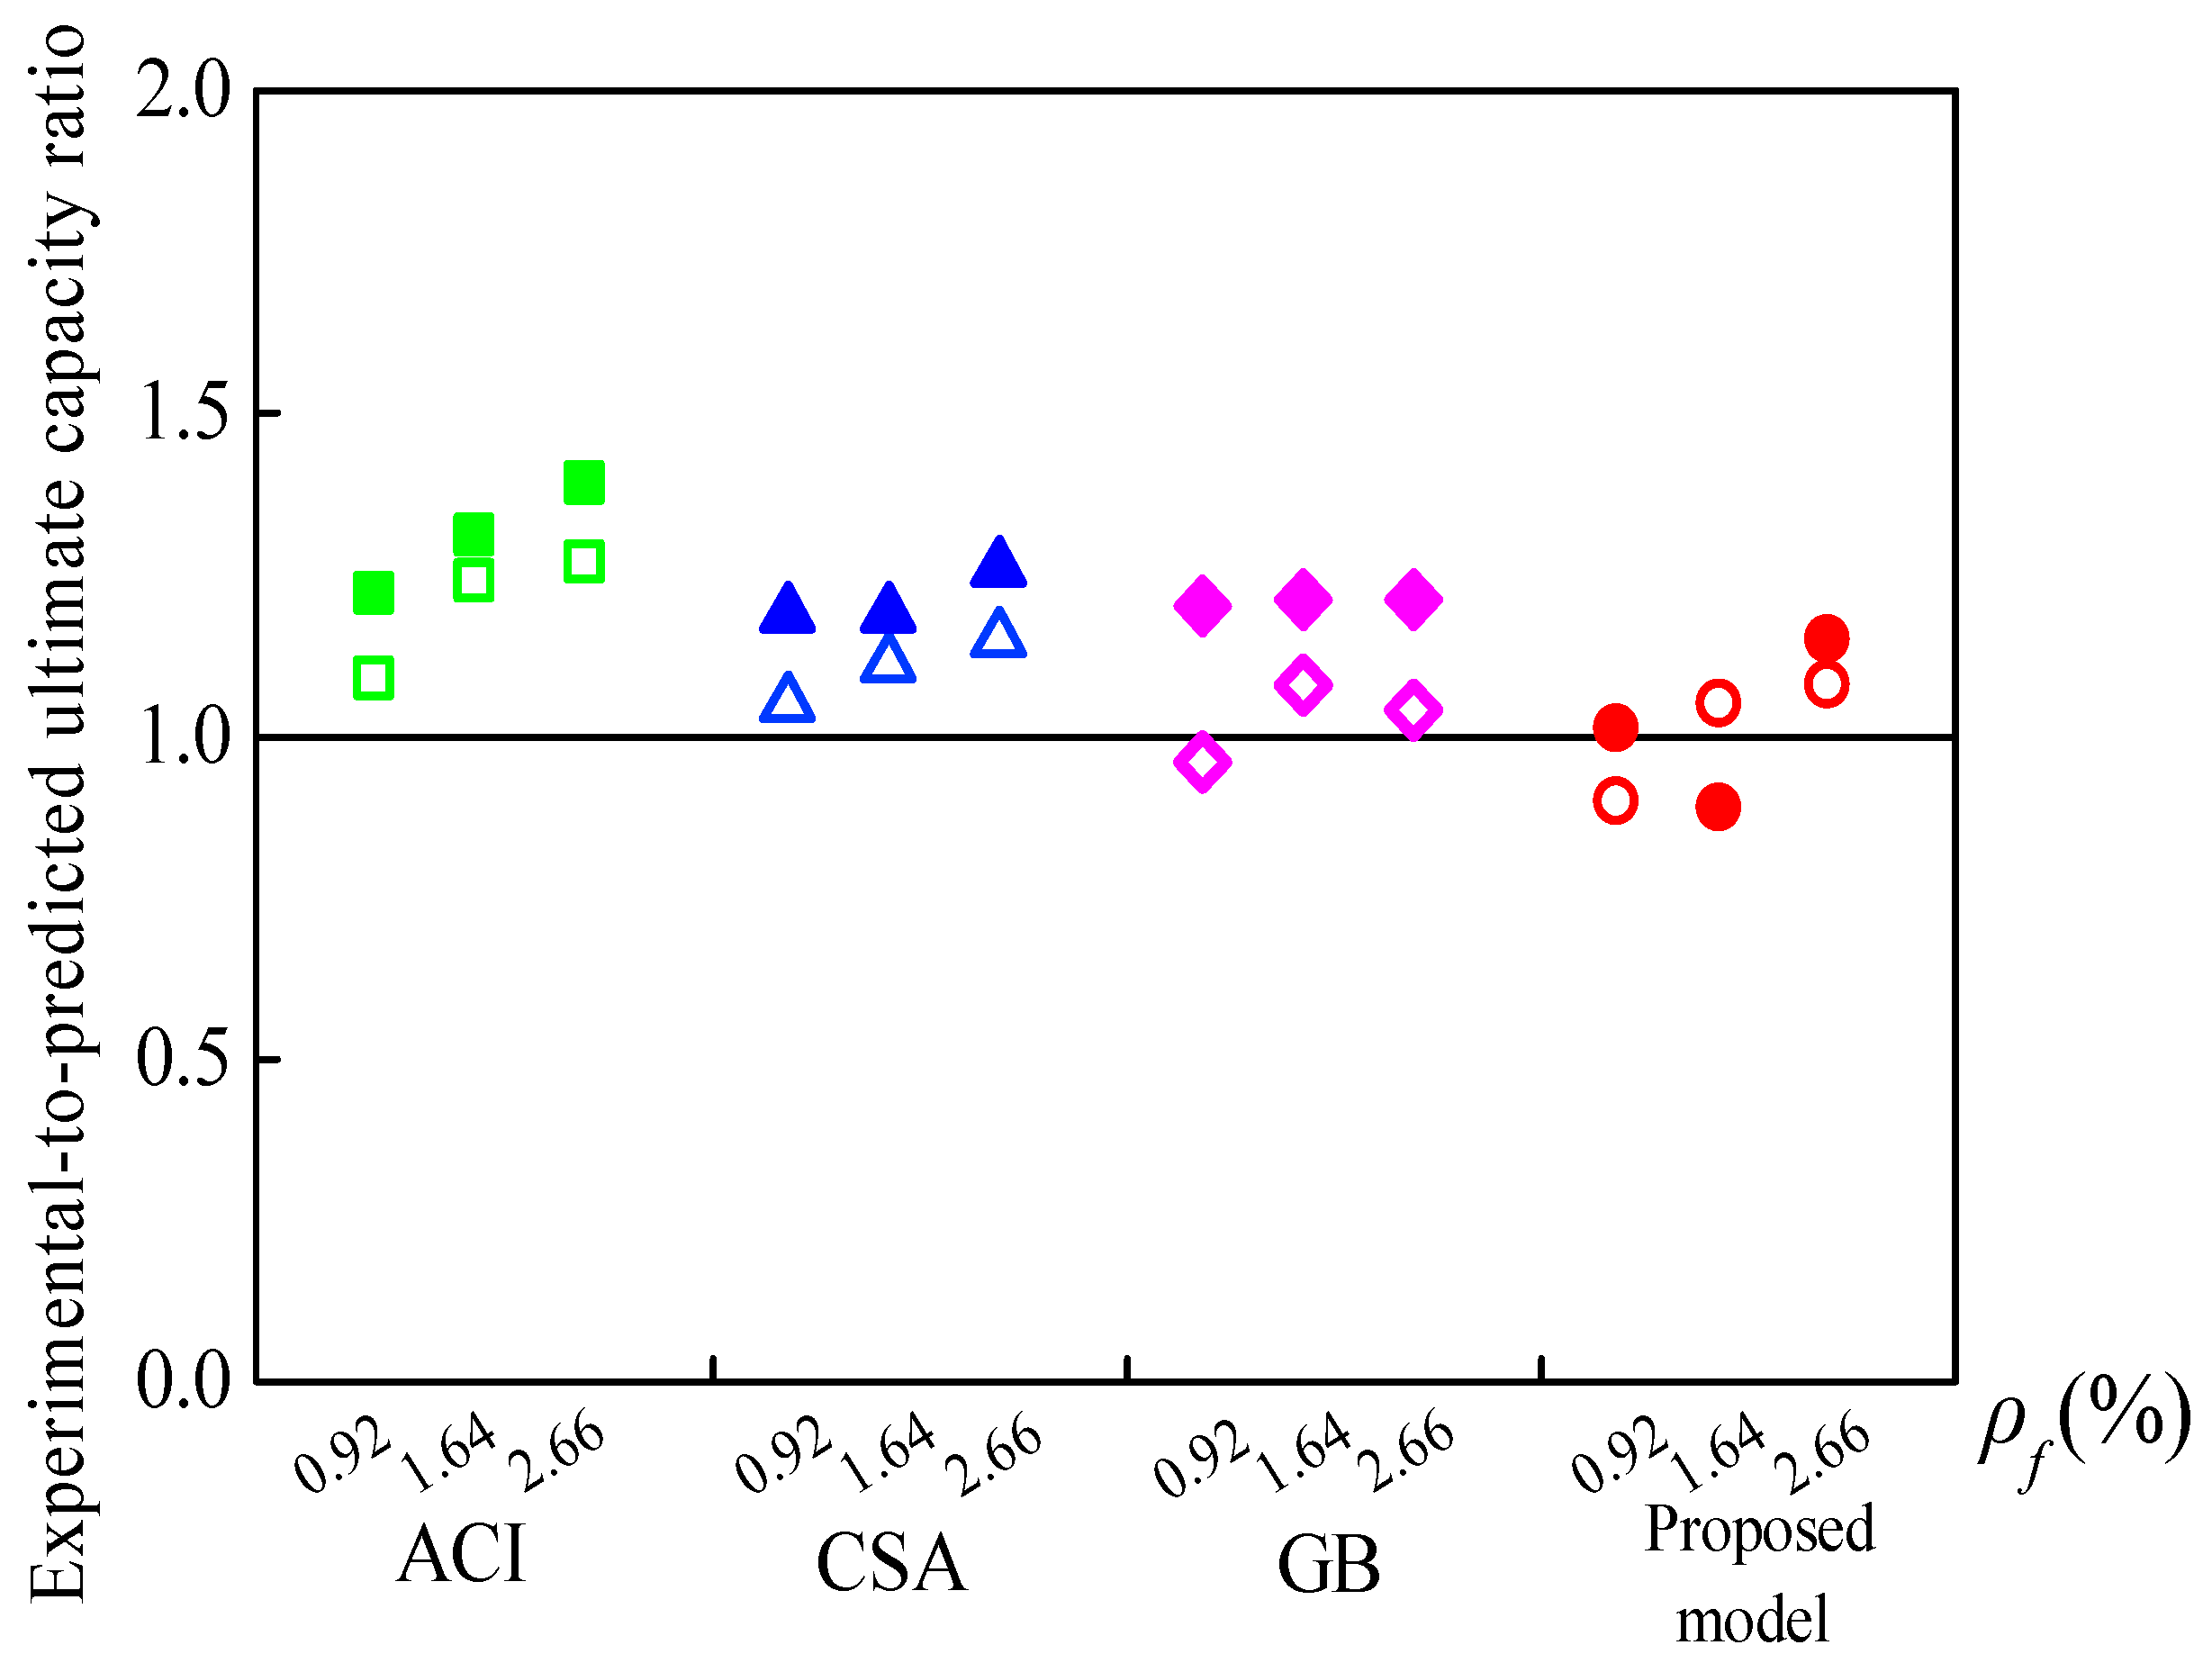
Figure 10.
Ratios of experimental-to-predicted deflections for lightweight aggregate concrete (LWC) beams.
Figure 10.
Ratios of experimental-to-predicted deflections for lightweight aggregate concrete (LWC) beams.
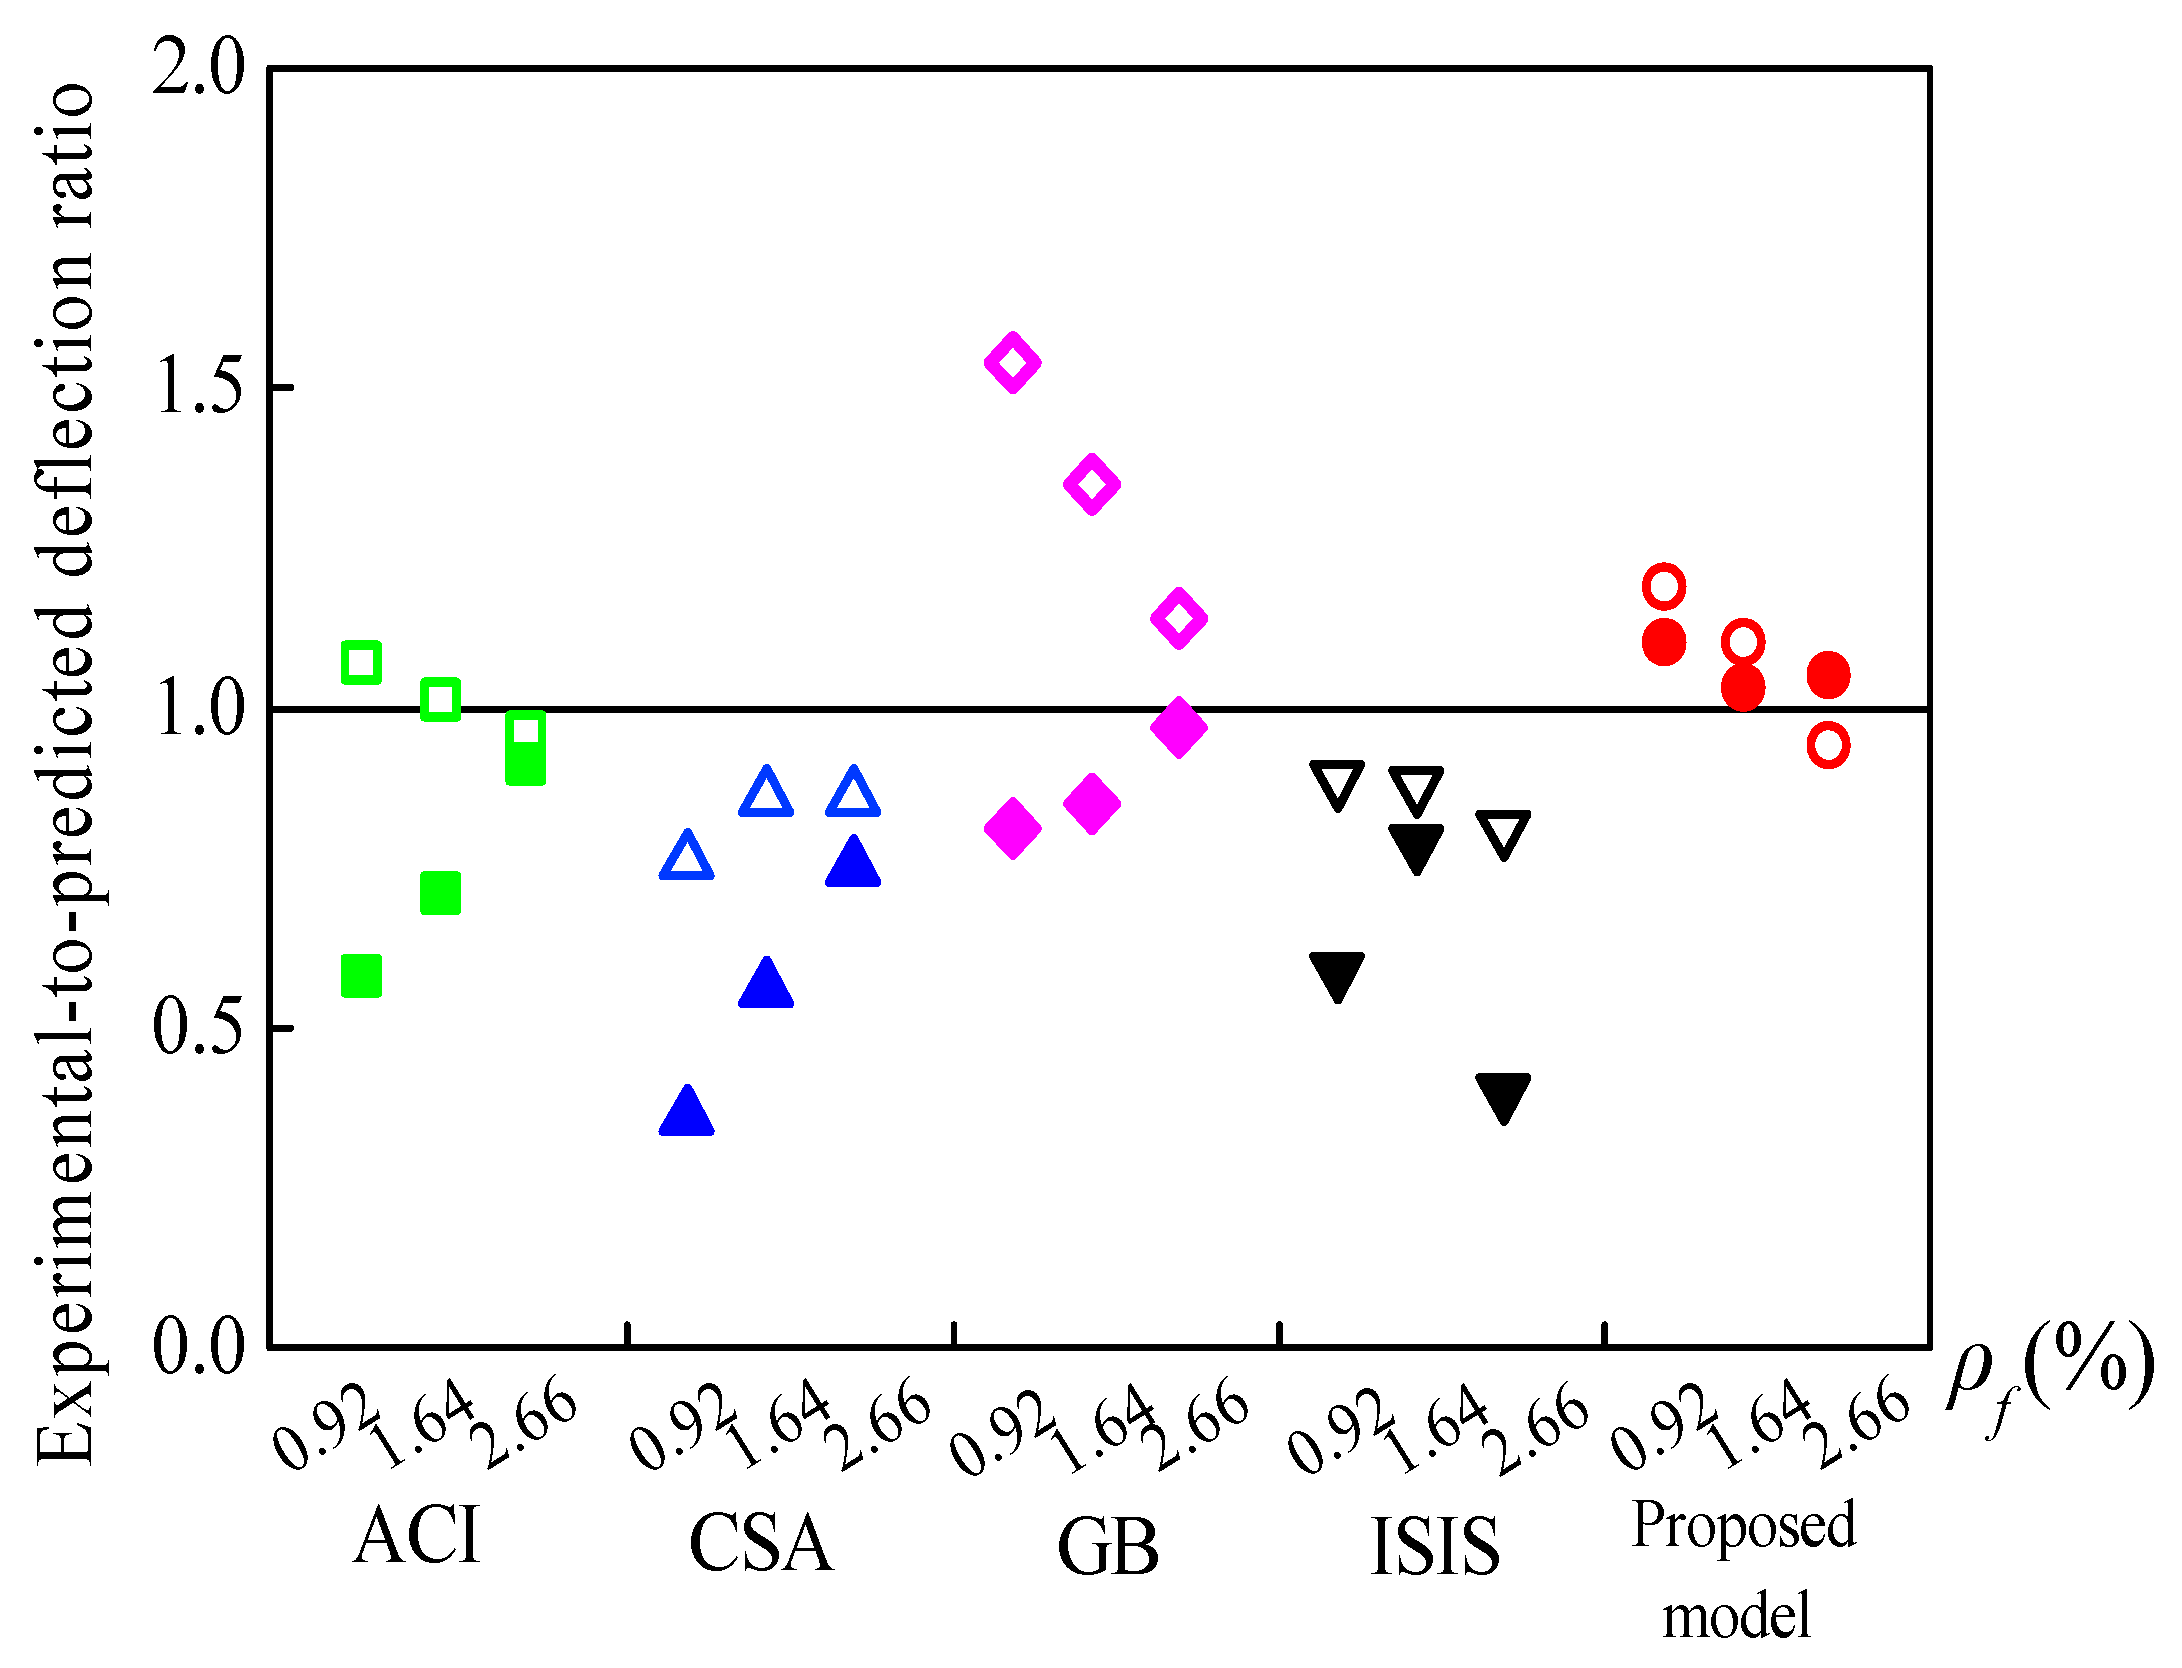
Figure 11.
Comparison between the experimental and theoretical moment–deflection responses (a) LCG–0.92; (b) LCG–1.64; (c) LCG–2.66; (d) SLG–0.92; (e) SLG–1.64; (f) SLG–2.66.
Figure 11.
Comparison between the experimental and theoretical moment–deflection responses (a) LCG–0.92; (b) LCG–1.64; (c) LCG–2.66; (d) SLG–0.92; (e) SLG–1.64; (f) SLG–2.66.


Table 1.
Comparisons between the theoretical and experimental deflections of FNWC beams at Ms.
| Reference | Spec. | Service Load | Type of Bar | Type of Fiber 1 | L (mm) | h (mm) | b (mm) | (MPa) | ffu (MPa) | Ef (GPa) | ρf (%) | ρf/ρfb | ΔExp (mm) | ΔExp/ΔPred |
|---|---|---|---|---|---|---|---|---|---|---|---|---|---|---|
| Wang and Belarbi [11] | F8G | 0.3Mu | GFRP | PP | 1829 | 229 | 178 | 30 | 690 | 41 | 2.13 | 4.71 | 6.22 | 1.08 |
| F8G | GFRP | PP | 1829 | 229 | 178 | 30 | 552 | 41 | 3.17 | 4.83 | 4.29 | 1.35 | ||
| F4C | CFRP | PP | 1829 | 229 | 178 | 30 | 2069 | 124 | 0.64 | 4.24 | 4.64 | 0.92 | ||
| Yang et al. [13] | CC-SN | 0.3Mu | CFRP | SYF | 1900 | 250 | 230 | 89.3 | 2130 | 146.2 | 0.60 | 2.45 | 5.99 | 1.07 |
| CC-ST | CFRP | SF | 1900 | 250 | 230 | 104.4 | 2130 | 146.2 | 0.60 | 2.87 | 4.28 | 1.01 | ||
| GG-SN | GFRP | SYF | 1900 | 250 | 230 | 89.3 | 941 | 48.1 | 1.88 | 4.35 | 7.36 | 1.26 | ||
| GG-ST | GFRP | SF | 1900 | 250 | 230 | 104.4 | 941 | 48.1 | 1.88 | 5.11 | 7.36 | 1.12 | ||
| Issa et al. [14] | NP | 0.4Mu | GFRP | PP | 1500 | 150 | 150 | 31.58 | 347.5 | 33 | 1.87 | 1.37 | 9.59 | 0.82 |
| HP | GFRP | PP | 1500 | 150 | 150 | 51.42 | 347.5 | 33 | 1.87 | 1.04 | 8.65 | 1.08 | ||
| NG | GFRP | GF | 1500 | 150 | 150 | 24.88 | 347.5 | 33 | 1.87 | 1.63 | 5.72 | 0.46 | ||
| HG | GFRP | GF | 1500 | 150 | 150 | 43.62 | 347.5 | 33 | 1.87 | 1.13 | 7.12 | 0.61 | ||
| NS | GFRP | SF | 1500 | 150 | 150 | 18.38 | 347.5 | 33 | 1.87 | 2.07 | 11.5 | 0.75 | ||
| Rashid et al. [24] | DF3T1F | Mu/1.7 | GFRP | PVA | 2400 | 300 | 150 | 79.61 | 1760 | 53 | 0.59 | 3.7 | 33.8 | 1.40 |
| DF3T2F | GFRP | PVA | 2400 | 300 | 150 | 79.61 | 1760 | 53 | 0.59 | 3.7 | 19.7 | 1.21 | ||
| Saikia et al. [25] | FG1SFPC | 0.4Mu | GFRP | PP&P | 1340 | 250 | 180 | 35.49 | 972 | 49 | 0.78 | 2.35 | 3.62 | 1.08 |
| FG1GFPC | GFRP | PP&P | 1340 | 250 | 180 | 31.03 | 972 | 49 | 0.78 | 4.67 | 3.15 | 1.21 | ||
| FG2SFC | 0.3Mu | GFRP | PP | 1340 | 250 | 180 | 30.23 | 972 | 49 | 1.51 | 5.09 | 1.93 | 0.98 | |
| FG2GFC | GFRP | PP | 1340 | 250 | 180 | 30.23 | 972 | 49 | 1.51 | 5.09 | 1.73 | 0.92 | ||
| Average | 1.02 | |||||||||||||
| Standard deviation | 0.246 | |||||||||||||
| Coefficient variation (COV) (%) | 24 | |||||||||||||
1 PP is the polypropylene fiber; GF is the glass fiber; SF is the steel fiber; SYF is the synthetic fiber; PVA is the polyvinyl alcohol fiber; PP&P is the polypropylene fiber and polymer; PVA is the polyvinyl alcohol fiber. is the cylinder compressive strength of concrete; h is the beam height; L is the beam clear span; ΔExp is the experimental deflection; ΔPred is the predicted deflection.
Table 2.
Properties of steel fiber.
| Type | lfi (mm) | dfi (μm) | Density (kg·m−3) | Tensile Strength (MPa) | Shape | Surface |
|---|---|---|---|---|---|---|
| Steel fiber | 13 | 200 | 7800 | >3000 | Straight | Smooth |
Table 3.
Summary of specimen details and test results.
| Spec. | ffu (MPa) | Ef (GPa) | fcu (MPa) | Ec (GPa) | ρf (%) | EfAf (kN) | Mu (kN·m) | Failure Mode 1 | Δ (mm) | |
|---|---|---|---|---|---|---|---|---|---|---|
| 0.3Mu | Mu | |||||||||
| LCG–0.92 | 602 | 44 | 54.92 | 31.2 | 0.92 | 19816 | 63.51 | B.F | 13.3 | 73.8 |
| SLG–0.92 | 602 | 44 | 81.62 | 32.9 | 0.92 | 19816 | 73.54 | B.F | 7.1 | 64.9 |
| LCG–1.64 | 602 | 44 | 64.68 | 31.2 | 1.64 | 33026 | 82.92 | C.C | 15.0 | 71.8 |
| SLG–1.64 | 602 | 44 | 82.32 | 32.9 | 1.64 | 33026 | 98.75 | B.F | 11.3 | 76.2 |
| LCG–2.66 | 602 | 44 | 62.52 | 31.2 | 2.66 | 52842 | 97.96 | C.C | 12.5 | 52.8 |
| SLG–2.66 | 602 | 44 | 79.41 | 32.9 | 2.66 | 52842 | 119.85 | C.C | 13.1 | 76.8 |
1 B.F. and C.C. denote balanced and concrete crushing failure modes, respectively.
Table 4.
Relative reinforcement ratios and experimental-to-predicted ultimate capacity ratios.
| Spec. | ρf/ρfb | Mu,Exp/Mu,Pred | ||||||
|---|---|---|---|---|---|---|---|---|
| ACI 440.1R | CSA S806 | GB 50608 | Proposed Model | ACI 440.1R | CSA S806 | GB 50608 | Proposed Model | |
| LCG–0.92 | 1.09 | 0.89 | 0.98 | 0.76 | 1.09 | 1.05 | 0.98 | 0.90 |
| SLG–0.92 | 0.83 | 0.66 | 0.71 | 0.59 | 1.22 | 1.19 | 1.18 | 1.01 |
| LCG–1.64 | 1.78 | 1.39 | 1.52 | 1.20 | 1.24 | 1.11 | 1.11 | 1.05 |
| SLG–1.64 | 1.46 | 1.17 | 1.26 | 1.04 | 1.31 | 1.19 | 1.20 | 0.89 |
| LCG–2.66 | 2.94 | 2.33 | 2.55 | 1.99 | 1.27 | 1.15 | 1.09 | 1.08 |
| SLG–2.66 | 2.46 | 1.96 | 2.11 | 1.72 | 1.39 | 1.26 | 1.20 | 1.15 |
| Average | 1.25 | 1.16 | 1.13 | 1.02 | ||||
| Standard deviation | 0.10 | 0.07 | 0.09 | 0.10 | ||||
| Coefficient of variation (COV) (%) | 8 | 6 | 8 | 10 | ||||
Table 5.
Experimental-and-predicted deflections ratios for LWC beams.
| Spec. | ΔExp/ΔPred | ||||
|---|---|---|---|---|---|
| ACI 440.1R | CSA S806 | GB 50608 | ISIS-M03 | Proposed Model | |
| LCG–0.92 | 1.07 | 0.76 | 1.54 | 0.89 | 1.19 |
| SLG–0.92 | 0.58 | 0.36 | 0.81 | 0.59 | 1.10 |
| LCG–1.64 | 1.01 | 0.86 | 1.35 | 0.88 | 1.10 |
| SLG–1.64 | 0.71 | 0.56 | 0.85 | 0.79 | 1.03 |
| LCG–2.66 | 0.96 | 0.86 | 1.14 | 0.81 | 0.94 |
| SLG–2.66 | 0.91 | 0.75 | 0.97 | 0.40 | 1.05 |
| Average | 0.87 | 0.69 | 1.11 | 0.79 | 1.07 |
| Standard deviation | 0.19 | 0.20 | 0.29 | 0.19 | 0.08 |
| COV (%) | 22 | 28 | 26 | 24 | 7 |
© 2019 by the authors. Licensee MDPI, Basel, Switzerland. This article is an open access article distributed under the terms and conditions of the Creative Commons Attribution (CC BY) license (http://creativecommons.org/licenses/by/4.0/).
Share and Cite
MDPI and ACS Style
Liu, X.; Sun, Y.; Wu, T. Flexural Capacity and Deflection of Fiber-Reinforced Lightweight Aggregate Concrete Beams Reinforced with GFRP Bars. Sensors 2019, 19, 873. https://doi.org/10.3390/s19040873
AMA Style
Liu X, Sun Y, Wu T. Flexural Capacity and Deflection of Fiber-Reinforced Lightweight Aggregate Concrete Beams Reinforced with GFRP Bars. Sensors. 2019; 19(4):873. https://doi.org/10.3390/s19040873
Chicago/Turabian StyleLiu, Xi, Yijia Sun, and Tao Wu. 2019. "Flexural Capacity and Deflection of Fiber-Reinforced Lightweight Aggregate Concrete Beams Reinforced with GFRP Bars" Sensors 19, no. 4: 873. https://doi.org/10.3390/s19040873
Note that from the first issue of 2016, this journal uses article numbers instead of page numbers. See further details here.