Identification of the Rumination in Cattle Using Support Vector Machines with Motion-Sensitive Bolus Sensors

 ,
,  ,
,  ,
,  , ,
, ,
Abstract
:
1. Introduction
2. Materials and Methods
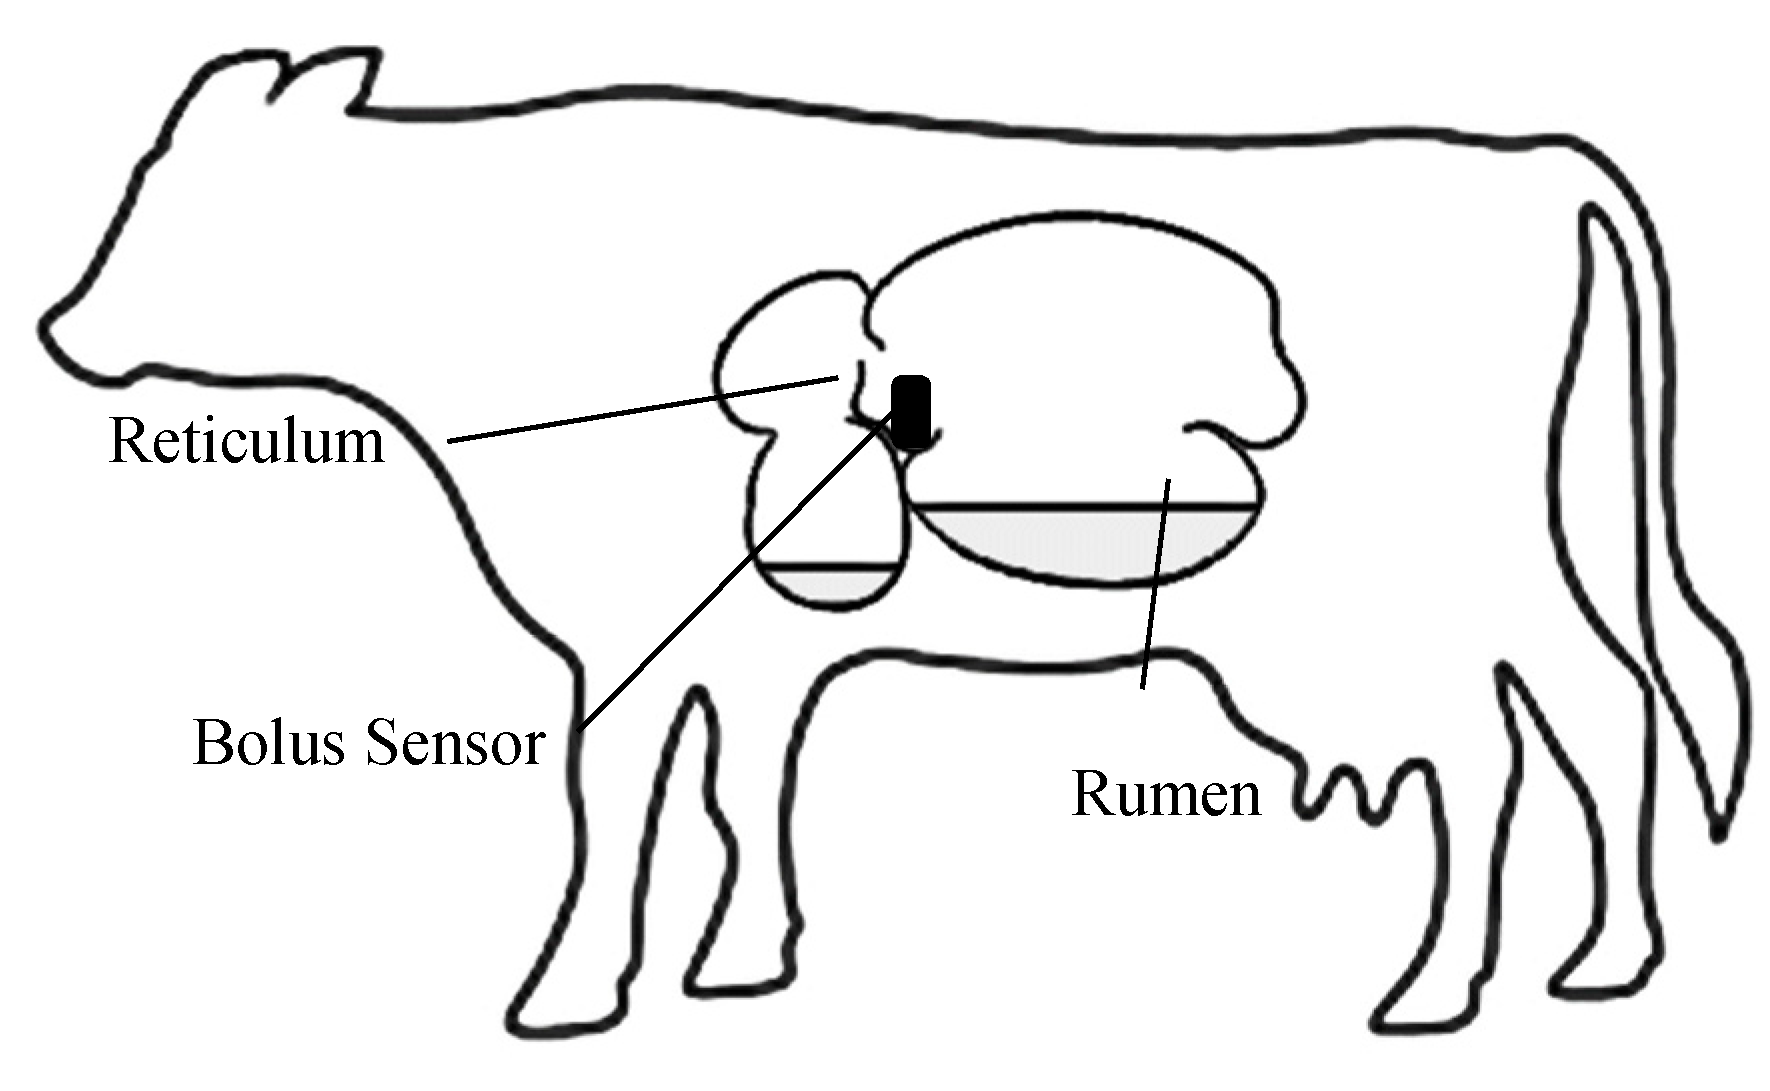
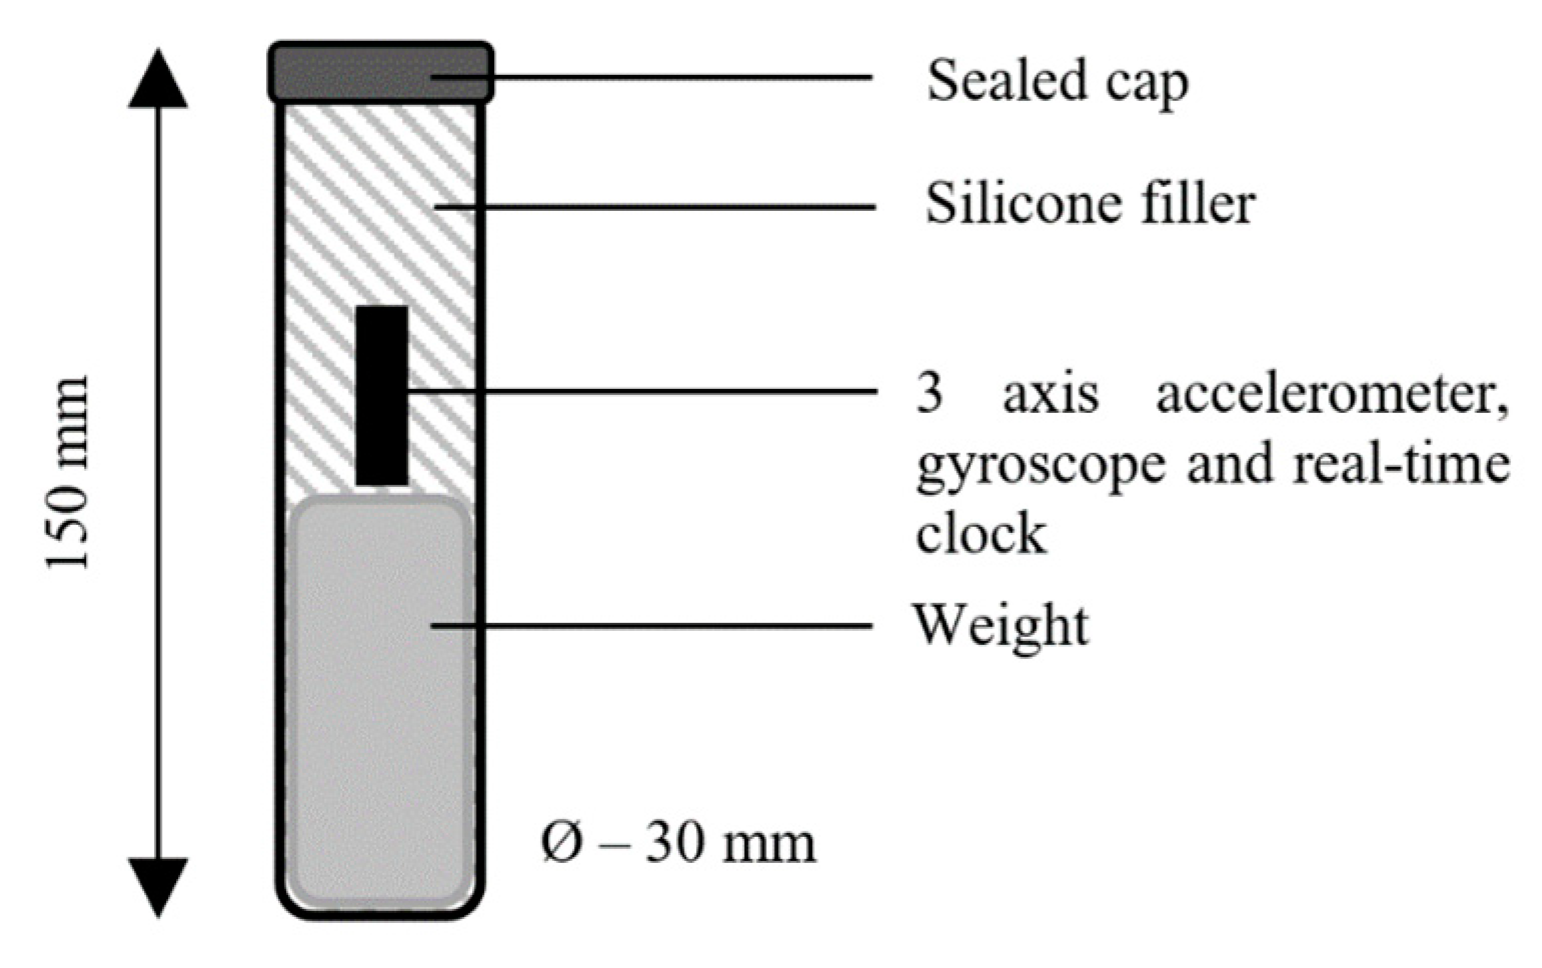
2.1. Reticuloruminal Motion Monitoring
2.2. Data Collection
3. Data Processing and Classification
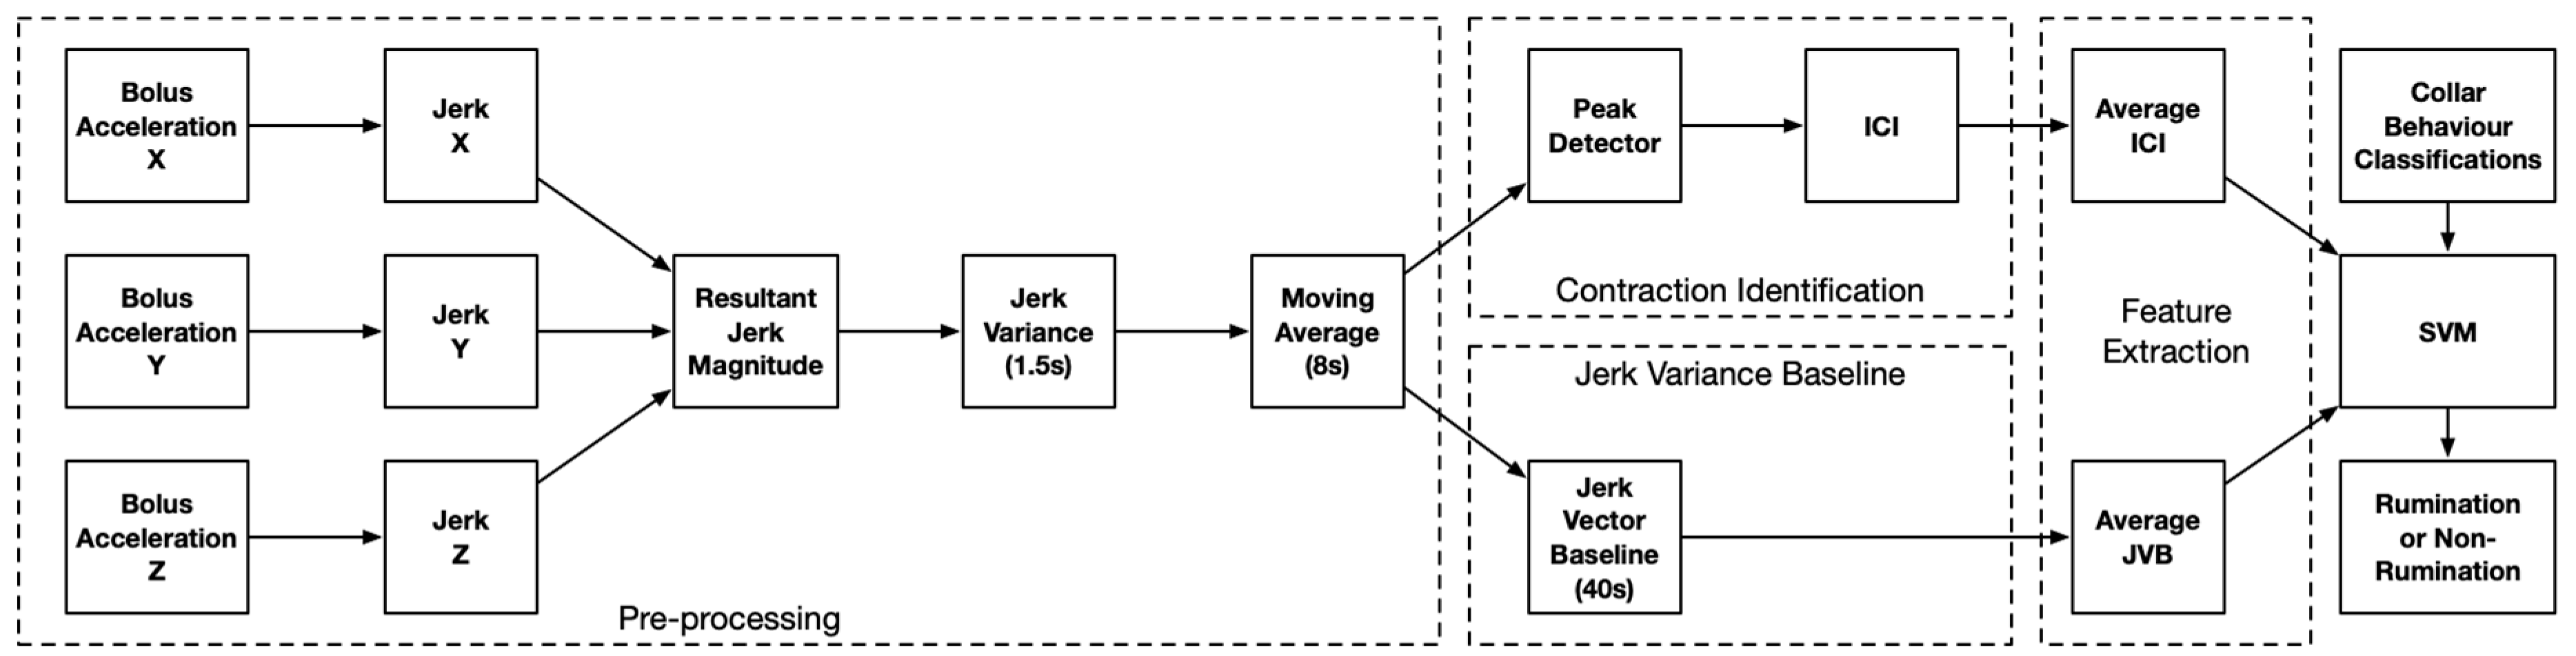
3.1. Data Pre-Processing
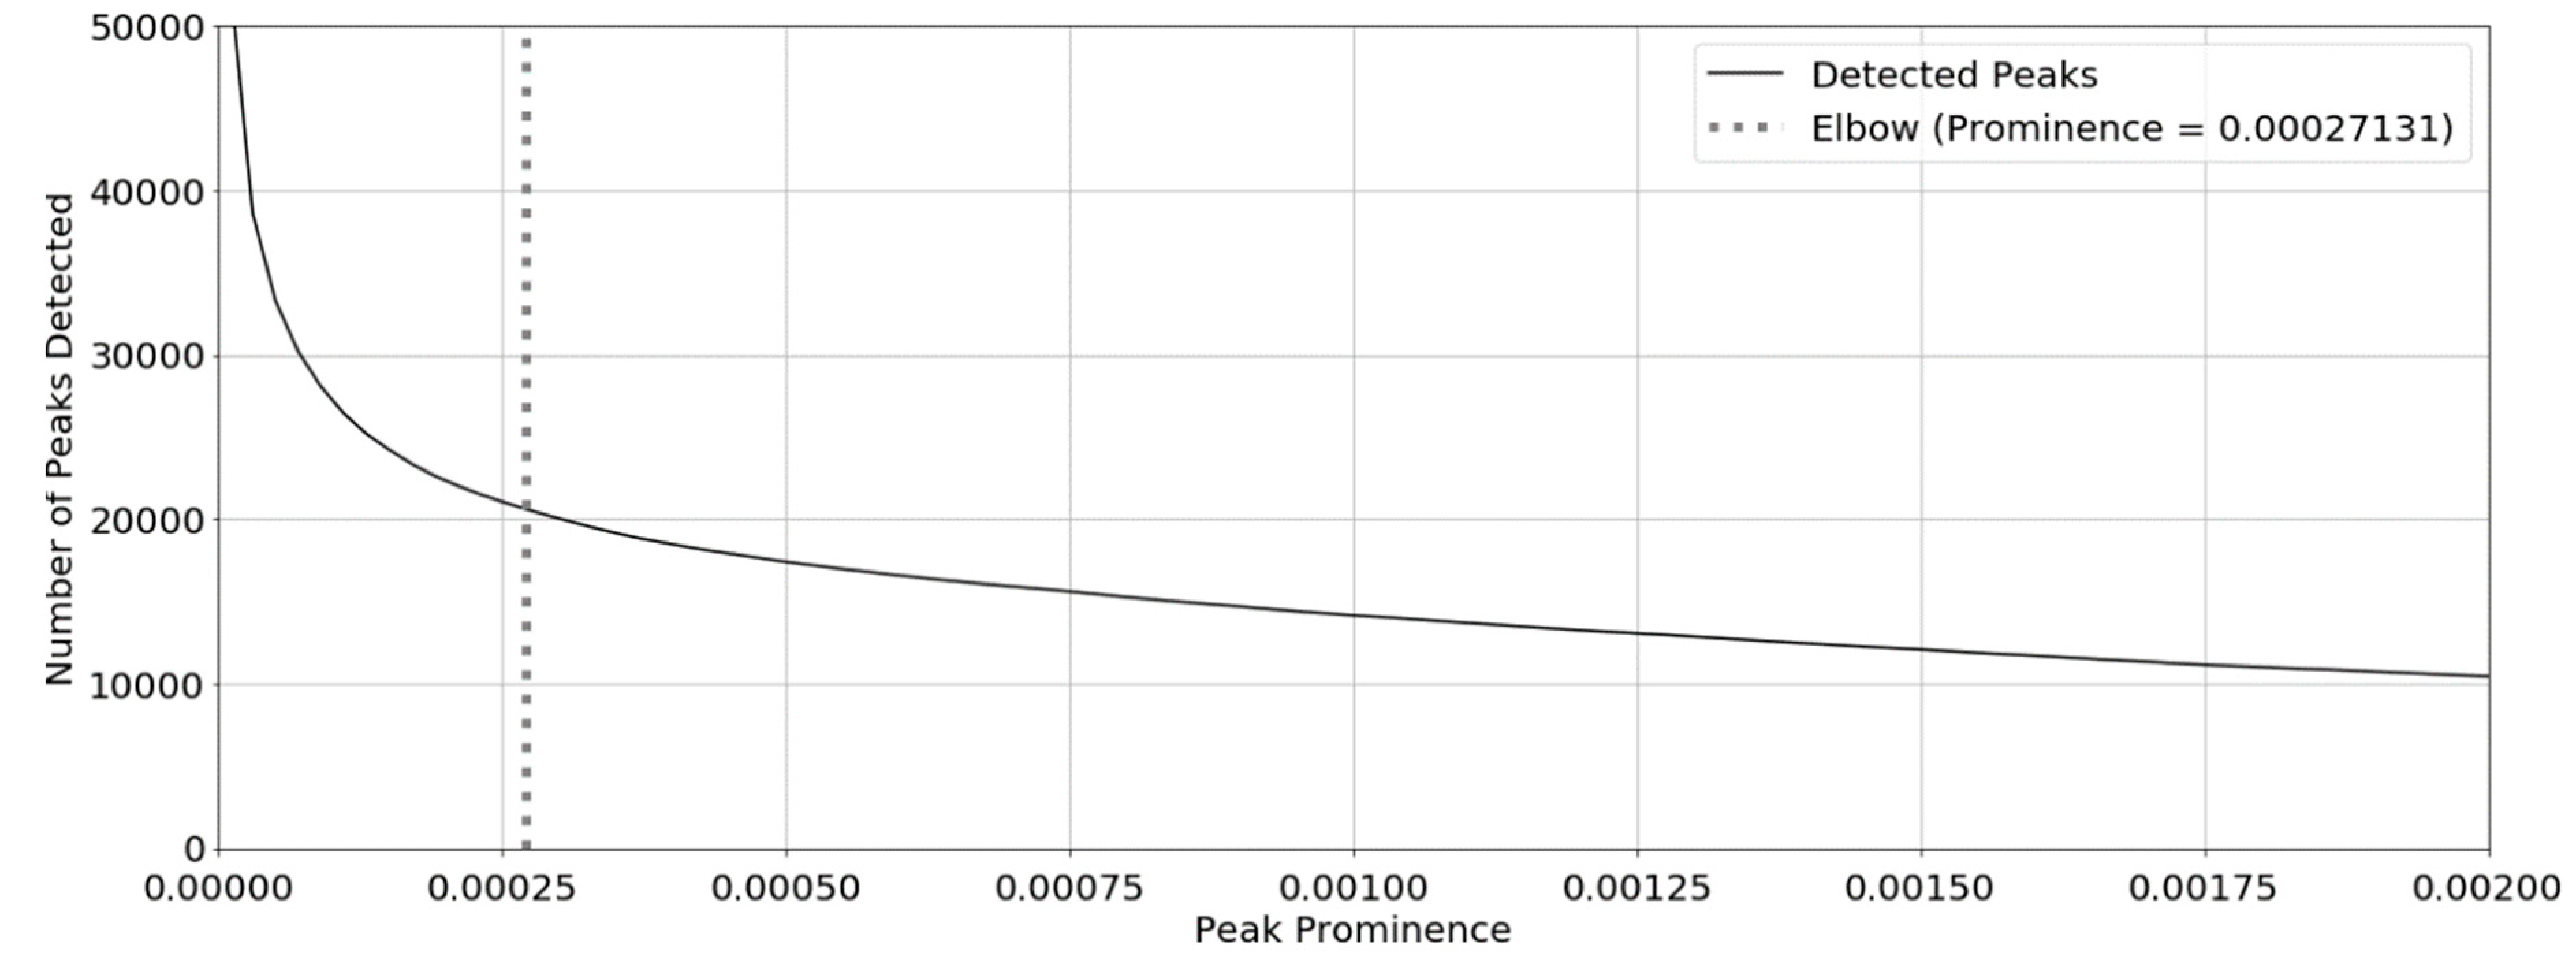
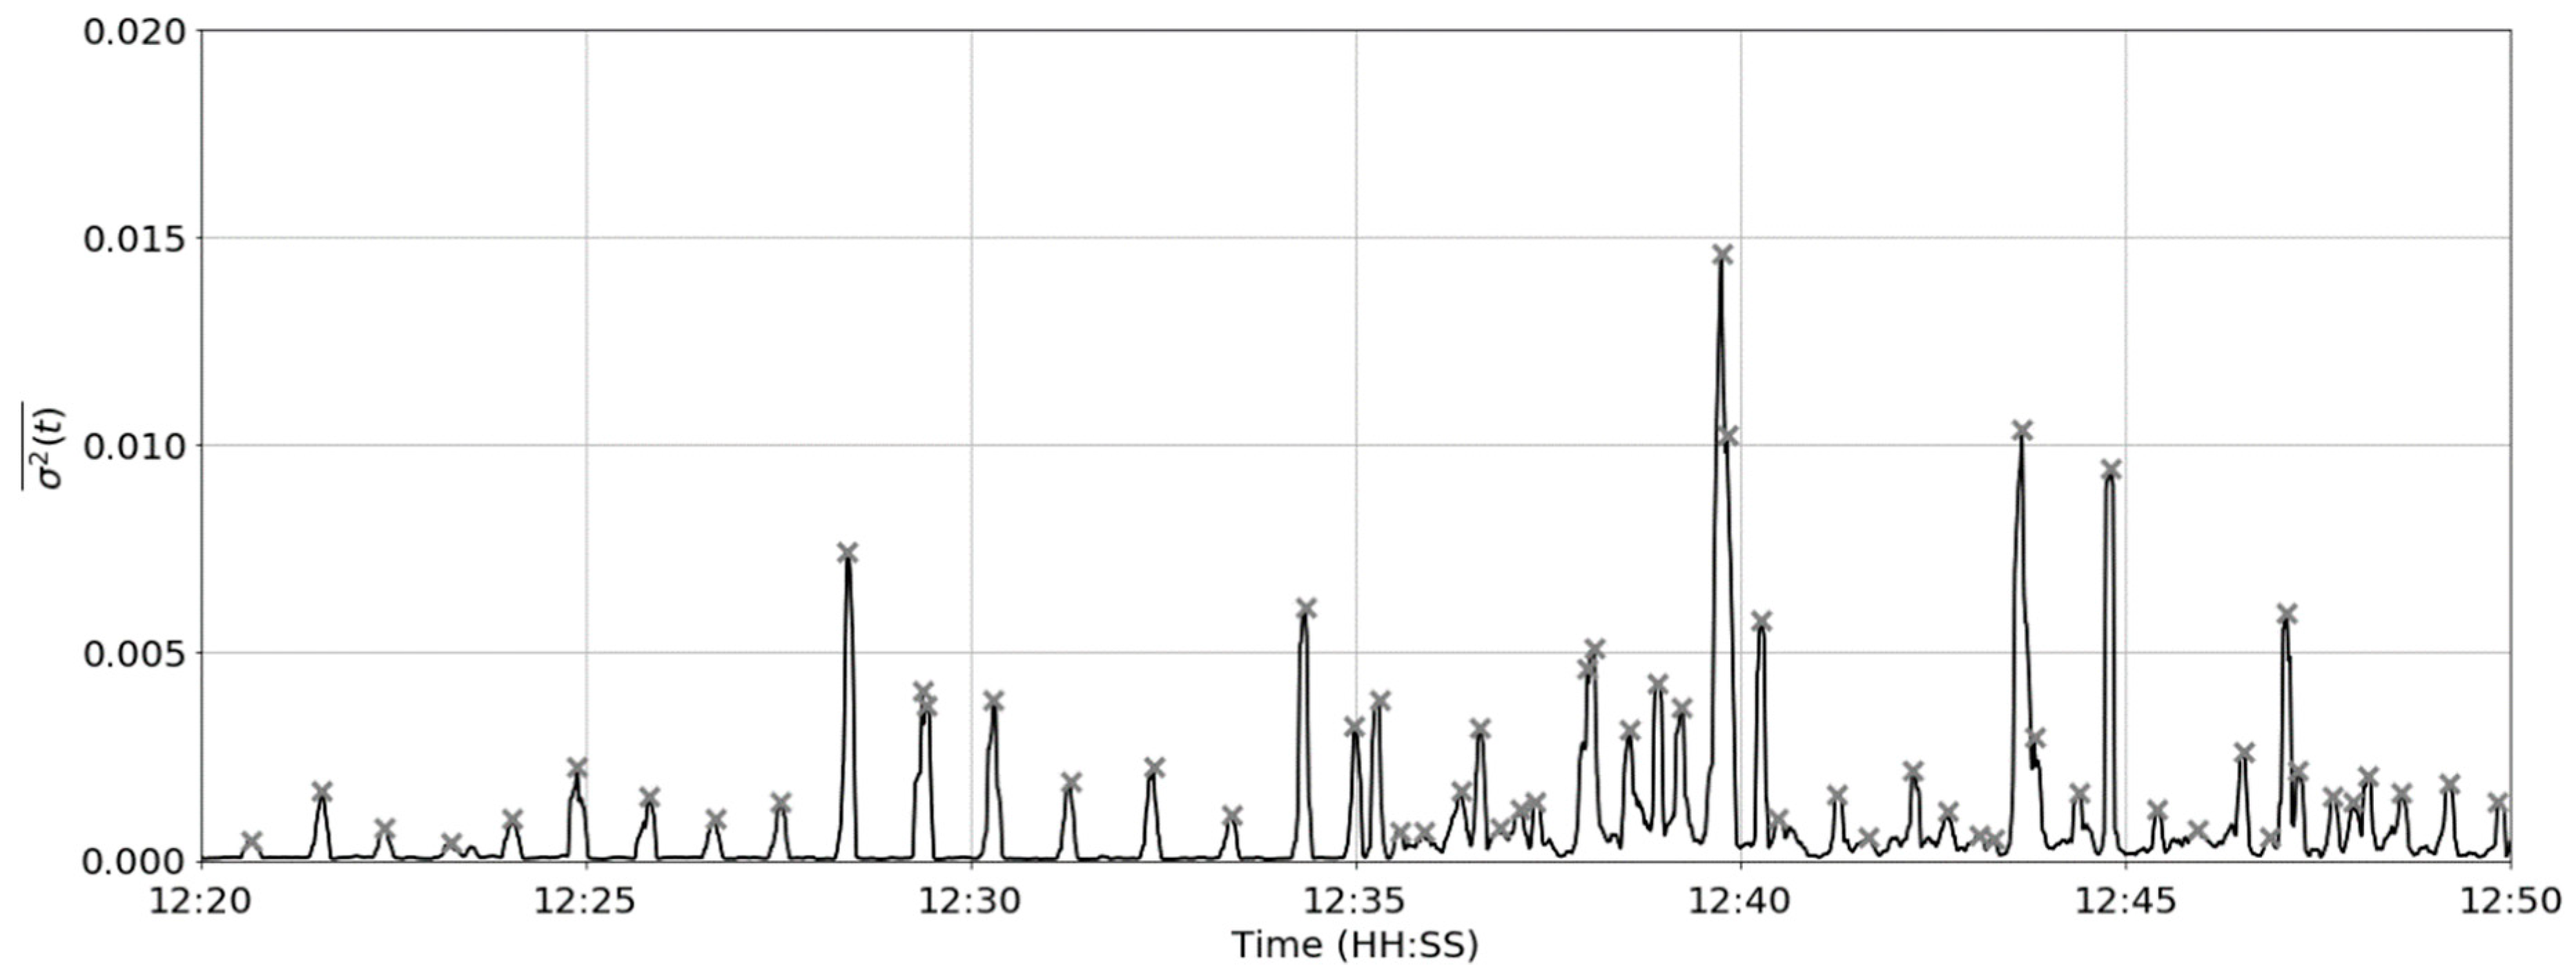
3.2. Contraction Identification and Inter-Contraction Interval
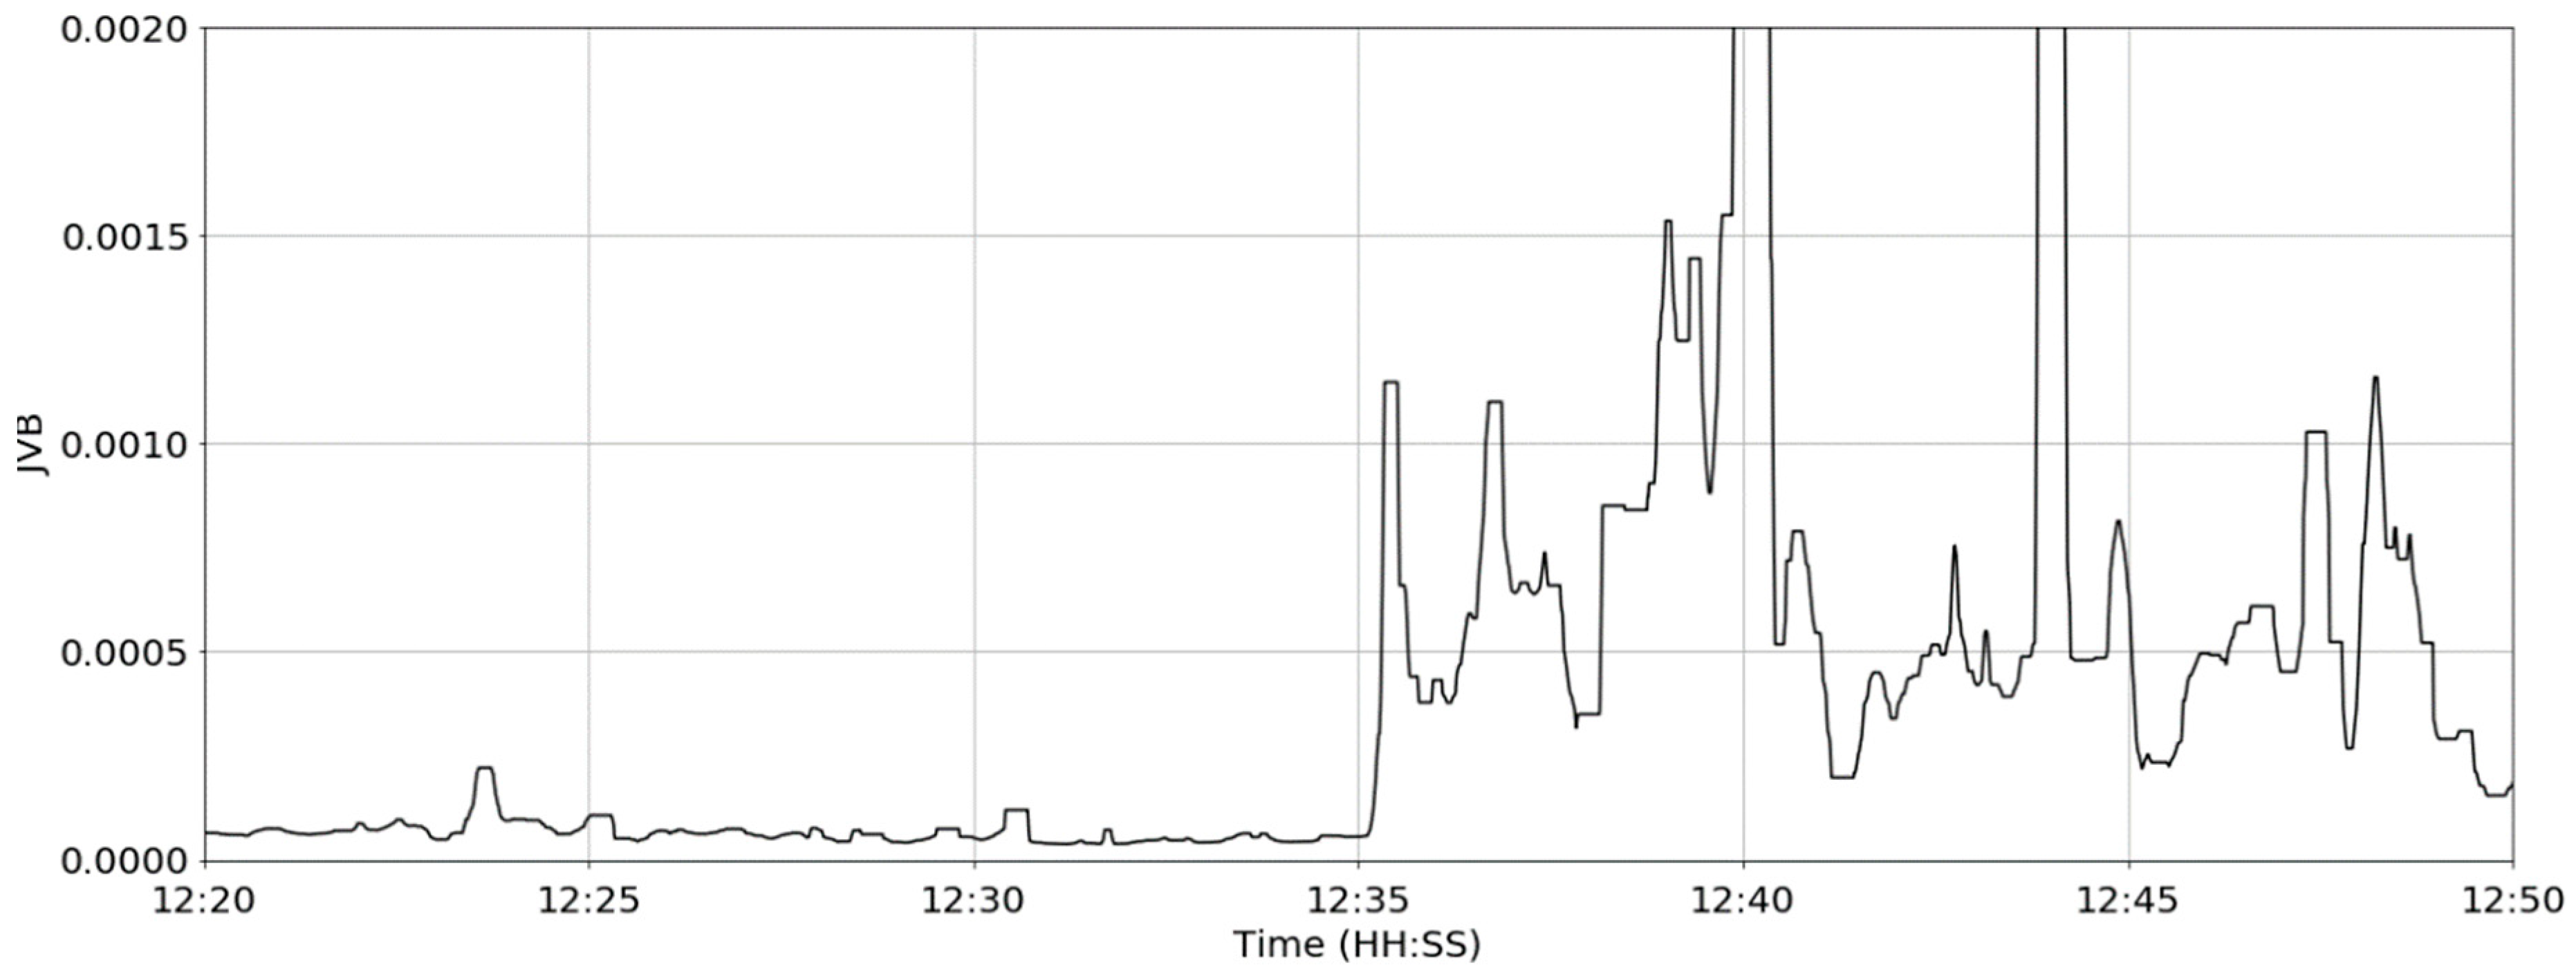
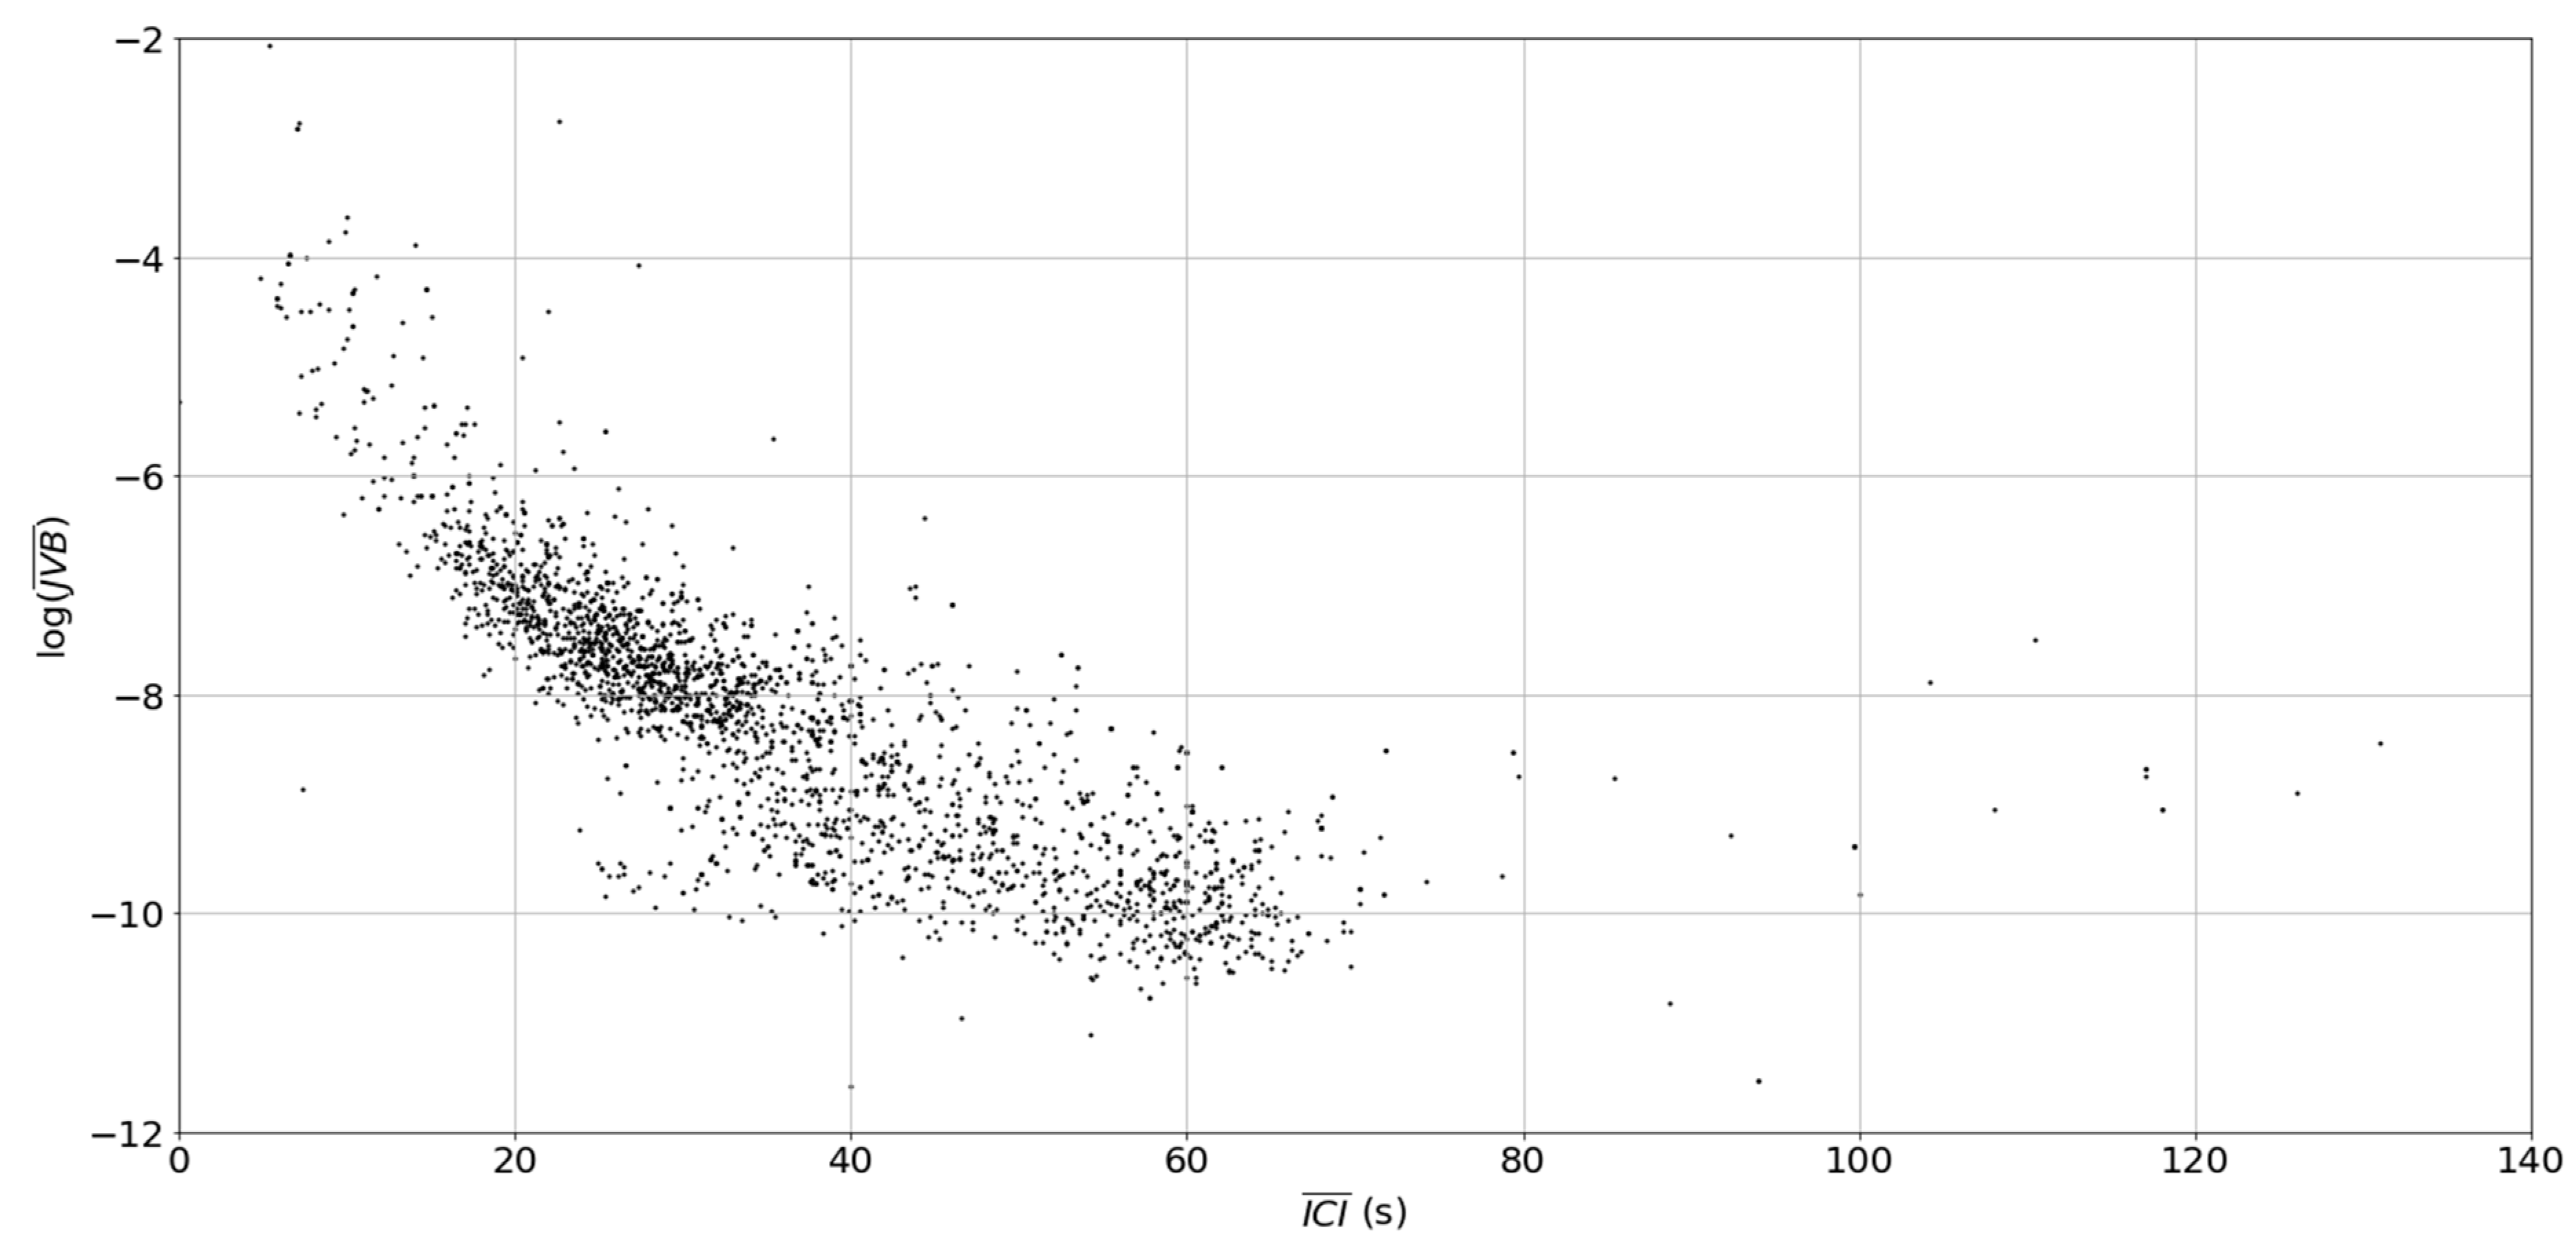
3.3. Jerk Variance Baseline
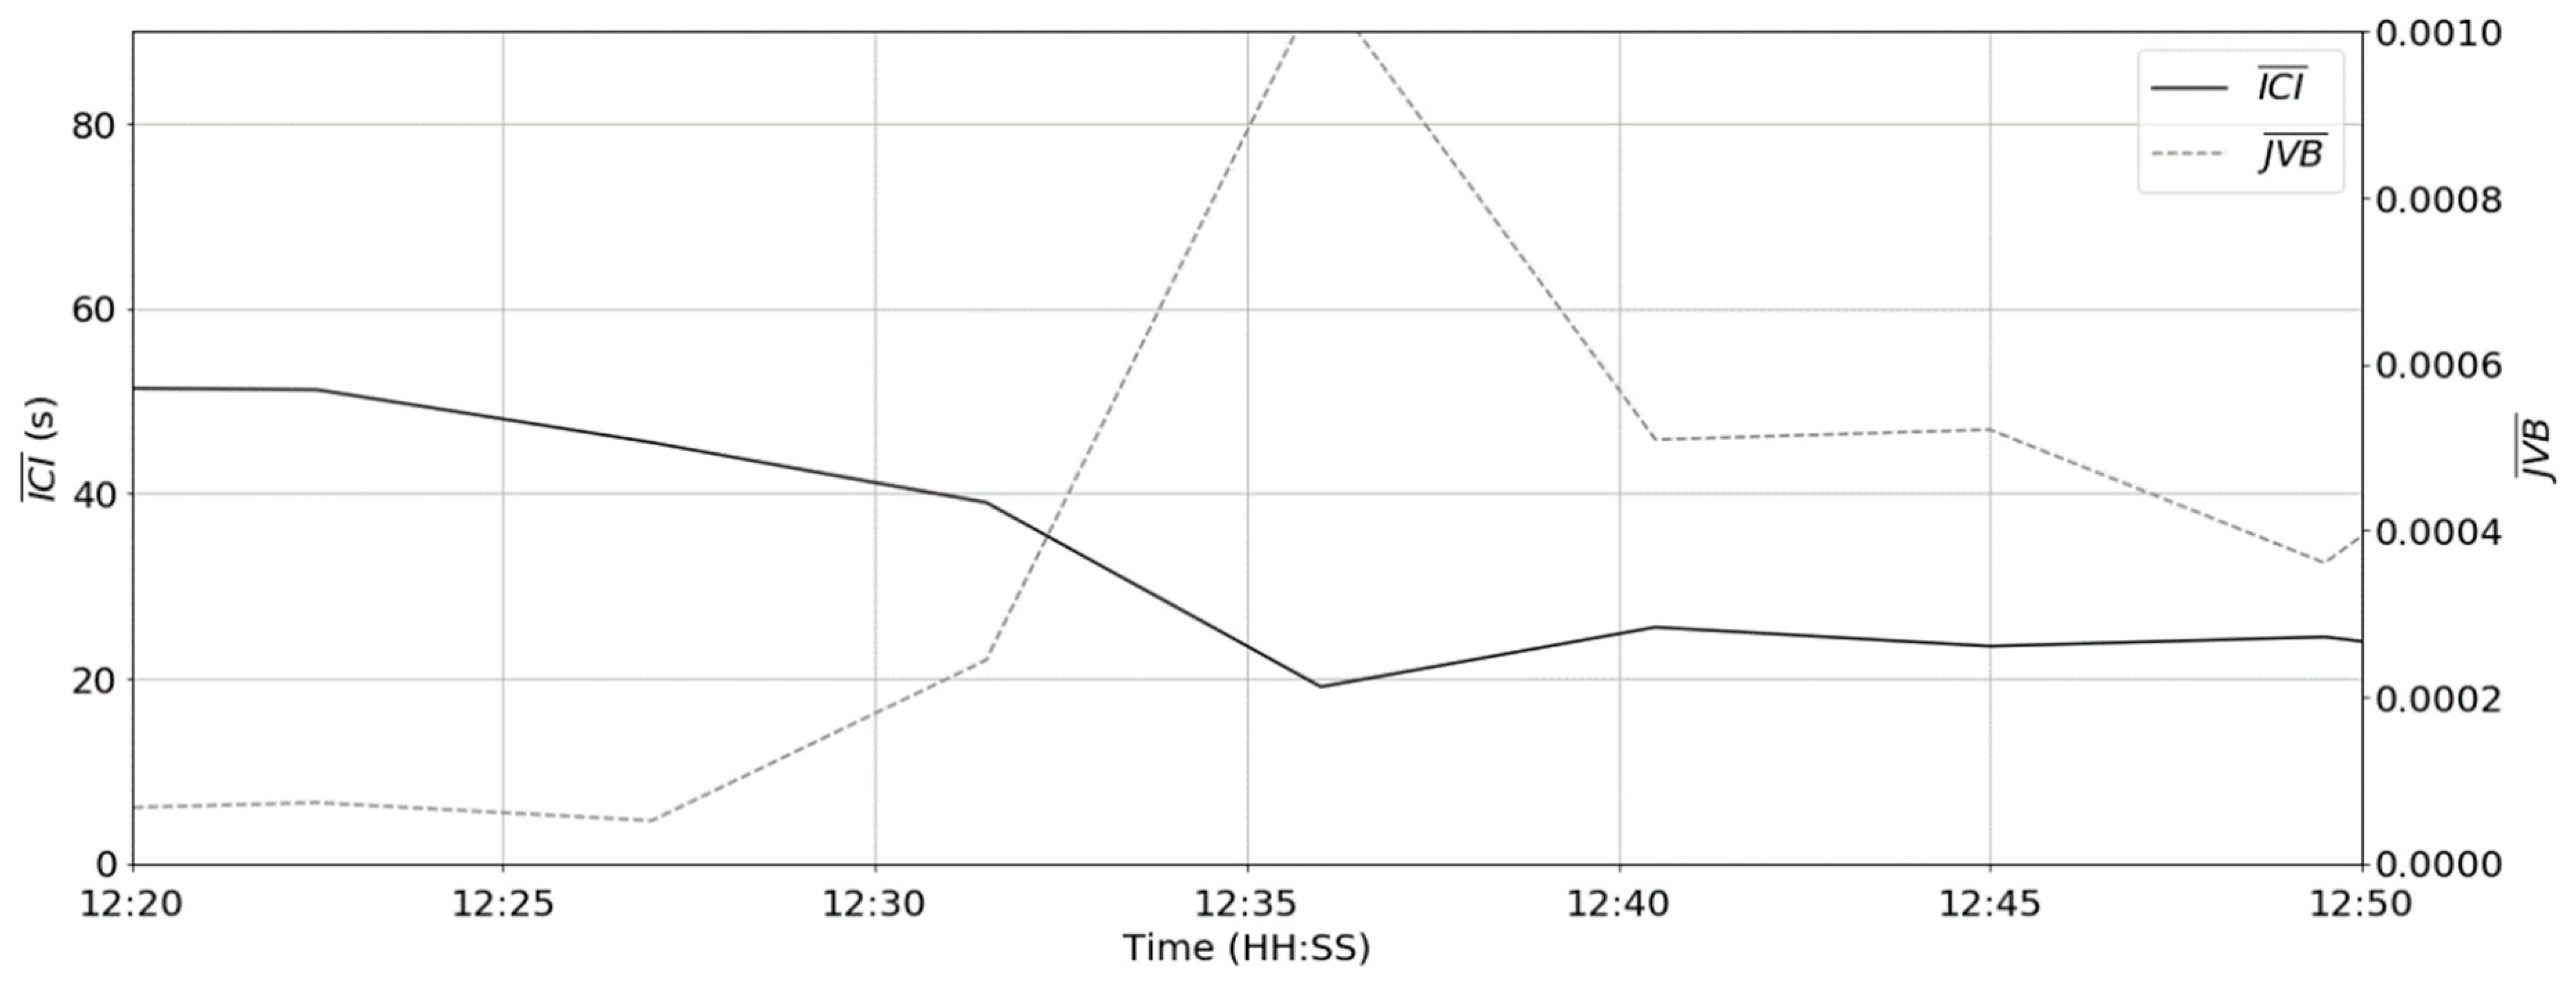
3.4. Feature Extraction
3.5. Support Vector Machine Classification using ICI and JVB Features
4. Results
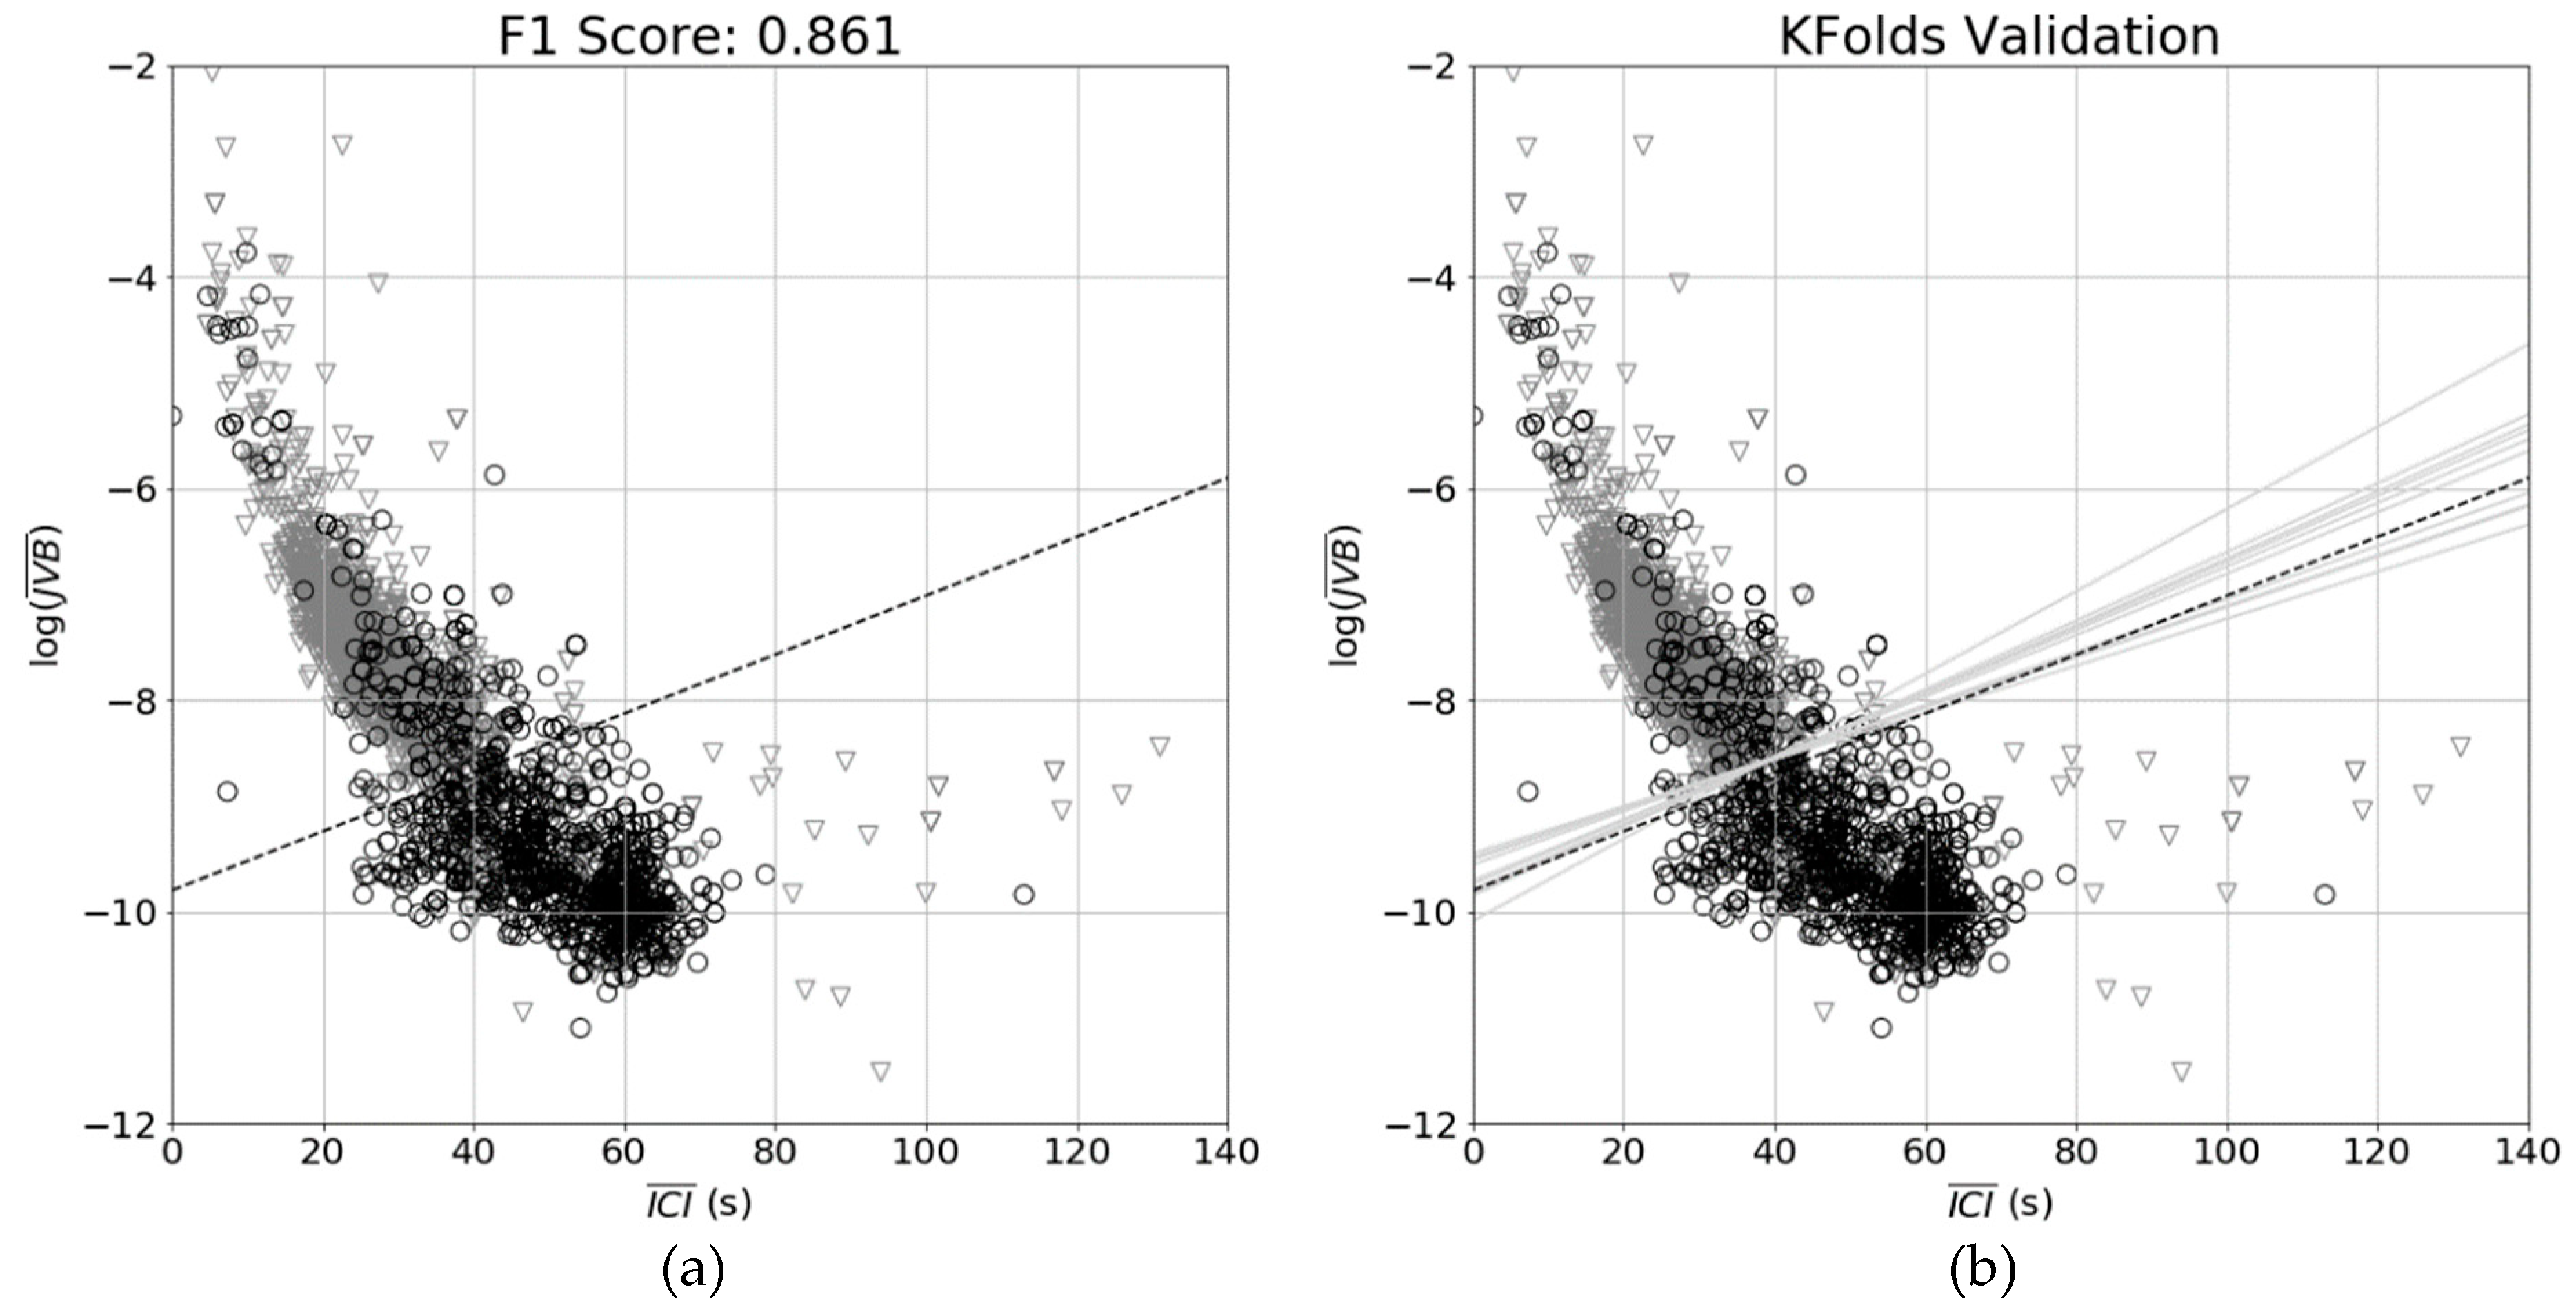
4.1. Linear SVM
4.2. k-Folds Validation
5. Discussion
6. Conclusions
Supplementary Materials
Author Contributions
Funding
Acknowledgments
Conflicts of Interest
References
- Agriculture & Horticulture Development Board (AHDB) Diary, U.K. Dairy Statistics-An Insider’s Guide 2016. World, September 2016. Available online: https://dairy.ahdb.org.uk/news/news-articles/september-2016/2016-dairy-statistics-an-insiders-guide/#.XBuhXs2nxEY (accessed on 06 March 2019).
- Bate, A. House of Commons Library UK Dairy Industry Statistics Briefing Paper; Number 2721; United Kingdom House of Commons Library: London, UK, January 2016. [Google Scholar]
- Fricke, P.M.; Carvalho, P.D.; Giordano, J.O.; Valenza, A.; Lopes, G.; Amundson, M.C. Expression and detection of estrus in dairy cows: The role of new technologies. Animal 2014, 8, 134–143. [Google Scholar] [CrossRef] [PubMed]
- Michie, C.; Andonovic, I.; Tachtatzis, C.; Davison, C.; Konka, J. Wireless MEMS sensors for precision farming. In Wireless MEMS Networks and Applications; Elsevier: Duxford, UK, 2017; pp. 215–238. [Google Scholar]
- Roelofs, J.B.; Van Erp-van der Kooij, E. Estrus detection tools and their applicability in cattle: Recent and perspectival situation. Anim. Reprod. 2015, 12, 498–504. [Google Scholar]
- Xia, T.; Song, C.; Li, J.; Cao, N.; Li, C.; Xu, G.; Xu, F.; Liu, J.; Higgs, R.; O’Hare, G.M. Research and application of cow estrus detection based on the internet of things. In Proceedings of the 2017 IEEE International Conference on Computational Science and Engineering (CSE) and IEEE International Conference on Embedded and Ubiquitous Computing (EUC), Guangzhou, China, 21–24 July 2017. [Google Scholar]
- Kibbutz, A. Afimilk Silent Herdsman Fertility Management System. 2019. Available online: https://www.afimilk.com/products/cow-monitoring/afimilk-silent-herdsman-leading-neck-collar-fertility-management-system (accessed on 8 January 2019).
- Dairy, S. SCR Dairy Herd Intelligence Management System. 2019. Available online: http://www.scrdairy.com/herd-intelligence/scr-heatime-hr-system.html (accessed on 9 January 2019).
- Jónsson, R.; Blanke, M.; Poulsen, N.K.; Caponetti, F.; Højsgaard, S. Oestrus detection in dairy cows from activity and lying data using on-line individual models. Comput. Electron. Agric. 2011, 76, 6–15. [Google Scholar] [CrossRef]
- Mudziwepasi, S.K.; Scott, M.S. Assessment of a Wireless Sensor Network based monitoring tool for zero effort technologies: A Cattle-health and movement monitoring test case. In Proceedings of the 2014 IEEE 6th International Conference on Adaptive Science & Technology (ICAST), Ota, Nigeria, 29–31 October 2014; pp. 1–6. [Google Scholar]
- Granda-Cantuna, J.; Molina-Colcha, C.; Hidalgo-Lupera, S.-E.; Valarezo-Varela, C.-D. Design and Implementation of a Wireless Sensor Network for Precision Agriculture Operating in API Mode. In Proceedings of the 2018 International Conference on eDemocracy & eGovernment (ICEDEG), Ambato, Ecuador, 4–6 April 2018; pp. 144–149. [Google Scholar]
- Stangaferro, M.L.; Wijma, R.; Caixeta, L.S.; Al-Abri, M.A.; Giordano, J.O. Use of rumination and activity monitoring for the identification of dairy cows with health disorders: Part III. Metritis. J. Dairy Sci. 2016, 99, 7422–7433. [Google Scholar] [CrossRef] [PubMed]
- Bar, D.; Solomon, R. Rumination Collars: What Can They Tell Us. In Proceedings of the First North American Conference on Precision Dairy Management, Toronto, Canada, 2–5 March 2010; pp. 214–215. [Google Scholar]
- Pahl, C.; Hartung, E.; Mahlkow-Nerge, K.; Haeussermann, A. Feeding characteristics and rumination time of dairy cows around estrus. J. Dairy Sci. 2015, 98, 148–154. [Google Scholar] [CrossRef] [PubMed]
- Phillips, C.J.C. Cattle Behaviour; Farming Press: Ipswich, UK, 1993. [Google Scholar]
- Avshalom, B. Method And System for Monitoring Physiological Conditions Of, and/or Suitability of Animal Feed for Ruminant Animals. U.S. Patent 7350481 B2, 13 September 2012. [Google Scholar]
- Mansbridge, N.; Mitsch, J.; Bollard, N.; Ellis, K.; Miguel-Pacheco, G.G.; Dottorini, T.; Kaler, J. Feature selection and comparison of machine learning algorithms in classification of grazing and rumination behaviour in sheep. Sensors 2018, 18, 3532. [Google Scholar] [CrossRef] [PubMed]
- Wolfger, B.; Timsit, E.; Pajor, E.A.; Cook, N.; Barkema, H.W.; Orsel, K. Technical note: Accuracy of an ear tag-attached accelerometer to monitor rumination and feeding behavior in feedlot cattle. J. Anim. Sci. 2015, 93, 3164–3168. [Google Scholar] [CrossRef] [PubMed]
- Giovanetti, V.; Decandia, M.; Molle, G.; Acciaro, M.; Mameli, M.; Cabiddu, A.; Cossu, R.; Serra, M.G.; Manca, C.; Rassu, S.P.G. Automatic classification system for grazing, ruminating and resting behaviour of dairy sheep using a tri-axial accelerometer. Livest. Sci. 2017, 196, 42–48. [Google Scholar] [CrossRef]
- Deniz, N.N.; Chelotti, J.O.; Galli, J.R.; Planisich, A.M.; Larripa, M.J.; Rufiner, H.L.; Giovanini, L.L. Embedded system for real-time monitoring of foraging behavior of grazing cattle using acoustic signals. Comput. Electron. Agric. 2017, 138, 167–174. [Google Scholar] [CrossRef]
- Zin, T.T.; Kai, H.; Sumi, K.; Kobayashi, I.; Hama, H. Estrus Detection for Dairy Cow Using a Laser Range Sensor. In Proceedings of the 2016 Third International Conference on Computing Measurement Control and Sensor Network (CMCSN), Matsue, Japan, 20–22 May 2016; pp. 162–165. [Google Scholar]
- Leek, B.F. Clinical diseases of the rumen: A physiologist’s view. Vet. Rec. 1983, 113, 10–14. [Google Scholar] [CrossRef] [PubMed]
- DePeters, E.J.; George, L.W. Rumen transfaunation. Immunol. Lett. 2014, 162, 69–76. [Google Scholar] [CrossRef] [PubMed]
- Madan, J.; Gupta, M.; Rose, M.K.; Sindhu, S.; Kar, D. Metabolic alterations in buffaloes suffering from digestive disorders. Haryana Vet. 2013, 52, 71–72. [Google Scholar]
- Huber, T.L. Physiological effects of acidosis on feedlot cattle. J. Anim. Sci. 1976, 43, 902–909. [Google Scholar] [CrossRef] [PubMed]
- Mottram, T.; Lowe, J.; McGowan, M.; Phillips, N. Technical note: A wireless telemetric method of monitoring clinical acidosis in dairy cows. Comput. Electron. Agric. 2008, 64, 45–48. [Google Scholar] [CrossRef]
- smaxTec Heat and Calving Detection Bolus smaXtec Animal Care Gmbh. 2019. Available online: https://www.smaxtec.com/en/heat-calving-detection/ (accessed on 9 January 2019).
- Zhang, L.; Lu, J.; Nogami, H.; Okada, H.; Itoh, T. Compact rumen pH sensor: Aiming at the realization of livestock electronic management and fine forage strategy. In Proceedings of the 2017 International Conference on Electronics Packaging, ICEP, Yamagata, Japan, 19–22 April 2017; pp. 602–604. [Google Scholar]
- Zhang, L.; Lu, J.; Okada, H.; Nogami, H.; Itoh, T. Development of ITO-and FET-based cow rumen sensor for long-term pH value monitoring. In Proceedings of the 2016 Symposium on Design, Test, Integration and Packaging of MEMS/MOEMS (DTIP), Budapest, Hungary, 30 May–2 June 2016; pp. 1–5. [Google Scholar]
- Gasteiner, J.; Guggenberger, T.; Häusler, J.; Steinwidder, A. Continuous and long-term measurement of reticuloruminal pH in grazing dairy cows by an indwelling and wireless data transmitting unit. Vet. Med. Int. 2012, 2012, 1–7. [Google Scholar] [CrossRef] [PubMed]
- Nogami, H.; Arai, S.; Okada, H.; Zhan, L.; Itoh, T. Minimized bolus-type wireless sensor node with a built-in three-axis acceleration meter for monitoring a Cow’s Rumen conditions. Sensors 2017, 17, 687. [Google Scholar] [CrossRef] [PubMed]
- Neubauer, V.; Humer, E.; Kröger, I.; Braid, T.; Wagner, M.; Zebeli, Q. Differences between pH of indwelling sensors and the pH of fluid and solid phase in the rumen of dairy cows fed varying concentrate levels. J. Anim. Physiol. Anim. Nutr. 2018, 102, 343–349. [Google Scholar] [CrossRef] [PubMed]
- Kamphuis, C.; DelaRue, B.; Burke, C.; Jago, J. Field evaluation of 2 collar-mounted activity meters for detecting cows in estrus on a large pasture-grazed dairy farm. J. Dairy Sci. 2012, 95, 2045–3056. [Google Scholar] [CrossRef] [PubMed]
- Caja, G.; Castro-Costa, A.; Knight, C.H. Engineering to support wellbeing of dairy animals. J. Dairy Res. 2016, 83, 136–147. [Google Scholar] [CrossRef] [PubMed] [Green Version]
- Smith, D.; Rahman, A.; Bishop-Hurley, G.J.; Hills, J.; Shahriar, S.; Henry, D.; Rawnsley, R. Behavior classification of cows fitted with motion collars: Decomposing multi-class classification into a set of binary problems. Comput. Electron. Agric. 2016, 131, 40–50. [Google Scholar] [CrossRef]
- Rayas-Amor, A.A.; Morales-Almaráz, E.; Licona-Velázquez, G.; Vieyra-Alberto, R.; García-Martínez, A.; Martínez-García, C.G.; Cruz-Monterrosa, R.G.; Miranda-de la Lama, G.C. Triaxial accelerometers for recording grazing and ruminating time in dairy cows: An alternative to visual observations. J. Vet. Behav. Clin. Appl. Res. 2017, 20, 102–108. [Google Scholar] [CrossRef]
- Bhavsar, A.R.; Arolkar, H.A. Multidimensional Association Rule Based Data Mining Technique for Cattle Health Monitoring Using Wireless Sensor Network. In Proceedings of the 2014 International Conference on Computing for Sustainable Global Development (Indiacom), New Delhi, India, 5–7 March 2014; pp. 810–814. [Google Scholar]
- Borchers, M.R.; Chang, Y.M.; Proudfoot, K.L.; Wadsworth, B.A.; Stone, A.E.; Bewley, J.M. Machine-learning-based calving prediction from activity, lying, and ruminating behaviors in dairy cattle. J. Dairy Sci. 2017, 100, 5664–5674. [Google Scholar] [CrossRef] [PubMed] [Green Version]
- Satopää, V.; Albrecht, J.; Irwin, D.; Raghavan, B. Finding a ‘kneedle’ in a haystack: Detecting knee points in system behavior. In Proceedings of the 2011 31st International Conference on Distributed Computing Systems Workshops, Minneapolis, MN, USA, 20–24 June 2011. [Google Scholar]
- Rahman, A.; Smith, D.V.; Little, B.; Ingham, A.B.; Greenwood, P.L.; Bishop-Hurley, G.J. Cattle behaviour classification from collar, halter, and ear tag sensors. Inf. Process. Agric. 2018, 5, 124–133. [Google Scholar] [CrossRef]


| True Rumination Class | ||||
| Rumination | Non-rumination | |||
| Predicted Rumination Class | Rumination | TP = 34.3% | FP = 6.9% | Precision = 0.832 |
| Non-rumination | FN = 4.2% | TN = 54.6% | Negative Predictive Value = 0.928 | |
| Recall = 0.892 | Specificity = 0.888 | F1 = 0.861 | ||
| Fold # | 1 | 2 | 3 | 4 | 5 | 6 | 7 | 8 | 9 | 10 |
|---|---|---|---|---|---|---|---|---|---|---|
| F1 Score | 0.871 | 0.916 | 0.844 | 0.844 | 0.851 | 0.855 | 0.803 | 0.821 | 0.823 | 0.839 |
| Precision | 0.853 | 0.893 | 0.792 | 0.810 | 0.836 | 0.801 | 0.790 | 0.833 | 0.817 | 0.839 |
| Recall | 0.889 | 0.941 | 0.903 | 0.882 | 0.866 | 0.917 | 0.816 | 0.810 | 0.830 | 0.840 |
© 2019 by the authors. Licensee MDPI, Basel, Switzerland. This article is an open access article distributed under the terms and conditions of the Creative Commons Attribution (CC BY) license (http://creativecommons.org/licenses/by/4.0/).
Share and Cite
Hamilton, A.W.; Davison, C.; Tachtatzis, C.; Andonovic, I.; Michie, C.; Ferguson, H.J.; Somerville, L.; Jonsson, N.N. Identification of the Rumination in Cattle Using Support Vector Machines with Motion-Sensitive Bolus Sensors. Sensors 2019, 19, 1165. https://doi.org/10.3390/s19051165
Hamilton AW, Davison C, Tachtatzis C, Andonovic I, Michie C, Ferguson HJ, Somerville L, Jonsson NN. Identification of the Rumination in Cattle Using Support Vector Machines with Motion-Sensitive Bolus Sensors. Sensors. 2019; 19(5):1165. https://doi.org/10.3390/s19051165
Chicago/Turabian StyleHamilton, Andrew W., Chris Davison, Christos Tachtatzis, Ivan Andonovic, Craig Michie, Holly J. Ferguson, Laura Somerville, and Nicholas N. Jonsson. 2019. "Identification of the Rumination in Cattle Using Support Vector Machines with Motion-Sensitive Bolus Sensors" Sensors 19, no. 5: 1165. https://doi.org/10.3390/s19051165