In-Situ Wireless Pressure Measurement Using Zero-Power Packaged Microwave Sensors

 , and
, and
Abstract
:1. Introduction
2. Design and Fabrication of Packaged and Zero-Power Microwave Pressure Sensors
3. Microwave Characterization of the Packaged Pressure Sensor from S-Parameters
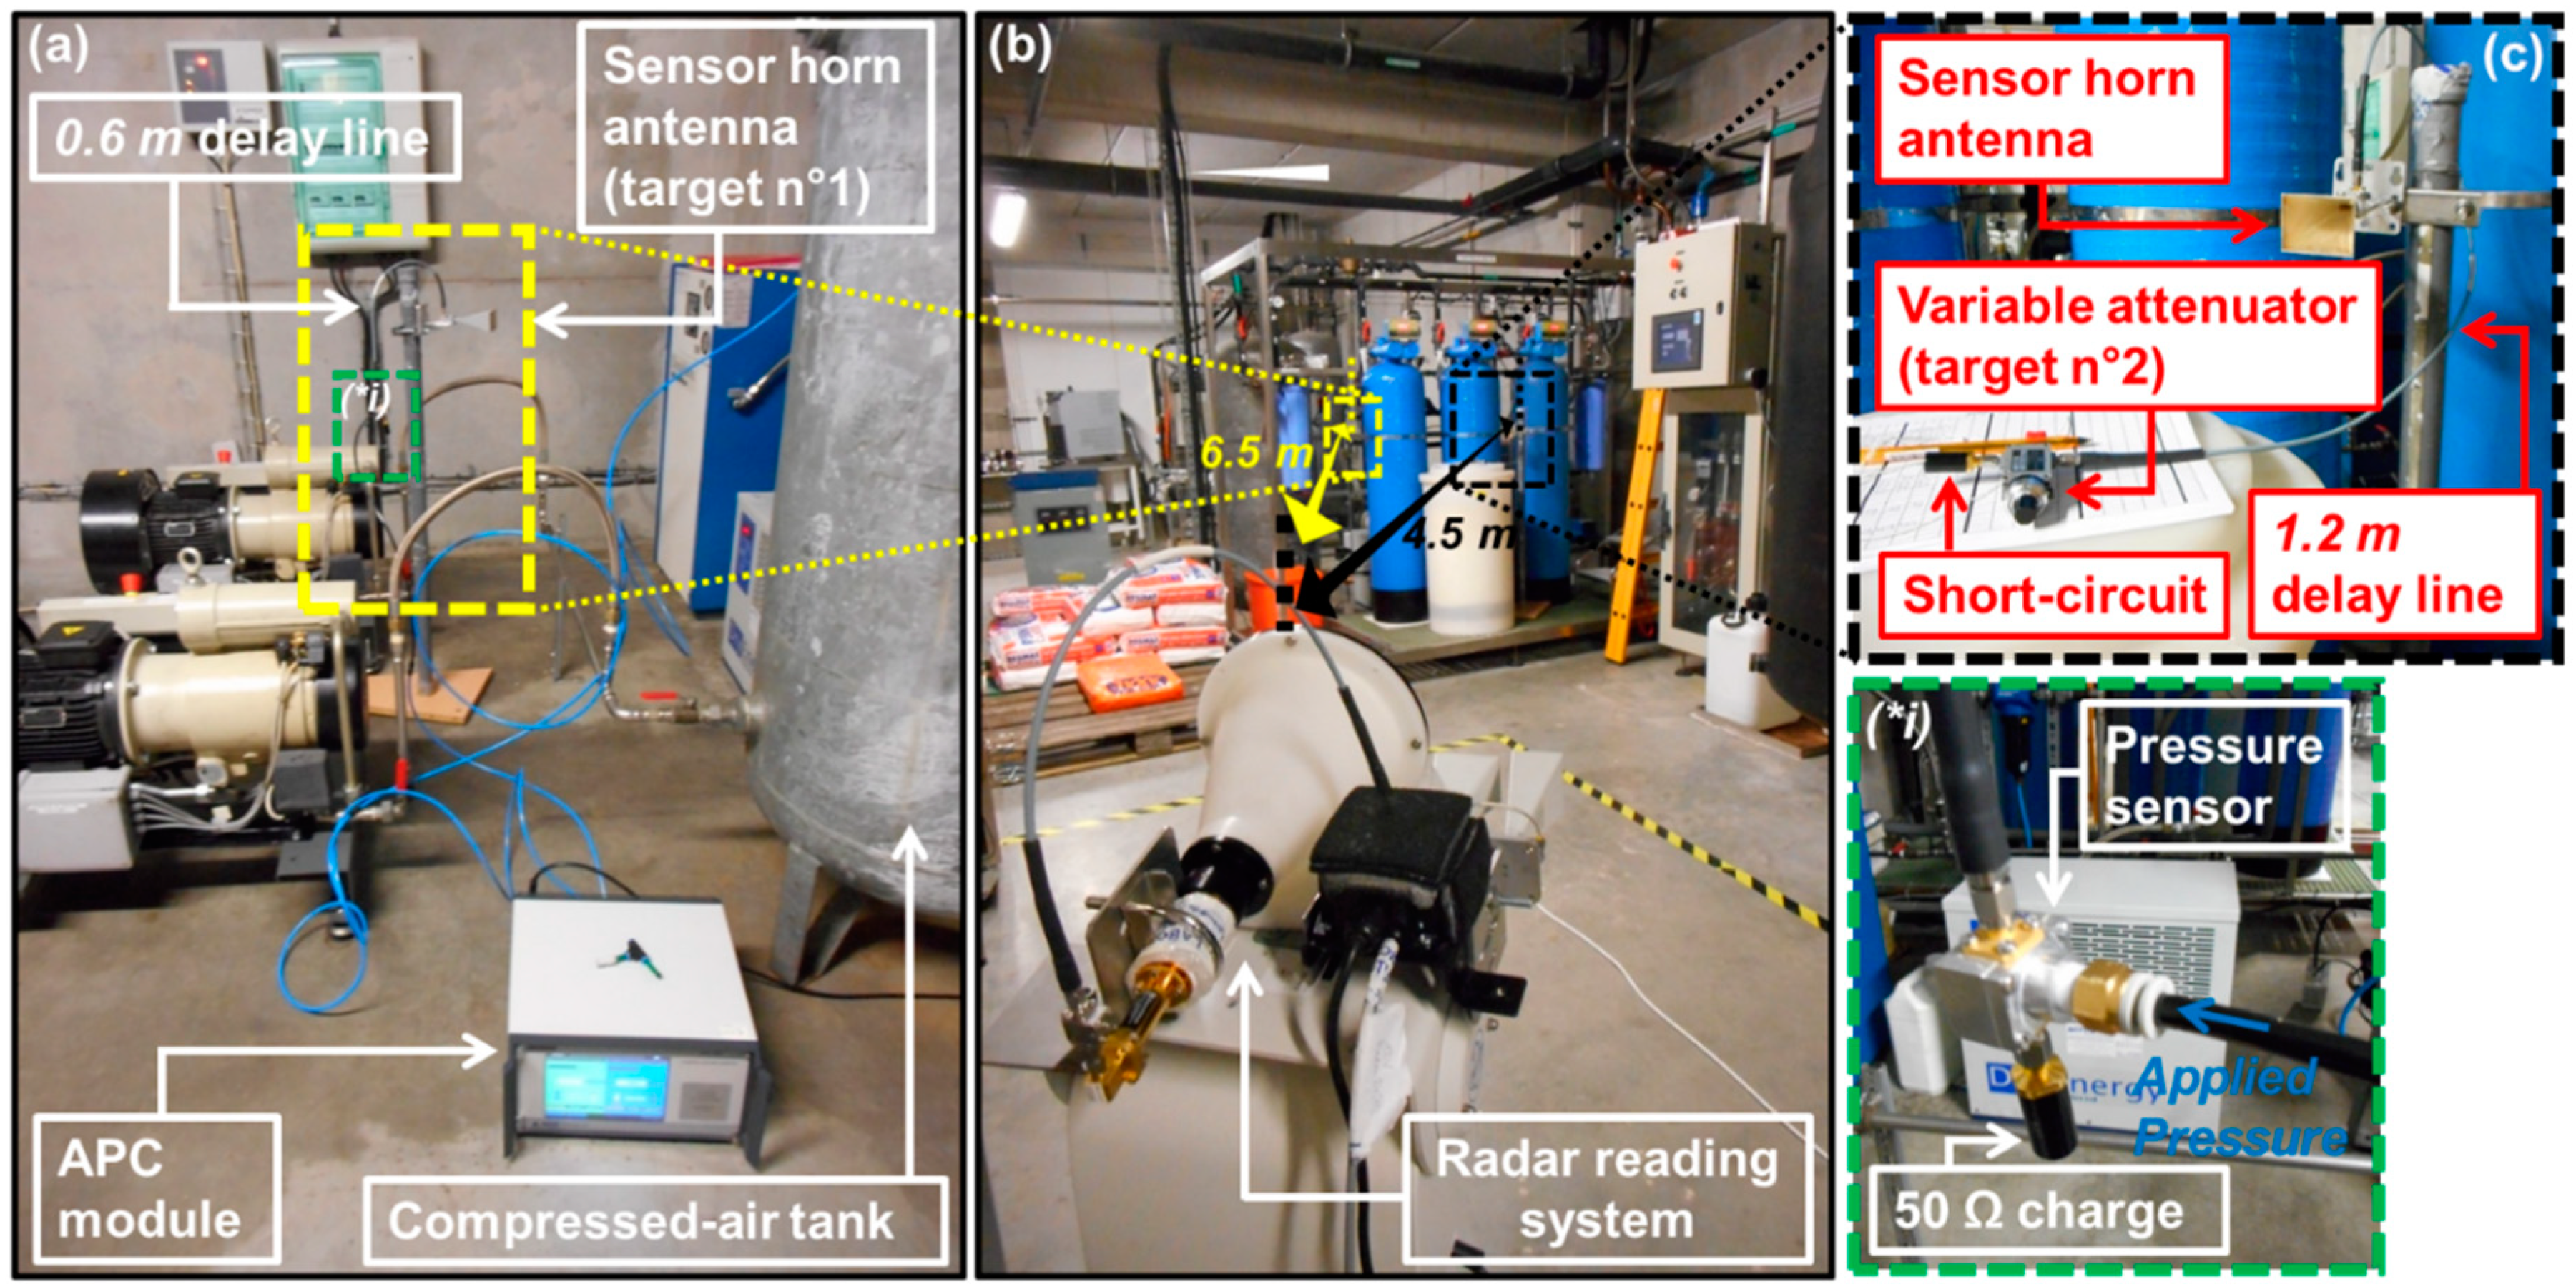
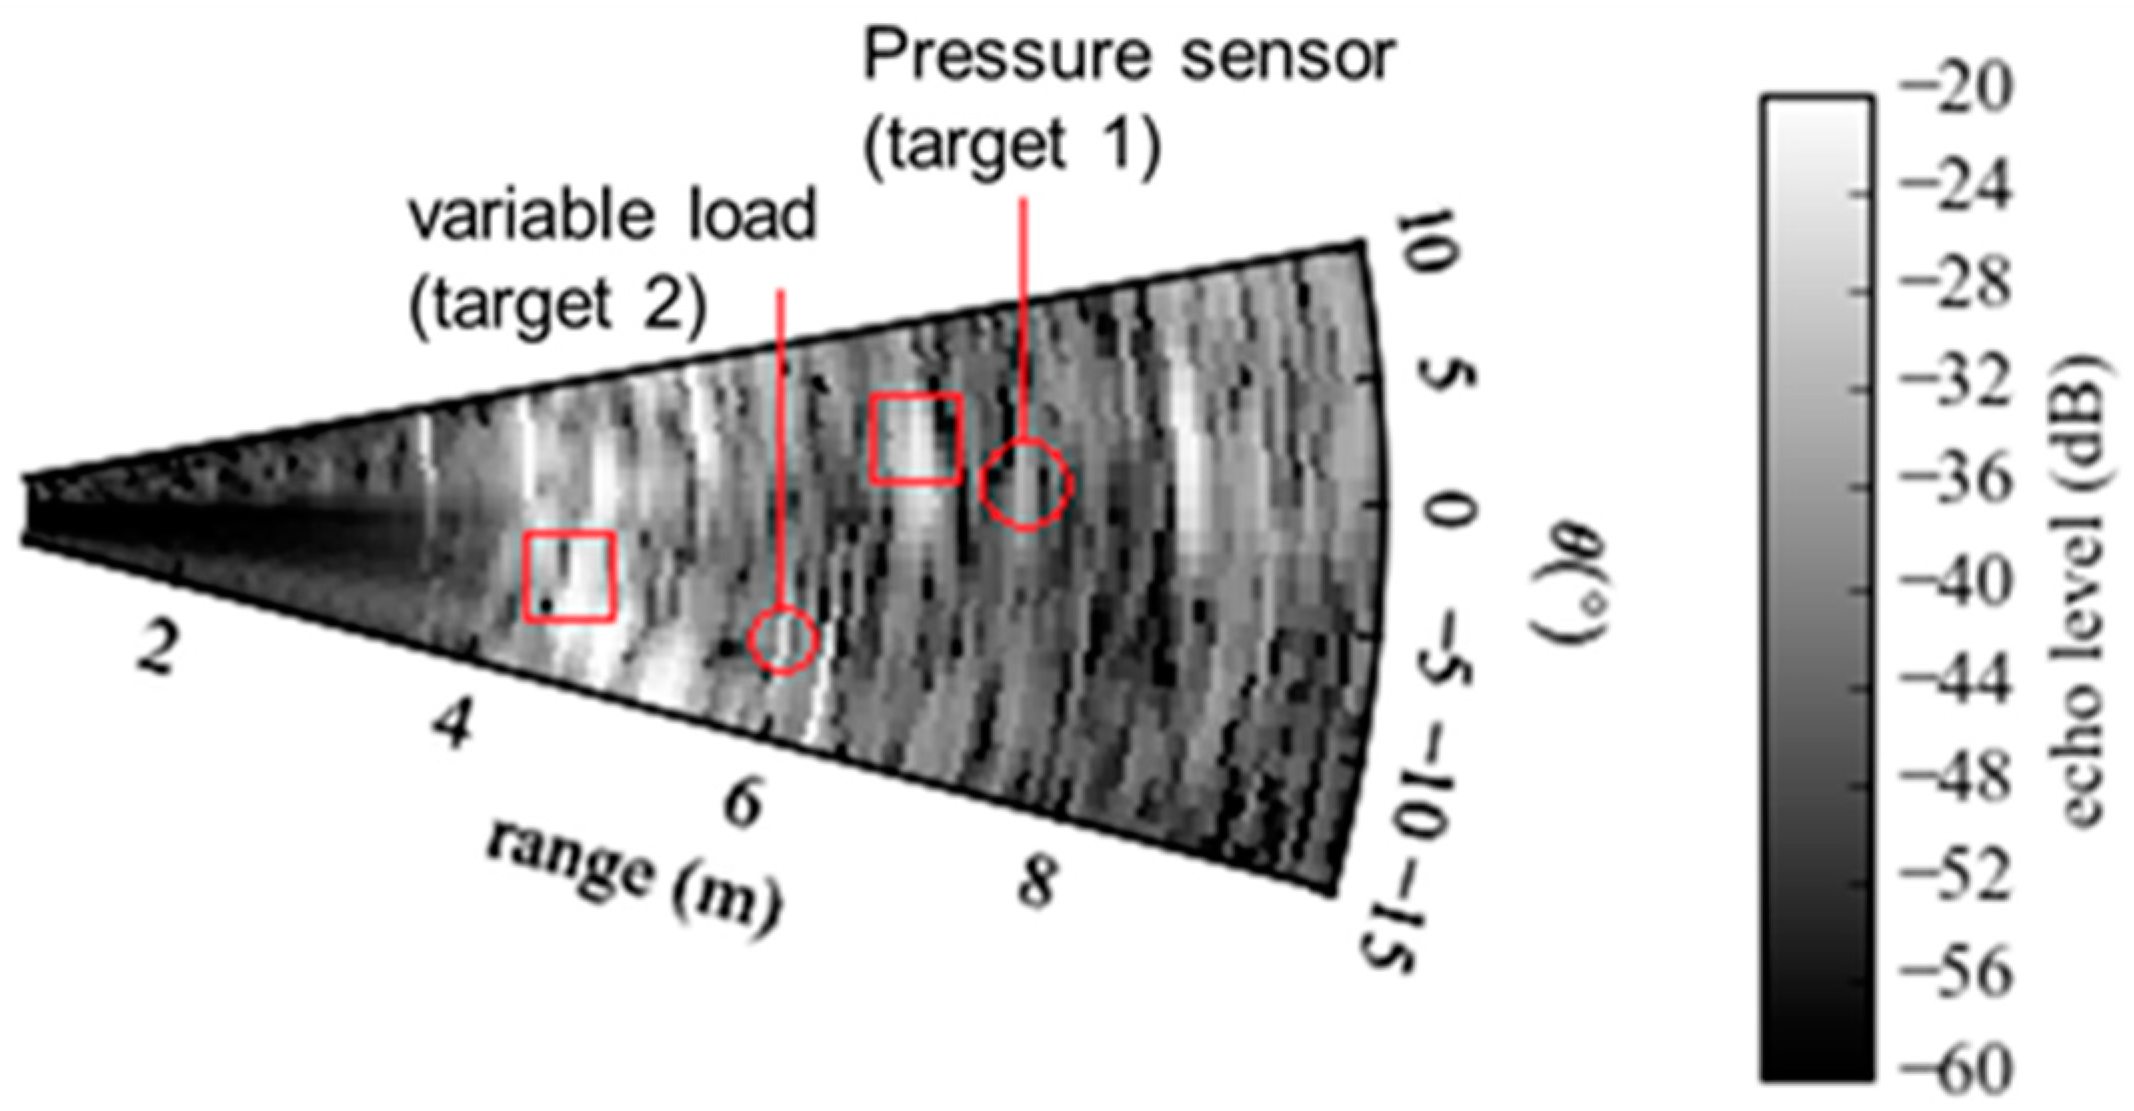
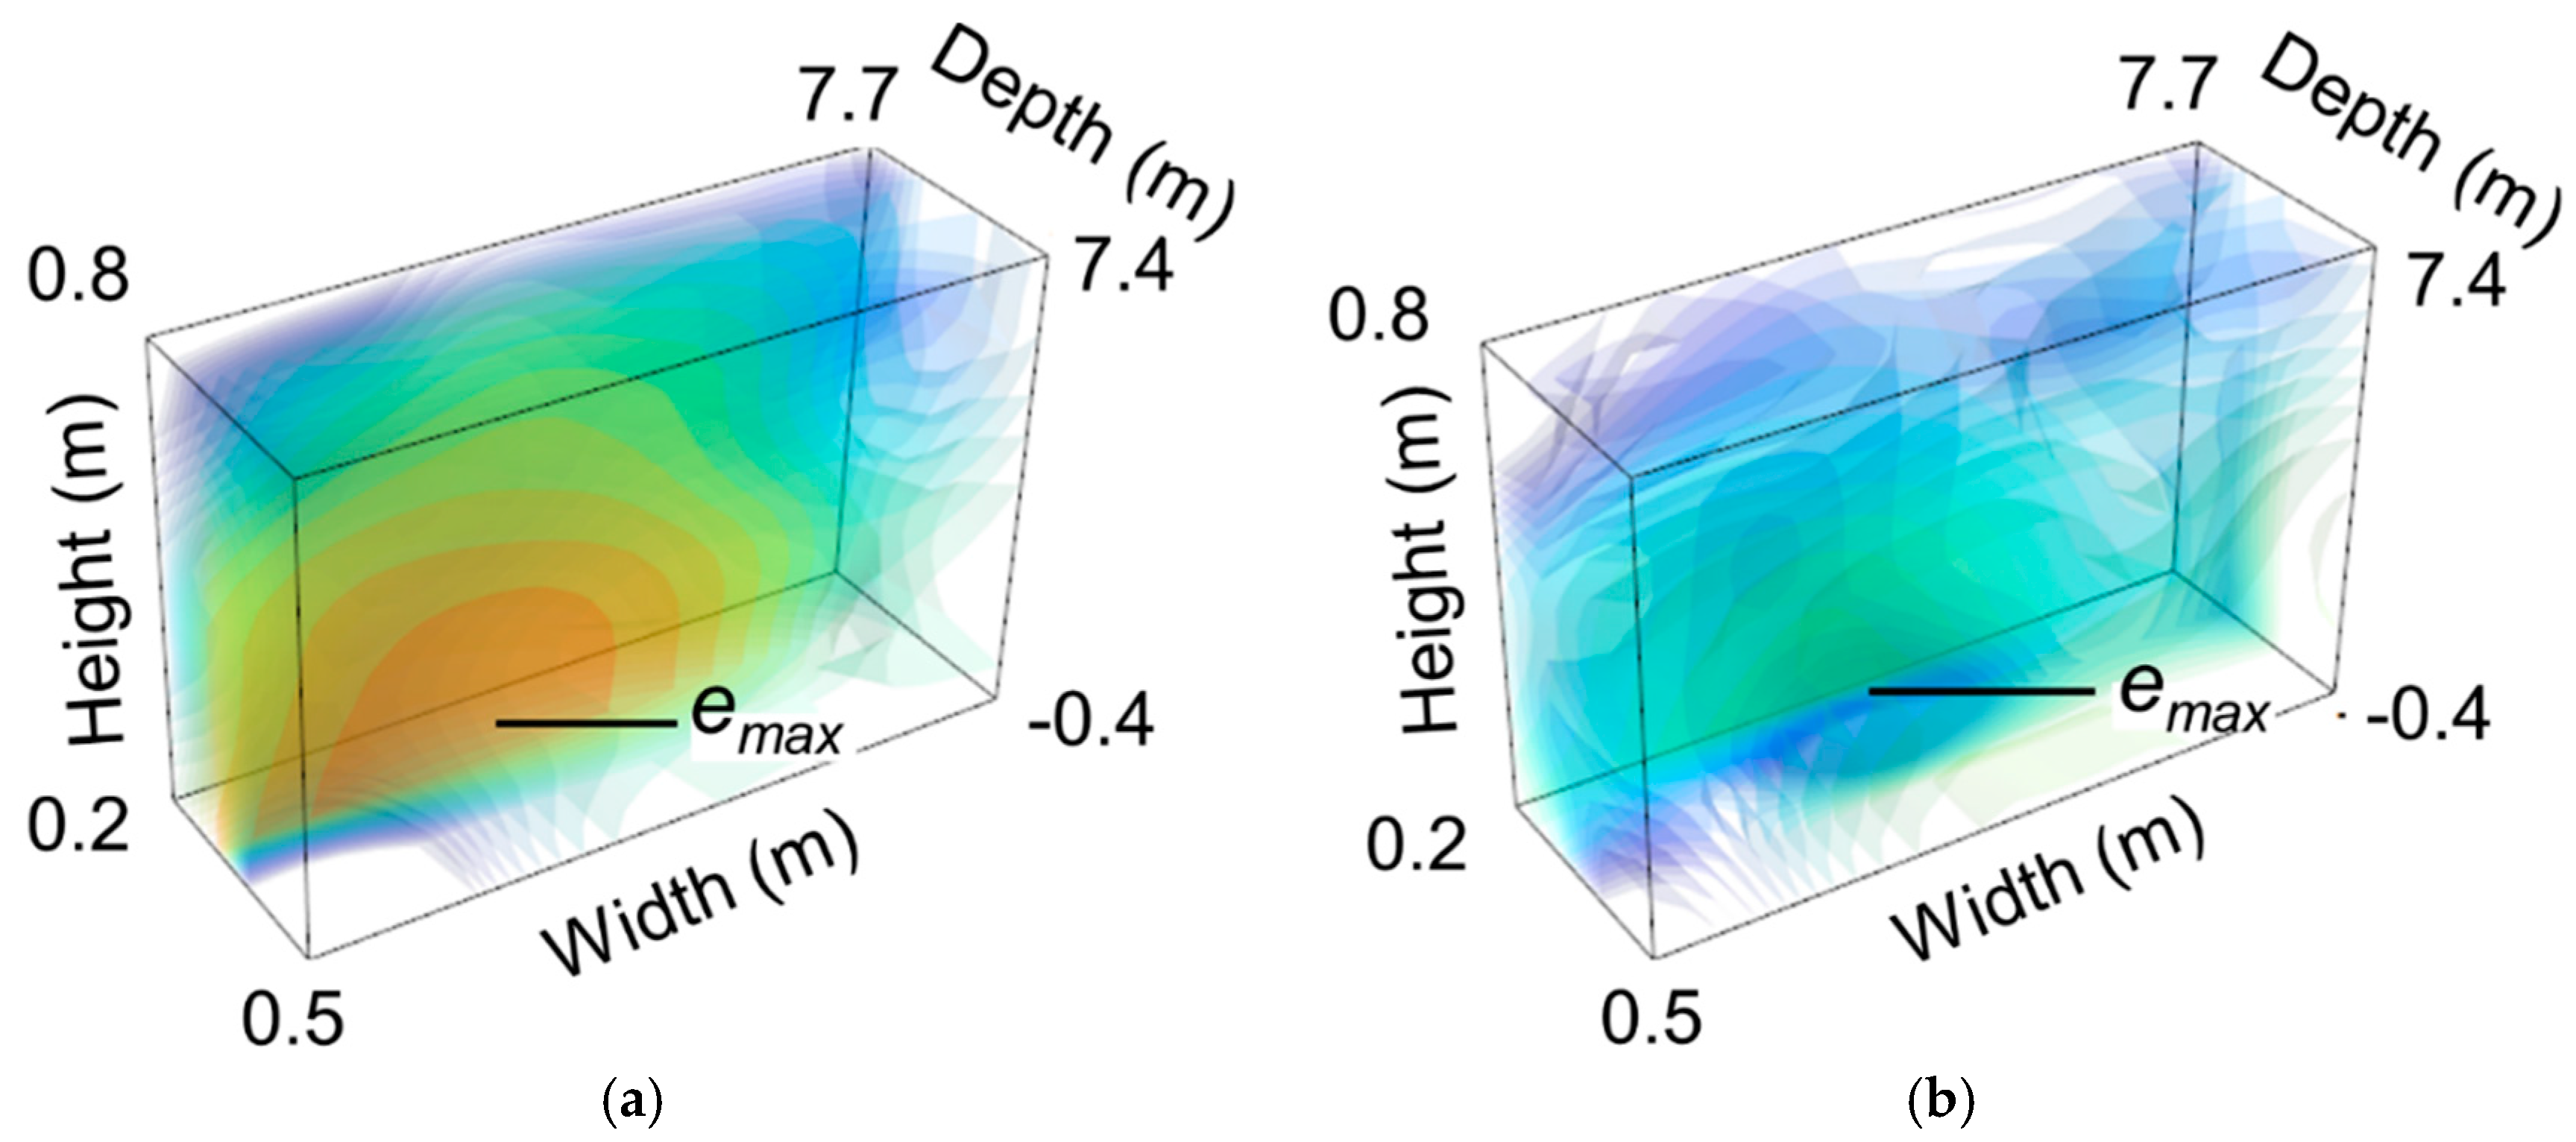
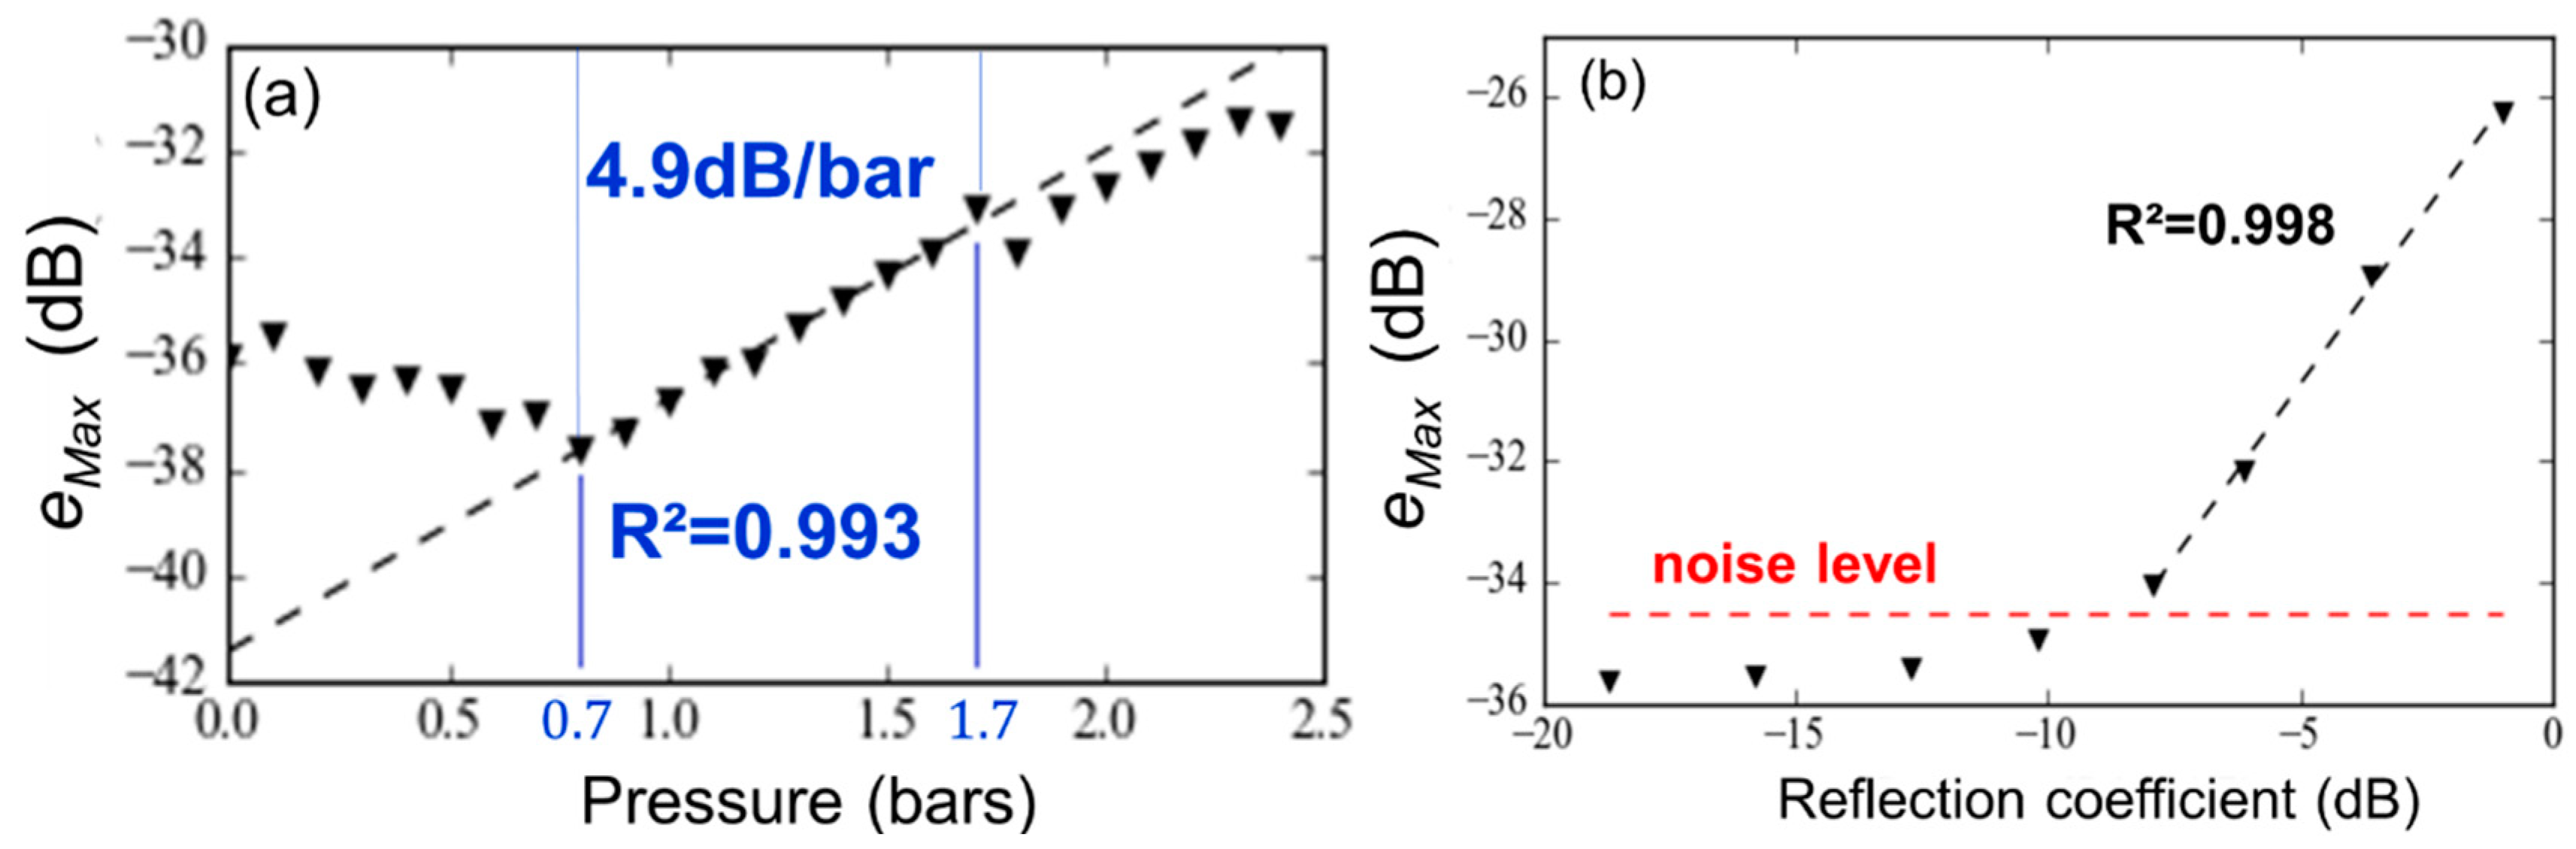
4. Wireless Pressure Measurement in Electromagnetic Reverberant Environments
5. Conclusions
Author Contributions
Funding
Acknowledgments
Conflicts of Interest
References
- Cook, B.S.; Vyas, R.; Kim, S.; Thai, T.; Le, T.; Traille, A.; Aubert, H.; Tentzeris, M.M. RFID-based sensors for “zero-power” autonomous wireless sensor networks. IEEE Sens. J. 2014, 14, 2419–2431. [Google Scholar] [CrossRef]
- Traille, A.; Bouaziz, S.; Pinon, S.; Pons, P.; Aubert, H.; Boukabache, A.; Tentzeris, M.M. A wireless passive RCS-based temperature sensor using liquid metal and microfluidics technologies. In Proceedings of the 2011 41st European Microwave Conference, Manchester, UK, 10–13 October 2011; pp. 45–48. [Google Scholar]
- Cheng, H.; Ren, X.; Ebadi, S.; Chen, Y.; An, L.; Gong, X. Wireless passive temperature sensors using integrated cylindrical resonator/antenna for harsh-environment applications. IEEE Sens. J. 2015, 15, 1453–1462. [Google Scholar] [CrossRef]
- Thai, T.T.; Jatlaoui, M.M.; Aubert, H.; Pons, P.; DeJean, G.R.; Tentzeris, M.M.; Plana, R. A novel passive wireless ultrasensitive RF temperature transducer for remote sensing. In Proceedings of the 2010 IEEE MTT-S International Microwave Symposium, Anaheim, CA, USA, 23–28 May 2010; pp. 473–476. [Google Scholar]
- Henry, D.; Hester, J.G.D.; Aubert, H.; Pons, P.; Tentzeris, M.M. Long-range wireless interrogation of passive humidity sensors using Van-Atta cross-polarization effect and different beam scanning techniques. IEEE Trans. Microw. Theory Tech. 2017, 65, 5345–5354. [Google Scholar] [CrossRef]
- Amin, E.M.; Karmakar, N.C.; Winther-Jensen, B. Polyvinyl-alcohol (PVA)-based RF humidity sensor in microwave frequency. Prog. Electromagn. Res. B 2013, 54, 149–166. [Google Scholar] [CrossRef]
- Occhiuzzi, C.; Paggi, C.; Marrocco, G. Passive RFID strain-sensor based on meander-line antennas. IEEE Trans. Antennas Propag. 2011, 59, 4836–4840. [Google Scholar] [CrossRef]
- Thai, T.T.; Aubert, H.; Pons, P.; DeJean, G.; Tentzeris, M.M.; Plana, R. Novel design of a highly sensitive RF strain transducer for passive and remote sensing in two dimensions. IEEE Trans. Microw. Theory Tech. 2013, 61, 1385–1396. [Google Scholar] [CrossRef]
- Hallil, H.; Ménini, P.; Aubert, H. Novel Microwave Gas Sensor Using Dielectric Resonator with SnO2 Sensitive Layer. Procedia Chem. 2009, 1, 935–938. [Google Scholar] [CrossRef]
- Hallil, H.; Chebila, F.; Menini, P.; Aubert, H. Feasibility of passive gas sensor based on whispering gallery modes and its RADAR interrogation: Theoretical and experimental investigations. Sens. Transducers J. 2010, 116, 38–48. [Google Scholar]
- Yang, L.; Zhang, R.; Staiculescu, D.; Wong, C.P.; Tentzeris, M.M. A novel conformal RFID-enabled module utilizing inkjet-printed antennas and carbon nanotubes for gas-detection applications. IEEE Antennas Wirel. Propag. Lett. 2009, 8, 653–656. [Google Scholar] [CrossRef]
- Jatlaoui, M.M.; Chebila, F.; Idda, T.; Pons, P.; Aubert, H. Phenomenological theory and experimental characterizations of passive wireless EM pressure micro-sensor prototype. In Proceedings of the 2010 IEEE Sensors, Kona, HI, USA, 1–4 November 2010; pp. 643–646. [Google Scholar]
- Tan, Q.; Luo, T.; Wei, T.; Liu, J.; Lin, L.; Xiong, J. A wireless passive pressure and temperature sensor via dual LC resonant circuit in harsh environments. J. Microelectromech. Syst. 2017, 26, 351–356. [Google Scholar] [CrossRef]
- Jatlaoui, M.M.; Chebila, F.; Pons, P.; Aubert, H. Working Principle Description of the Wireless Passive EM Transduction Pressure Sensor. Eur. Phys. J. Appl. Phys. 2011, 56, 13702. [Google Scholar] [CrossRef]
- Huang, Q.A.; Dong, L.; Wang, L.F. LC passive wireless sensors toward a wireless sensing platform: Status, prospects, and challenges. J. Microelectromech. Syst. 2016, 25, 822–841. [Google Scholar] [CrossRef]
- Schumacher, P.; Schuster, C.; Jiménez-Sáez, A.; Schüβler, M.; Jakoby, R. Passive chipless wireless pressure sensor for Harsh and reflective environments. In Proceedings of the 2018 11th German Microwave Conference (GeMiC), Freiburg, Germany, 12–14 March 2018; pp. 227–230. [Google Scholar]
- Quintero, S.M.M.; Figueiredo, S.W.O.; Takahashi, V.L.; Llerena, R.A.W.; Braga, A.M.B. Passive downhole pressure sensor based on surface acoustic wave technology. Sensors 2017, 17, 1635. [Google Scholar] [CrossRef]
- Hotte, D.; Siragusa, R.; Duroc, Y.; Tedini, S. A concept of pressure sensor based on slotted waveguide antenna array for passive MMID sensor networks. IEEE Sens. J. 2016, 16, 5583–5587. [Google Scholar] [CrossRef]
- Ibrahim, A.; Cumming, D.R.S. Passive single chip wireless microwave pressure sensor. Sens. Actuators A Phys. 2011, 165, 200–206. [Google Scholar] [CrossRef]
- Philippe, J.; Henry, D.; De Paolis, M.V.; Rumeau, A.; Coustou, A.; Charlot, S.; Pons, P.; Aubert, H. Wireless remote monitoring of packaged passive sensor for in-situ pressure measurement in highly reflective environments. In Proceedings of the IEEE International Microwave Symposium—IMS, Philadelphia, PA, USA, 10–15 June 2018. [Google Scholar]
- Philippe, J.; De Paolis, M.V.; Arenas-Buendia, C.; Henry, D.; Coustou, A.; Rumeau, A.; Aubert, H.; Pons, P. Passive and chipless packaged transducer for wireless pressure measurement. Sens. Actuators A Phys. 2018, 279, 753–762. [Google Scholar] [CrossRef]
- Rogers, J.E.; Yoon, Y.K.; Sheplak, M.; Judy, J.W. A Passive Wireless Microelectromechanical Pressure Sensor for Harsh Environments. J. Microelectromech. Syst. 2018, 27, 73–85. [Google Scholar] [CrossRef]
- Radosavljevic, G.J.; Zivanov, L.D.; Smetana, W.; Maric, A.M.; Unger, M.; Nad, L.F. A wireless embedded resonant pressure sensor fabricated in the standard LTCC technology. IEEE Sens. J. 2009, 9, 1956–1962. [Google Scholar] [CrossRef]
- Fonseca, M.A.; English, J.M.; von Arx, M.; Allen, M.G. Wireless micromachined ceramic pressure sensor for high-temperature applications. J. Microelectromech. Syst. 2002, 11, 337–343. [Google Scholar] [CrossRef]
- Cheng, H.; Shao, G.; Ebadi, S.; Ren, X.; Harris, K.; Liu, J.; Xu, C.; An, L.; Gong, X. Evanescent-mode-resonator-based and antenna-integrated wireless passive pressure sensors for harsh-environment applications. Sens. Actuators A Phys. 2014, 220, 22–33. [Google Scholar] [CrossRef]
- Xiong, J.; Li, Y.; Hong, Y.; Zhang, B.; Cui, T.; Tan, Q.; Zheng, S.; Liang, T. Wireless LTCC-based capacitive pressure sensor for harsh environment. Sens. Actuators A Phys. 2013, 197, 30–37. [Google Scholar] [CrossRef]
- Hong, Y.; Liang, T.; Zheng, T.; Zhang, H.; Liu, W. A phase readout method for wireless passive sensor used in pressure measurement system. Chin. J. Electron. 2015, 24, 702–708. [Google Scholar] [CrossRef]
- Jatlaoui, M.M.; Chebila, F.; Pons, P.; Aubert, H. Wireless interrogation techniques for a passive pressure micro-sensor using an EM transducer. In Proceedings of the 2009 European Microwave Conference (EuMC), Rome, Italy, 29 September–1 October 2009; pp. 053–056. [Google Scholar]
- Marrocco, G.; Di Giampaolo, E.; Aliberti, R. Estimation of UHF RFID reading regions in real environments. IEEE Antennas Propag. Mag. 2009, 51, 44–57. [Google Scholar] [CrossRef]
- Kubina, B. Chipless Wireless High-Temperature Sensing in Time-Variant Environments. Ph.D. Thesis, Technische University, Darmstadt, Germany, 2017. [Google Scholar]
- Dong, L.; Wang, L.F.; Huang, Q.A. Effects of metal plane in LC passive wireless sensors. IEEE Sens. Lett. 2018, 2, 1–3. [Google Scholar] [CrossRef]
- Jacobi, R.C.; Hennig, A.; Kolossa, D. Simulation methods for inductively coupled sensor systems in varying environments. In Proceedings of the PRIME 2012 8th Conference on Ph.D. Research in Microelectronics & Electronics, Aachen, Germany, 12–15 June 2012; pp. 1–4. [Google Scholar]
- Products—ANSYS HFSS. Available online: https://www.ansys.com/products/electronics/ansys-hfss (accessed on 12 March 2019).
- Products—Chemtronics. Available online: https://www.chemtronics.com/circuitworks-silver-conductive-grease (accessed on 12 March 2019).
- Henry, D.; Pons, P.; Aubert, H. 3D scanning radar for the remote reading of passive electromagnetic sensor. In Proceedings of the 2015 IEEE MTT-S International Microwave Symposium, Phoenix, AZ, USA, 17–22 May 2015; pp. 1–4. [Google Scholar]
- Products—IMST Radar. Available online: www.radar-sensor.com/products/ (accessed on 12 March 2019).
- Products—MCLI. Available online: https://mcli.com/products/ (accessed on 12 March 2019).
- Ramachandran, P.; Varoquaux, G. Mayavi: 3D Visualization of Scientific Data. Comput. Sci. Eng. 2011, 13, 40–51. [Google Scholar] [CrossRef] [Green Version]


| Reference | Range of Applied Pressure a | EM Estimator Value of Reference | Maximum Absolute Sensitivity (Relative) b | Absolute Accuracy (Relative) c | Absolute Full-Scale Response (Relative) b | Equipment for Measuring the Device d |
|---|---|---|---|---|---|---|
| [23] | 0–3 bars | 21.633 MHz | 25.6 kHz/bar (0.12%/bar) | NR | 75 kHz (0.35%) | SA Anritsu MS620J |
| [24] | 0–2 bars | 22.68 MHz | 164 kHz/bar (0.72%/bar) | ±19 mbars (0.95%) | 0.3 MHz (1.3%) | IA HP9141A |
| [13] | 0.7–2 bars | 32.6 MHz at 400 °C | 1.96 MHz/bar (6.0%/bar) at 400 °C | ±50 mbars (3.8%) | 2.6 MHz (8.0%) at 400 °C | NA Agilent E5061B |
| [28] | 0.15–3 bars | 39.3 GHz | 370 MHz/bar (0.94%/bar) | NR | 1.1 GHz (2.8%) | VNA |
| [12] | 0–4 bars | −18.3 dBm | 0.8 dBm/bar (4.4%/bar) | NR | 4.8 dBm (26%) | FM-CW Radar |
| [17] | 0–97 bars | 434 MHz | 8.4 kHz/bar (1.9 × 10⁻³%/bar) | NR | 0.8 MHz (0.18%) | VNA Keysight E5061B |
| [19] | 0–0.8 bars | 9.61 GHz | 16 MHz/bar (0.17%/bar) | NR | 30 MHz (0.31%) | PNA Agilent E8362B |
| [22] | 0.5–8 mbars | 14.78 GHz | 2.17 GHz/bar (15%/bar) | NR | 15.4 MHz (0.10%) | NA Agilent E5071C |
| [16] | 1–2 bars | 20.53 GHz | 455 MHz/bar (2.2%/bar) | NR | 500 MHz (2.4%) | « Reader Device » |
| [25] e | 0–5.33 bars | 11.75 GHz at 800 °C | 35.88 MHz/bar (0.31%/bar) at 800 °C | NR | 180 MHz (1.5%) at 800 °C | PNA-L Agilent 40 GHz |
| [26] | 0–0.8 bars | 18.94 MHz | 0.344 MHz/bar (1.8%/bar) | NR | 0.275 MHz (1.5%) | IA Agilent E4991A |
| [27] | 1–2 bars | 22.0 MHz | 0.225 MHz/bar (1.0%/bar) | ±12 mbars (1.2%) | 0.25 MHz (1.1%) | Phase difference detector circuit |
| [20] | 0.75–2.8 bars | 23.65 GHz | 440 MHz/bar (1.9%/bar) | ±100 mbars (4.9%) | 900 MHz (3.8%) | PNA-X Agilent N5247A |
| 1.2–2.4 bars | −21.9 dB | 3.4 dB/bar (16%/bar) | NR | 4.12 dB (19%) | ||
| 0.5–2 bars | −43.9 dB | 5.7 dB/bar (13%/bar) | ±10 mbars (0.67%) | 9.1 dB (21%) | FM-CW Radar | |
| [21] | 1–2 bars | 22.95 GHz | 620 MHz/bar (2.7%/bar) | ±129 mbars (13%) | 620 MHz (2.7%) | PNA-X Agilent N5247A |
| 1–2 bars | −6.92 dB | 2.29 dB/bar (33%/bar) | NR | 2.29 dB (33%) | ||
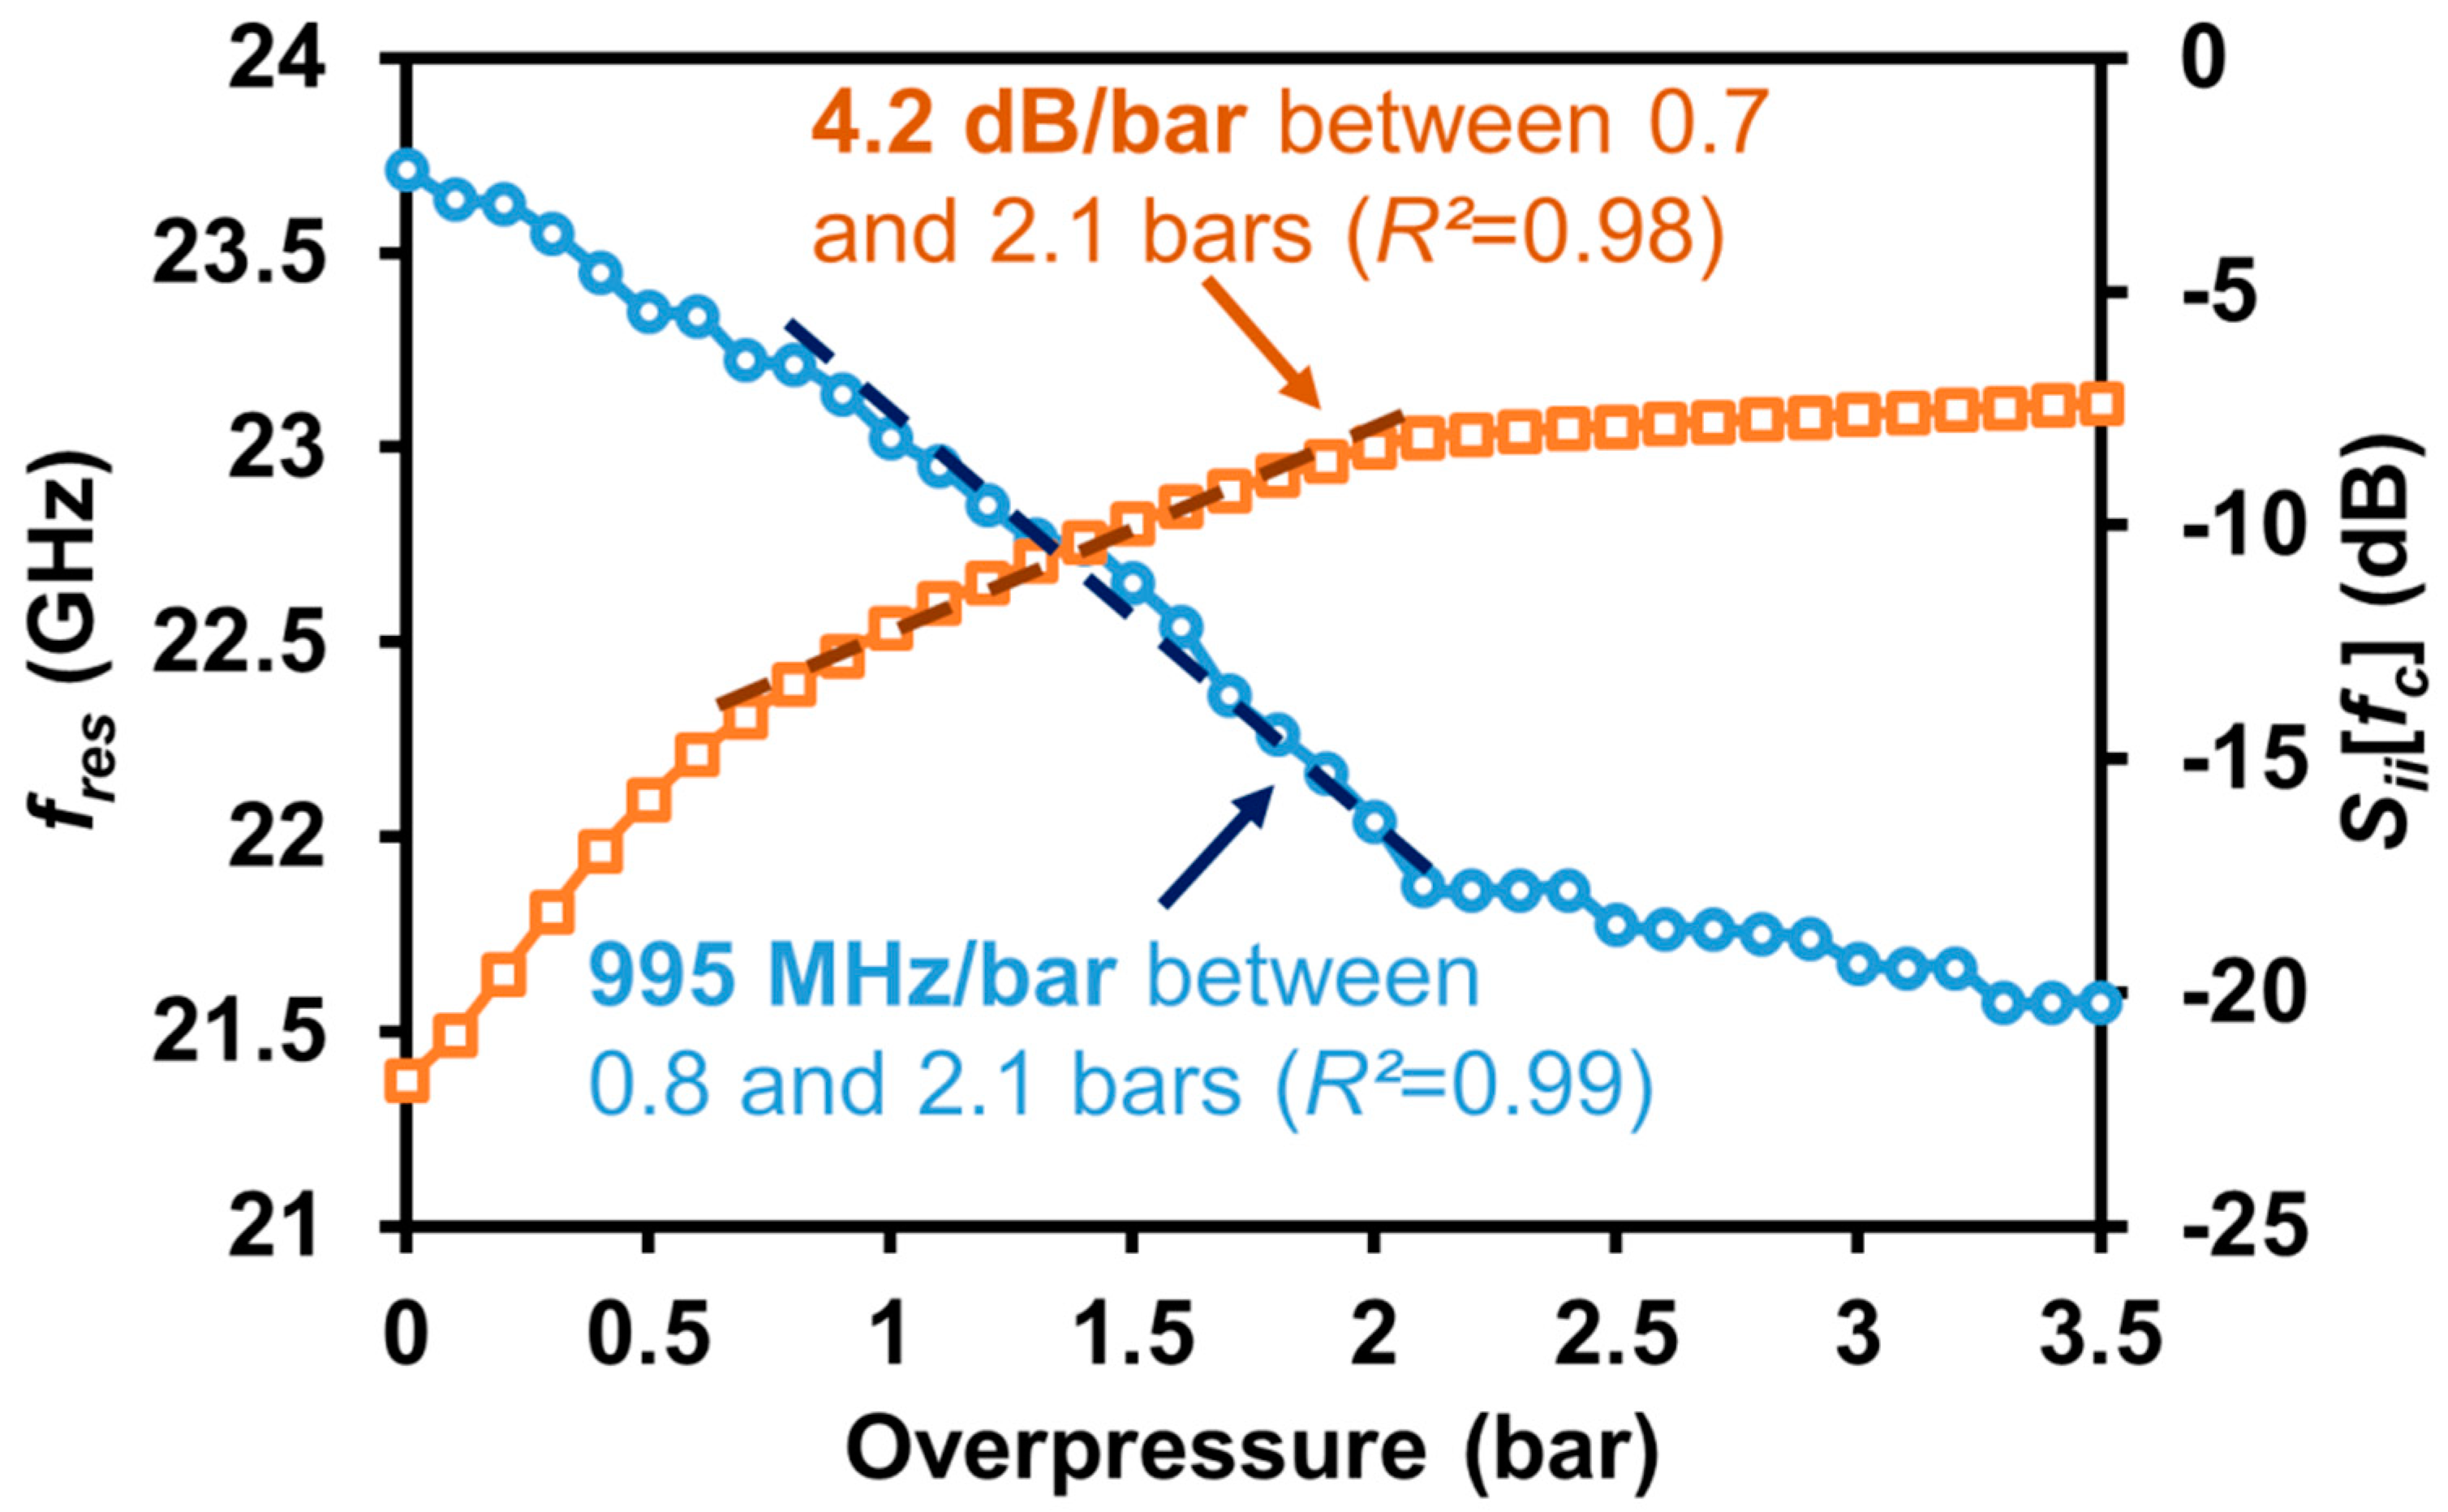
| This work | 0.8–2.1 bars | 23.65 GHz | 995 MHz/bar (4.2%/bar) | ±44 mbars (3.4%) | 1.33 GHz (5.6%) | PNA-X Agilent N5247A |
| 0.7–2.1 bars | −21.9 dB | 4.2 dB/bar (19%/bar) | ±124 mbars (8.9%) | 6.0 dB (27%) | ||
| 0.7–1.7 bars | −38 dB f | 4.9 dB/bar (13%/bar) | ±10 mbars (1.0%) | 4.9 dB (13%) | FM-CW Radar |
| Reference | Transducer | Materials * | Sensor’s Dimensions |
|---|---|---|---|
| [23] | LC resonator | Ceramic, Ag paste | 56.4 mm × 40.7 mm × 0.56 mm |
| [24] | LC resonator | Ceramic, Ag ink | 38 mm × 38 mm × 5.16 mm |
| [13] | LC resonator | Ceramic, Ag paste | 36.2 mm × 36.2 mm × 0.57 mm |
| [12,28] | Microwave resonator | Glass, Al, Si | 5.8 mm × 3.8 mm × 1.4 mm |
| [17] | SAW resonator | Ni, Cr, Steel, Quartz, Ceramic adhesive | 177 mm² × ~7 mm |
| [19] | Microwave resonator | Si, Quartz, Al | 5 mm × 4 mm × 0.3 mm |
| [22] | Capacitive sensor | Sapphire, Pt | 10 mm × 10 mm × 0.32 mm |
| [16] | Dielectric resonator | Steel, DR coated by Ni and Au | 1257 mm² × 5.5 mm |
| [25] | Evanescent-mode resonator | SiAlCN, PDC ceramic, Pt | 134 mm² × 1.8 mm |
| [26] | LC resonator | Ceramic tape, Ag paste | 26 mm × 26 mm × 0.5 mm |
| [27] | LC resonator | Alumina ceramic, Ag paste | 3.3 mm × 3.3 mm × 0.48 mm |
| [20] | Microwave resonator | Glass, Si, photoresist | 11.02 mm × 8.22 mm × 0.61 mm |
| [21] | Microwave resonator | Glass, Si, photoresist | 11.02 mm × 8.22 mm × 0.61 mm |
| This work | Microwave resonator | Glass, Si, photoresist | 11.02 mm × 8.22 mm × 0.61 mm |
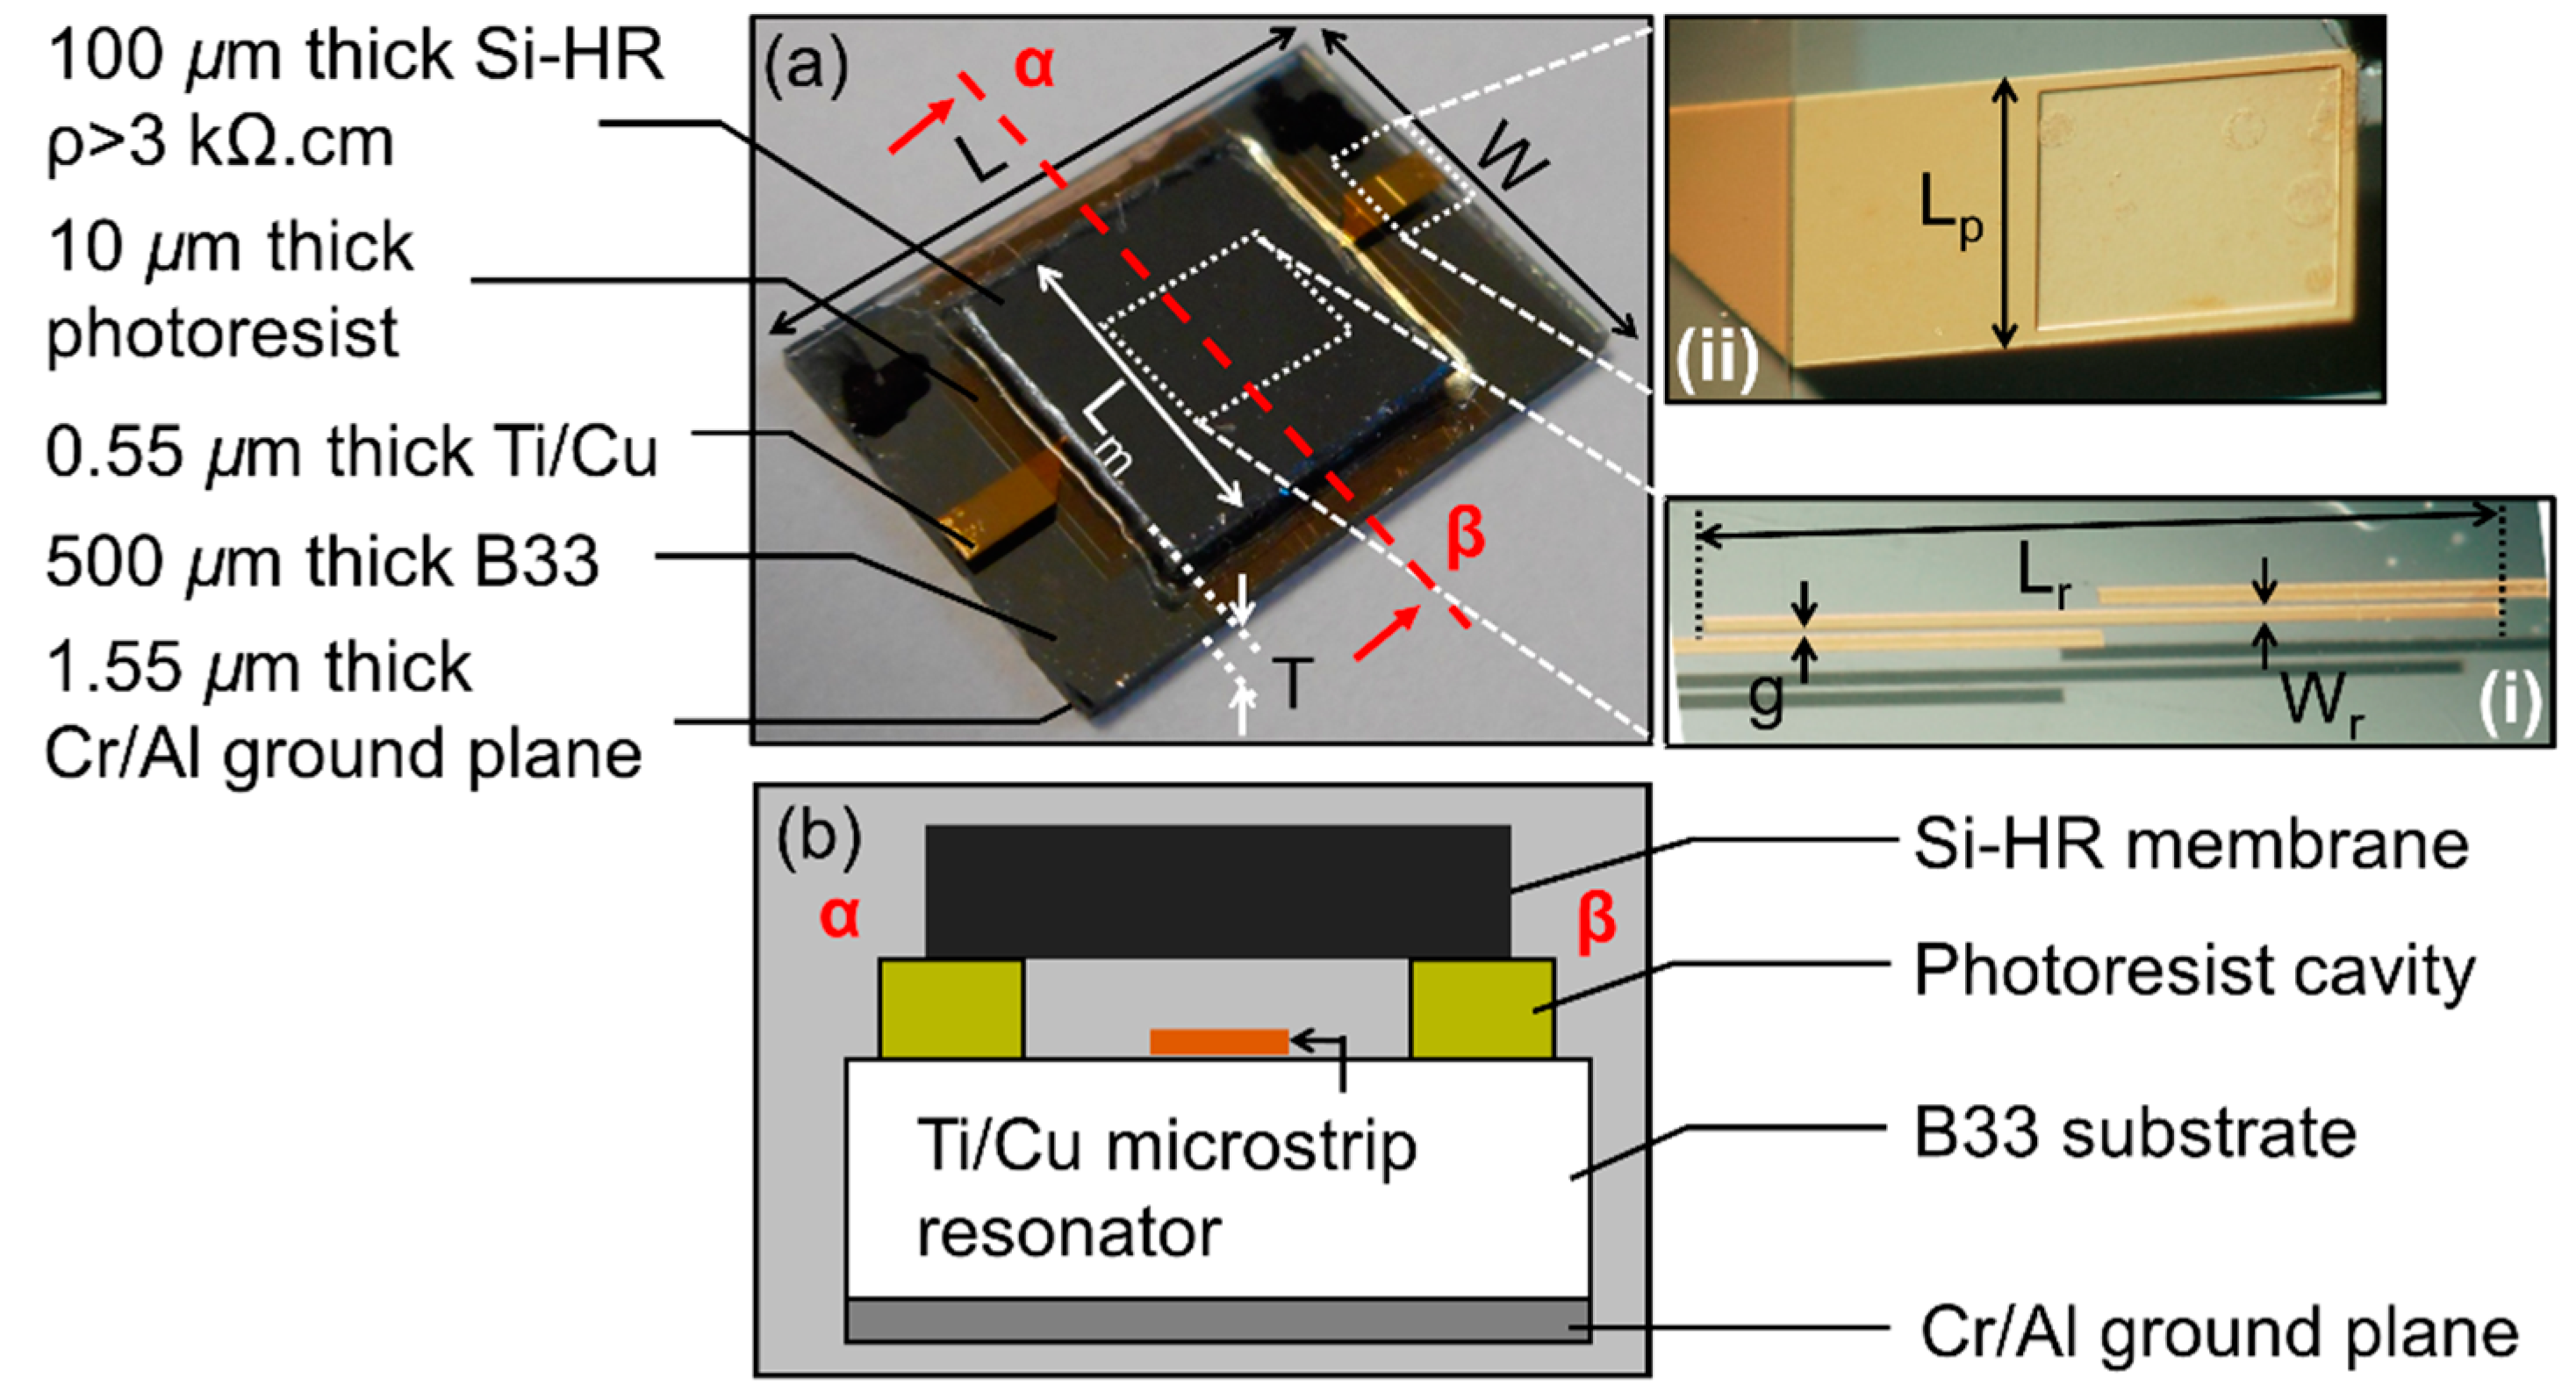
| L | W | T | Lp | Lr | Wr | g | Lm |
|---|---|---|---|---|---|---|---|
| 11.02 | 8.22 | 0.61 | 0.85 | 3.5 | 0.075 | 0.02 | 6.0 |
| Material | Relative Permittivity | Loss Tangent |
|---|---|---|
| B33 | 4.6 | 9 × 10⁻³ |
| Photoresist | 3.5 | 2 × 10⁻² |
© 2019 by the authors. Licensee MDPI, Basel, Switzerland. This article is an open access article distributed under the terms and conditions of the Creative Commons Attribution (CC BY) license (http://creativecommons.org/licenses/by/4.0/).
Share and Cite
Philippe, J.; De Paolis, M.V.; Henry, D.; Rumeau, A.; Coustou, A.; Pons, P.; Aubert, H. In-Situ Wireless Pressure Measurement Using Zero-Power Packaged Microwave Sensors. Sensors 2019, 19, 1263. https://doi.org/10.3390/s19061263
Philippe J, De Paolis MV, Henry D, Rumeau A, Coustou A, Pons P, Aubert H. In-Situ Wireless Pressure Measurement Using Zero-Power Packaged Microwave Sensors. Sensors. 2019; 19(6):1263. https://doi.org/10.3390/s19061263
Chicago/Turabian StylePhilippe, Julien, Maria Valeria De Paolis, Dominique Henry, Alexandre Rumeau, Antony Coustou, Patrick Pons, and Hervé Aubert. 2019. "In-Situ Wireless Pressure Measurement Using Zero-Power Packaged Microwave Sensors" Sensors 19, no. 6: 1263. https://doi.org/10.3390/s19061263
APA StylePhilippe, J., De Paolis, M. V., Henry, D., Rumeau, A., Coustou, A., Pons, P., & Aubert, H. (2019). In-Situ Wireless Pressure Measurement Using Zero-Power Packaged Microwave Sensors. Sensors, 19(6), 1263. https://doi.org/10.3390/s19061263