HD/FD and DF/AF with Fixed-Gain or Variable-Gain Protocol Switching Mechanism over Cooperative NOMA for Green-Wireless Networks


Faculty of Electrical Engineering and Computer Science, Technical University of Ostrava, 17. listopadu 2172/15, 708 00 Ostrava, Czech Republic
*
Author to whom correspondence should be addressed.
Sensors 2019, 19(8), 1845; https://doi.org/10.3390/s19081845
Submission received: 24 February 2019
/
Revised: 12 April 2019
/
Accepted: 15 April 2019
/
Published: 18 April 2019
(This article belongs to the Special Issue Green Wireless Networks in 5G-inspired Applications)
Abstract
:This article studied the application of multiple protocol switching mechanism (PSM) over cooperating Non-Orthogonal Multiple Access (NOMA) networks to minimize the probability of outage and maximize the system throughput and energy efficiency (EE). This study investigated six scenarios: (1) a cooperative NOMA system with half-duplex (HD) and decode-and-forward (DF) protocols at the relay; (2) a cooperative NOMA system with full-duplex (FD) and DF protocols at the relay; (3) a cooperative NOMA system with HD and amplification amplify-and-forward (AF) with fixed-gain (FG) protocols at the relay; (4) a cooperative NOMA system with HD and amplification AF with variable-gain (VG) protocols at the relay; (5) a cooperative NOMA system with FD and amplification AF with FG protocols at the relay; (6) a cooperative NOMA system with FD and amplification AF with VG protocols at the relay. Based on the results of analysis and simulations, the study determined the transmission scenario for best system performance. This paper also proposed a mechanism to switch between HD/FD and DF/AF with FG/VG protocols in order to improve the quality of service (QoS) for users with a weak conditional channel. This mechanism can be deployed in future 5G wireless network sensors. Finally, EE was also assessed in relation to future green-wireless networks (G-WNs).
1. Introduction
Given the efficiency of superior spectral sharing and the possibility for a large number of connections at the same time slot/frequency [1,2], Non-Orthogonal Multi-Access technology (NOMA) in future wireless networks (5G) could serve a large user base. NOMA’s main technology is a superimposed signal sent to all users in a network by multiplexing the channel in the same power domain, but is different in terms of power factors [3]. At each receiving terminal, the end device, which has stronger conditional channel, is allocated a lower power coefficient than other devices and performs successive interference cancellation (SIC) by treating other users’ information as interference before detecting its own information [4]. The user, which has the weakest channel condition, only has to decode its own information by applying SIC.
Some initial studies have contributed significantly to the implementation of NOMA in the future. A complete survey in the field of NOMA includes early introduction, recent technologies and future research trends, especially discussions about NOMA’s outstanding advantages over previous technologies [5]. The authors analyzed the system performance based on resource allocation [6,7]. In [6], the algorithm distributes power to users in different clusters to balance the system throughput and QoS fairness. The authors ensure fairness for users based on a reasonable allocation of power. The allocation coefficients can be allocated by the user’s channel status information (CSI) [8,9]. In another study, the authors investigated the system performance with the assumption of imperfect channel state information (CSI) over the amplify-and-forward (AF) protocol [10]. However, the authors also assumed that only a single antenna has been installed at each node. The impact of the loop interference (LI) channel generated when a relay is equipped with a twin antenna and operated in the FD protocol has therefore not been analyzed. It is a motivation for us to investigate the impact of the LI channel in the AF protocol.
Recently, relaying technology has raised much research interest as an effective solution to the fading resistance. In the cooperative NOMA model, a user with the strongest channel condition is selected as a receiving device and forwards the superimposed signals to users with weaker channel conditions. Therefore, the scope/distance of the network is expanded and the reliability of the network is enhanced by improving QoS for users [11,12,13,14,15]. In [16], the authors investigated the outage performance of the AF and decode-and-forward (DF) relaying schemes. The authors also proposed using a full-duplex (FD) protocol instead of the half-duplex (HD) protocol to avoid wasting time slots [17]. Although a cooperative NOMA network improves QoS for remote users, it also increases bandwidth costs. This problem can be solved by applying the FD relay technique. The FD relay receives and forwards a signal simultaneously in the same frequency band [18]. A disadvantage of FD relaying is the impact of the loop interference channel from its own transmitter antenna modeled as a fading channel. Loop interference channels are the main challenge in implementing FD relays [19]. The authors proposed interference cancellation techniques, including passive cancellation, active analog cancellation, and active digital cancellation [20]. Studies [21] and [22] discussed two main types of FD relay techniques, namely FD AF relaying and FD DF relaying. The authors also investigated a cognitive radio NOMA in FD/HD relay [23]. The mechanism of random switching between HD/FD relays is on transmit power adaptation [24]. Another full study on HD/FD relay DF protocol is evaluated in [25]. Taking up on previous research results, the question whether HD or FD protocol is more suitable arises. A disadvantage of FD protocol is that it is affected by the LI channel, while HD protocol does not have any LI channel. The FD protocol, however, has a better frequency efficiency than the HD protocol. This study proposes a protocol switching mechanism to effectively use the advantages of each protocol. This mechanism can be deployed as a sensor for relaying in future wireless networks. The authors also investigated the HD/FD relay and AF protocol with a fixed gain (FG) [26]. Through the results, the authors demonstrated that the NOMA system outperforms compared to orthogonal multiple access (OMA) system over the Nakagami-m fading channels. AF with a variable gain (VG) is less interesting in research because of its complexity. Last, this paper also investigated HD/FD relays not only using the AF protocol with FG but also AF with VG.
Certain studies have made significant contributions in the field of cooperative NOMA. Research results have shown that system performance can be improved by selecting the appropriate relay. Ding et al. [27] proposed a two-stage relay selection strategy that outperforms max-min relay selection. Another potential technology in the future 5G network is radio frequency energy harvesting (EH) [28]. However, the initial studies on high-power wireless power transmission show that high-power devices are potentially dangerous to health, thus inhibiting further development of wireless EH. A complete survey of the advantages of simultaneous wireless information and power transfer (SWIPT) over other wireless power transfer (WPT) techniques is in [29]. In [30], the authors surveyed most SWIPT technologies, including SWIPT enabled multi-carrier systems, full-duplex SWIPT systems, etc. Given the explosion in the number of networked devices, e.g., Internet of things (IoTs) devices, the energy issue is particularly important when it comes to research and implementation in G-WNs . A solution for simultaneous data and energy transmission is proposed in [31]. Although the wireless EH solution has not achieved practical effectiveness yet, this study suggests a solution for energy savings that can be easily deployed in applications rather than wireless EH, based on capacity surveys for the best EE of the system.
The main contributions of this study are:
- An investigation into the system performance of cooperative NOMA under six scenarios: (1) HD and DF relay; (2) FD and DF relay; (3) HD and AF with FG relay; (4) FD and AF with FG relay; (5) HD and AF with VG relay; (6) FD and AF with VG relay. The outage probability of each scenario is presented in a closed form.
- A proposal of a mechanism for switching protocols and optimizing system performance by selecting the best protocol to forward a signal to the next user.
- An investigation into the system performance on different signal-to-noise-ratios (SNRs) to find a suitable means of transmitting power to avoid wasting energy. Energy saving is required in G-WNs.
- The results coming from the analysis and simulation of outage probability, system throughput and EE are performed by Matlab (This paper used Matlab software version R2017b, made by The MathWorks, Inc., 3 Apple Hill Drive Natick, MA 01760 USA 508-647-7000) software. In addition, an algorithm used for Monte Carlo simulation is also proposed for investigating the outage probability of individual scenarios. The simulation results are used for verifying the analysis results. The figures are presented clearly and accurately in order to demonstrate our propositions.
The article is structured as follows: first, an experimental model is proposed. Next, six different scenarios are analyzed. The third section analyzes system performance on outage probability, system throughput and energy efficiency in all six proposed scenarios. In the fourth section, numerical results are presented and the figures are clearly and accurately discussed. A summary of the study is presented in the conclusions.
2. Experimental Models
In the system model (Figure 1), two users are waiting to receive the signals with the assumption that the user ’s channel is in a better condition than that of user . Both users are over Rayleigh fading channels. As has poor channel conditions, it, instead of receiving the down-link signals directly from the base station, requires a support of a relay for the relaying signals. This paper assumes that can be used as a cooperative relay. Another assumption is that can work in all six protocols: HD and DF, FD and DF, HD and AF with FG, FD and AF with FG, HD and AF with VG, FD and AF with VG. This paper analyzes all six protocols to find out the best protocol. Based on these facilities, the study proposes using a wireless sensor to switch between and select protocols to optimize the system performance.
In Figure 1, although the FD protocol can send and receive data simultaneously, an initial mixed signal is sent from the BS to the relay in the first time slot. The relay decodes the symbol and removes from the mixed signal before decoding its own symbol. The information in the symbol is then restored and forwarded to in the second time slot. However, the forwarded signal from the transmitter antenna generates a loop channel to the receiver antenna while receives another signal from the BS. Thus, the cooperative NOMA system requires two time slots to transmit a superposed signal from the BS to the second user .
2.1. First Time Slot (FTS)
According to the NOMA theory, the BS sends a superimposed signal to in the FTS expressed by
where and are in accordance with condition , and the transmission power of the BS and for is the information symbol of each user, sequentially.
Therefore, the received signal at can be expressed as:
where is denoted as the transmission channel from BS to , is the LI channel from transmitter antenna to receiver one at and is the additive white Gaussian noise (AWGN) at for with zero mean and variance . is the HD/FD switching mode with state factor. If , the relay operates in the HD mode. If , the relay operates in the FD mode.
needs two phases to decode its own information symbol. In the first phase, decodes the symbol by dealing with the symbol, the LI channel and AWGN . The signal-to-interference-plus-noise ratio (SINR) can then be expressed as:
where .
In the second phase, after has decoded the symbol, would be removed from the superimposed signal as noise. decodes its own symbol after removing by dealing with AWGN and the LI channel . SINR can then be expressed as:
The instantaneous achievable bit rate of when decodes the symbol can therefore be expressed by:
where .
2.2. Second Time Slot (STS)
In STS, will forward a mixed signal to using either the DF protocol or the AF protocol with FG or VG by the PSS.
2.2.1. DF Protocols at the Relay
Once the symbol has been decoded and removed from the superimposed signal, is restored and sent to . Therefore, will receive a signal expressed as:
where is the transmission channel from to , is the transmission power of and is the AWGN of .
decodes its own symbol by removing AWGN from the received signal. Meanwhile, SINR can be expressed by:
The instantaneous achievable bit rate of in the DF protocol is expressed as:
2.2.2. AF with FG/VG Protocols at the Relay
Where the relay uses the AF protocol, will amplify the received signal by the amplification factor , for , before forwarding the superimposed signal to .
The amplification coefficient for FG and VG, respectively, are given as follows:
where or .
Therefore, the received signal at is expressed as:
where is given by (9a) or (9b) and is given by (2).
By submitting (2) and (9a) or (9b) into (10), decodes its own symbol by removing the symbol, removing the LI channel if works in mode, removing AWGN of and removing its own AWGN . Therefore, SINR can be expressed as follows:
where is given by:
for or .
As with (8), the instantaneous bit rate threshold of in AF protocols with FG/VG can be rewritten as:
3. System Performance Analysis
Previous research results showed the feasibility of deploying a cooperative relay with HD/FD and DF protocols to resist fading. A mixed signal was transmitted through the network with the support of the HD/FD relay before reaching the N-th user [31]. However, the AF protocol is less studied than the DF protocol because of its complexity in SIC. By contrast, the authors had a full study of the AF protocol with FG [26]. Even so, it lacks a comparison to the AF protocol with VG. These research results were our motivation to seek a complete analysis and evaluation of the advantages of each protocol.
In this section, we analyze outage probability, system throughput and EE to evaluate the system performance of a cooperative NOMA system in six proposed scenarios: (1) HD and DF protocols at the relay; (2) FD and DF protocols at the relay; (3) HD and AF with FG protocols at the relay; (4) FD and AF with FG protocols at the relay; (5) HD and AF with VG protocols at the relay; (6) FD and AF with VG protocols at the relay, respectively. The article then proposes a mechanism for switching protocols to optimize the system performance.
3.1. Outage Probability
The probability density function (PDF) and cumulative distribution function (CDF) of the Rayleigh fading channel can be expressed as follows, respectively:
and
where random independent variable
Theorem 1.
The outage of signal transmission of will occur when cannot successfully decode either or symbol. Specifically, this outage will occur when there is one of the following cases:
- Case 1: The instantaneous bit rate cannot reach to the bit rate threshold , in other words .
- Case 2: The instantaneous bit rate can reach to the bit rate threshold but the instantaneous bit rate cannot reach to the bit rate threshold , in other words , and .
Ultimately, the outage probability of can be expressed as:
where is the minimum bit rate threshold of that needs to be achieved.
The expression (16) can be solved and represented in a closed form as:
where for . Where or for or , then it is paired.
For the proof of Theorem 1, see the Appendix A.
Theorem 2.
The outage of signal transmission of will occur when either or cannot successfully decode symbol. Specifically, this outage will occur when there is one of the following cases:
- Case 1: The instantaneous bit rate cannot reach the bit rate threshold , in other words .
- Case 2: The instantaneous bit rate can reach to the bit rate threshold but the instantaneous bit rate cannot reach to the bit rate threshold , in other words, , and .
Ultimately, the outage probability of can be expressed as:
3.1.1. HD and DF Protocols at the Relay ()
Remark 1.
In this scenario, is operated by HD and DF protocols. Therefore, Theorem 2 shown as (18) can be rewritten as well as solved in closed form as:
where is given by (17) for .
For the proof of Remark 1, see the Appendix A.
3.1.2. FD and DF Protocols at the Relay ()
Remark 2.
In this scenario, is operated by FD and DF protocols. Therefore, the Theorem 2 shown as (18) can be rewritten as well as solved and in closed form as:
where and are given by (17) and (19) for , respectively. If ε in (20) equals zero, (20) becomes (19).
For the proof of Remark 2, see the Appendix A.
3.1.3. HD and AF with FG Protocols at the Relay ()
Remark 3.
In this scenario, is operated by HD and AF with FG protocols. Before forwarding a signal to , amplifies the received signal shown as (2), where , by the amplification coefficient given by (9a). The outage probability of is then expressed in closed form as:
where is given by (17) for and is denoted as a modified BesselK function.
For the proof of Remark 3, see the Appendix A.
3.1.4. FD and AF with FG Protocols at the Relay ()
Remark 4.
In this scenario, is operated by FD and AF with FG protocols. Before forwarding a signal to , amplifies the received signal shown as (2), where , by the amplification coefficient given by (9a). The outage probability of is then expressed in closed form as:
where ε in (22) equals zero, (22) becomes (21).
For the proof of Remark 4, see the Appendix A.
3.1.5. HD and AF with VG Protocols at the Relay ()
Remark 5.
In this scenario, is operated by HD and AF with VG protocols. Before forwarding a signal to , amplifies the received signal shown as (2), where , by the amplification coefficient given by (9b). The outage probability of is then expressed in closed form as:
For the proof of Remark 5, see the Appendix A.
3.1.6. FD and AF with VG Protocols at the Relay ()
Remark 6.
In this scenario, is operated by FD and AF with VG protocols. Before forwarding a signal to , amplifies the received signal shown as (2), where , by the amplification coefficient given by (9b). The outage probability of is then expressed in closed form as:
where ε in (24) equals zero, (24) becomes (23).
For the proof of Remark 6, see the Appendix A.
3.2. System Throughput
The sum of achievable received data at , which is also referred to as the system throughput , is the sum of the throughput results of all in the system, expressed as:
where and .
3.3. Energy Efficiency
Technological development has significantly increased the amount of electricity consumed and seriously affected the living environment. Thus, the minimal energy consumption on every bit of data transmitted through the network is an essential requirement of next generation mobile networks. In this section, the paper evaluates the EE of each scenario:
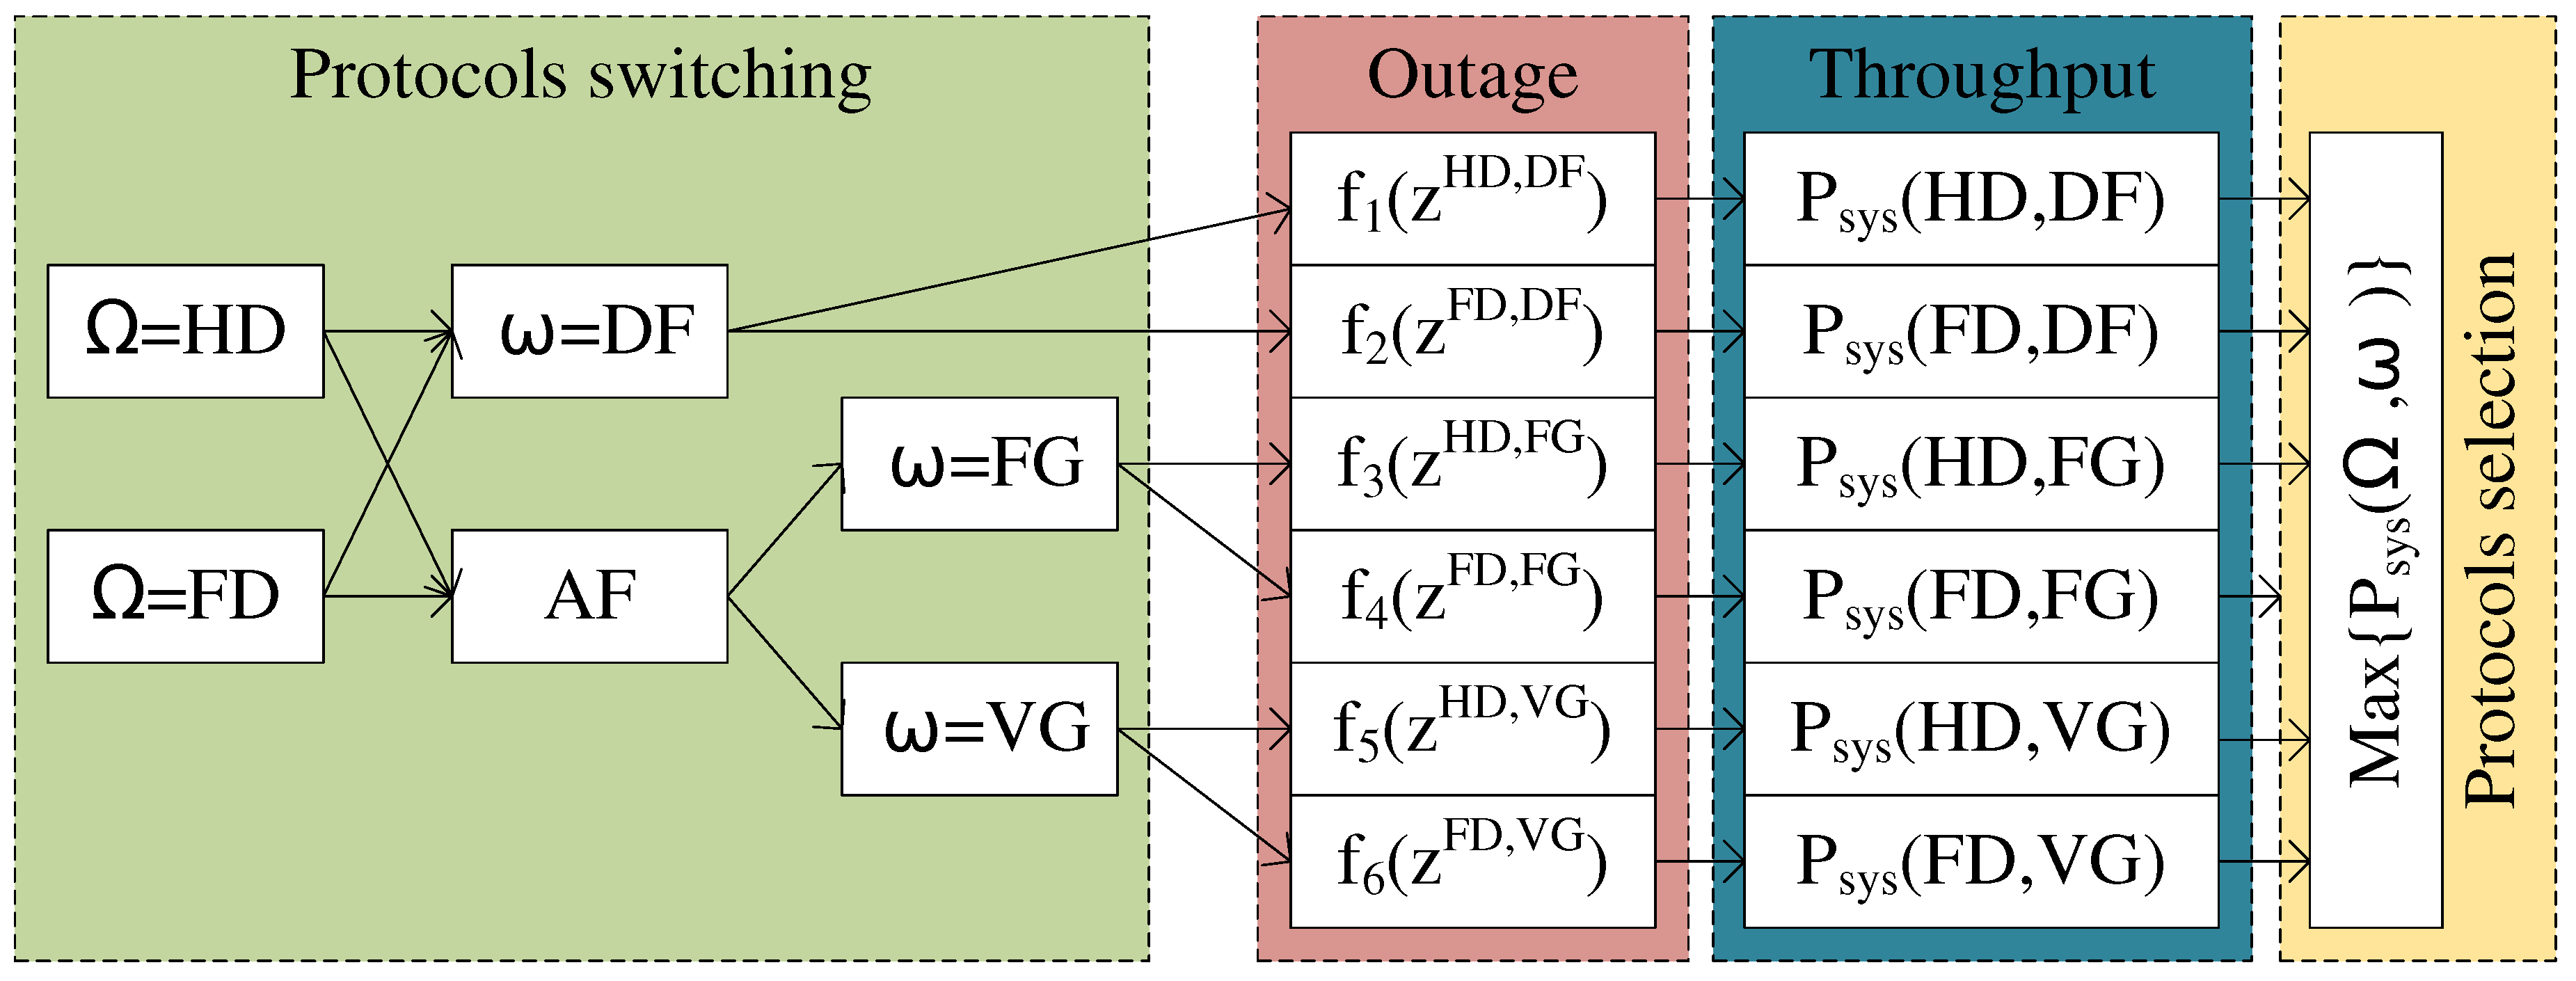
3.4. Protocol Switching Mechanism
In this section, the study proposes implementing a protocol switching mechanism. Of the six protocols analyzed above, none surpasses any of the other protocols significantly. Each protocol has its own advantages in different situations. The results of the analysis presented in the next section will demonstrate the advantages of each protocol more clearly. Therefore, it is necessary that the relay needs to be equipped with a sensor that can switch between the six protocols in order to optimize the system performance.
Figure 2 shows the mechanism of switching between protocols HD/FD and DF/AF with FG/VG. Each protocol is submitted into its corresponding analysis function. The results of the analysis are used to decide which protocol is optimal and should be applied to forward a signal to the next user at the moment of evaluation.
Proposition 1.
Investigation of the outage probability in all six scenarios by the relevant functions to select the best protocol with the lowest outage probability result in order to optimize QoS for the network users.
The minimum outage probability results in HD and DF/AF with FG/VG protocols is selected by:
and the minimum outage probability results in FD and DF/AF with FG/VG protocols is selected by:
where is given by (17) and is given by (19)–(24) for and , in pairs and respectively.
Since HD protocol is not impacted by the LI channel, is therefore obvious. The study proposes an outage threshold denoted by . The mechanism switches between HD and FD protocols as follows:
or
where (29) is for , (30) is for and is the outage threshold.
Proposition 2.
The outstanding feature of NOMA is that all users are served in the same time slot by sharing the same power domain to improve the user throughput. In this research, the mechanism switches the protocols to optimize the throughput of the cooperative NOMA system. The system performance is directly proportional to the system throughput. With a higher throughput, users can reach a higher data bit rate. The throughput results of all six scenarios of and were evaluated, and the choice of the best protocol to reach the optimal system throughput was determined as:
Proposition 3.
Given the battery capacity limitations, G-WN technology requires as little as possible energy to be spent. In this study, the EE results of all six scenarios were investigated and presented. In these results, the mechanism selects the best EE protocol for bits of data per joule (b/J) transmitted through the network considered by the as:
4. Numerical Results and Discussion
The results presented below are true and accurate to the best of our knowledge without any copying from any previous research results. This article uses the following simulation parameters as Table 1:
Note: In all figures, the markers indicate the analysis results while the solid or dashed lines indicate the Monte Carlo simulation results. The simulation results are based on the statistics of samples. Monte Carlo simulation results are used to compare and verify the analysis results. Where they are approximated together, the analysis results can be accepted. Certain previous studies included no simulation result. In this study, we propose an algorithm for Monte Carlo simulation to investigate the outage probability as Algorithm 1:

4.1. Numerical Results and Discussion for Outage Probability
The results of the first analysis enable evaluating the outage probability at in both HD and FD mode. With the same simulation parameters as in Table 1, the HD scenario yielded better outage probability results than the FD scenario. For low SNRs, the outage probability results of in HD and FD mode were approximately the same, as for instance where SNR was 0 dB. However, as SNR increased, the results of the ’s outage probability in the FD mode worsened compared to the HD mode since in the FD scenario, was affected by the LI channel from its own transmitter antenna to the receiver antenna. The impact of the LI channel became more and more powerful and affected the QoS of . However, the analysis results of still obtained good results, as shown in Figure 3.
To ensure fairness for both and , the instantaneous bit rate thresholds that must be achieved in both and for bps/Hz were selected.
Next, the outage probability of with in HD/FD mode and AF with FG/VG protocols was investigated. Figure 4a,b show the outage probability results of with in HD and FD relaying mode, respectively.
Figure 4a shows in the HD mode. At SNRs lower than 0 dB, cooperated with in HD and DF protocols, the results of which are presented as square markers, yielded a better outage probability result than the other protocols. The advantage of the DF protocol is its simplicity, and only has to decode its own information . Meanwhile works in the AF protocol with FG/VG, and decodes its own information symbol with the impact of noise and AWGNs and . As SNRs increased, the outage probability results in the AF with FG/VG protocols improved and surpassed those with the DF protocol. At low SNRs, the outage probability results of in AF with FG and AF with VG were approximately the same. As SNRs increased, AF with VG protocol surpassed AF with the FG protocol, for example at SNRs at 5 dB. However, with higher SNRs, the AF with both FG/VG converged and were better than the DF protocol. Furthermore, the outage probability results of in all the proposed scenarios with the cooperation of were better than without any relay support. These results show the effectiveness of cooperative multi-access wireless communication over the channel fading. The results also show that no protocol outperforms any other protocol. The aim of this study was to propose a protocol switching mechanism.
Figure 4b shows in the FD mode. In the DF scenario, forwards a signal as Equation (6) to . However, is affected by the LI channel from its own transmission antenna, thereby influencing the result of ’s outage probability. achieved a better outage probability result , as shown in Figure 4a,b, because of ’s cooperation and prioritized allocation of greater power factors. As a consensus, the FD and DF scenario also have outage probability results better than FD and AF with FG/VG at low SNRs, for example, at SNRs dB. However, as SNRs increased, the results of the outage probability of in AF with both FG and VG protocols improved and were better than the DF protocol. The AF protocol with VG yielded better results than the AF protocol with FG at some SNRs, for example at SNRs dB. The AF protocol with VG was better than the AF protocol with FG in both Figure 4a,b. As SNRs increased, the outage probability results of both AF with VG and AF with FG scenarios reached approximately the same results, but better than in the case of the DF protocol.
4.2. Numerical Results and Discussion for System Throughput
The achievable system throughput of all six scenarios is examined in this section. Figure 5a,b show that the DF protocol provide better throughput results than the other protocols in almost all SNRs. As the SNRs increased, the achievable throughput results of in both AF with FG and VG scenarios improved. However, an interesting observation can be made in Figure 5a,b. At some SNRs, AF with VG protocol returns better throughput results than the DF protocol, for example at SNRs dB. Finally, as SNRs keep increasing, the achievable throughput of all scenarios approximate and reach the threshold bps/Hz.
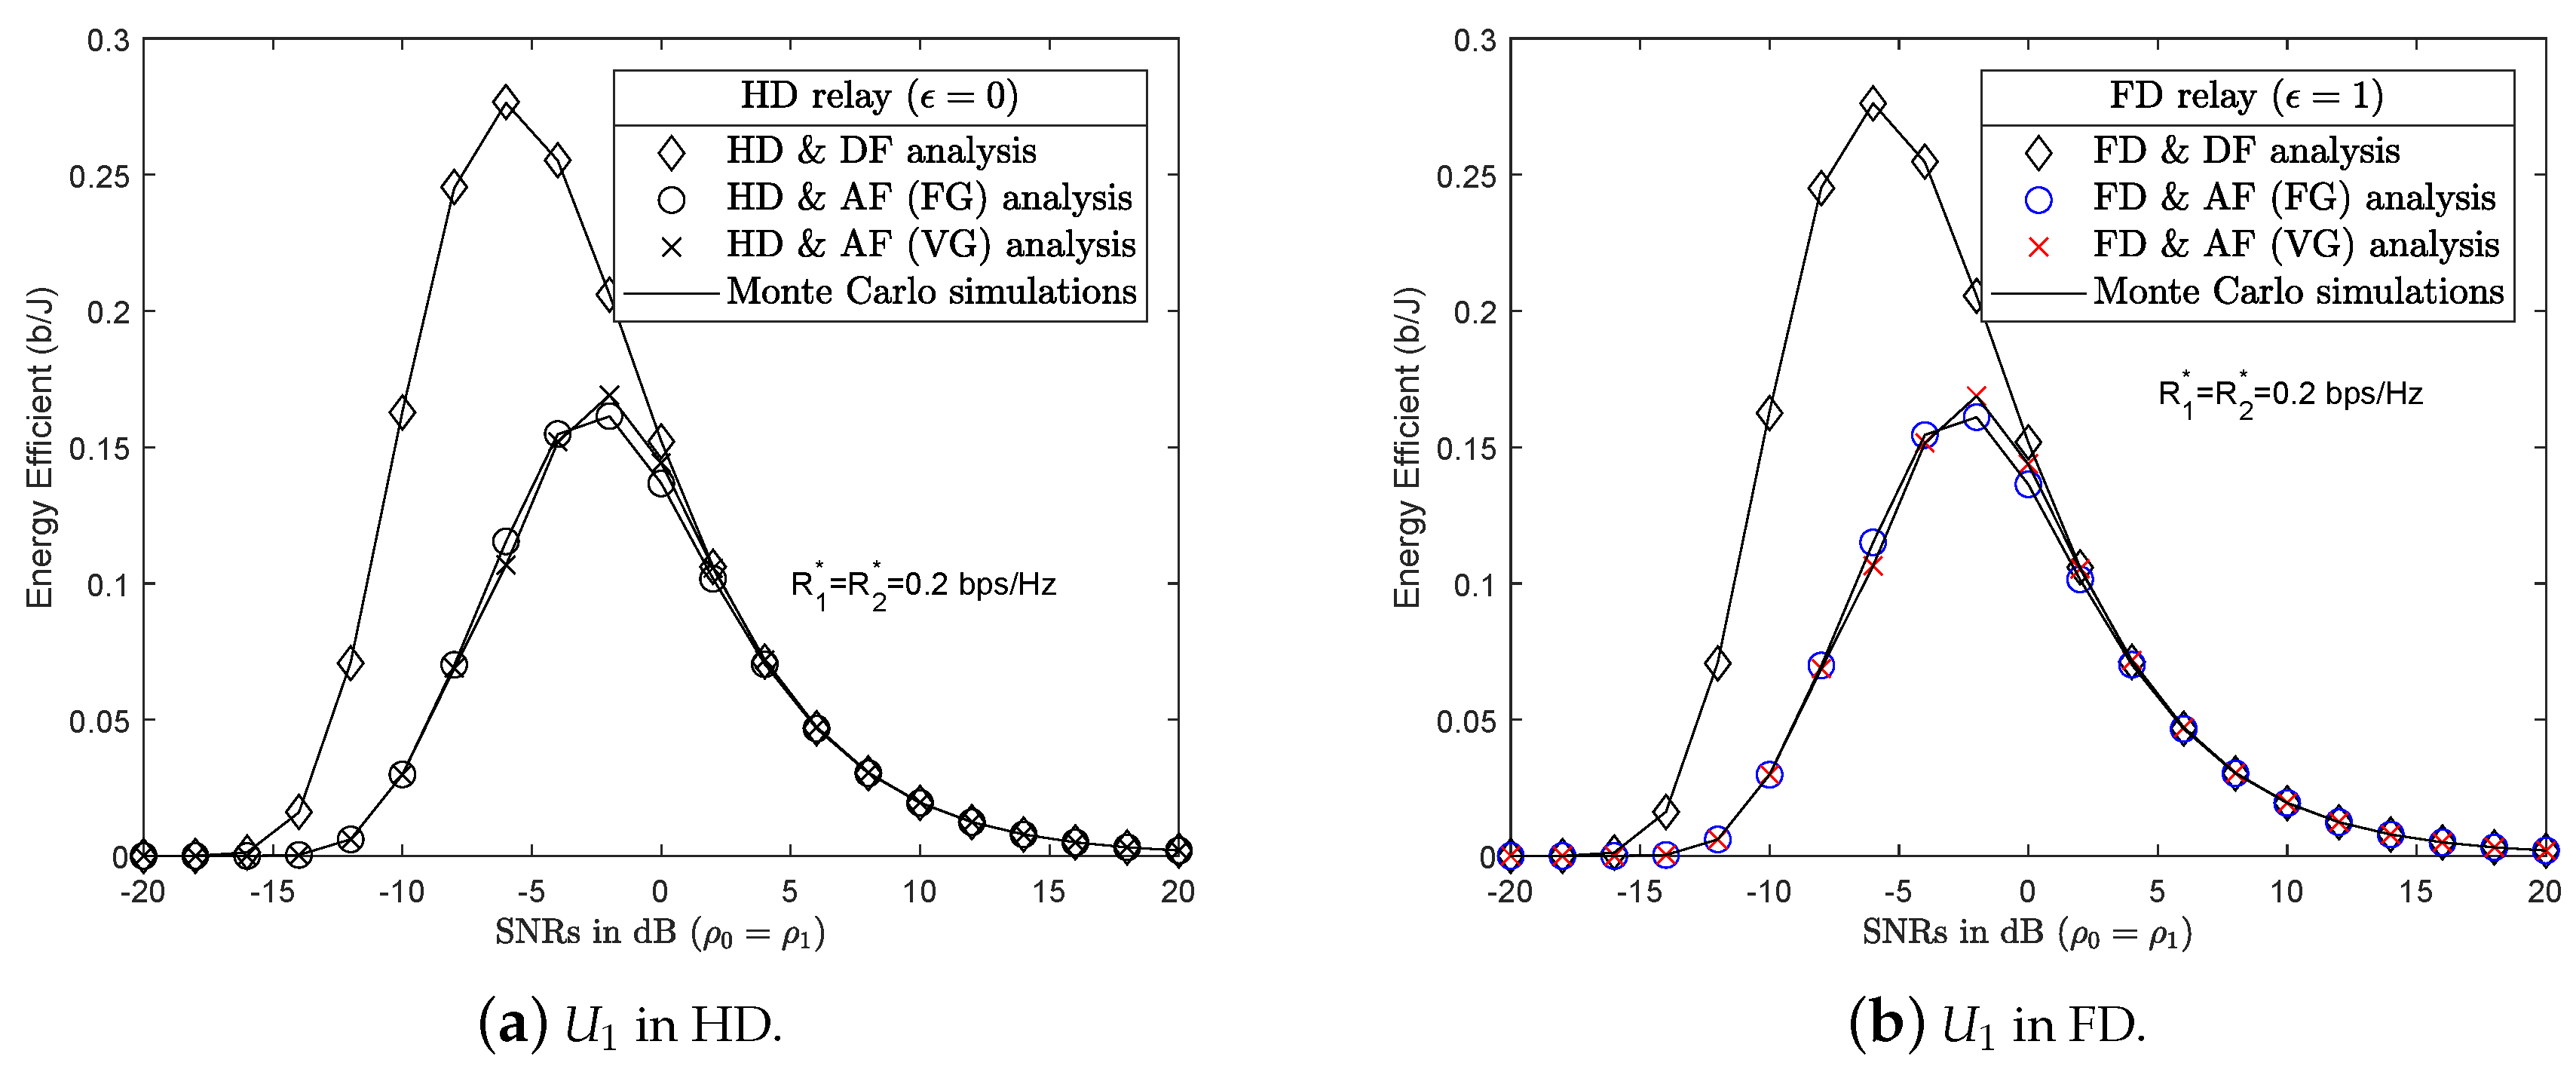
4.3. Numerical Results and Discussion for Energy Efficiency
Energy waste is a serious problem that affects the living environment. G-WNs are being studied by researchers for their environmentally friendly potential. In a G-WNs network, devices must consume the least amount of energy for the total amount of data transferred and still ensure QoS for users. This section describes the deployment of EE in wireless communications. Figure 6a,b show the impact of the incorporated EE in all six scenarios, with HD and FD Relay, respectively. At almost all SNRs, the DF protocol returned superior EE results than the AF protocol with FG/VG since the DF protocol used 100% power for forwarding the symbol without including noise, as with the AF protocol. As in previous studies, the authors often assumed that the power of the BS and relay were equal to simplify their simulations. This study, however, investigates the differing transmission powers of the BS and relay to find the optimal transmission power of the relay corresponding to the power of BS of the next section.
4.4. Protocol Switching Mechanism
In Section 3.4, a protocol switching mechanism was designed for three proposed PSSs. In this section, these PSSs will be applied in order to ascertain the best protocol.
4.4.1. PSS Based on Outage Probability
As shown in Figure 4a,b, the results of outage probability in both and effectively depend on the protocols used at corresponding to different SNRs. Therefore, the protocols were switched to ensure the best system performance as described in Proposition 1. Before the signal is forwarded to the next user, the relay pre-evaluates system performance and selects the best protocol. Figure 7 shows the outage probability results of all six scenarios. Table 2 presents the outage probability of each scenario and protocol, the minimum value (in bold font) being the best at the same SNR. The outage threshold . Meanwhile, the signal was forwarded from to with a 99.5% rate of success. At low SNRs, the outage probability result of with HD/FD and DF protocols at the relay is approximately the same, but better than other protocols at, for example, SNR dB. The simulation results were generated in Matlab simulation software and are shown in Table 2. The simulation results show that the system performance depends on the transition protocol at and the SNRs. A PSS is therefore necessary in order to select the appropriate protocol for optimal system performance. By applying (27), the PSS performed system performance evaluations in all six scenarios to select the optimal protocol for user service quality, as shown in Figure 7. Furthermore, the PSS’s outage results achieved the expected outage threshold in SNRs greater than 10 dB. SS’s outage results did not improve with increasing SNR, and were parallel with the horizon, demonstrating that, despite the increasing capacity, the system performance shall not improve. Moreover, energy is wasted.
4.4.2. PSS Based on Throughput
Figure 8 shows a comparison of the throughput achieved at in all six scenarios. The results of the analysis and simulations of all six scenarios were extracted correctly from Matlab software and presented in Table 3. The achieved throughput of all scenarios with HD or FD approximate each other, with the HD and FD protocol markers overlapping. By applying (31), the PSS evaluates the system throughput in all six scenarios in order to select the protocol with the highest system throughput, as indicated by the red-dotted line in Figure 8. At SNR = 5 dB, it can be seen that PSS selects the AF protocol with VG instead of the DF protocol.
4.4.3. PSS Based on EE
Figure 9 compares the results of EE in all six scenarios. Although was operated in HD or FD mode, the energy efficiency of these scenarios were approximately the same. The scenarios of HD/FD and DF, in pairs, had more EE results than the AF scenario with FG/VG. In the HD/FD and DF scenarios, the received signal at only had the information symbol as (6) without sharing the transmission power factor with symbol as (10). The DF protocol therefore reached higher throughput and better EE than the AF protocol at low SNRs. However, EE in all six scenarios remained approximately the same as SNRs increased.
As shown in Figure 3, Figure 4, Figure 5, Figure 6, Figure 7, Figure 8 and Figure 9, system performance was not only affected by the protocols but also the SNRs. In this section, the impact of SNRs on the system performance was researched. Instead of assuming as in previous investigations, SNRs that could be changed were evaluated. The objective of this investigation was to find the minimum pair of SNRs able to ensure the system performance. Figure 10a,b show the outage probability results of with vector and vector . For example, at SNR dB, there is no value of to ensure the system performance. Therefore, the BS must increase the . For example, at dB, the PSS assigned the value dB as an optimal pairing value. Had the system continued to increase or , the extra SNRs would have made the system performance decrease or be wasted, for example dB and dB, or dB and dB.
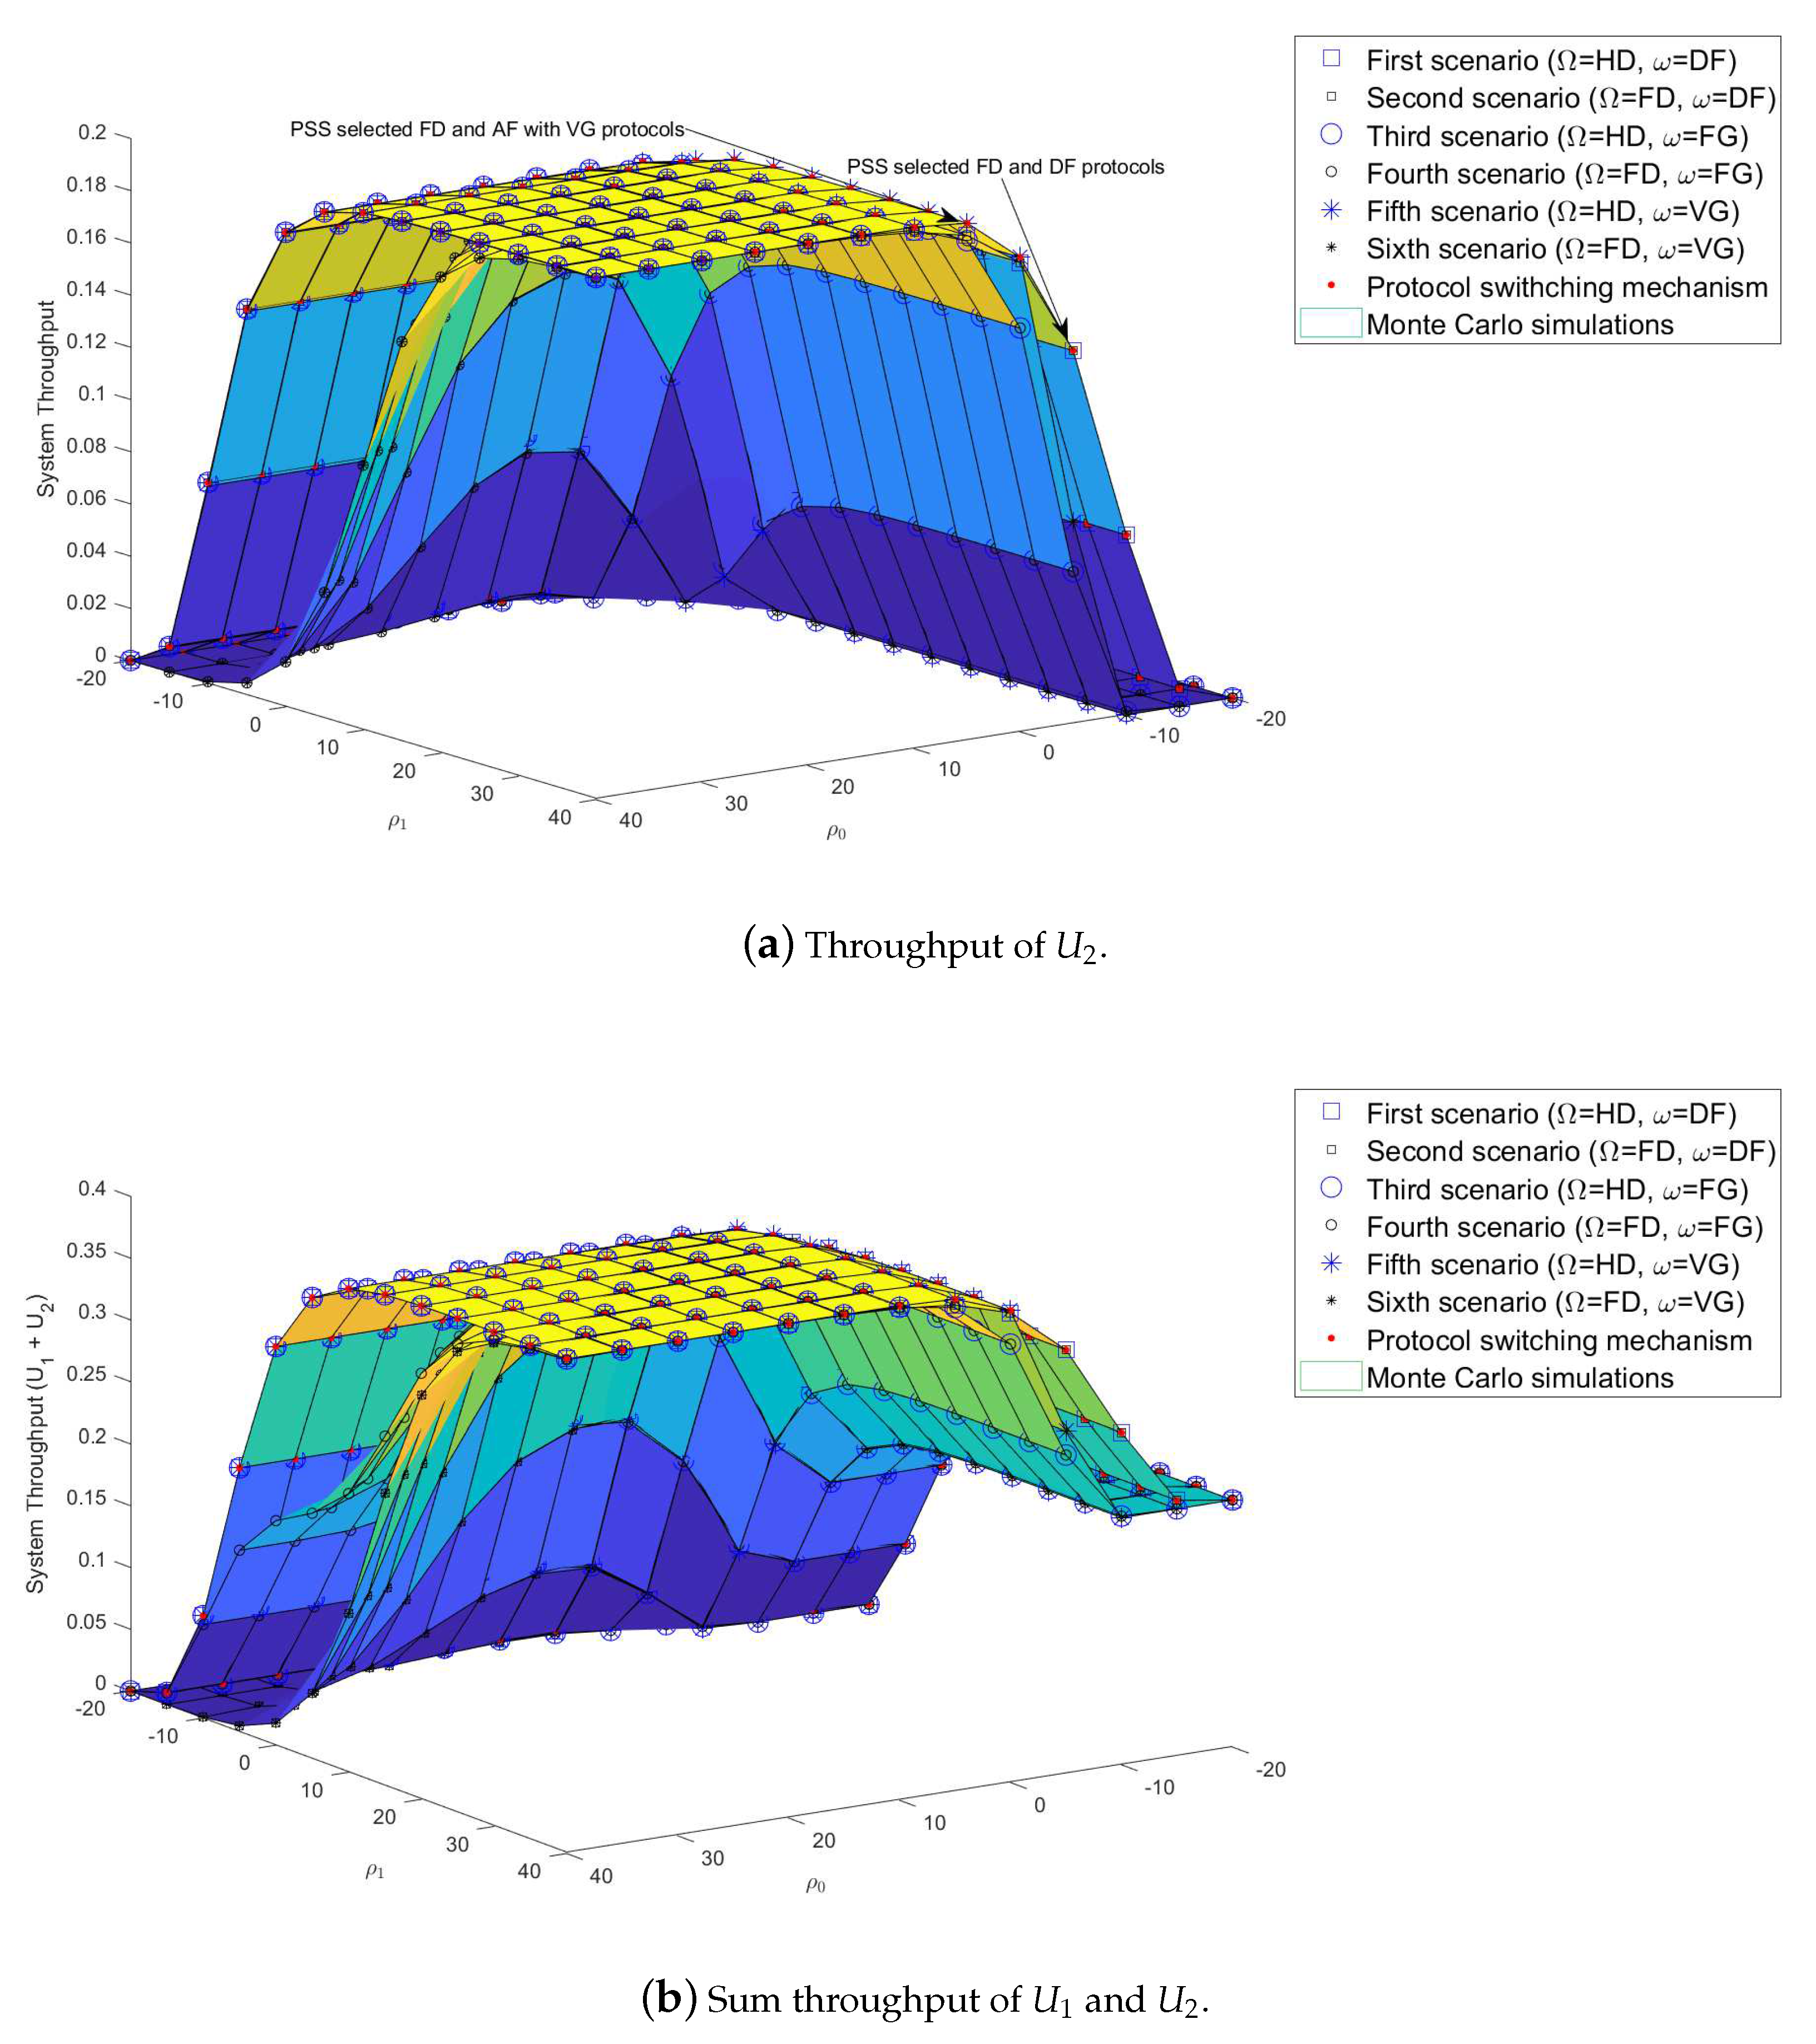
This study also examined the impact of vector and vector on the throughput of and in the six proposed scenarios as shown in Figure 11a,b. The results of examination were compared and the best protocol selected. For example, for dB and dB, the throughput of with in the HD mode was better than others. In another example, for dB and dB, the throughput results of with in HD/FD and AF with VG protocols were better than others.
5. Conclusions
In this study, six relay scenarios deployed in a cooperative NOMA system were examined. The results of examination indicate that no protocol was more appropriate than the others. At some SNRs, the DF protocol was more appropriate than the AF protocol, in particular at low SNRs. At other SNRs, the AF protocol was more appropriate than the DF protocol, in particular at high SNRs. This study therefore proposed a protocol switching mechanism to ascertain the optimal protocol for forwarding a signal to the next user in order to optimize system performance in terms of outage probability, system throughput and energy efficiency. A Monte Carlo simulation algorithm has also been proposed. The simulation results were used to verify with the analysis results presented in a closed form. These results of the analysis can be deployed for future G-WNs.
Author Contributions
T.-N.T. is the first author, who proposed the main concept, analyzed and simulated the system and presented the writing—original draft preparation, writing—review and editing and visualizations. M.V. is the second author, who is experienced in wireless communication research. He supervised, reviewed and provided the the first author with helpful comments and funding acquisition for this research. Both authors read and approved the final manuscript.
Funding
The research leading to these results has received funding from the Czech Ministry of Education, Youth and Sports under Grant No. SP2019/41 conducted at VSB-Technical University of Ostrava.
Acknowledgments
We would like to extend special thanks to the reviewers for their helpful comments and suggestions towards improving the paper’s quality.
Conflicts of Interest
We declare no conflict of interest. The funders had no role in the design of the study, in the collection, analysis and interpretation of data, in the writing of the manuscript or in the decision to publish the results.
Abbreviations
The following abbreviations are used in this manuscript:
| No. | Abbreviations | Full Description |
| 1 | AF | Amplify-and-forward |
| 2 | AWGNs | Additive white Gaussian noises |
| 3 | BS | Base station |
| 4 | CDF | Cumulative distribution function |
| 5 | CSI | Channel state information |
| 6 | DF | Decode-and-forward |
| 7 | EE | Energy efficient |
| 8 | FD | Full-duplex |
| 9 | Fig. | Figure |
| 10 | FG | Fixed gain |
| 11 | G-WNs | Green-wireless networks |
| 12 | HD | Half-duplex |
| 13 | NOMA | Non-orthogonal multiple access |
| 14 | Probability density function | |
| 15 | PSM | Protocol switching mechanism |
| 16 | PSS | Protocol switching selection |
| 17 | QoS | Quality of service |
| 18 | S | Source |
| 19 | SIC | Successive interference cancellation |
| 20 | SINR | Signal-to-interference-plus-noise ratio |
| 21 | SNR | Signal-to-noise ratio |
| 22 | The i-th user | |
| 23 | VG | Variable gain |
Appendix A
Proof of Theorem 1.
This section presents the outage probability of in HD/FD mode.
By applying (3) and (4) into (5) and combining with the conditional outage in (16), we obtain the following expression:
Similarly, in (A1) is also solved and presented as
where , then operates in the HD mode; and where , then operates in the FD mode. □
Proof of Remarks 1 and 2.
This section presents the outage probability of with in HD/FD and DF protocols.
By applying (7) into (8) and combining with the conditional outage in (19) or (20), we obtain the following expression:
where and in (A4) is given by (A3). It is not necessary to rewrite. can be solved by applying the PDF (14) as follows:
The important advantage of the DF protocol over the AF protocol is the simplicity of both calculation and simulation. □
Proof of Remark 3 and 4.
This section presents the outage probability of with in HD/FD and AF with FG protocols.
By submitting (11) for into (13) and combining with the conditional outage in (21) or (22), we obtain the following expression:
where the in (A6) is still given by (A3), and can be solved as follows:
where in both and , then operates in HD and AF with FG protocols. Where in both and , then operates in FD and AF with FG protocols. □
Proof of Remarks 5 and 6.
This section presents the outage probability of with in HD/FD and AF with VG protocols.
By submitting (11) for into (13) and combining with the conditional outage in (23) or (24), we obtain the following expression:
where is also given by (A3), and can be solved as follows:
where in both and , then operates in HD and AF with VG protocols. Where in both and , then operates in FD and AF with VG protocols.
End of proof. □
References
- Li, Q.C.; Niu, H.; Papathanassiou, A.T.; Wu, G. 5G network capacity: Key elements and technologies. IEEE Veh. Technol. Mag. 2014, 9, 71–78. [Google Scholar] [CrossRef]
- Saito, Y.; Benjebbour, A.; Kishiyama, Y.; Nakamura, T. System level performance evaluation of downlink non-orthogonal multiple access (NOMA). In Proceedings of the 2013 IEEE 24th Annual International Symposium on Personal, Indoor, and Mobile Radio Communications (PIMRC), London, UK, 8–11 September 2013; pp. 611–615. [Google Scholar]
- Ding, Z.; Yang, Z.; Fan, P.; Poor, H. On the Performance of Non-Orthogonal Multiple Access in 5G Systems with Randomly Deployed Users. IEEE Signal Process. Lett. 2014, 21, 1501–1505. [Google Scholar] [CrossRef] [Green Version]
- Higuchi, K.; Benjebbour, A. Non-orthogonal Multiple Access (NOMA) with Successive Interference Cancellation for Future Radio Access. IEICE Trans. Commun. 2015, 98, 403–414. [Google Scholar] [CrossRef]
- Dai, L.; Wang, B.; Ding, Z.; Wang, Z.; Chen, S.; Hanzo, L. A Survey of Non-Orthogonal Multiple Access for 5G. IEEE Commun. Surv. Tutor. 2018, 20, 2294–2323. [Google Scholar] [CrossRef]
- Islam, S.; Zeng, M.; Dobre, O.; Kwak, K. Resource Allocation for Downlink NOMA Systems: Key Techniques and Open Issues. IEEE Wirel. Commun. 2018, 25, 40–47. [Google Scholar] [CrossRef] [Green Version]
- Lei, L.; Yuan, D.; Ho, C.; Sun, S. Power and Channel Allocation for Non-Orthogonal Multiple Access in 5G Systems: Tractability and Computation. IEEE Trans. Wirel. Commun. 2016, 15, 8580–8594. [Google Scholar] [CrossRef]
- Wan, D.; Wen, M.; Ji, F.; Liu, Y.; Huang, Y. Cooperative NOMA Systems With Partial Channel State 527 Information Over Nakagami-m Fading Channels. IEEE Trans. Commun. 2018, 66, 947–958. [Google Scholar] [CrossRef]
- Timotheou, S.; Krikidis, I. Fairness for Non-Orthogonal Multiple Access in 5G Systems. IEEE Signal Process. Lett. 2015, 22, 1647–1651. [Google Scholar] [CrossRef] [Green Version]
- Men, J.; Ge, J.; Zhang, C. Performance Analysis for Downlink Relaying Aided Non-Orthogonal Multiple Access Networks with Imperfect CSI Over Nakagami-m Fading. IEEE Access 2017, 5, 998–1004. [Google Scholar] [CrossRef]
- Ding, Z.; Peng, M.; Poor, H.V. Cooperative non-orthogonal multiple access in 5G systems. IEEE Commun. Lett. 2015, 19, 1462–1465. [Google Scholar] [CrossRef]
- Choi, J. Non-orthogonal multiple access in downlink coordinated two point systems. IEEE Commun. Lett. 2014, 18, 313–316. [Google Scholar] [CrossRef]
- Liu, Y.; Ding, Z.; Elkashlan, M.; Poor, H.V. Cooperative nonorthogonal multiple access with simultaneous wireless information and power transfer. IEEE J. Sel. Areas Commun. 2016, 34, 938–953. [Google Scholar] [CrossRef]
- Kim, J.-B.; Lee, I.-H. Non-orthogonal multiple access in coordinated direct and relay transmission. IEEE Commun. Lett. 2015, 19, 2037–2040. [Google Scholar] [CrossRef]
- Choi, J. On the spectral efficient nonorthogonal multiple access schemes. In Proceedings of the 2016 European Conference on Networks and Communications (EuCNC), Athens, Greece, 27–30 June 2016; pp. 277–281. [Google Scholar]
- Laneman, J.N.; Tse, D.N.C.; Wornell, G.W. Cooperative diversity in wireless networks: Efficient protocols and outage behavior. IEEE Trans. Inf. Theory 2004, 50, 3062–3080. [Google Scholar] [CrossRef]
- Zhang, Z.; Ma, Z.; Xiao, M.; Ding, Z.; Fan, P. Full-duplex device-to-device aided cooperative non-orthogonal multiple access. IEEE Trans. Veh. Technol. 2019; to be published. [Google Scholar]
- Ju, H.; Oh, E.; Hong, D. Improving efficiency of resource usage in two-hop full duplex relay systems based on resource sharing and interference cancellation. IEEE Trans. Wireless Commun. 2009, 8, 3933–3938. [Google Scholar]
- Wang, Q.; Dong, Y.; Xu, X.; Tao, X. Outage probability of full-duplex AF relaying with processing delay and residual self-interference. IEEE Commun. Lett. 2015, 19, 783–786. [Google Scholar] [CrossRef]
- Zhang, Z.; Chai, X.; Long, K.; Vasilakos, A.V.; Hanzo, L. Full-duplex techniques for 5G networks: Self-interference cancellation, protocol design, and relay selection. IEEE Commun. Mag. 2015, 53, 128–137. [Google Scholar] [CrossRef]
- Osorio, D.P.M.; Olivo, E.E.B.; Alves, H.; Filho, J.C.S.S.; Latva-aho, M. Exploiting the direct link in full-duplex amplify-and-forward relaying networks. IEEE Signal Process. Lett. 2015, 22, 1766–1770. [Google Scholar] [CrossRef]
- Kwon, T.; Lim, S.; Choi, S.; Hong, D. Optimal duplex mode for DF relay in terms of the outage probability. IEEE Trans. Veh. Technol. 2010, 59, 3628–3634. [Google Scholar] [CrossRef]
- Tran, T.; Do, D.; Voznak, M. On Outage Probability and Throughput Performance of Cognitive Radio Inspired NOMA Relay System. Adv. Electr. Electron. Eng. 2018, 16. [Google Scholar] [CrossRef]
- Riihonen, T.; Werner, S.; Wichman, R. Hybrid full-duplex/half-duplex relaying with transmit power adaptation. IEEE Trans. Wireless Commun. 2011, 10, 3074–3085. [Google Scholar] [CrossRef]
- Yue, X.; Liu, Y.; Kang, S.; Nallanathan, A.; Ding, Z. Exploiting Full/Half-Duplex User Relaying in NOMA Systems. IEEE Trans. Commun. 2018, 66, 560–575. [Google Scholar] [CrossRef]
- Yue, X.; Liu, Y.; Kang, S.; Nallanathan, A. Performance Analysis of NOMA With Fixed Gain Relaying Over Nakagami-m Fading Channels. IEEE Access 2017, 5, 5445–5454. [Google Scholar] [CrossRef]
- Ding, Z.; Dai, H.; Poor, H. Relay Selection for Cooperative NOMA. IEEE Wirel. Commun. Lett. 2016, 5, 416–419. [Google Scholar] [CrossRef] [Green Version]
- Lu, X.; Wang, P.; Niyato, D.; Kim, D.I.; Han, Z. Wireless networks with RF energy harvesting: A contemporary survey. IEEE Commun. Surv. Tutor. 2015, 17, 757–789. [Google Scholar] [CrossRef]
- Perera, T.P.; Jayakody, D.; Sharma, S.; Chatzinotas, S.; Li, J. Simultaneous Wireless Information and Power Transfer (SWIPT): Recent Advances and Future Challenges. IEEE Commun. Surv. Tutor. 2018, 20, 264–302. [Google Scholar] [CrossRef]
- Tam, H.H.M.; Tuan, H.D.; Nasir, A.A.; Duong, T.Q.; Poor, H.V. MIMO energy harvesting in full-duplex multi-user networks. IEEE Trans. Wirel. Commun. 2017, 16, 3282–3297. [Google Scholar] [CrossRef]
- Tran, T.; Voznak, M. Multi-Points Cooperative Relay in NOMA System with N-1 DF Relaying Nodes in HD/FD Mode for N User Equipments with Energy Harvesting. Electronics 2019, 8, 167. [Google Scholar] [CrossRef]
Figure 1.
HD/FD and DF/AF with FG/VG relay over cooperative NOMA system.

Figure 2.
Protocol switching mechanism.

Figure 3.
Outage probability of in HD/FD mode.

Figure 4.
Outage probability of and in HD/FD and DF/AF with FG/VG protocols.

Figure 5.
System throughput of in HD/FD and DF/AF with FG and VG protocols.

Figure 6.
EE of HD/FD and DF, HD/FD and AF with FG/VG scenarios.

Figure 7.
Outage probability results of PSS.

Figure 8.
System throughput results of PSS.

Figure 9.
EE results of PSS.

Figure 10.
Impact of SNRs with ρ0 = {−20, ..., 40} and ρ1 = {−20, ..., 40}.

Figure 11.
System throughput of where ρ0 = {−20, ..., 40} and ρ1 = {−20, ..., 40}.

Figure 12.
EE results for and .


Table 1.
Simulation parameters.
| Symbols | Values | Description |
|---|---|---|
| 5 | Channel coefficient from BS to | |
| 3 | Channel coefficient from to | |
| 0.01 | Loop interference channels at | |
| 5 | Mean of channel from BS to | |
| 3 | Mean of channel from to | |
| 0.01 | Mean of loop interference channel from to | |
| 0.25 | Allocation power factor of | |
| 0.75 | Allocation power factor of | |
| 0.2 | Bit rate threshold of | |
| 0.2 | Bit rate threshold of | |
| SNRs at BS (optional) | ||
| SNRs at (optional) |
Note: This paper uses the Monte Carlo simulation method with random samples of each channel.
Table 2.
Comparison of the outage probability results.
| Protocols | –5 dB | 0 dB | 5 dB | 10 dB | 30 dB |
|---|---|---|---|---|---|
| HD and DF | 0.471831 | 0.182791 | 0.061839 | 0.019983 | 0.000201 |
| FD and DF | 0.472334 | 0.183569 | 0.062732 | 0.020917 | 0.001154 |
| HD and AF with FG | 0.894059 | 0.337188 | 0.075005 | 0.016100 | 9.6 × 10 |
| FD and AF with FG | 0.894160 | 0.337820 | 0.075887 | 0.017037 | 0.001049 |
| HD and AF with VG | 0.920599 | 0.262177 | 0.045436 | 0.010755 | 9.6 × 10 |
| FD and AF with VG | 0.920675 | 0.262880 | 0.046345 | 0.011697 | 0.001048 |
| PSS | 0.471831 | 0.182791 | 0.045436 | 0.010755 | 0.001048 |
Note: These statistical results were extracted from Matlab simulation software. The bold results are better than other results. Therefore, the corresponding protocols are selected by PSS.
Table 3.
Comparison of throughput results.
| Protocols | –5 dB | 0 dB | 5 dB | 10 dB | 30 dB |
|---|---|---|---|---|---|
| HD and DF | 0.105633 | 0.163441 | 0.187632 | 0.196003 | 0.199959 |
| FD and DF | 0.105533 | 0.163286 | 0.187453 | 0.195816 | 0.199769 |
| HD and AF with FG | 0.021188 | 0.132562 | 0.184998 | 0.196779 | 0.199980 |
| FD and AF with FG | 0.021167 | 0.132435 | 0.184822 | 0.196592 | 0.199790 |
| HD and AF with VG | 0.015880 | 0.147564 | 0.190912 | 0.197848 | 0.199980 |
| FD and AF with VG | 0.015864 | 0.147423 | 0.190730 | 0.197660 | 0.199790 |
| PSS | 0.105633 | 0.163441 | 0.190912 | 0.197848 | 0.199790 |
Note: This paper uses the Monte Carlo simulation method with iterations. The bold results are better than other results. Therefore, the corresponding protocols are selected by PSS.
© 2019 by the authors. Licensee MDPI, Basel, Switzerland. This article is an open access article distributed under the terms and conditions of the Creative Commons Attribution (CC BY) license (http://creativecommons.org/licenses/by/4.0/).
Share and Cite
MDPI and ACS Style
Tran, T.-N.; Voznak, M. HD/FD and DF/AF with Fixed-Gain or Variable-Gain Protocol Switching Mechanism over Cooperative NOMA for Green-Wireless Networks. Sensors 2019, 19, 1845. https://doi.org/10.3390/s19081845
AMA Style
Tran T-N, Voznak M. HD/FD and DF/AF with Fixed-Gain or Variable-Gain Protocol Switching Mechanism over Cooperative NOMA for Green-Wireless Networks. Sensors. 2019; 19(8):1845. https://doi.org/10.3390/s19081845
Chicago/Turabian StyleTran, Thanh-Nam, and Miroslav Voznak. 2019. "HD/FD and DF/AF with Fixed-Gain or Variable-Gain Protocol Switching Mechanism over Cooperative NOMA for Green-Wireless Networks" Sensors 19, no. 8: 1845. https://doi.org/10.3390/s19081845
Note that from the first issue of 2016, this journal uses article numbers instead of page numbers. See further details here.