The Validity of a Mixed Reality-Based Automated Functional Mobility Assessment


Abstract
1. Introduction
2. Materials and Methods
2.1. Participants
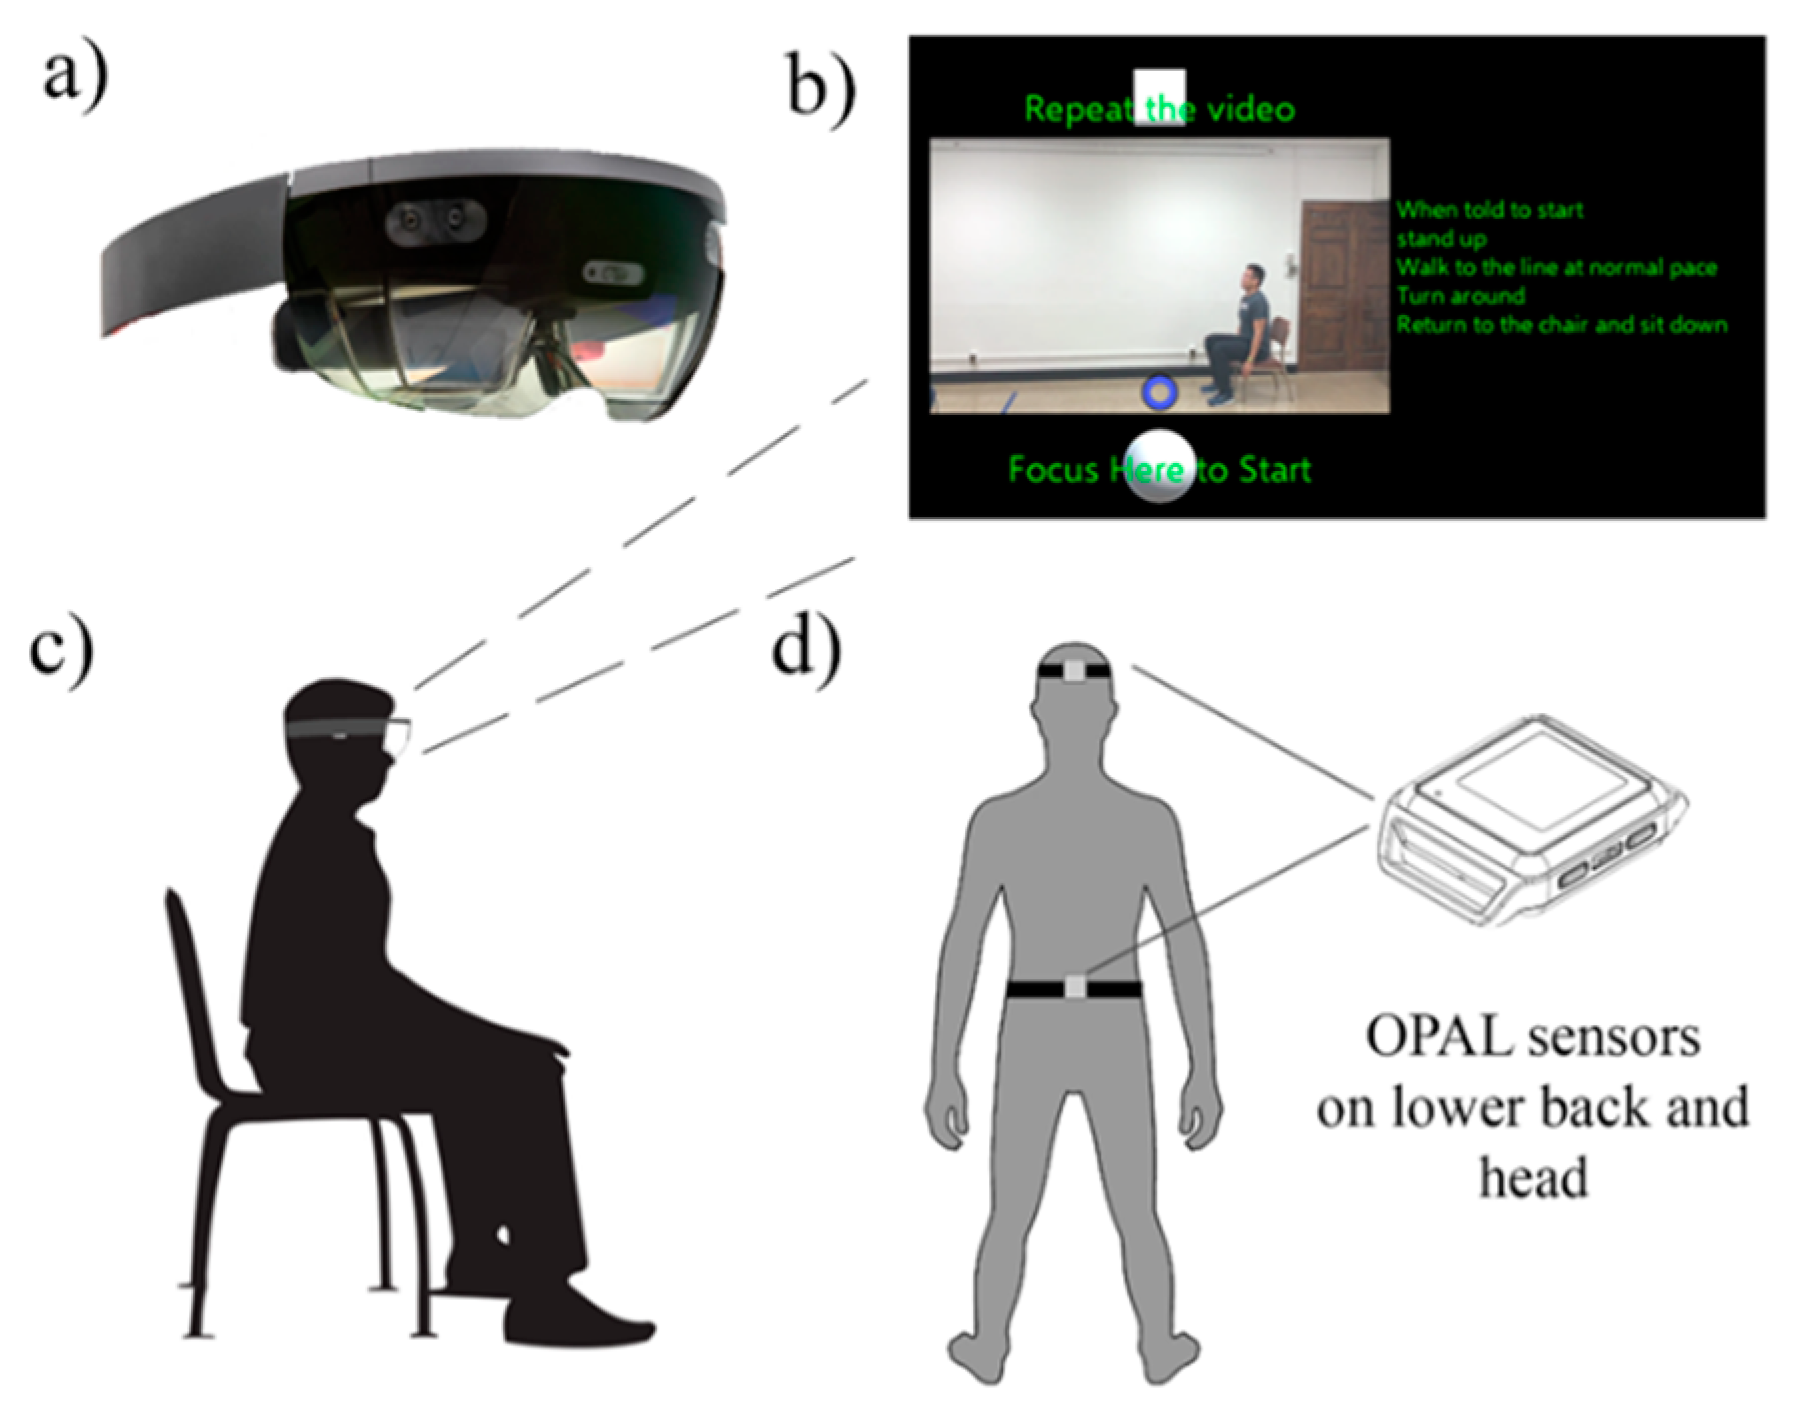
2.2. System Setup
2.3. Test Procedure
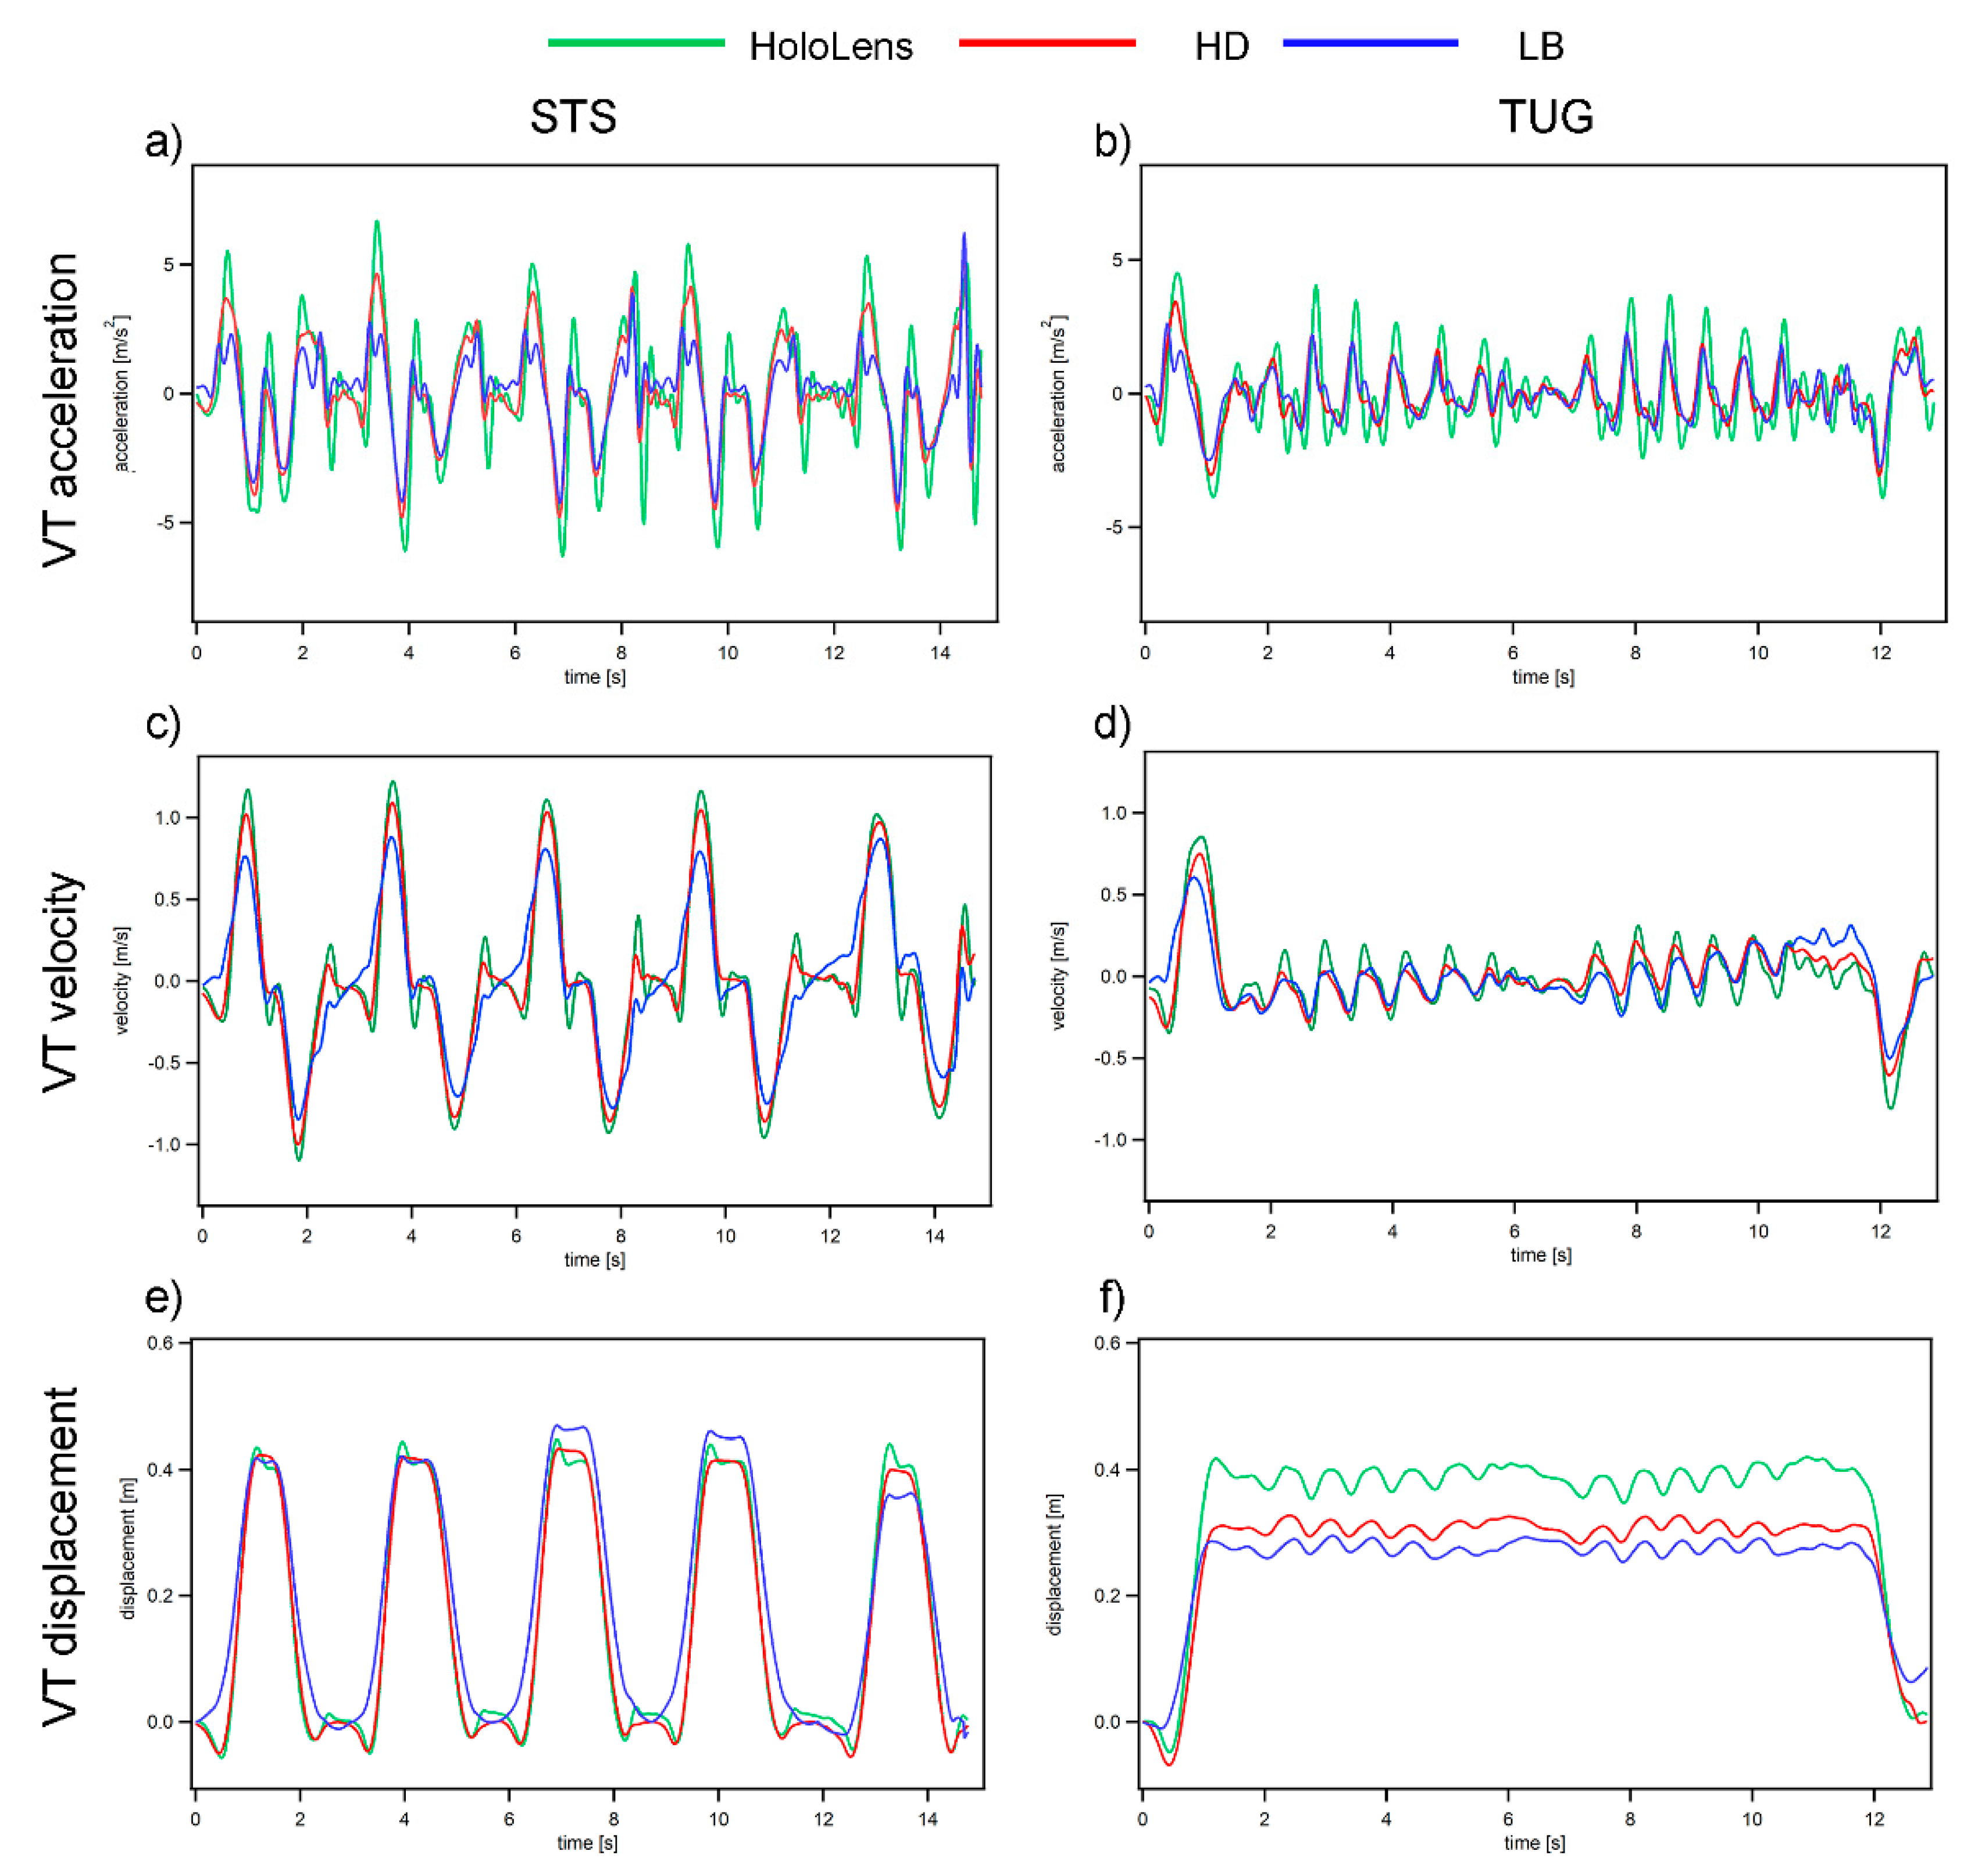
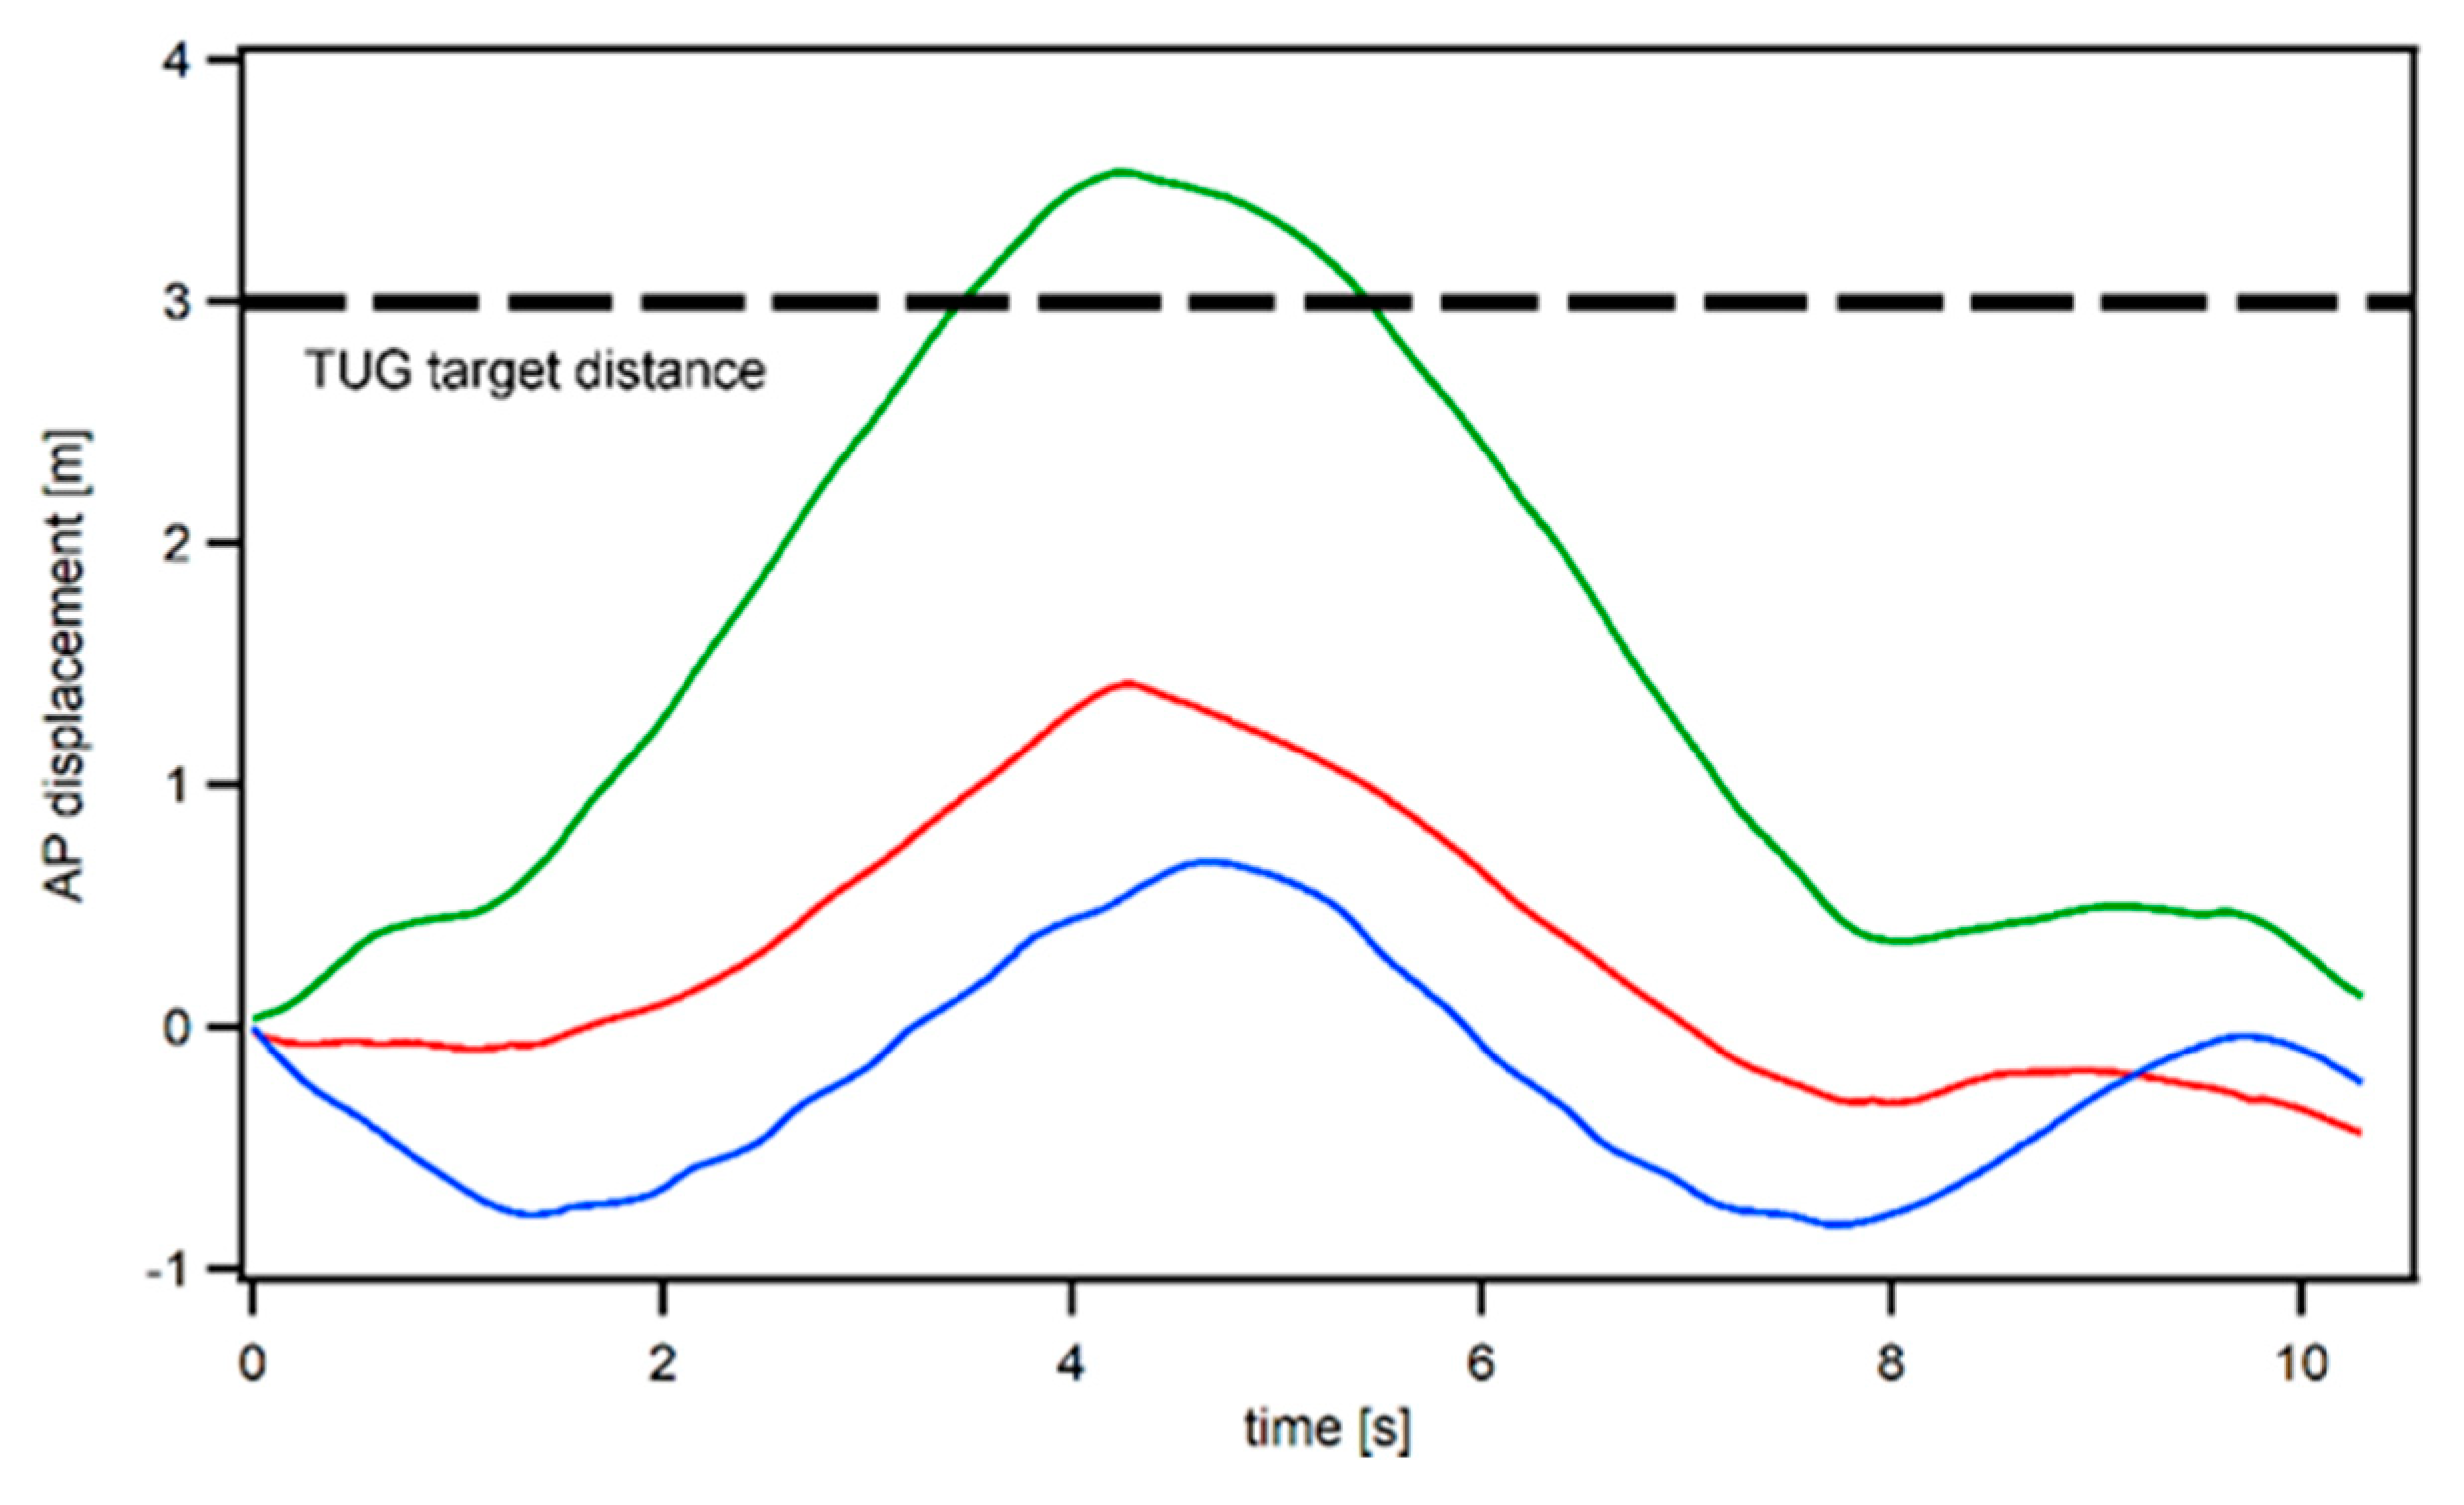
2.4. Data Processing
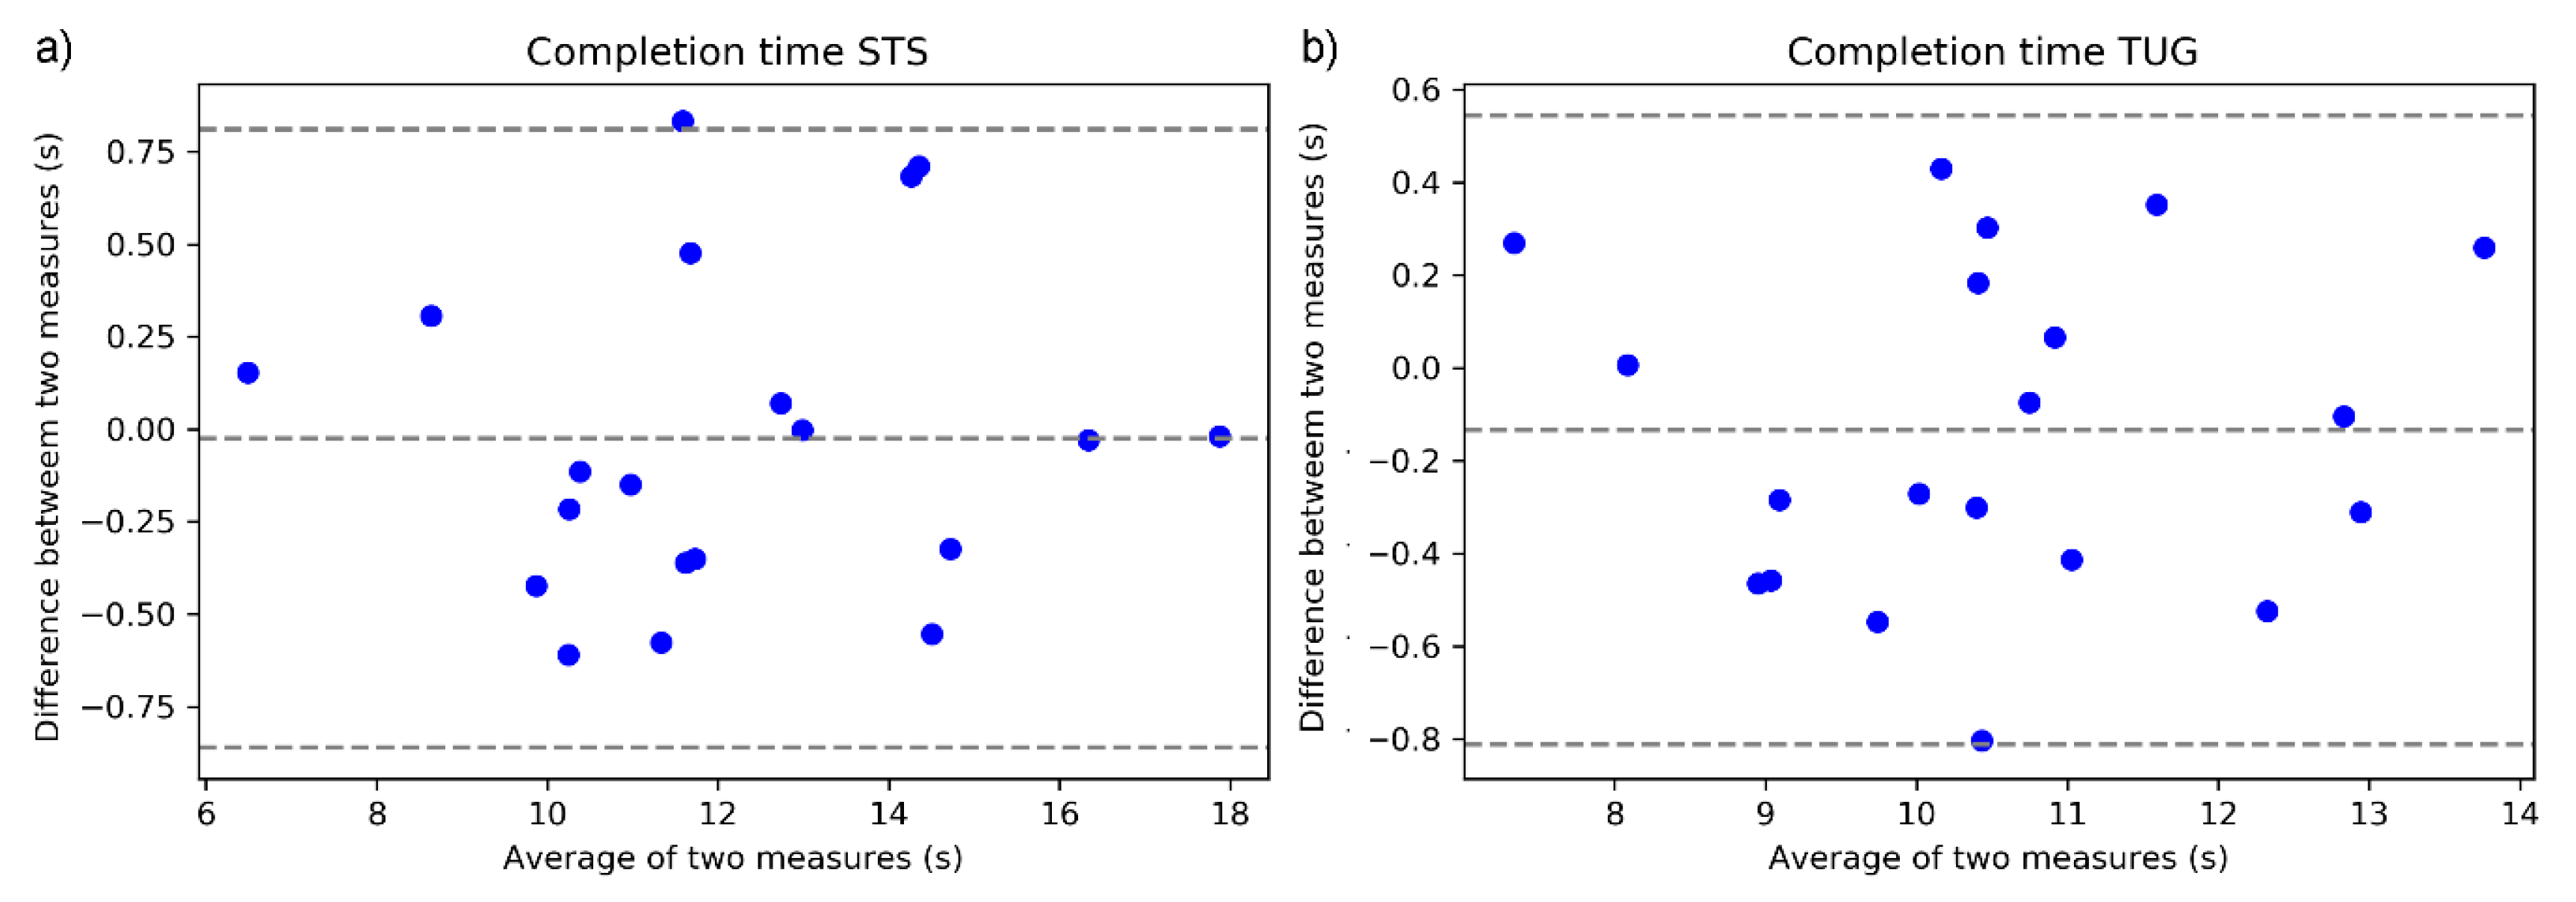
3. Results
4. Discussion
Supplementary Materials
Author Contributions
Funding
Acknowledgments
Conflicts of Interest
Abbreviations
| IMU | Inertial Measurement Unit |
| HMD | Head-mounted Display |
| MR | Mixed Reality |
| MoCA | Montreal Cognitive Assessment, |
| ABC | Activity-specific Balance Scale |
| STS | Five time Sit to Stand test |
| TUG | Timed Up and Go test |
| PPA | Physiological Profile Assessment |
| RT | Reaction Time |
| MET | Melbourne Edge Test |
| Proprio | Proprioception |
| KneeMax | Maximal isometric knee extension force |
| AP | Anterior Posterior |
| ML | Medial Lateral |
| VT | Vertical |
| OA | Older Adults |
| YA | Young Adults |
| HD | Head IMU sensor |
| LB | Lower Back IMU sensor |
| A | Acceleration |
| V | Velocity |
| D | Displacement |
| NRMSE | Normalized Root Mean Squared Error |
| Xcor | Cross Correlation Coefficient |
| ZDU | Zero Displacement Update |
References
- Rubenstein, L.Z. Falls in older people: Epidemiology, risk factors and strategies for prevention. Age Ageing 2006, 35, 37–41. [Google Scholar] [CrossRef]
- Bergen, G. Falls and Fall Injuries among Adults Aged≥ 65 Years—United States, 2014. MMWR Morb. Mortal. Wkly. Rep. 2016, 65, 993–998. [Google Scholar] [CrossRef]
- Florence, C.S.; Bergen, G.; Atherly, A.; Burns, E.; Stevens, J.; Drake, C. Medical costs of fatal and nonfatal falls in older adults. J. Am. Geriatr. Soc. 2018, 66, 693–698. [Google Scholar] [CrossRef] [PubMed]
- Ory, M.G.; Schechtman, K.B.; Miller, J.P.; Hadley, E.C.; Fiatarone, M.A.; Province, M.A.; Arfken, C.L.; Morgan, D.; Weiss, S.; Kaplan, M. Frailty and injuries in later life: The FICSIT trials. J. Am. Geriatr. Soc. 1993, 41, 283–296. [Google Scholar] [CrossRef]
- Panel on Prevention of Falls in Older Persons, American Geriatrics Society and British Geriatrics Society. Summary of the updated American Geriatrics Society/British Geriatrics Society clinical practice guideline for prevention of falls in older persons. J. Am. Geriatr. Soc. 2011, 59, 148–157. [Google Scholar] [CrossRef]
- Stevens, J.A.; Phelan, E.A. Development of STEADI: A fall prevention resource for health care providers. Health Promot. Pract. 2013, 14, 706–714. [Google Scholar] [CrossRef] [PubMed]
- Buatois, S.; Miljkovic, D.; Manckoundia, P.; Gueguen, R.; Miget, P.; Vançon, G.; Perrin, P.; Benetos, A. Five times sit to stand test is a predictor of recurrent falls in healthy community-living subjects aged 65 and older. J. Am. Geriatr. Soc. 2008, 56, 1575–1577. [Google Scholar] [CrossRef]
- Shumway-Cook, A.; Brauer, S.; Woollacott, M. Predicting the probability for falls in community-dwelling older adults using the Timed Up & Go Test. Phys. Ther. 2000, 80, 896–903. [Google Scholar]
- Sun, R.; Sosnoff, J.J. Novel sensing technology in fall risk assessment in older adults: A systematic review. BMC Geriatr. 2018, 18, 14. [Google Scholar] [CrossRef]
- Shany, T.; Wang, K.; Liu, Y.; Lovell, N.H.; Redmond, S.J. Are we stumbling in our quest to find the best predictor? Over-optimism in sensor-based models for predicting falls in older adults. Healthc. Technol. Lett. 2015, 2, 79–88. [Google Scholar] [CrossRef]
- Shany, T.; Redmond, S.; Marschollek, M.; Lovell, N. Assessing fall risk using wearable sensors: A practical discussion. Zeitschrift für Gerontologie und Geriatrie 2012, 45, 694–706. [Google Scholar]
- Howcroft, J.; Kofman, J.; Lemaire, E.D. Review of fall risk assessment in geriatric populations using inertial sensors. J. Neuroeng. Rehabil. 2013, 10, 91. [Google Scholar]
- Hsieh, K.L.; Fanning, J.T.; Rogers, W.A.; Wood, T.A.; Sosnoff, J.J. A Fall Risk mHealth App for Older Adults: Development and Usability Study. JMIR Aging 2018, 1, e11569. [Google Scholar] [CrossRef]
- Hsieh, K.L.; Roach, K.L.; Wajda, D.A.; Sosnoff, J.J. Smartphone technology can measure postural stability and discriminate fall risk in older adults. Gait Posture 2019, 67, 160–165. [Google Scholar] [CrossRef]
- Kress, B.C.; Cummings, W.J. 11-1: Invited Paper: Towards the Ultimate Mixed Reality Experience: HoloLens Display Architecture Choices; SID Symposium Digest of Technical Papers, 2017; Wiley Online Library: Hoboken, NJ, USA, 2017; pp. 127–131. [Google Scholar]
- Menz, H.B.; Lord, S.R.; Fitzpatrick, R.C. Acceleration patterns of the head and pelvis when walking on level and irregular surfaces. Gait Posture 2003, 18, 35–46. [Google Scholar] [CrossRef]
- Psarakis, M.; Greene, D.A.; Cole, M.H.; Lord, S.R.; Hoang, P.; Brodie, M. Wearable technology reveals gait compensations, unstable walking patterns and fatigue in people with multiple sclerosis. Physiol. Meas. 2018, 39, 075004. [Google Scholar] [CrossRef] [PubMed]
- Millor, N.; Lecumberri, P.; Gómez, M.; Martínez-Ramírez, A.; Izquierdo, M. Drift-free position estimation for periodic movements using inertial units. IEEE J. Biomed. Health Inform. 2014, 18, 1131–1137. [Google Scholar] [CrossRef]
- Walgaard, S.; Faber, G.S.; van Lummel, R.C.; van Dieën, J.H.; Kingma, I. The validity of assessing temporal events, sub-phases and trunk kinematics of the sit-to-walk movement in older adults using a single inertial sensor. J. Biomech. 2016, 49, 1933–1937. [Google Scholar] [CrossRef] [PubMed]
- Bohannon, R.W. Sit-to-stand test for measuring performance of lower extremity muscles. Percept. Mot. Ski. 1995, 80, 163–166. [Google Scholar] [CrossRef]
- Jones, C.J.; Rikli, R.E.; Beam, W.C. A 30-s chair-stand test as a measure of lower body strength in community-residing older adults. Res. Q. Exerc. Sport 1999, 70, 113–119. [Google Scholar] [CrossRef]
- Lord, S.R.; Menz, H.B.; Tiedemann, A. A physiological profile approach to falls risk assessment and prevention. Phys. Ther. 2003, 83, 237–252. [Google Scholar]
- Nasreddine, Z.S.; Phillips, N.A.; Bédirian, V.; Charbonneau, S.; Whitehead, V.; Collin, I.; Cummings, J.L.; Chertkow, H. The Montreal Cognitive Assessment, MoCA: A brief screening tool for mild cognitive impairment. J. Am. Geriatr. Soc. 2005, 53, 695–699. [Google Scholar] [CrossRef]
- Powell, L.E.; Myers, A.M. The activities-specific balance confidence (ABC) scale. J. Gerontol. Ser. A Biol. Sci. Med. Sci. 1995, 50, 28–34. [Google Scholar] [CrossRef]
- Ejupi, A.; Brodie, M.; Gschwind, Y.J.; Lord, S.R.; Zagler, W.L.; Delbaere, K. Kinect-based five-times-sit-to-stand test for clinical and in-home assessment of fall risk in older people. Gerontology 2016, 62, 118–124. [Google Scholar] [CrossRef]
- Sun, R.; Aldunate, R.G.; Paramathayalan, V.R.; Ratnam, R.; Jain, S.; Morrow, D.G.; Sosnoff, J.J. Preliminary evaluation of a self-guided fall risk assessment tool for older adults. Arch. Gerontol. Geriatr. 2019, 82, 94–99. [Google Scholar] [CrossRef]
- Sun, R.; Moon, Y.; McGinnis, R.S.; Seagers, K.; Motl, R.W.; Sheth, N.; Wright, J.A.; Ghaffari, R.; Patel, S.; Sosnoff, J.J. Assessment of postural sway in individuals with multiple sclerosis using a novel wearable inertial sensor. Digit. Biomark. 2018, 2, 1–10. [Google Scholar] [CrossRef]
- Bland, J.M.; Altman, D. Statistical methods for assessing agreement between two methods of clinical measurement. Lancet 1986, 327, 307–310. [Google Scholar] [CrossRef]
- Clark, R.A.; Bower, K.J.; Mentiplay, B.F.; Paterson, K.; Pua, Y.-H. Concurrent validity of the Microsoft Kinect for assessment of spatiotemporal gait variables. J. Biomech. 2013, 46, 2722–2725. [Google Scholar] [CrossRef]
- Clark, R.A.; Pua, Y.-H.; Fortin, K.; Ritchie, C.; Webster, K.E.; Denehy, L.; Bryant, A.L. Validity of the Microsoft Kinect for assessment of postural control. Gait Posture 2012, 36, 372–377. [Google Scholar] [CrossRef]


| OA n = 8,6 F | YA n = 12, 6 F | |
|---|---|---|
| Age (yrs) * | 78.2 (6.1) | 24.4 (3.9) |
| BMI (kg/m2) | 23.9 (3.6) | 24.5 (2.9) |
| MoCA * | 26.2 (2.3) | 28.6 (1.7) |
| ABC | 88.8 (13.3) | 96.0 (3.7) |
| MET * | 19.9 (1.5) | 21.2 (0.6) |
| RT (ms) * | 257.7 (33.6) | 217.5 (32.8) |
| Proprio | 3.0 (1.2) | 3.3 (3.5) |
| KneeMax (kgf) * | 25.3 (9.6) | 41.9 (8.5) |
| AP sway (mm) | 27.2 (9.8) | 20.8 (10.9) |
| ML sway (mm) | 33.7 (18.9) | 20.5 (12.3) |
| PPA * | 0.9 (0.7) | −0.3 (0.7) |
| HoloLens vs. HD | ||||
| A | V | D | ||
| STS | NRMSE | 9.60 (8.70,10.51) | 4.83(4.22,5.45) | 5.58 (4.29, 6.87) |
| Xcor | 0.888(0.872,0.904) | 0.979(0.975,0.983) | 0.993 (0.989 0.997) | |
| TUG | NRMSE | 10.53 (9.60,11.46) | 6.16 (5.57,6.76) | 19.56 (17.24,21.87) |
| Xcor | 0.802 (0.770,0.834) | 0.926(0.918,0.934) | 0.998 (0.997 0.999) | |
| HoloLens vs. LB | ||||
| A | V | D | ||
| STS | NRMSE | 9.77 (8.29,11.25) | 8.55 (6.98,10.12) | 11.88 (9.72,14.03) |
| Xcor | 0.765 (0.704,0.827) | 0.900(0.851,0.949) | 0.965 (0.949,0.982) | |
| TUG | NRMSE | 8.48 (7.56,9.41) | 7.68 (7.05,8.31) | 14.07 (11.86,16.28) |
| Xcor | 0.740 (0.695,0.786) | 0.853 (0.835,0.872) | 0.986 (0.978 0.993) | |
| Task | Outcome Measures | OA | YA | p |
|---|---|---|---|---|
| STS | Total Time (s) | 12.22 (3.61) | 12.08 (1.99) | 0.922 |
| Mean Stand Time (s) | 0.52 (0.18) | 0.64 (0.22) | 0.198 | |
| Mean Sitting Time (s) | 1.15 (0.55) | 1.03 (0.23) | 0.575 | |
| Max Acceleration (m/s2) | 4.75 (1.81) | 6.22 (2.03) | 0.108 | |
| Max Velocity (m/s) | 1.02 (0.16) | 1.20 (0.28) | 0.087 | |
| TUG | Total Time (s) | 10.61 (2.37) | 10.56 (1.00) | 0.96 |
| Max Acceleration (m/s2) | 3.98 (0.92) | 3.97 (0.62) | 0.961 | |
| Max Velocity (m/s) | 0.69 (0.10) | 0.81 (0.15) | 0.059 |
© 2019 by the authors. Licensee MDPI, Basel, Switzerland. This article is an open access article distributed under the terms and conditions of the Creative Commons Attribution (CC BY) license (http://creativecommons.org/licenses/by/4.0/).
Share and Cite
Sun, R.; Aldunate, R.G.; Sosnoff, J.J. The Validity of a Mixed Reality-Based Automated Functional Mobility Assessment. Sensors 2019, 19, 2183. https://doi.org/10.3390/s19092183
Sun R, Aldunate RG, Sosnoff JJ. The Validity of a Mixed Reality-Based Automated Functional Mobility Assessment. Sensors. 2019; 19(9):2183. https://doi.org/10.3390/s19092183
Chicago/Turabian StyleSun, Ruopeng, Roberto G. Aldunate, and Jacob J. Sosnoff. 2019. "The Validity of a Mixed Reality-Based Automated Functional Mobility Assessment" Sensors 19, no. 9: 2183. https://doi.org/10.3390/s19092183
APA StyleSun, R., Aldunate, R. G., & Sosnoff, J. J. (2019). The Validity of a Mixed Reality-Based Automated Functional Mobility Assessment. Sensors, 19(9), 2183. https://doi.org/10.3390/s19092183