A Dynamic Systems Approach for Detecting and Localizing of Infarct-Related Artery in Acute Myocardial Infarction Using Compressed Paper-Based Electrocardiogram (ECG)

 , , and
Abstract
:1. Introduction
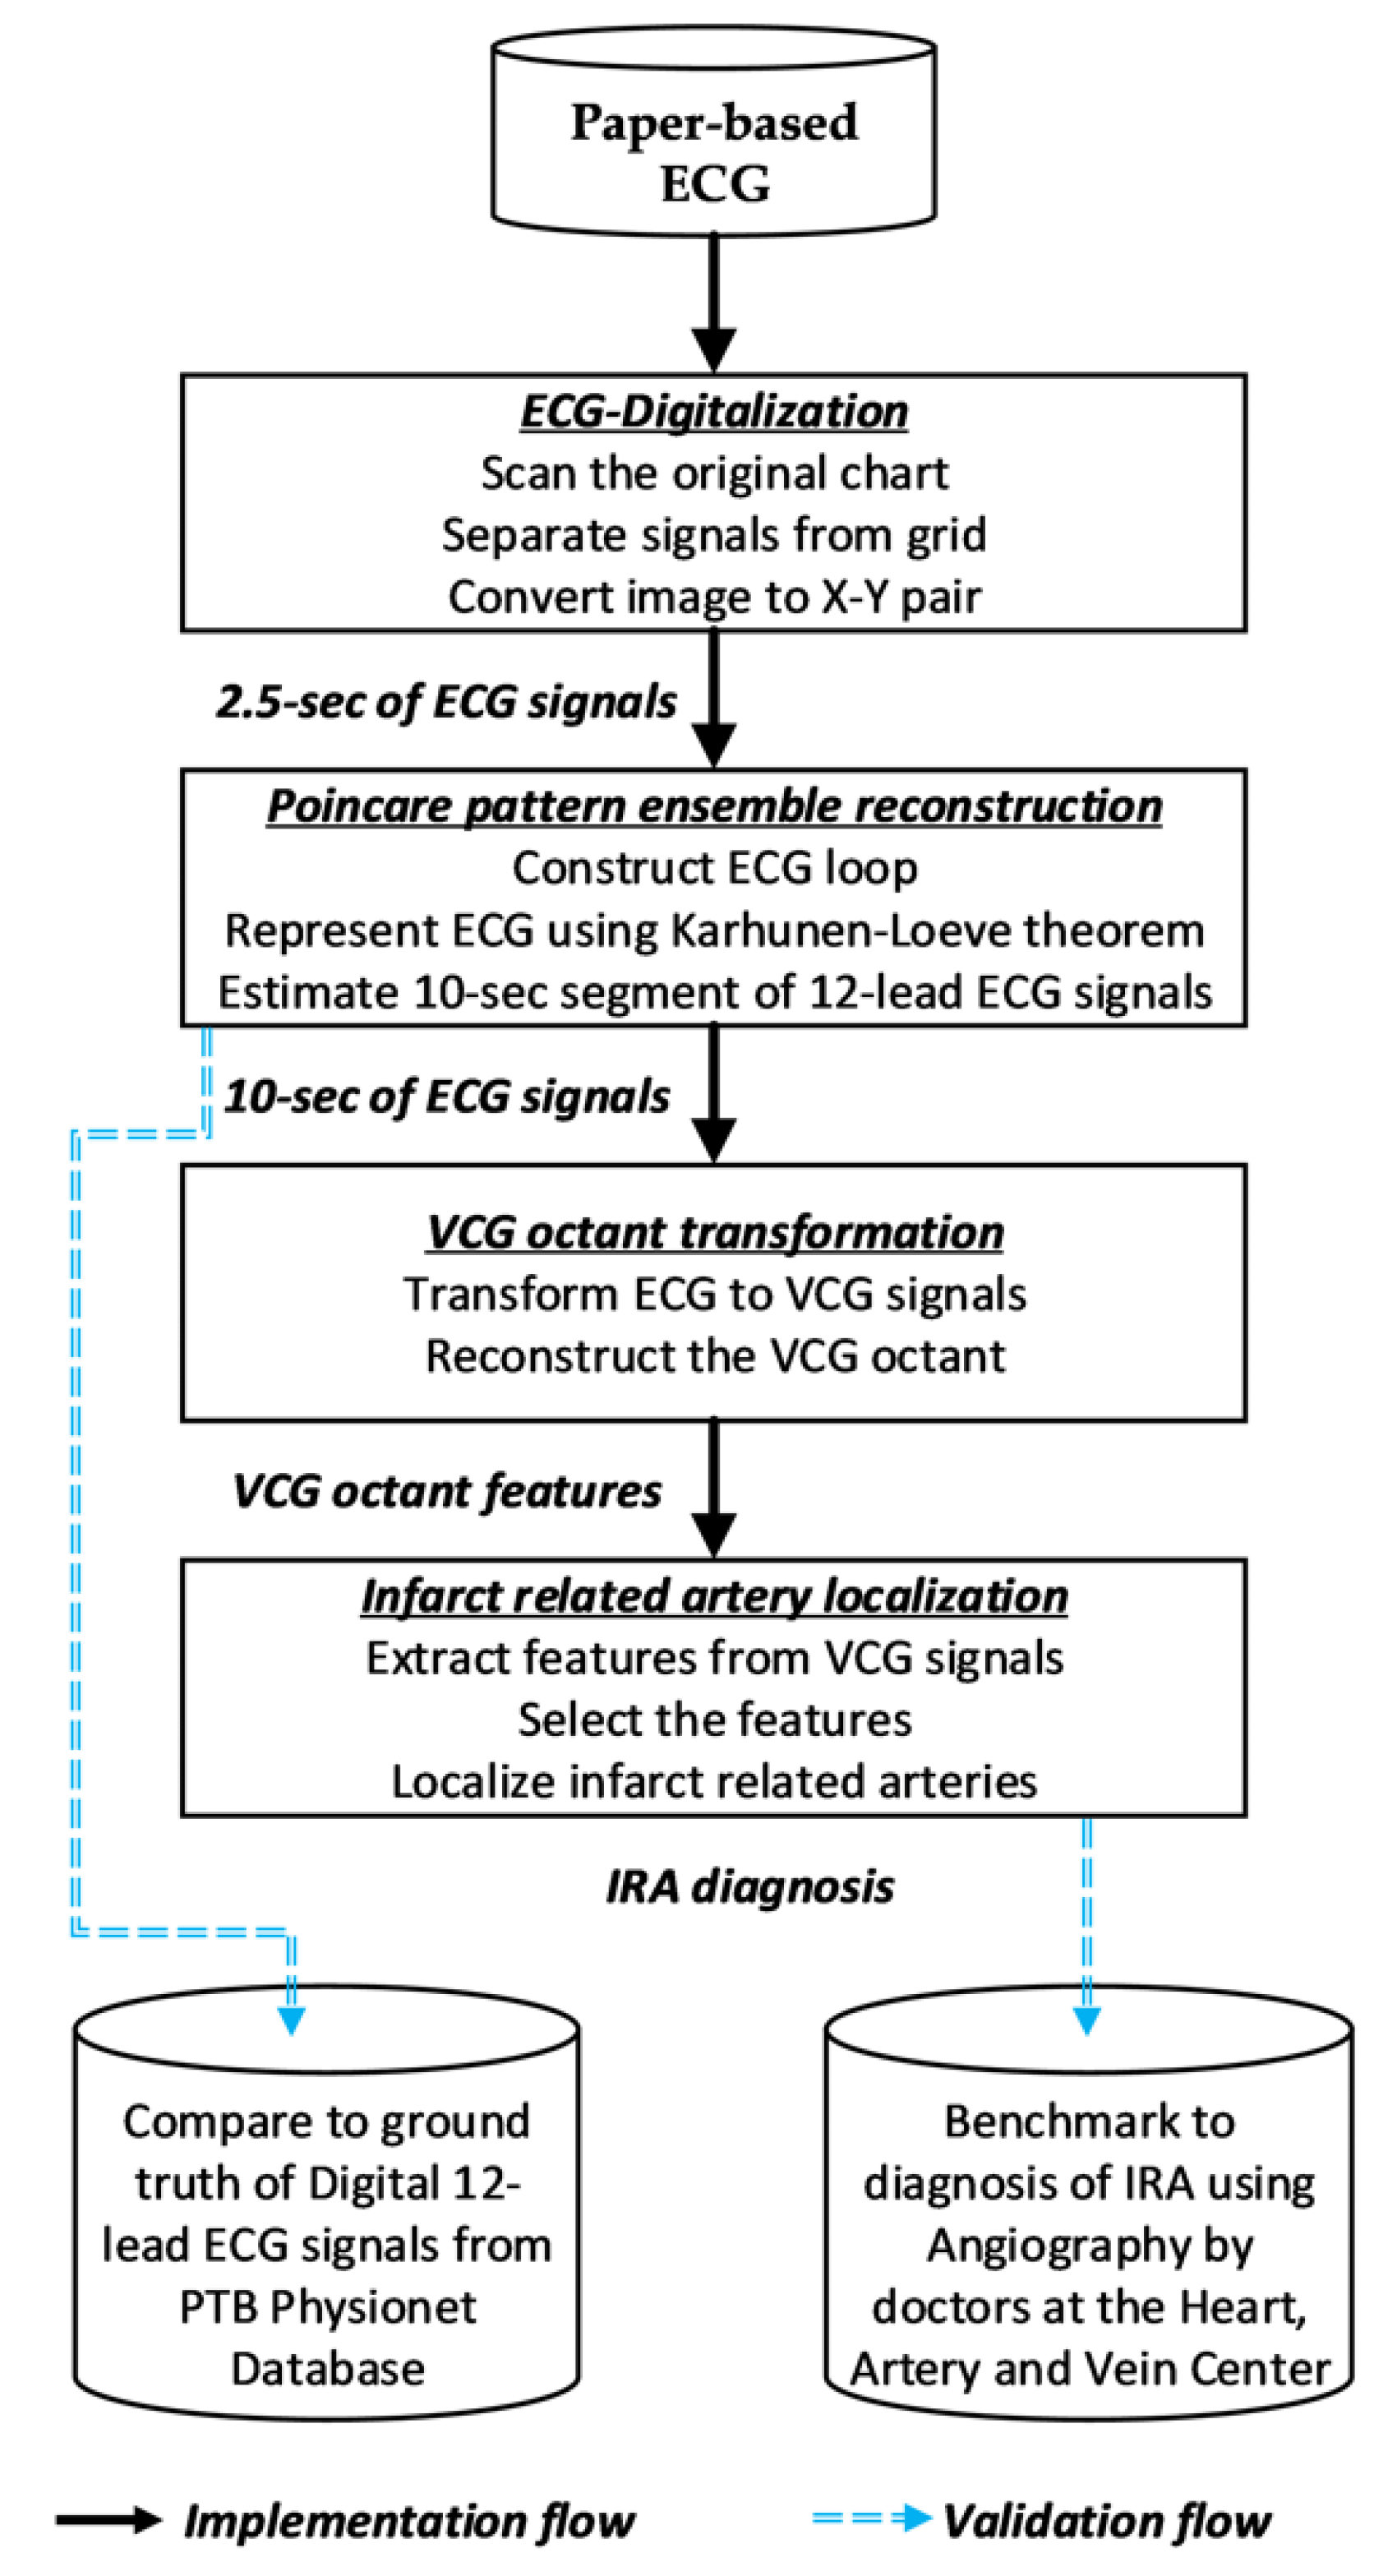
2. Methods
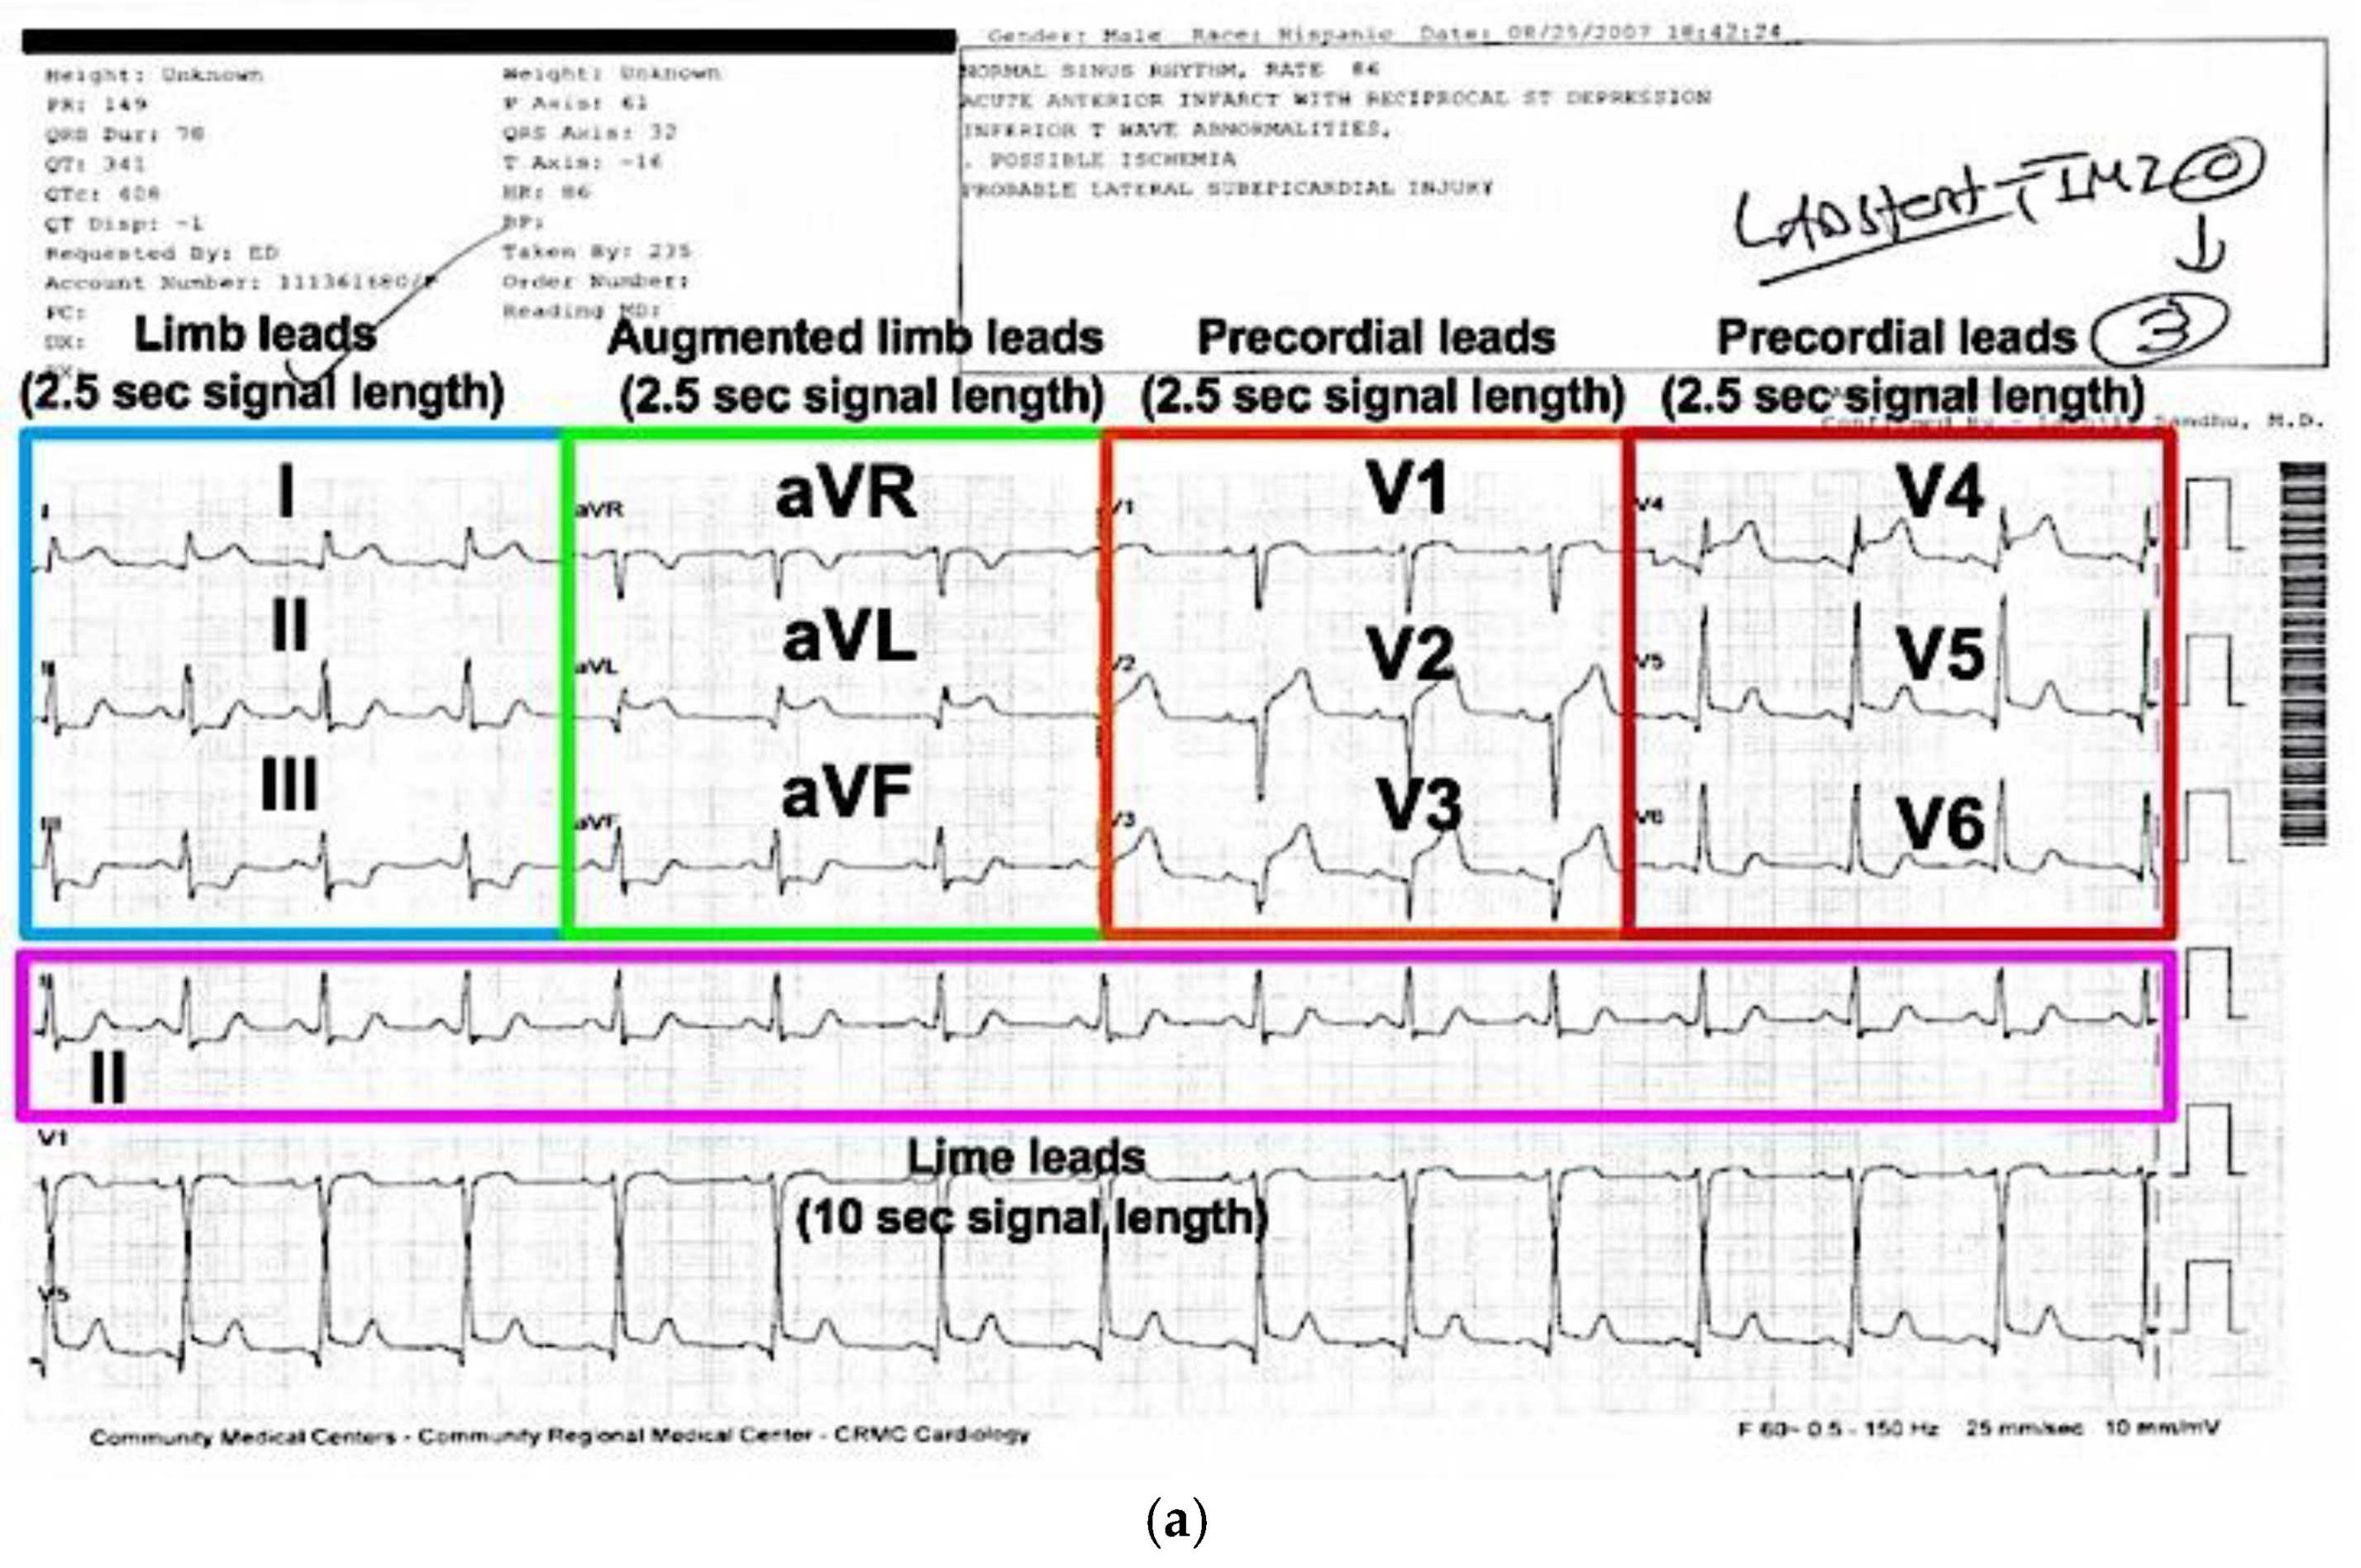
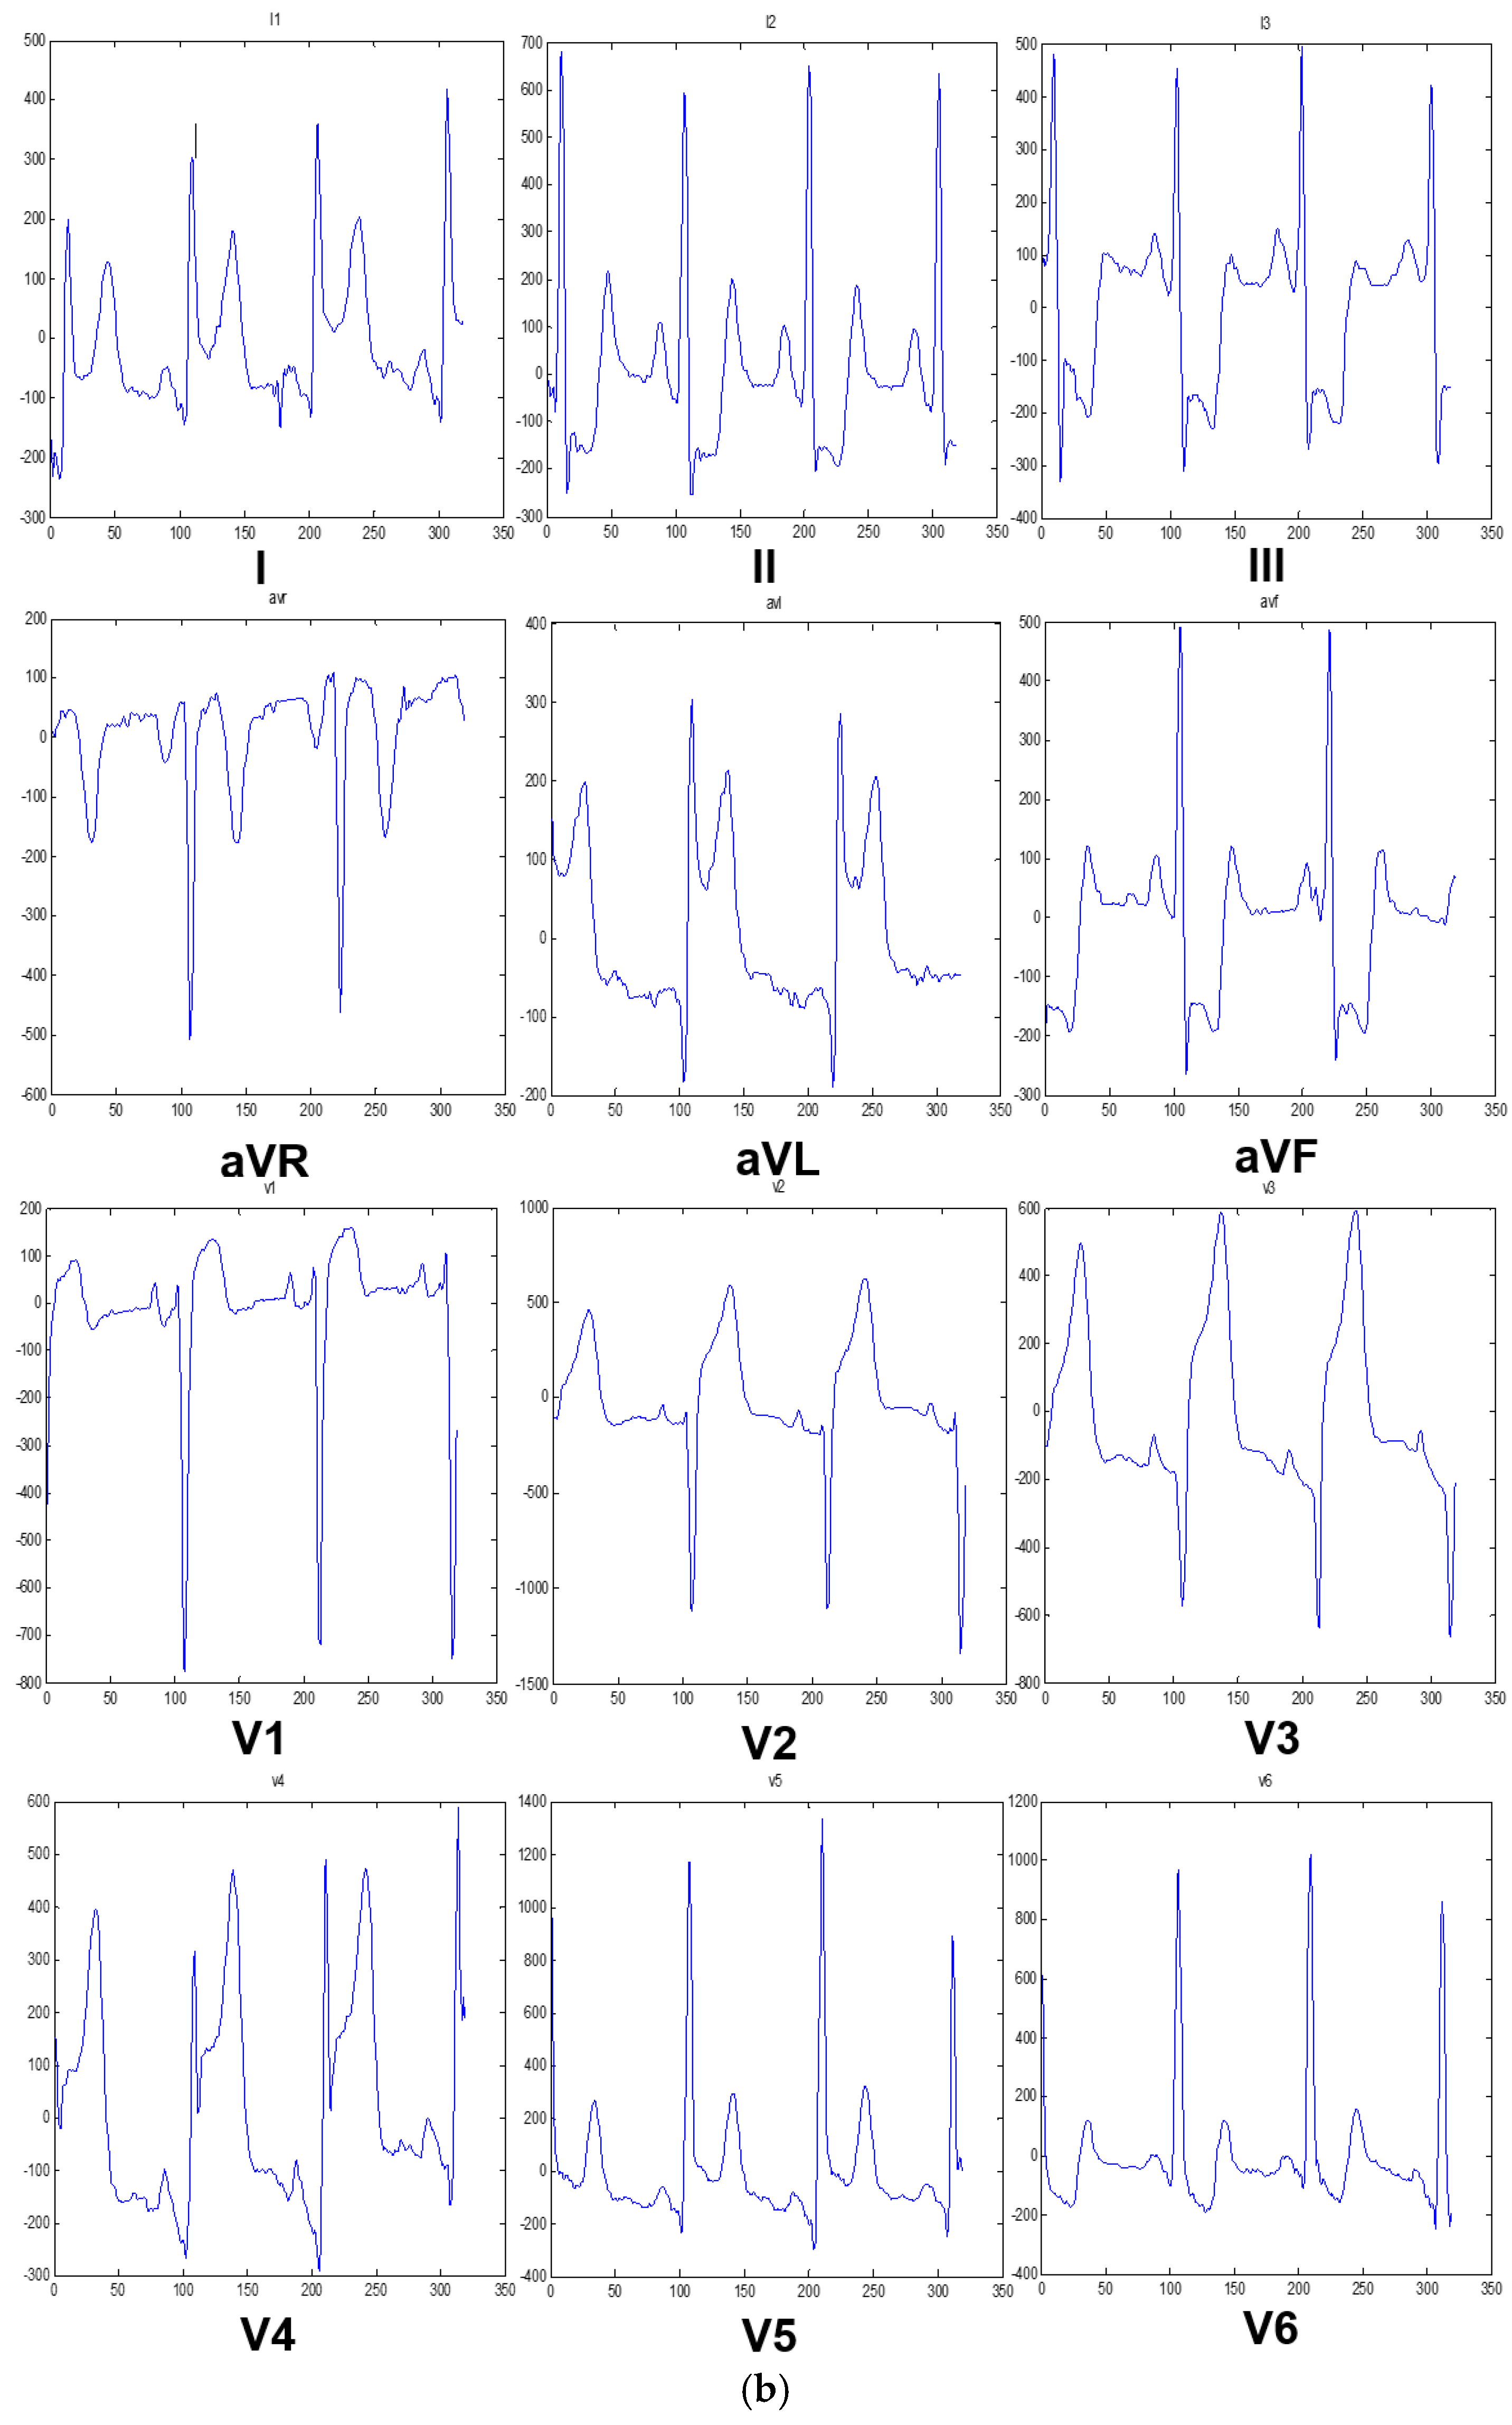
2.1. ECG Digitalization
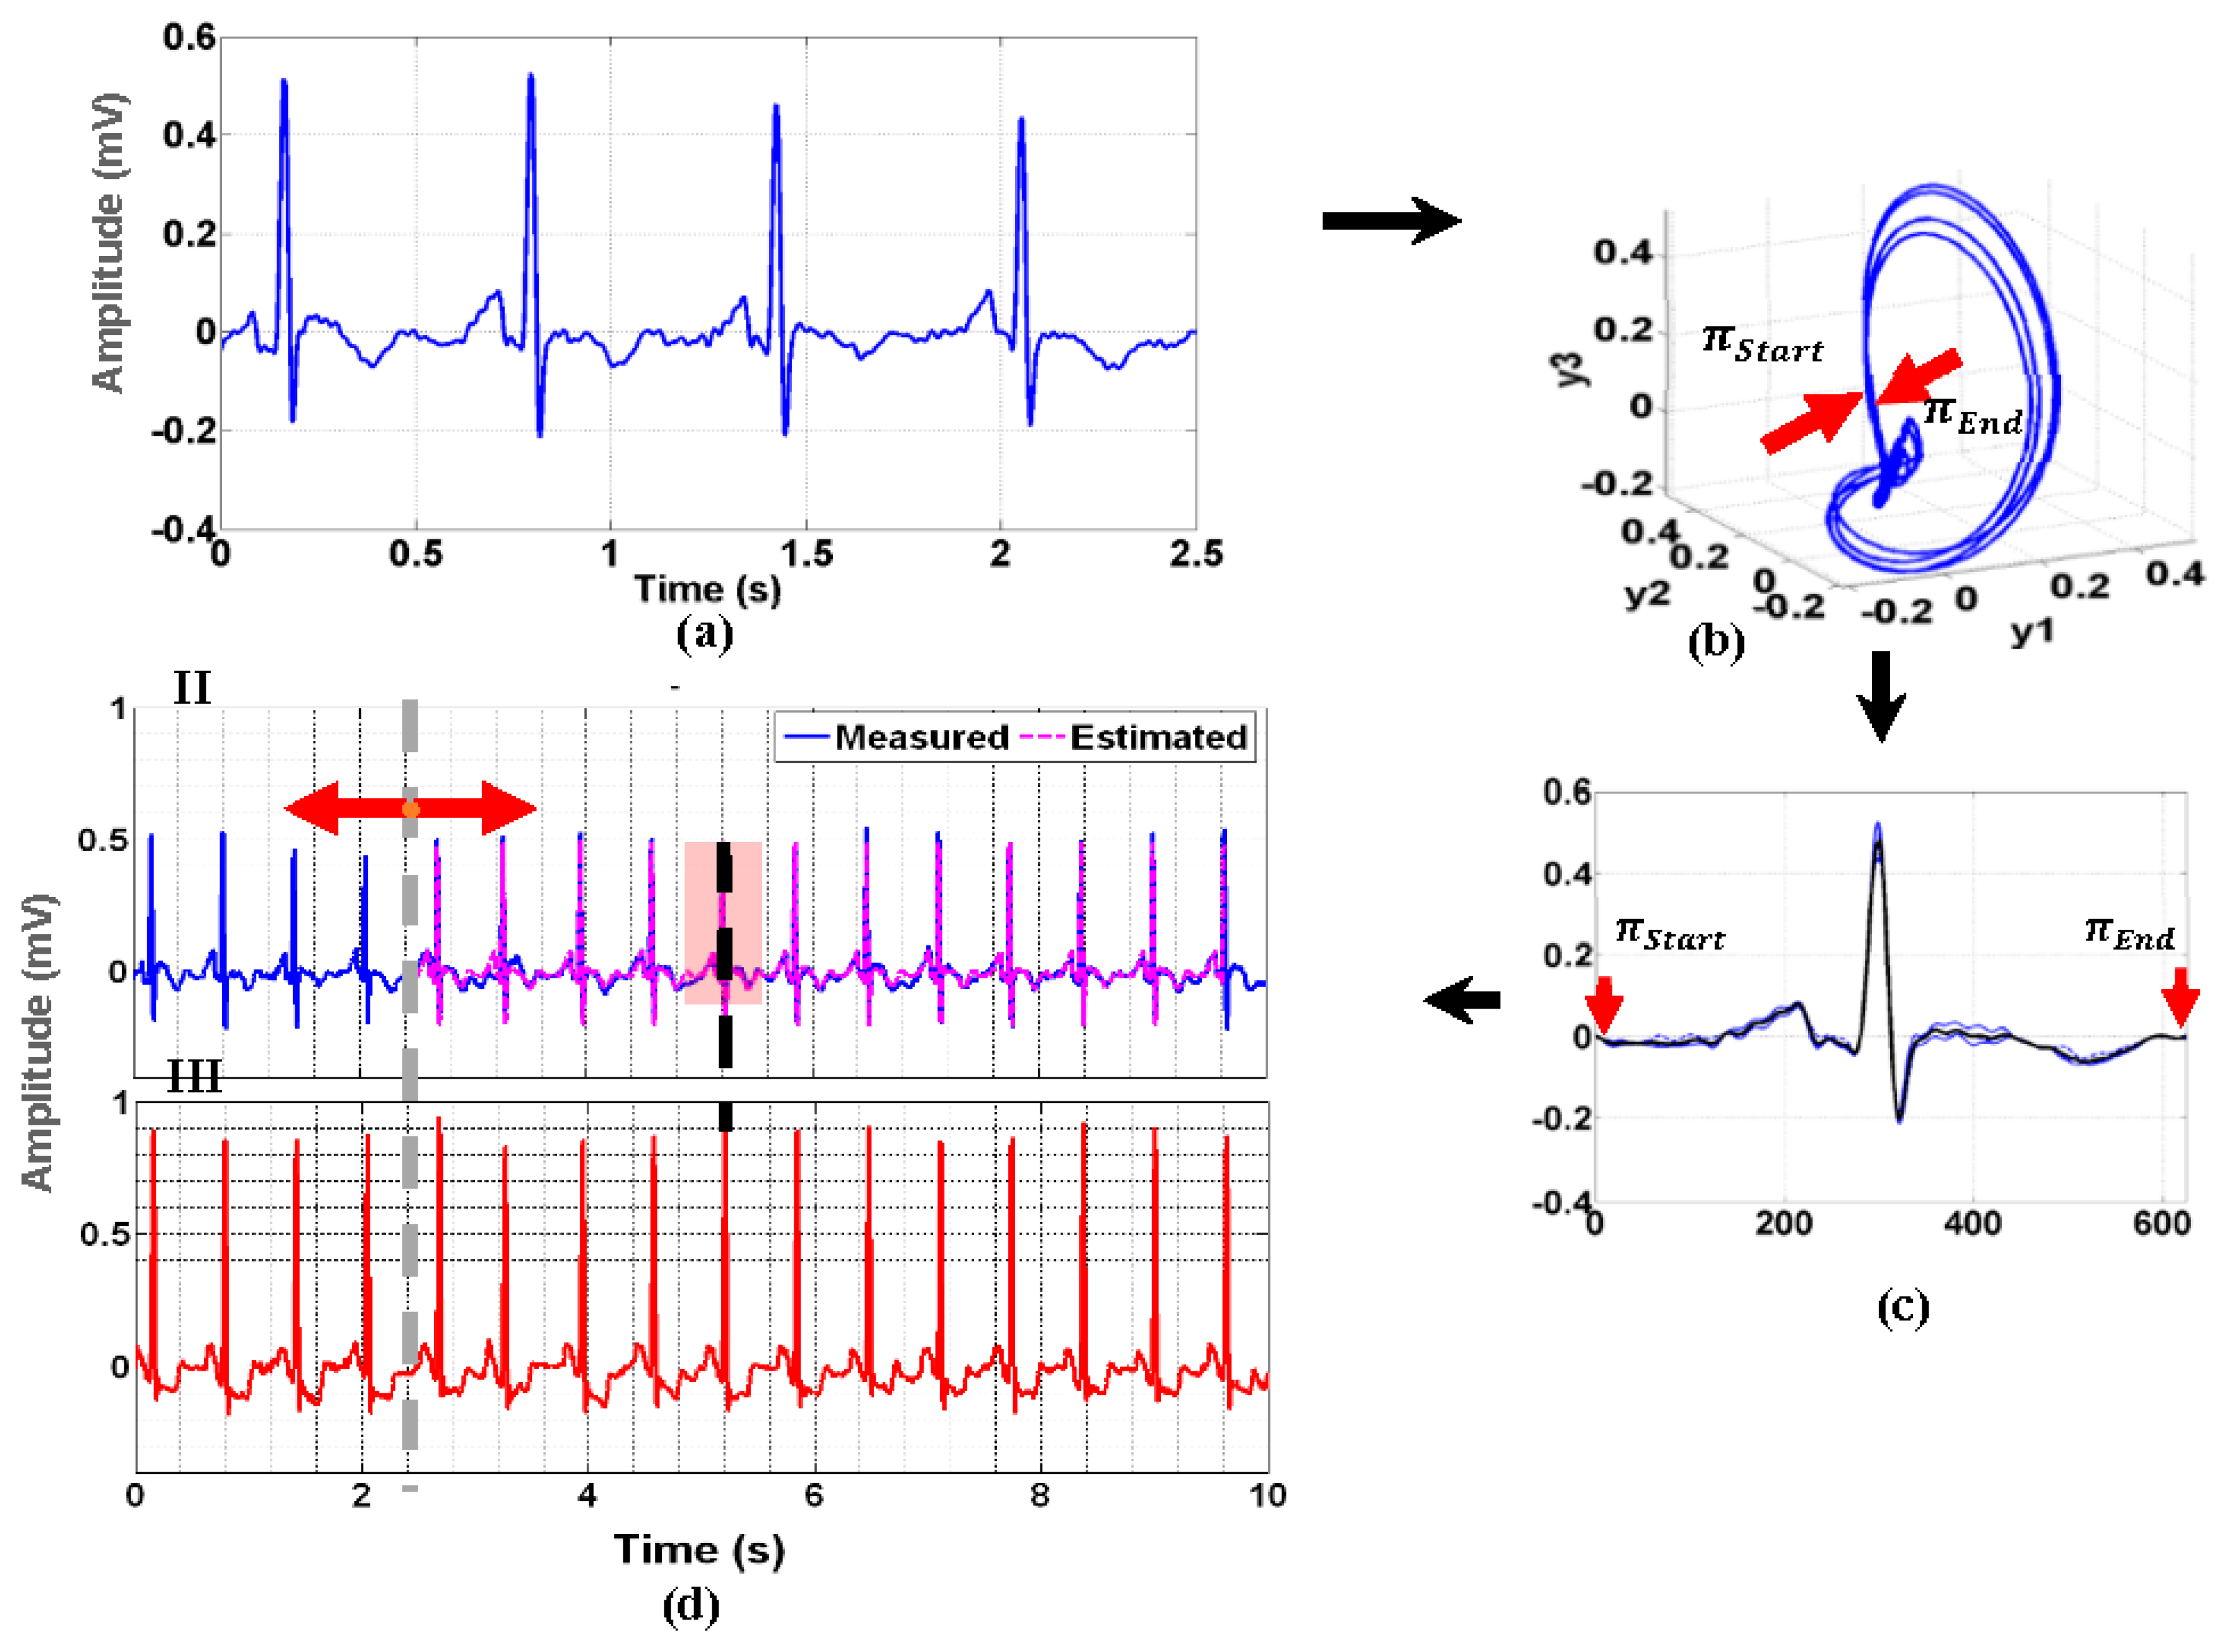
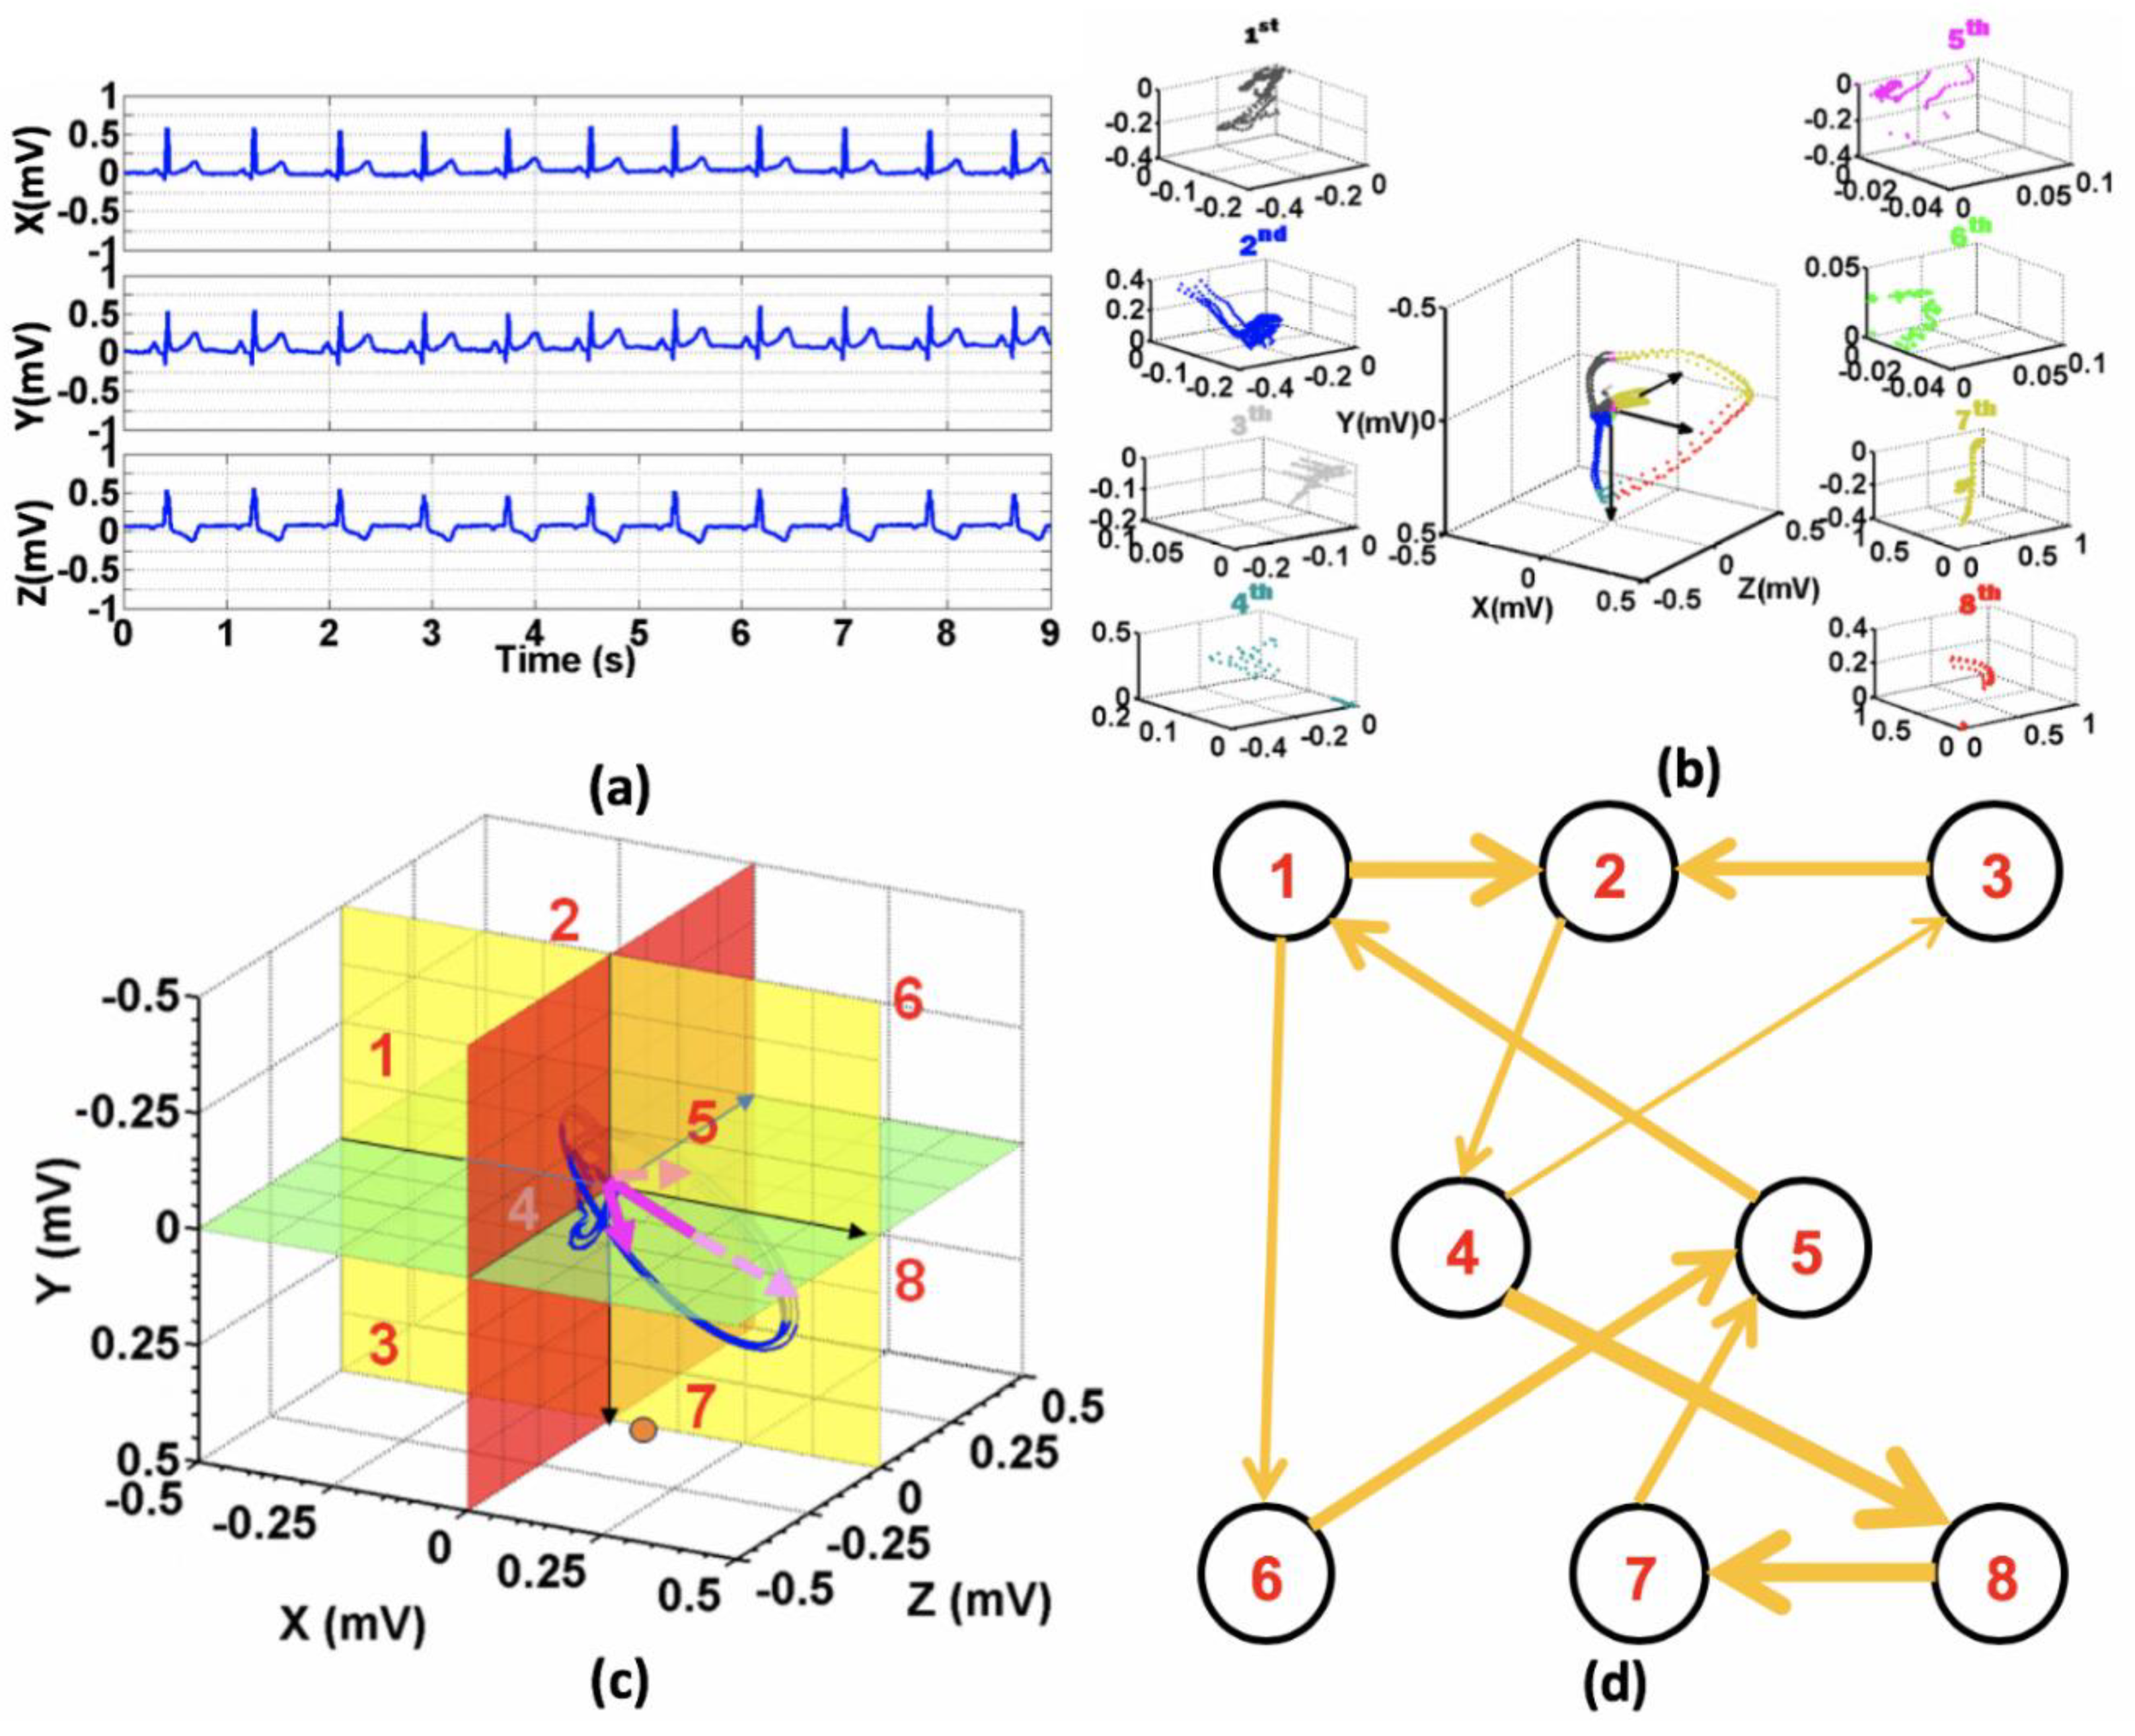
2.2. Poincare Ensemble Reconstruction and VCG Transformation
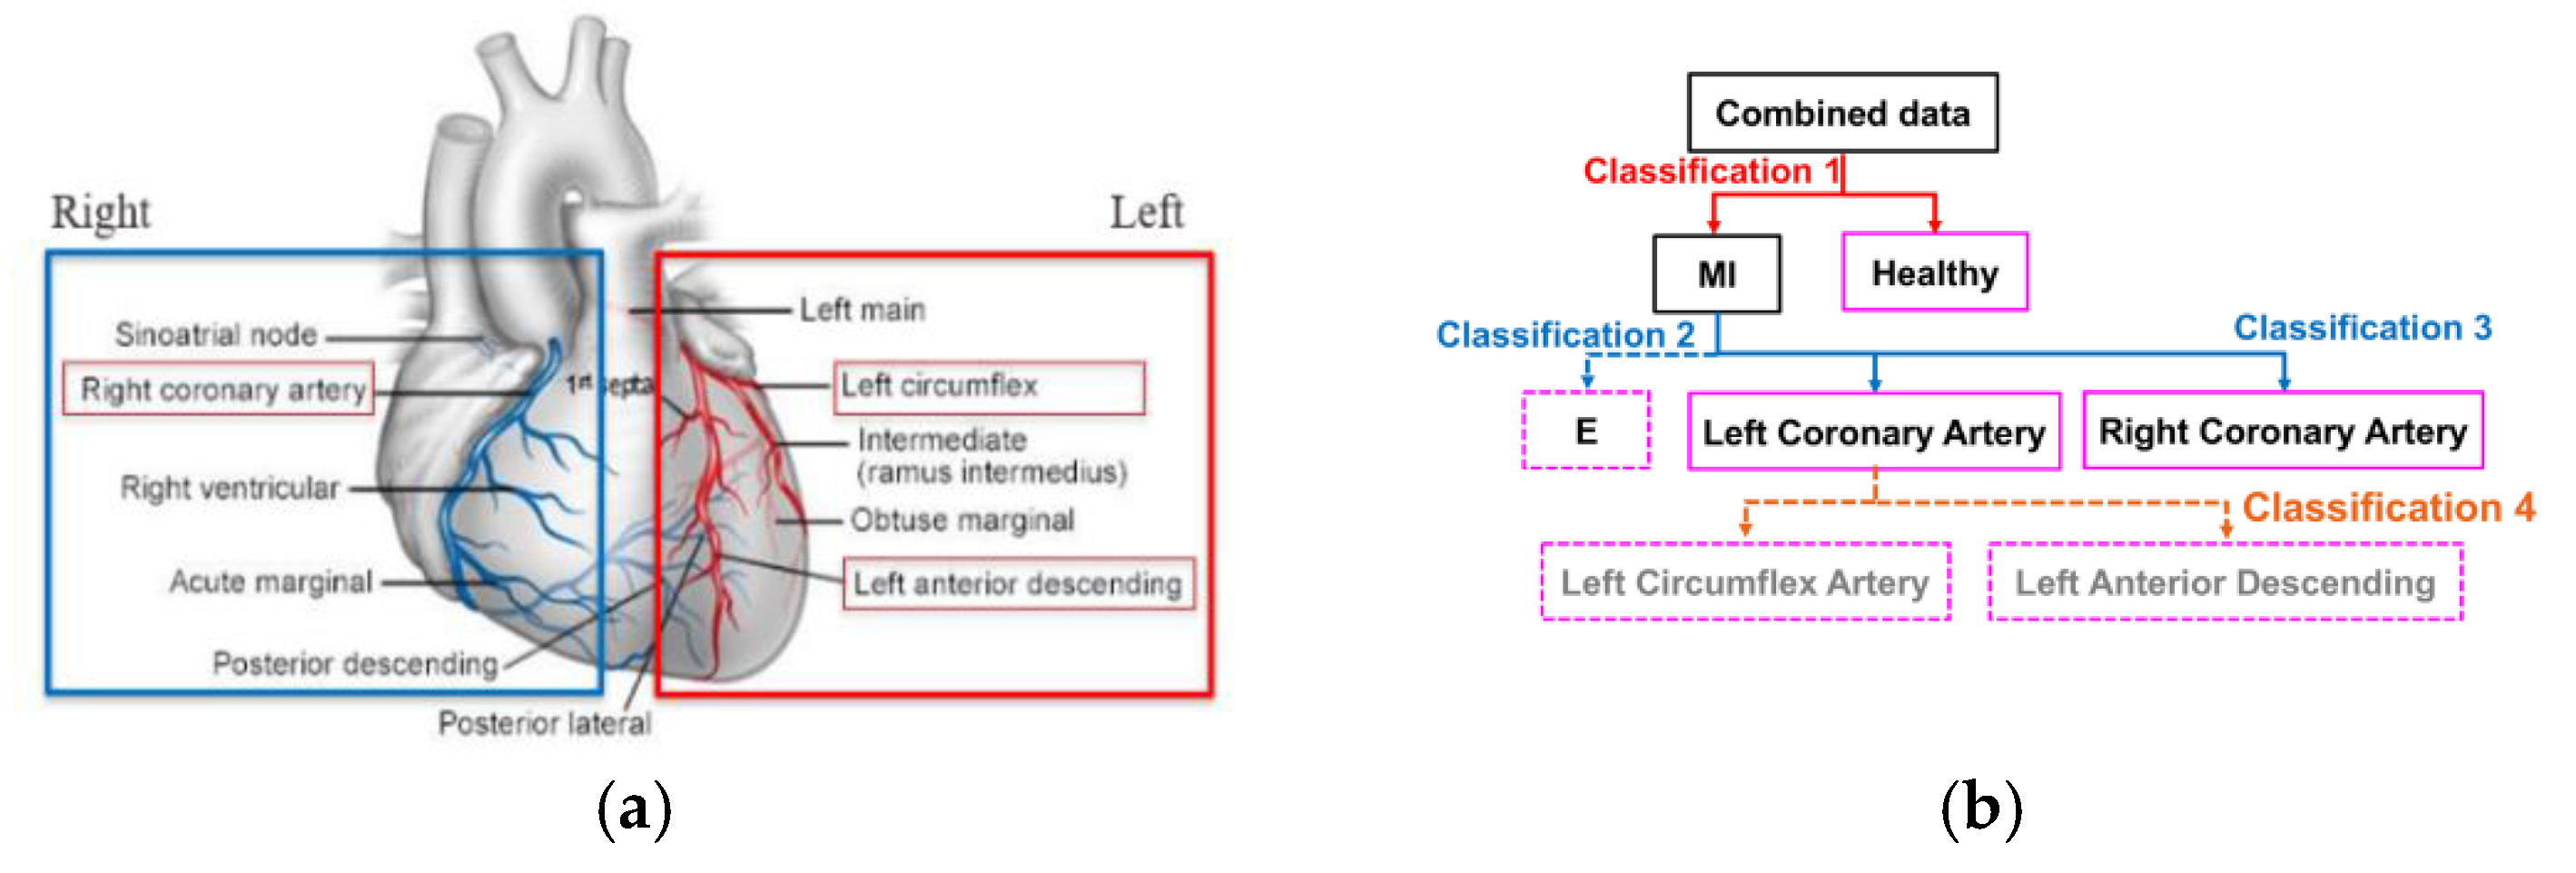
2.3. Feature Engineering and Infarct-Related Artery (IRA) Localization
3. Implementations and Results
3.1. Data Descriptions
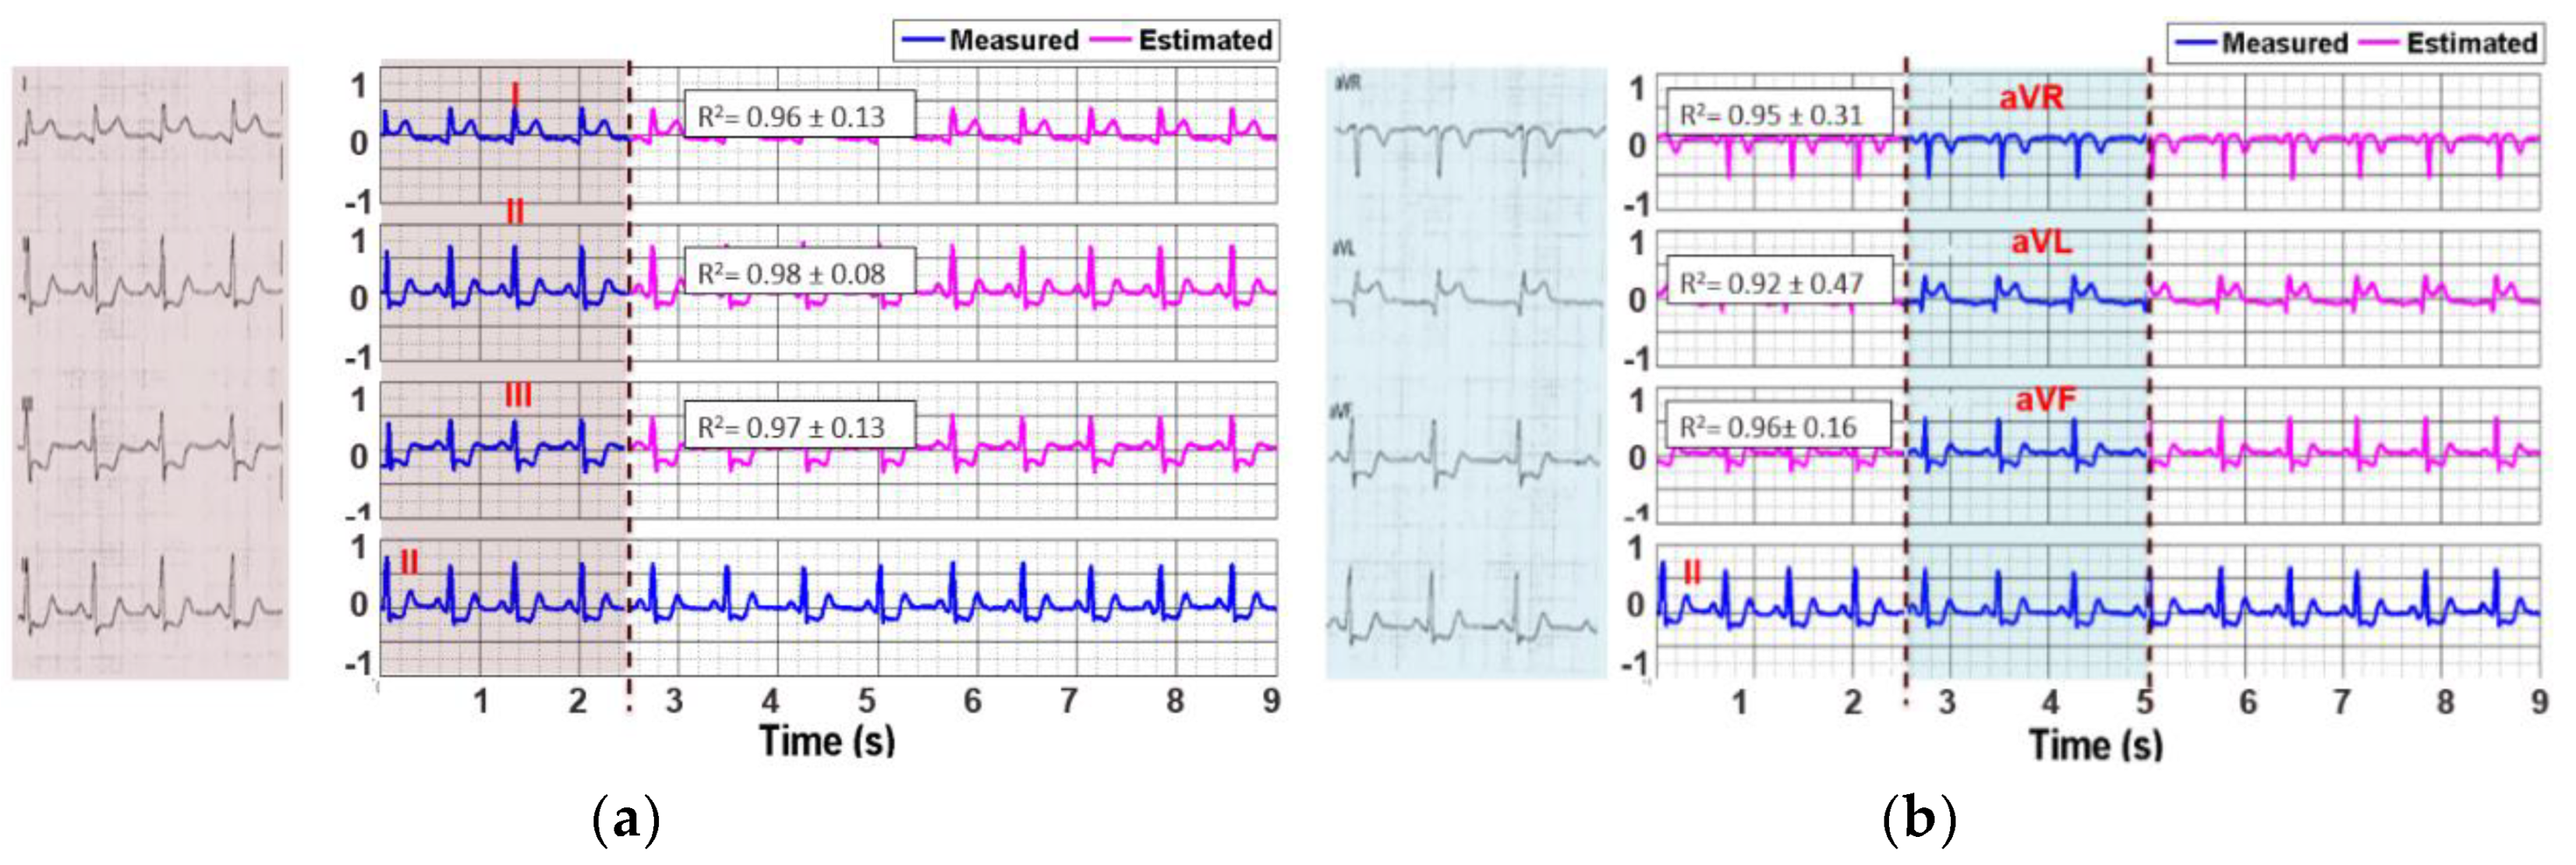
3.2. Reconstruction of 12-Lead ECG Signal
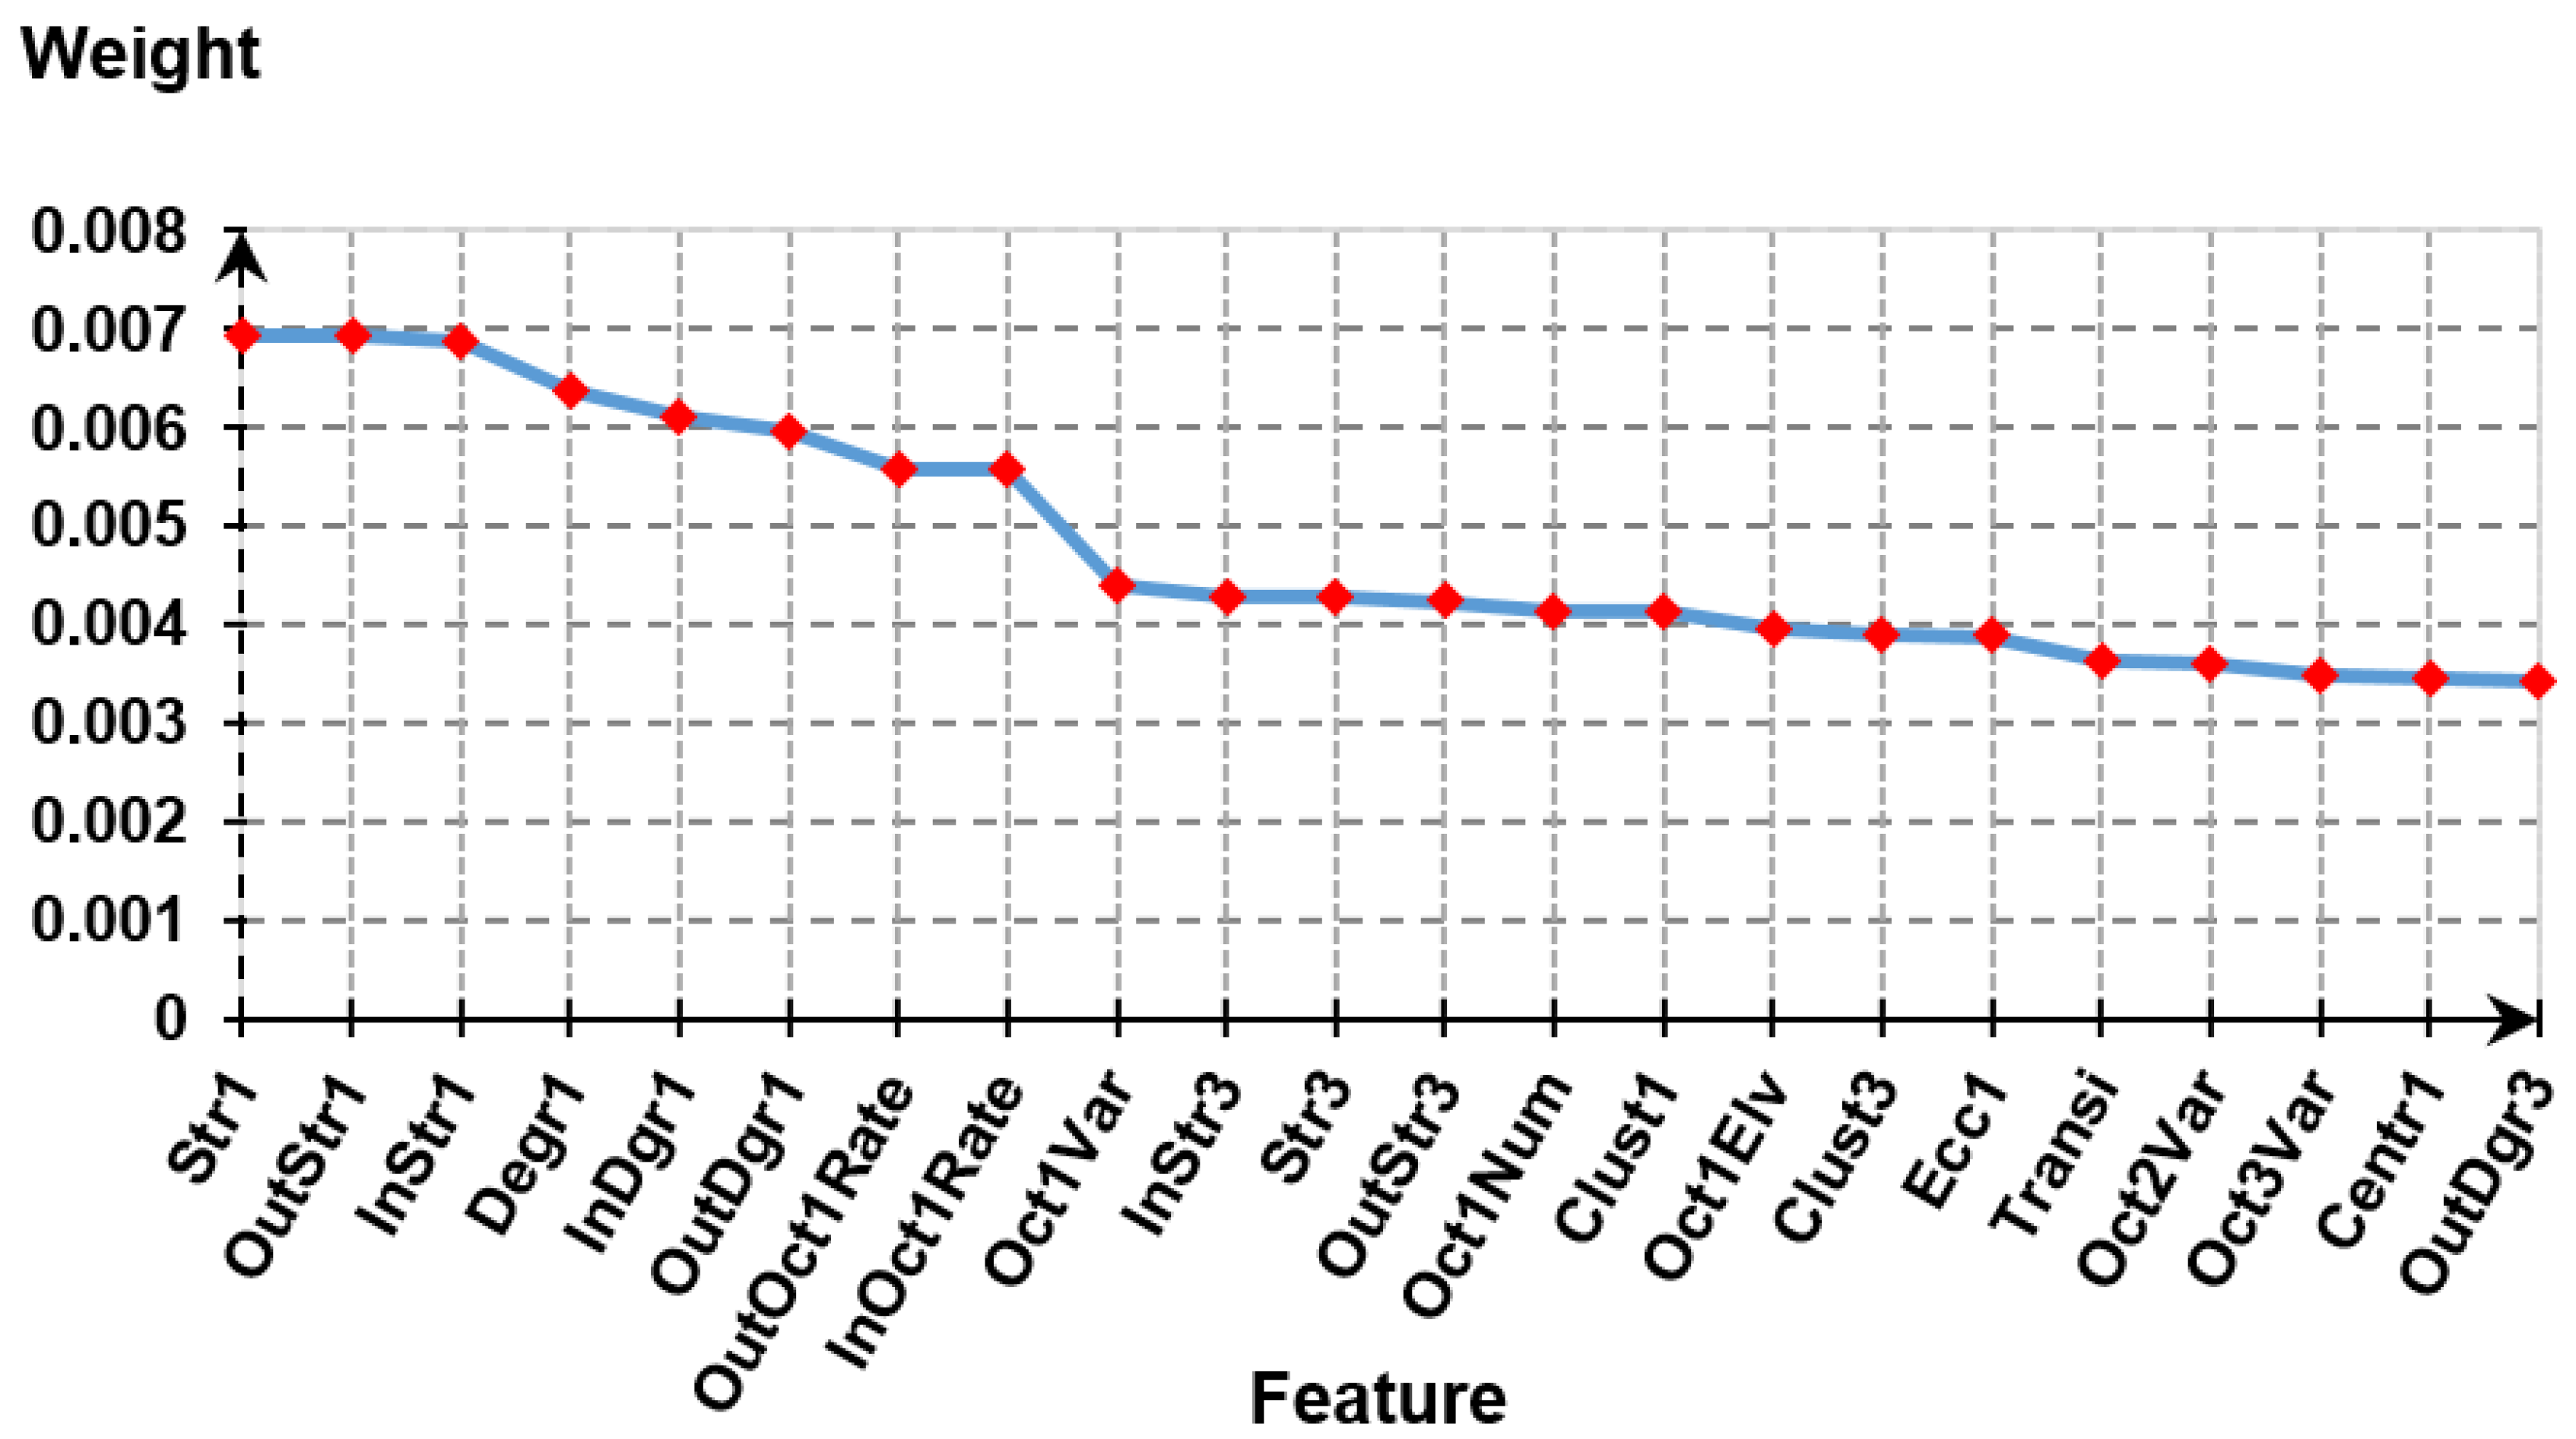
3.3. Feature Extraction and Feature Selection
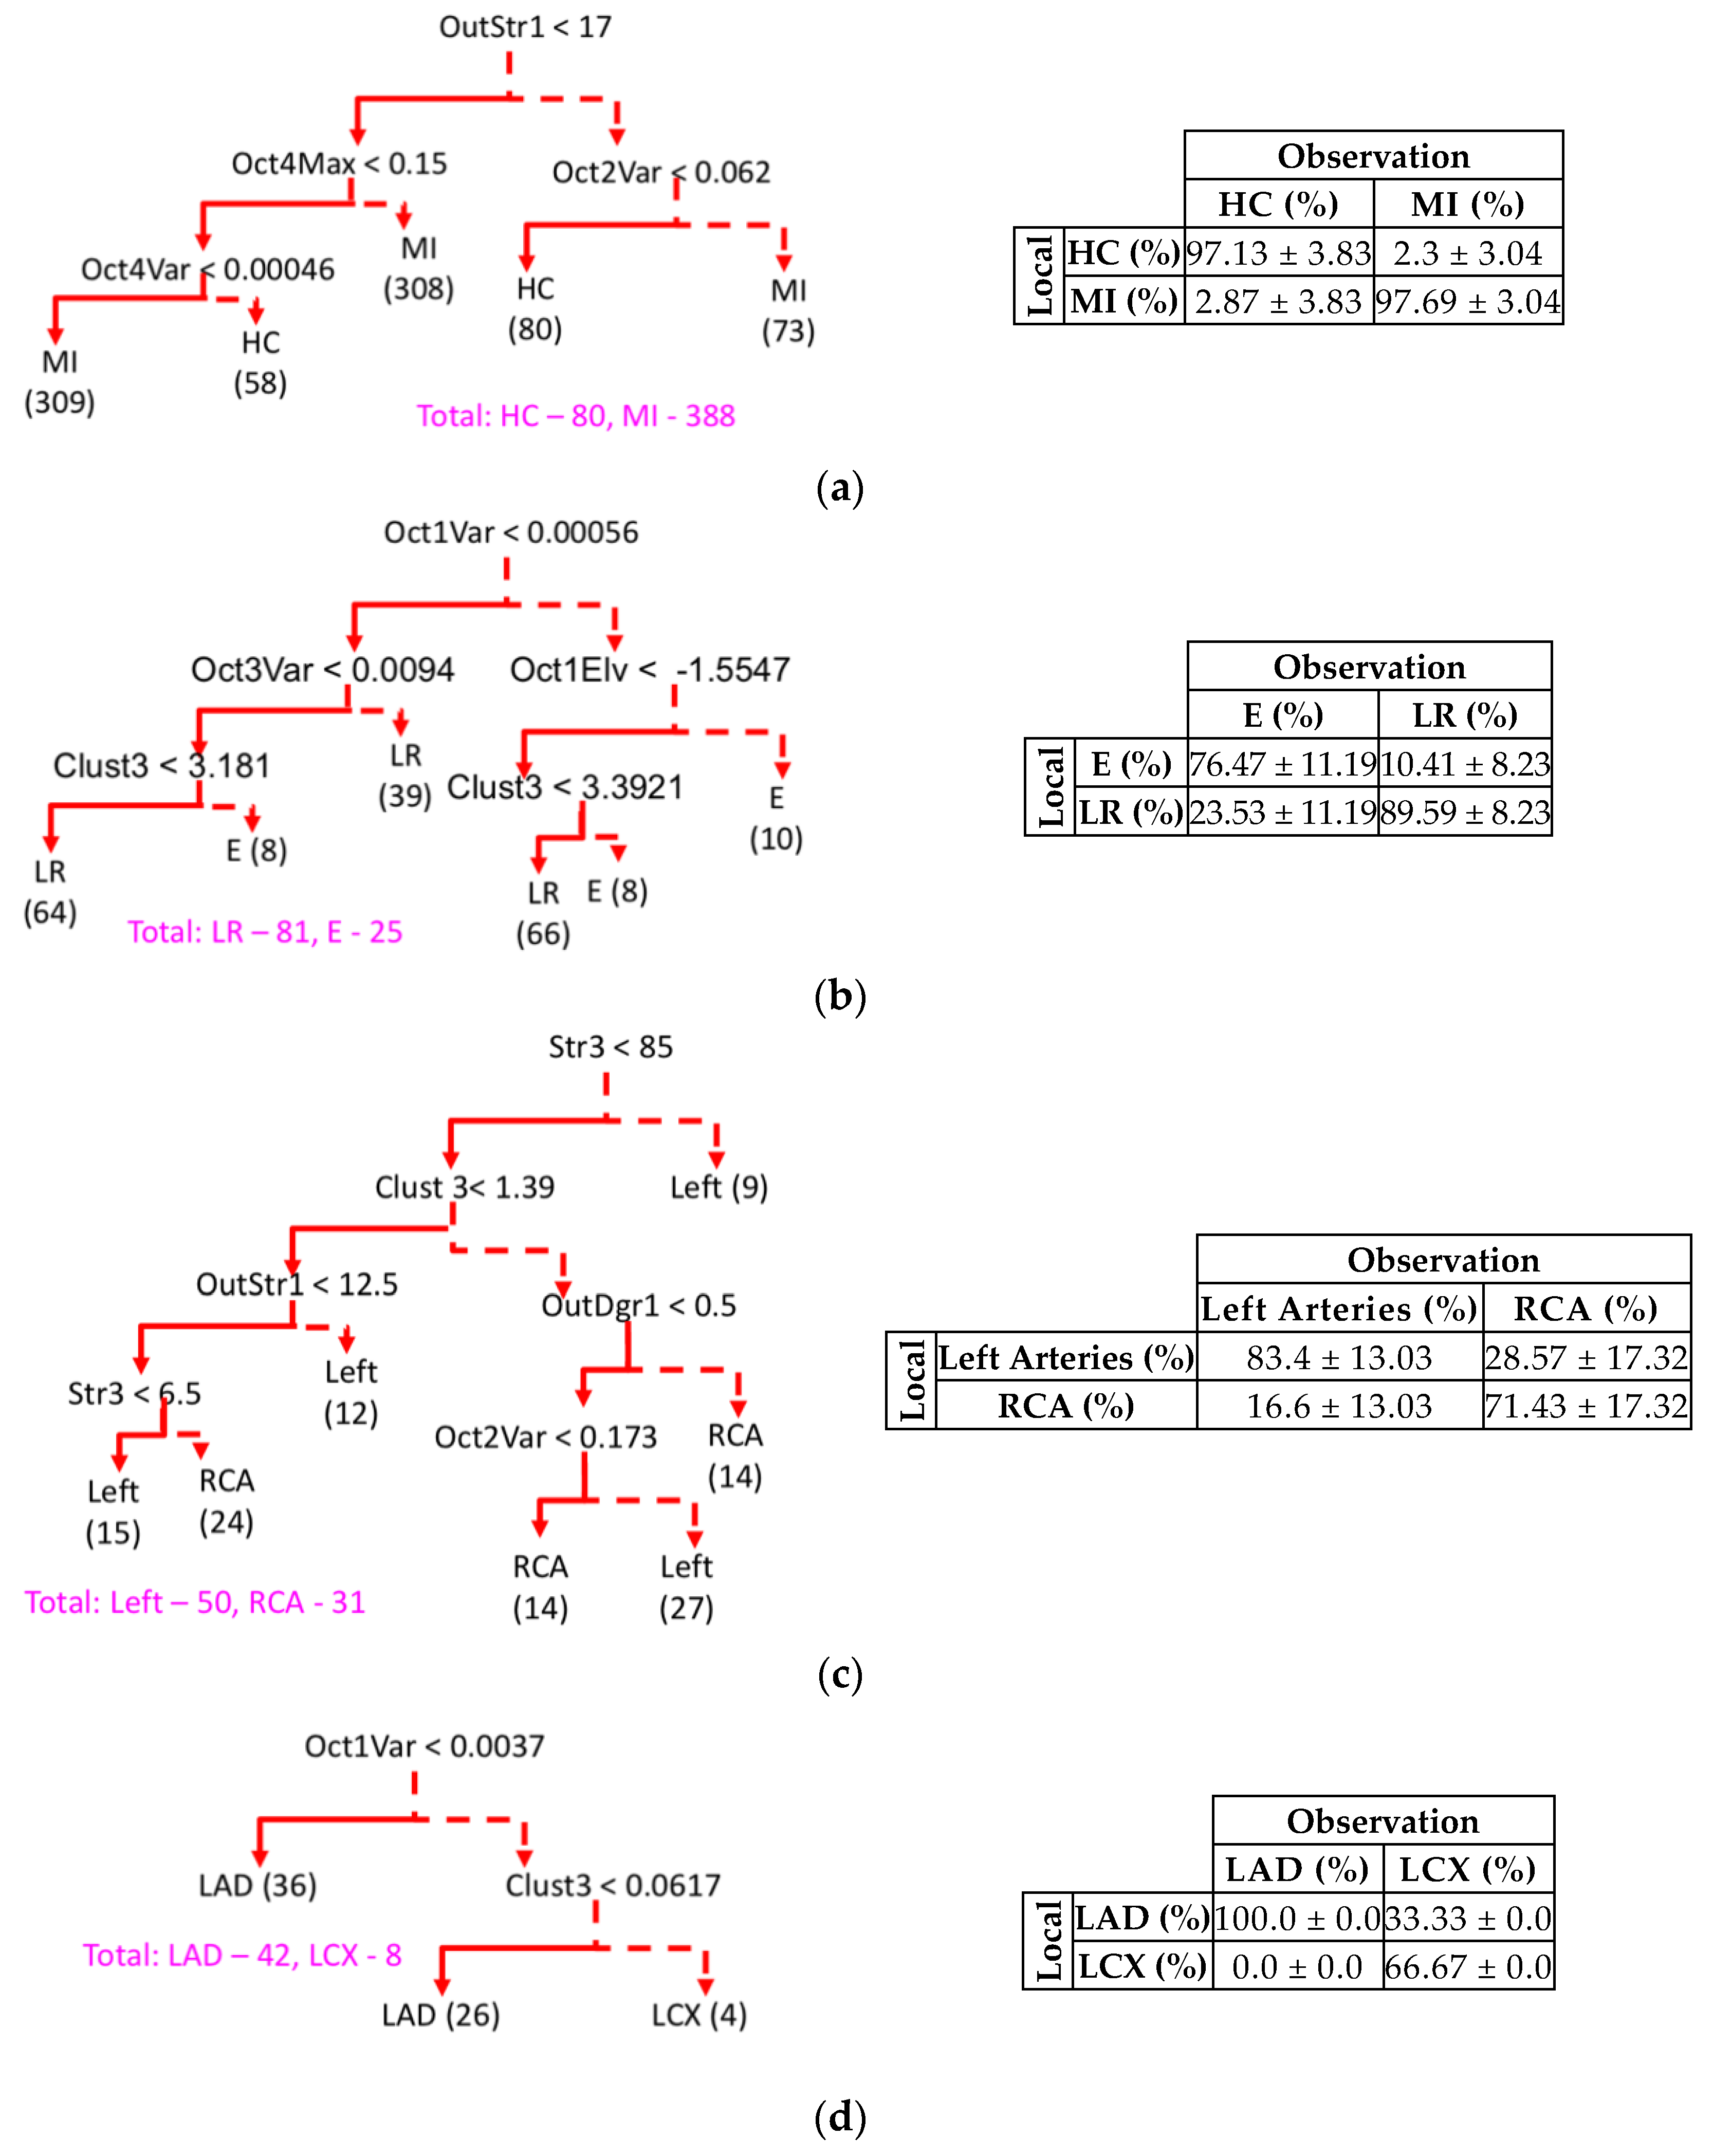
3.4. IRA Localization and Hierarchical Model Selection
4. Discussion
5. Conclusions
Author Contributions
Funding
Conflicts of Interest
References
- Fibrinolytic Therapy Trialists’ (FTT) Collaborative Group. Indications for Fibrinolytic Therapy in Suspected Acute Myocardial Infarction: Collaborative Overview of Early Mortality and Major Morbidity Results from All Randomised Trials of More Than 1000 Patients. Lancet 1994, 343, 311–322. [Google Scholar] [CrossRef]
- Kerber, R.E.; Ornato, J.P.; Brown, D.D.; Chameides, L.; Chandra, N.C.; Cummins, R.O.; Hazinski, M.F.; Melker, R.J.; Weaver, W.D.; Abramson, N.S.; et al. Guidelines for Cardiopulmonary Resuscitation and Emergency Cardiac Care. JAMA 1992, 26, 2172–2183. [Google Scholar]
- Benjamin, E.J.; Blaha, M.J.; Chiuve, S.E.; Cushman, M.; Das, S.R.; Deo, R.; De Ferranti, S.D.; Floyd, J.; Fornage, M.; Gillespie, C.; et al. Heart Disease and Stroke Statistics—2017 Update: A Report from the American Heart Association. Circulation 2017, 135, e146–e603. [Google Scholar] [CrossRef] [PubMed]
- Blohm, B.; Hartford, M.; Karlsson, T.; Herlitz, J. Factors Associated with Pre-Hospital and In-Hospital Delay Time in Acute Myocardial Infarction: A 6-Year Experience. J. Intern. Med. 1998, 243, 243–250. [Google Scholar] [CrossRef]
- Schull, M.J.; Vermeulen, M.; Slaughter, G.; Morrison, L.; Daly, P. Emergency Department Crowding and Thrombolysis Delays in Acute Myocardial Infarction. Ann. Emerg. Med. 2004, 44, 577–585. [Google Scholar] [CrossRef] [PubMed]
- Qureshi, A.; Smith, A.; Wright, F.; Brenneman, F.; Rizoli, S.; Hsieh, T.; Tien, H.C. The Impact of an Acute Care Emergency Surgical Service on Timely Surgical Decision-Making and Emergency Department Overcrowding. J. Am. Coll. Surg. 2011, 213, 284–293. [Google Scholar] [CrossRef] [PubMed]
- Fayad, Z.; Fuster, V.; Nikolaou, K.; Becker, C. Computed Tomography and Magnetic Resonance Imaging for Noninvasive Coronary Angiography and Plaque Imaging. Circulation 2002, 106, 2026–2034. [Google Scholar] [CrossRef] [Green Version]
- Hildick-Smith, D.J.; Lowe, M.D.; Walsh, J.T.; Ludman, P.F.; Stephens, N.G.; Schofield, P.M.; Stone, D.L.; Shapiro, L.M.; Petch, M.C. Coronary Angiography from The Radial Artery—Experience, Complications and Limitations. Int. J. Cardiol. 1998, 64, 231–239. [Google Scholar] [CrossRef]
- Halliburton, S.; Schoenhagen, P. Cardiovascular Imaging with Computed Tomography. JACC Cardiovasc. Imaging 2010, 3, 536–540. [Google Scholar] [CrossRef] [Green Version]
- Hoffmann, M.K.; Shi, H.; Schmitz, B.L.; Schid, F.L.; Lieberknecht, M.; Schulz, R.; Ludwig, B.; Kroschel, U.; Jahnke, N.; Haerer, W.; et al. Noninvasive Coronary Angiography with Multislice Computed Tomography. JAMA 2005, 293, 2471–2478. [Google Scholar] [CrossRef] [Green Version]
- Manning, W.J.; Edelman, R.R.; Li, W. A Preliminary Report Comparing Magnetic Resonance Coronary Angiography with Conventional Angiography. N. Engl. J. Med. 1993, 328, 828–832. [Google Scholar] [CrossRef] [PubMed]
- Bluemke, D.A.; Achenbach, S.; Budoff, M.; Gerber, T.C.; Gersh, B.; Hillis, L.D.; Hundley, W.G.; Manning, W.J.; Printz Feller, B.; Stuber, M.; et al. Noninvasive Coronary Artery Imaging. Circulation 2008, 118, 586–606. [Google Scholar] [CrossRef]
- Hazinski, M.F.; Field, J.M. Association Guidelines for Cardiopulmonary Resuscitation and Emergency cardiovascular care science. Circulation 2010, 122, S639–S946. [Google Scholar]
- Garvey, J.L.; MacLeod, B.A.; Sopko, G.; Hand, M.M. Pre-Hospital 12-Lead Electrocardiography Programs. J. Am. Coll. Cardiol. 2006, 47, 485–491. [Google Scholar] [CrossRef] [Green Version]
- Adams, G.L.; Pompliano, M.J. Prehospital ECG Acquisition/Interpretation: Emerging Technology Applied to STEMI Care. In Prehospital Management of Acute STEMI: Practical Approaches and International Strategies for Early Intervention; Cardiotext Publishing: Minneapolis, MN, USA, 2015; Volume 2, p. 69. [Google Scholar]
- Le, T.Q.; Bukkapatnam, S.T.S.; Benjamin, B.A.; Wilkins, B.A.; Komanduri, R. Topology and Random-Walk Network Representation of Cardiac Dynamics for Localization of Myocardial Infarction. IEEE Trans. Biomed. Eng. 2013, 60, 2325–2331. [Google Scholar] [CrossRef]
- Arif, M.; Malagore, I.A.; Afsar, F.A.; Minhas, F.U.A.A. Detection and Localization of Myocardial Infarction using K-nearest Neighbor Classifier. J. Med Syst. 2010, 36, 279–289. [Google Scholar] [CrossRef]
- Sadao, F.; Kiyasu, S. Application of Feature Extraction Scheme to the Discrimination of Electrocardiogram. IEE Trans. Jpn. 2001, 121, 725–730. [Google Scholar]
- De Chazel, P.; Reilly, R. A Comparison of the ECG Classification Performance of Different Feature Sets. In Proceedings of the Computers in Cardiology 2000, Vol.27 (Cat. 00CH37163), Cambridge, MA, USA, 6 August 2002; pp. 327–330. [Google Scholar]
- Strodthoff, N.; Strodthoff, C. Detecting and Interpreting Myocardial Infarction Using Fully Convolutional Neural Networks. Physiol. Meas. 2019, 40, 015001. [Google Scholar] [CrossRef] [Green Version]
- Kligfield, P.; Gettes, L.S.; Bailey, J.J.; Childers, R.; Deal, B.J.; Hancock, E.W.; Van Herpen, G.; Kors, J.A.; Macfarlane, P.; Mirvis, D.M.; et al. Recommendations for the Standardization and Interpretation of the Electrocardiogram. J. Am. Coll. Cardiol. 2007, 49, 1109–1127. [Google Scholar] [CrossRef] [Green Version]
- Kabakci, G.; Yildirir, A.; Yildiran, L.; Batur, M.K.; Cagrikul, R.; Onalan, O.; Tokgozoglu, L.; Oto, A.; Ozmen, F.; Kes, S. The Diagnostic Value of 12-Lead Electrocardiogram in Predicting Infarct-Related Artery and Right Ventricular Involvement in Acute Inferior Myocardial Infarction. Ann. Noninvasive Electrocardiol. 2006, 6, 229–235. [Google Scholar] [CrossRef]
- Yang, H.; Bukkapatnam, S.T.; Komanduri, R. Nonlinear Adaptive Wavelet Analysis of Electrocardiogram Signals. Phys. Rev. E 2007, 76, 026214. [Google Scholar] [CrossRef] [PubMed]
- Bui, C.; Pham, N.; Vo, A.; Tran, A.; Nguyen, A.; Le, T. Time Series Forecasting for Healthcare Diagnosis and Prognostics with the Focus on Cardiovascular Diseases. In 6th International Conference on the Development of Biomedical Engineering in Vietnam (BME6), Proceeding of the International Conference on the Development of Biomedical Engineering in Vietnam, 27-29 June, Ho Chi Minh, Vietnam; Springer: Singapore, 2017; pp. 809–818. [Google Scholar]
- Dawson, D.; Yang, H.; Malshe, M.; Bukkapatnam, S.T.S.; Benjamin, B.; Komanduri, R. Linear Affine Transformations Between 3-Lead (Frank XYZ Leads) Vectorcardiogram and 12-Lead Electrocardiogram Signals. J. Electrocardiol. 2009, 42, 622–630. [Google Scholar] [CrossRef] [PubMed]
- Goldberger, A.L.; Amaral, L.A.N.; Glass, L.; Hausdorff, J.M.; Ivanov, P.C.; Mark, R.G.; Mietus, J.E.; Moody, G.B.; Peng, C.-K.; Stanley, H.E. PhysioBank, PhysioToolkit, and PhysioNet. Circulation 2000, 101, e215–e220. [Google Scholar] [CrossRef] [Green Version]
- Ravichandran, L.; Harless, C.; Shah, A.J.; Wick, C.A.; McClellan, J.H.; Tridandapani, S. Novel Tool for Complete Digitization of Paper Electrocardiography Data. IEEE J. Transl. Eng. Health Med. 2013, 1, 1800107. [Google Scholar] [CrossRef] [PubMed]
- Digitization Workflow. Available online: http://wiki.cvrgrid.org/index.php/Digitization_Workflow (accessed on 15 June 2020).
- Takens, F. Detecting Strange Attractors in Turbulence. In Dynamical Systems and Turbulence, Warwick 1980; Rand, D., Young, L.S., Eds.; Springer: Berlin/Heidelberg, Germany, 1981; pp. 366–381. [Google Scholar]
- Cheng, C.; Sa-Ngasoongsong, A.; Beyca, O.; Le, T.Q.; Yang, H.; Kong, Z.J.; Bukkapatnam, S.T.S. Time Series Forecasting for Nonlinear and Non-stationary Processes: A Review and Comparative Study. IIE Trans. 2015, 47, 1053–1071. [Google Scholar] [CrossRef]
- Le, T.Q.; Cheng, C.; Sangasoongsong, A.; Wongdhamma, W.; Bukkapatnam, S.T.S. Wireless Wearable Multisensory Suite and Real-Time Prediction of Obstructive Sleep Apnea Episodes. IEEE J. Transl. Eng. Health Med. 2013, 1, 2700109. [Google Scholar] [CrossRef]
- Bukkapatnam, S.T.S.; Kumara, S.R.; Lakhtakia, A.; Srinivasan, P. The Neighborhood Method and Its Coupling with the Wavelet Method for Signal Separation of Chaotic Signals. Signal Process 2002, 82, 1351–1374. [Google Scholar] [CrossRef]
- Han, H.; Wang, W.Y.; Mao, B.H. Borderline-SMOTE: A new over-sampling method in imbalanced data sets learning. In Advances in Intelligent Computing, Proceeding of the International Conference on Intelligent Computing, Hefei, China, 23–26 August 2005; Springer: Berlin/Heidelberg, Germany, 2005; Volume 3644, pp. 878–887. [Google Scholar]
- Silla, C.; Freitas, A. A survey of Hierarchical Classification across Different Application Domains. Data Min. Knowl. Discov. 2010, 22, 31–72. [Google Scholar] [CrossRef]
- Sawant, A.C.; Narra, S.R.; Mills, P.K.; Srivatsa, S. Prognostic Value of Frontal QRS-T Angle in Predicting Survival after Primary Percutaneous Coronary Revascularisation/coronary Artery Bypass Grafting for STEMI. J. Am. Coll. Cardiol. 2013, 61, E97. [Google Scholar] [CrossRef] [Green Version]
- Philips Healthcare. Improving ECG Auality: Application Note. 2008. Available online: https://philipsproductcontent.blob.core.windows.net/assets/20170523/f2fc03ac224d4d5bb6aaa77c0151ac70.pdf (accessed on 20 June 2020).
- Yang, H.; Bukkapatnam, S.T.S.; Le, T.Q.; Komanduri, R. Identification of Myocardial Infarction (MI) using Spatio-temporal Heart Dynamics. Med. Eng. Phys. 2012, 34, 485–497. [Google Scholar] [CrossRef]


| Feature Groups | Feature Name (No. of Features) | Description |
|---|---|---|
| Local Octant (I) | OctiMin (8) | Minimal vector magnitude in octant i |
| OctiAvg (8) | Average vector magnitude in octant i | |
| OctiVar (8) | Vector magnitude variance in octant i | |
| Octi1Max (8) | Amplitude of the maximal vector in octant i | |
| Octi1Elv (8) | Elevation of the maximal vector in octant i | |
| OctiAzm (8) | Azimuth of the maximal vector in octant i | |
| Octant Residence (II) | OctiNum (8) | Sojourn time of the vector in octant i |
| SlowTran | Minimal of octant transition rate in 10 s | |
| FastTran | Maximal of octant transition rate in 10 s | |
| MeanTran | Average of octant transition rate in 10 s | |
| VarTran | Variation of octant transition rate in 10 s | |
| Octant Transition (III) | InOctiRate (8) | Arrival rate to octant i from all other octants |
| OutOctiRate (8) | Departure rate from octant i to all other octants | |
| Octant Network Topology (IV) | InDgri (8) | Number of inward links to octant i |
| OutDgri (8) | Number of outward links from octant i | |
| Degri (8) | Octant i node degree | |
| InStri (8) | Sum of inward link weights to octant i | |
| OutStri (8) | Sum of outward link weights from octant i | |
| Stri (8) | Octant i node strength | |
| Clusti (8) | Clustering coefficient of octant i | |
| Jod | Number of octant with outward links > inward links | |
| Jid | Number of octant with inward links > outward links | |
| Jbl | Number of octant with inward links = outward links | |
| Rass | Assortativity coefficient of the octant network | |
| Kden | Number of octants with transitions | |
| Nden | Number of connections in the network | |
| K_den | Density of the octant network | |
| Transi | Transitivity coefficient of the network | |
| Qmod | Maximized modularity coefficient | |
| LambdaNet | Average shortest path length in the octant network | |
| EfficiencyNet | Average inverse shortest path length (Global efficiency) | |
| Ecci (8) | Greatest of all shortest path from octant i to all other octants | |
| RadiusNet | Radius of the octant network | |
| DiameterNet | Diameter of the octant network | |
| NodeBeti (8) | Node betweenness centrality of octant i |
| Characteristics | Value | Characteristics | Value |
|---|---|---|---|
| Ethnicity | Hispanic 32.1% | Systolic Blood Pressure (mmHg) | 121 ± 26.59 |
| Asian 5.7% | |||
| Caucasian 21.7% | |||
| Black 7.5% | |||
| Eastern Indian 2.8% | |||
| Unknown 30.2% | |||
| Gender | Male 66.9% | Diastolic Blood Pressure (mmHg) | 71 ± 16.26 |
| Female 33.1% | |||
| Age | 40.02 ± 14.08 | Cholesterol | 167 ± 51.38 |
| Weight (lbs) | 175.58 ± 50.02 | BMI | 28.39 ± 6.26 |
| Lead | R2 Value (Mean ± Std.) | Lead | R2 Value (Mean ± Std.) |
|---|---|---|---|
| I | 0.96 ± 0.13 | V1 | 0.95 ± 0.23 |
| II | 0.98 ± 0.08 | V2 | 0.92 ± 0.52 |
| III | 0.97 ± 0.13 | V3 | 0.96 ± 0.21 |
| aVR | 0.95 ± 0.31 | V4 | 0.96 ± 0.24 |
| aVL | 0.92 ± 0.47 | V5 | 0.95 ± 0.17 |
| aVF | 0.96 ± 0.16 | V6 | 0.96 ± 0.08 |
| Models | Level in the Hierarchy Model | |||
|---|---|---|---|---|
| HC vs. MI | LR vs. E | LCA vs. RCA | LAD vs. LCX | |
| CART | 97.41 ± 2.44 | 83.03 ± 9.71 | 77.42 ± 5.18 | 83.34 ± 0.0 |
| SVM | 91.07 ± 4.46 | 89.41 ± 9.89 | 88.2 ± 11.6 | 93.67 ± 4.89 |
| KNN | 88.4 ± 0.75 | 84.57 ± 2.96 | 84.58 ± 3.52 | 88.89 ± 1.65 |
| NN | 85.75 ± 2.89 | 89.5 ± 4.37 | 76.13 ± 15.08 | 87.57 ± 6.92 |
| BET | 91.3 ± 0.69 | 77.73 ± 2.66 | 64.01 ± 6.59 | 84.49 ± 3.88 |
© 2020 by the authors. Licensee MDPI, Basel, Switzerland. This article is an open access article distributed under the terms and conditions of the Creative Commons Attribution (CC BY) license (http://creativecommons.org/licenses/by/4.0/).
Share and Cite
Le, T.Q.; Chandra, V.; Afrin, K.; Srivatsa, S.; Bukkapatnam, S. A Dynamic Systems Approach for Detecting and Localizing of Infarct-Related Artery in Acute Myocardial Infarction Using Compressed Paper-Based Electrocardiogram (ECG). Sensors 2020, 20, 3975. https://doi.org/10.3390/s20143975
Le TQ, Chandra V, Afrin K, Srivatsa S, Bukkapatnam S. A Dynamic Systems Approach for Detecting and Localizing of Infarct-Related Artery in Acute Myocardial Infarction Using Compressed Paper-Based Electrocardiogram (ECG). Sensors. 2020; 20(14):3975. https://doi.org/10.3390/s20143975
Chicago/Turabian StyleLe, Trung Q., Vibhuthi Chandra, Kahkashan Afrin, Sanjay Srivatsa, and Satish Bukkapatnam. 2020. "A Dynamic Systems Approach for Detecting and Localizing of Infarct-Related Artery in Acute Myocardial Infarction Using Compressed Paper-Based Electrocardiogram (ECG)" Sensors 20, no. 14: 3975. https://doi.org/10.3390/s20143975