Modified Fixed Wall Oedometer When Considering Stress Dependence of Elastic Wave Velocities


1
School of Civil, Environmental and Architectural Engineering, Korea University, Seoul 02841, Korea
2
School of Agricultural Civil & Bio-Industrial Engineering, Kyungpook National University, Daegu 41566, Korea
3
Department of Civil Engineering, Chonnam National University, Gwangju 61186, Korea
*
Author to whom correspondence should be addressed.
Sensors 2020, 20(21), 6291; https://doi.org/10.3390/s20216291
Submission received: 19 September 2020
/
Revised: 23 October 2020
/
Accepted: 2 November 2020
/
Published: 5 November 2020
(This article belongs to the Special Issue Emerging Characterization of Geomaterials Using Advanced Geo-Sensors)
Abstract
:A modified oedometer cell for measuring the applied stresses and elastic waves at the top and bottom of the specimen is developed to evaluate the effect of the side friction on the stress dependence of the elastic wave velocities. In the modified cell, two load cells are installed at the top and bottom plates, respectively. To generate and detect the compressional and shear waves, a pair of piezo disk elements and a pair of bender elements are mounted at both the top and bottom plates. Experimental results show that the stresses measured at the bottom are smaller than those measured at the top during the loading and vice versa during unloading, regardless of the densities and heights of the specimens. Under nearly saturated conditions, the compressional wave velocities remain almost constant for the entire stress state. With plotting stresses measured at top, the shear wave velocities during unloading are greater than those during loading, whereas with plotting stresses measured at bottom, the shear wave velocities during unloading are smaller than those during loading owing to the side friction. The vertical effective stress may be simply determined from the average values of the stresses measured at the top and bottom of the specimens.
1. Introduction
The compression of soil is typically assumed to be one-dimensional when a vertical load is applied to the soil covering a large area. To simulate the one-dimensional condition, a one-dimensional compression test is widely conducted using an oedometric cell in the laboratory [1]. The time dependent stress–strain relationship under the zero-lateral strain condition (i.e., K0 condition) provides various deformation parameters of the soil.
Although many standards (e.g., ASTM D2435, BS 1377-part5, and DS/CEN ISO/TS 17892-5) suggest that the minimum ratio of the specimen diameter to height (D/H) should be 2.5 to minimize the side friction effect, specially designed large oedometers are often used for research purposes or for testing materials including large-sized granular materials, organic soils, municipal solid waste, mine tailings, and a mixture of soil and other materials [2,3,4,5,6,7,8]. When the elastic wave velocities are measured under one-dimensional conditions, relatively low ratio of D/H oedometric cells are applied to ensure the wave propagation length [9,10,11,12,13] because it is difficult to define the first arrival owing to the near field effect [14]. A low ratio of D/H increases the side friction, and the friction causes a lower change in the mean stress throughout the entire specimen than the change in stress at the top of the specimen.
In this study, series of experiments were conducted to explore the effect of the stress dependence on the elastic wave velocities owing to the side friction in a zero-lateral strain cell. An oedometric cell was modified to measure the applied effective stresses by installing load cells at the top and bottom of the specimen. Stress-dependent elastic wave characteristics and settlement were investigated by measuring the applied stresses at different locations.
2. Material and Methods
2.1. Test Materials
Silica sand (Kyungin Inc., Incheon, Korea) was used in this study. The specific gravity Gs for the sand (ASTM-D854) [15] was measured as 2.62. The extreme void ratios, emax and emin, were obtained as emax = 0.82 (ASTM-D4253) [16] and emin = 0.56 (ASTM-D4254) [17]. The grain size distribution indicates that the tested sand is classified as poorly graded sand, SP based on the Unified Soil Classification System (ASTM-D421) [18] with a median grain size (D50) of 0.43 mm and a coefficient of uniformity (Cu) of 1.35.
2.2. Zero-Lateral Strain Cell
A modified oedometric cell was used to measure the applied stresses at the top and bottom of the specimen while simultaneously measuring the compressional wave velocity (VP) and shear wave velocity (VS) under a zero-lateral strain condition, as shown in Figure 1. The cell has an inner diameter of 74 mm and a height of 100 mm. The electrical strain gauges (SG) with a 1.0 mm gauge length were attached to the load shaft to monitor the applied load at the top plate. A DC power supply (Agilent E3620A, Santa Clara, CA, USA) and data logger (Agilent 34972A, Santa Clara, CA, USA) were used to monitor the output voltage change of the strain gauge, which is amplified by a half-active Wheatstone bridge with two dummy gauges. Furthermore, to monitor the load at the bottom of the specimen, a load cell was installed beneath the center of the bottom plate. The gap between the wall and bottom plate was filled with vacuum grease to prevent soil from jamming within the gap. The two load cells were calibrated using the known applied stress, the results of which are shown in Figure 2. A thin layer of a lubricant was applied inside the oedometric cell to minimize the side friction between the specimen and cell.
The cell houses a pair of piezo disk elements (PDE) and a pair of bender elements (BE) at the top and bottom plates to generate and detect the compressional wave velocity VP and shear wave velocity VS, respectively. Peripheral electronics consist of a signal generator (Agilent 33500B, Santa Clara, CA, USA), a filter-amplifier (Krohn-Hite 3944), and an oscilloscope (Agilent DSO-X 3014A, Santa Clara, CA, USA) for elastic wave measurement. The elastic wave velocity can be calculated using the tip-to-tip distance between sensors Ltip-to-tip and first arrival time tarrival [14]:
2.3. Experimental Procedure
Sand specimens were prepared using a water-pluviation method and then vibrated to obtain predetermined density conditions (i.e., initial relative density Dr = ~40% and ~80%) to explore the effect of the specimen density with D/H = 1. Furthermore, two experimental cases were conducted for Dr = ~40% with D/H = 1 and 2 to assess the effect of the diameter-to-height ratio (D/H), as summarized in Table 1.
The applied vertical stress was doubled during each loading and unloading step. The maximum applied vertical stress was 640 kPa. The vertical settlements were continuously measured using an LVDT with a precision of 0.001 mm. The elastic wave velocities were measured at each step. Each loading step lasts until the vertical settlement converges to 0.001 mm/min.
3. Experimental Results and Discussions
3.1. Volume Change
The measured void ratio–stress responses are plotted in Figure 3. As shown in Figure 3, similar trends are observed even for different densities and D/H. The void ratio gradually decreases with increasing applied vertical stresses. As shown in Figure 3, the measured stresses at the bottom show lower values than those measured at the top during the loading and vice versa during the unloading because the friction acts in the opposite direction of the applied load [19]. Previous studies reported that the high stress loss that occurs from friction is found either in the lower plasticity and/or over-consolidated clay (i.e., high stiffness specimen) because of higher interface friction [19,20]. Similarly, the specimen with a high Dr shows relatively high stress hysteresis at the given D/H ratio i.e., D/H = 1. The large stress variations measured at the top and bottom of a specimen with a low D/H ratio are also monitored. The compression index Cc and recompression index Cr, which are calculated for the average stresses, indicate that a lower compressibility is observed: (1) for a higher density specimen under the same D/H; and (2) for a low D/H ratio specimen under the same Dr owing to side friction.
3.2. Elastic Wave Velocity
At low frequencies, which are of engineering interest and where soil particles are assumed incompressible (i.e., in the case Gassmann’s equation is valid), VP can be expressed as a function of shear modulus G, bulk modulus of the solid skeleton Kb, and total density ρ [21,22,23]:
where n is the porosity and B is the pore pressure coefficient. ρs and ρf indicate the densities of grain and fluid, respectively. Figure 4 shows the compressional wave velocity VP for the specimen of Dr = 80% and D/H = 1. As indicated in Figure 4, an almost constant value of VP (~1420 m/s) is observed with stress. Note that the compressional wave velocity of pure water is approximately 1480 m/s. Yang [22] proposed that the values of B and VP can be determined as a function of degree of saturation. When the Poisson’s ratio ν is assumed to be 0.3, the calculated value of B is 0.952 based on the measured VP = 1420 m/s, which indicates that the specimen was nearly saturated. In nearly saturated sand, the influence of the effective stress on VP is relatively small [24,25]. The experimental results also imply that the measured VP is rarely affected by a change in the effective stress in nearly saturated soils [22,26]. Note that similar results are observed for other experimental cases.
The velocity–stress relationship for the shear wave for any degree of saturation can be simply expressed as a power function of the mean effective stress (σ′m) in the direction of the wave propagation and in the direction of the particle motion [27,28,29] as follows:
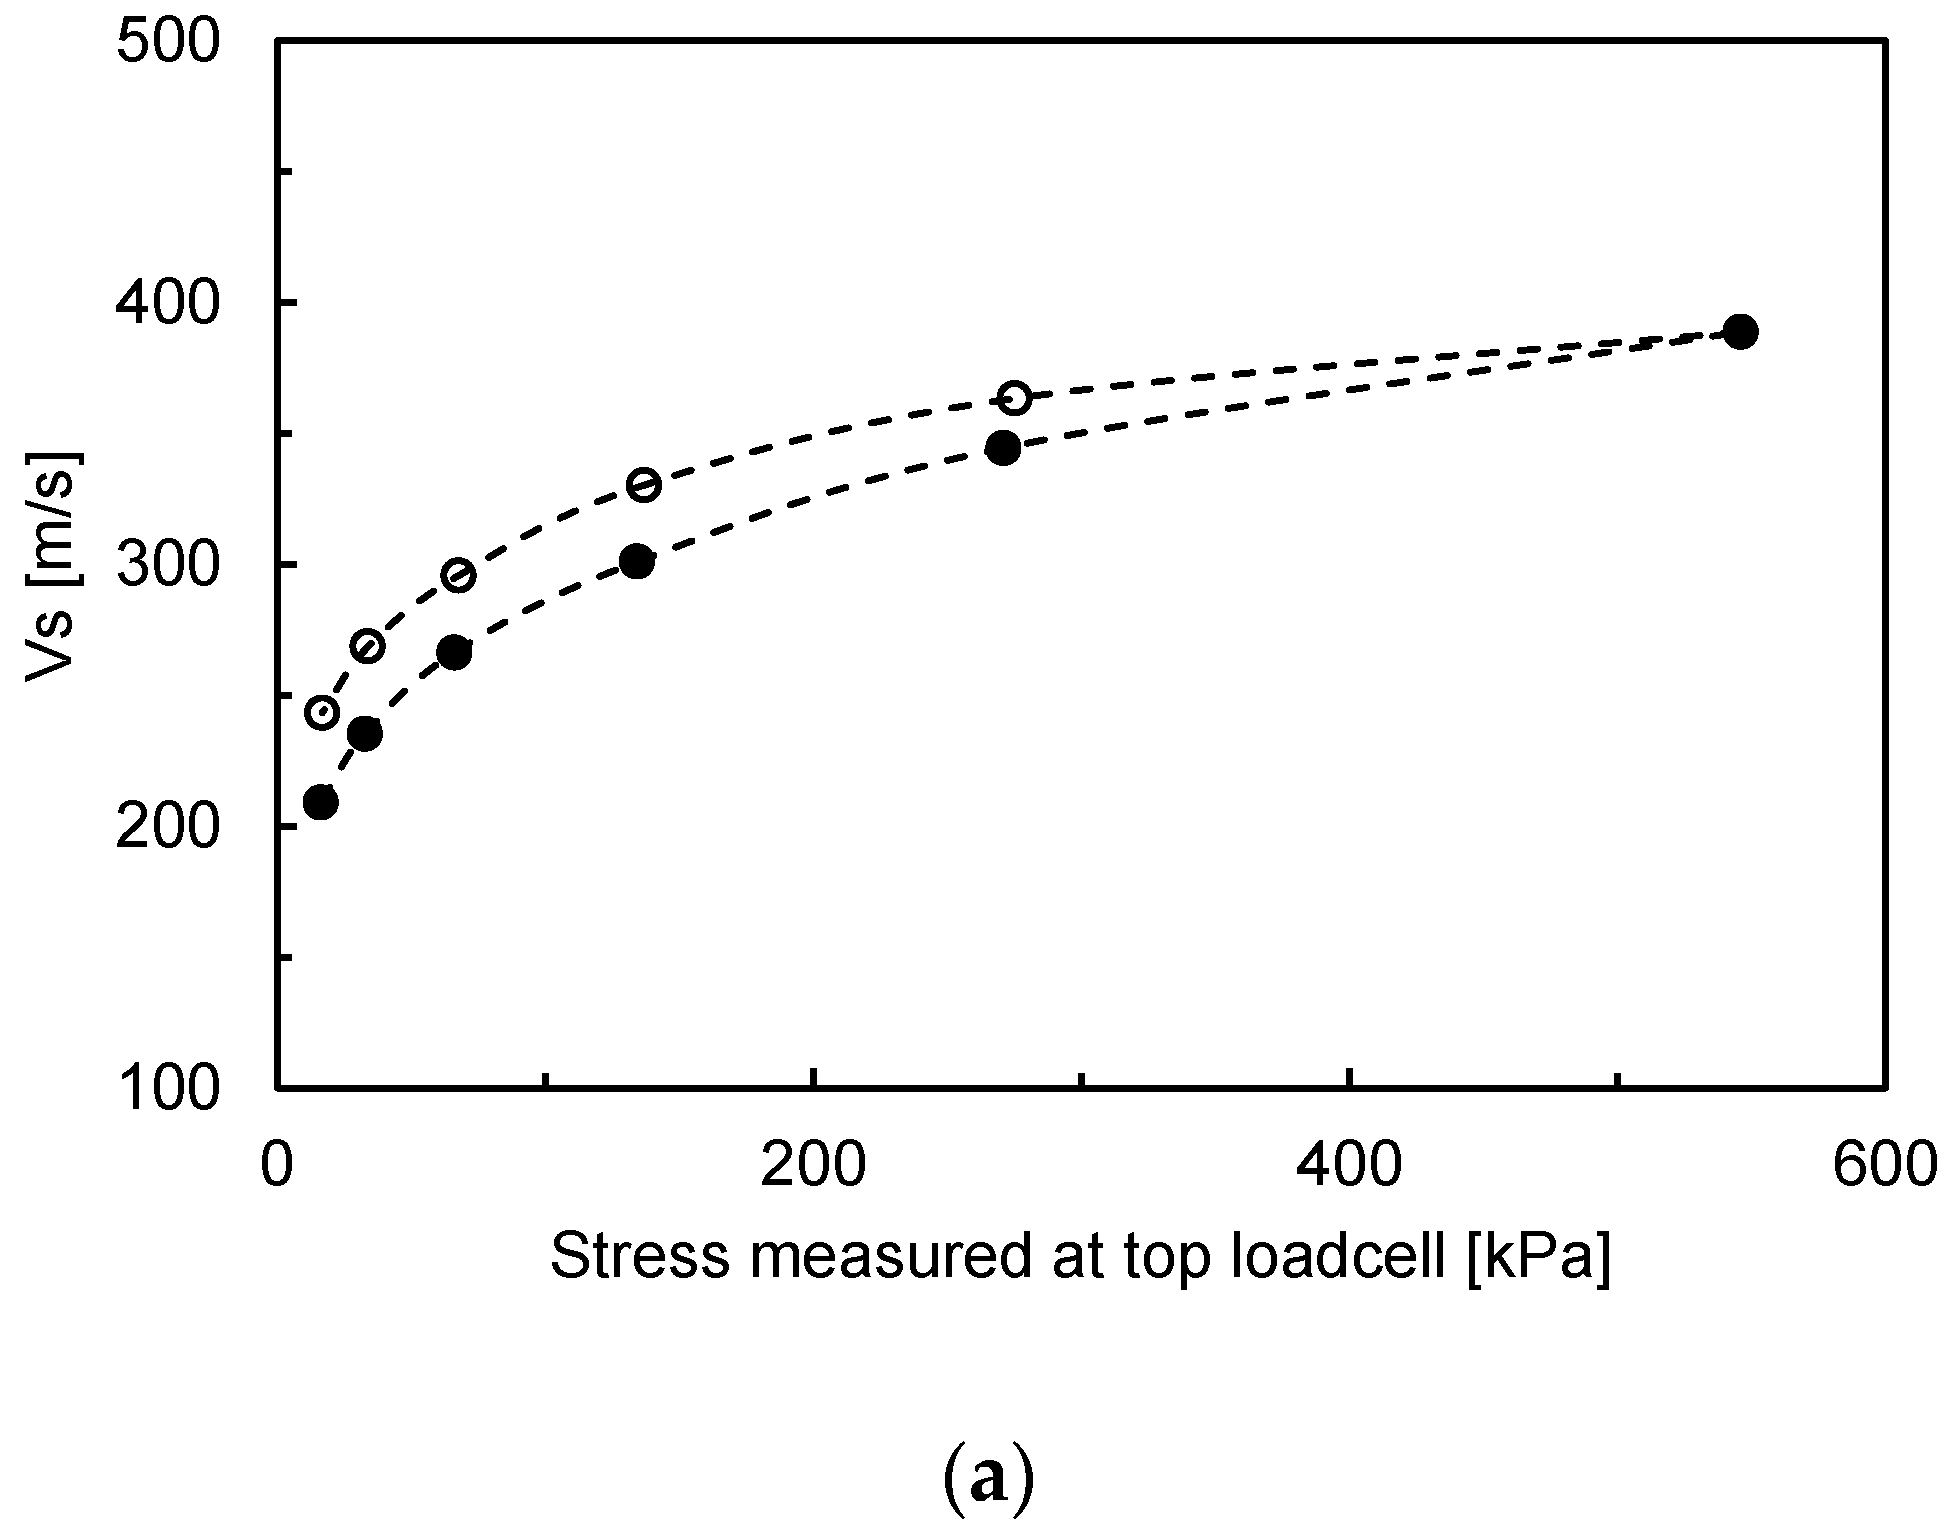
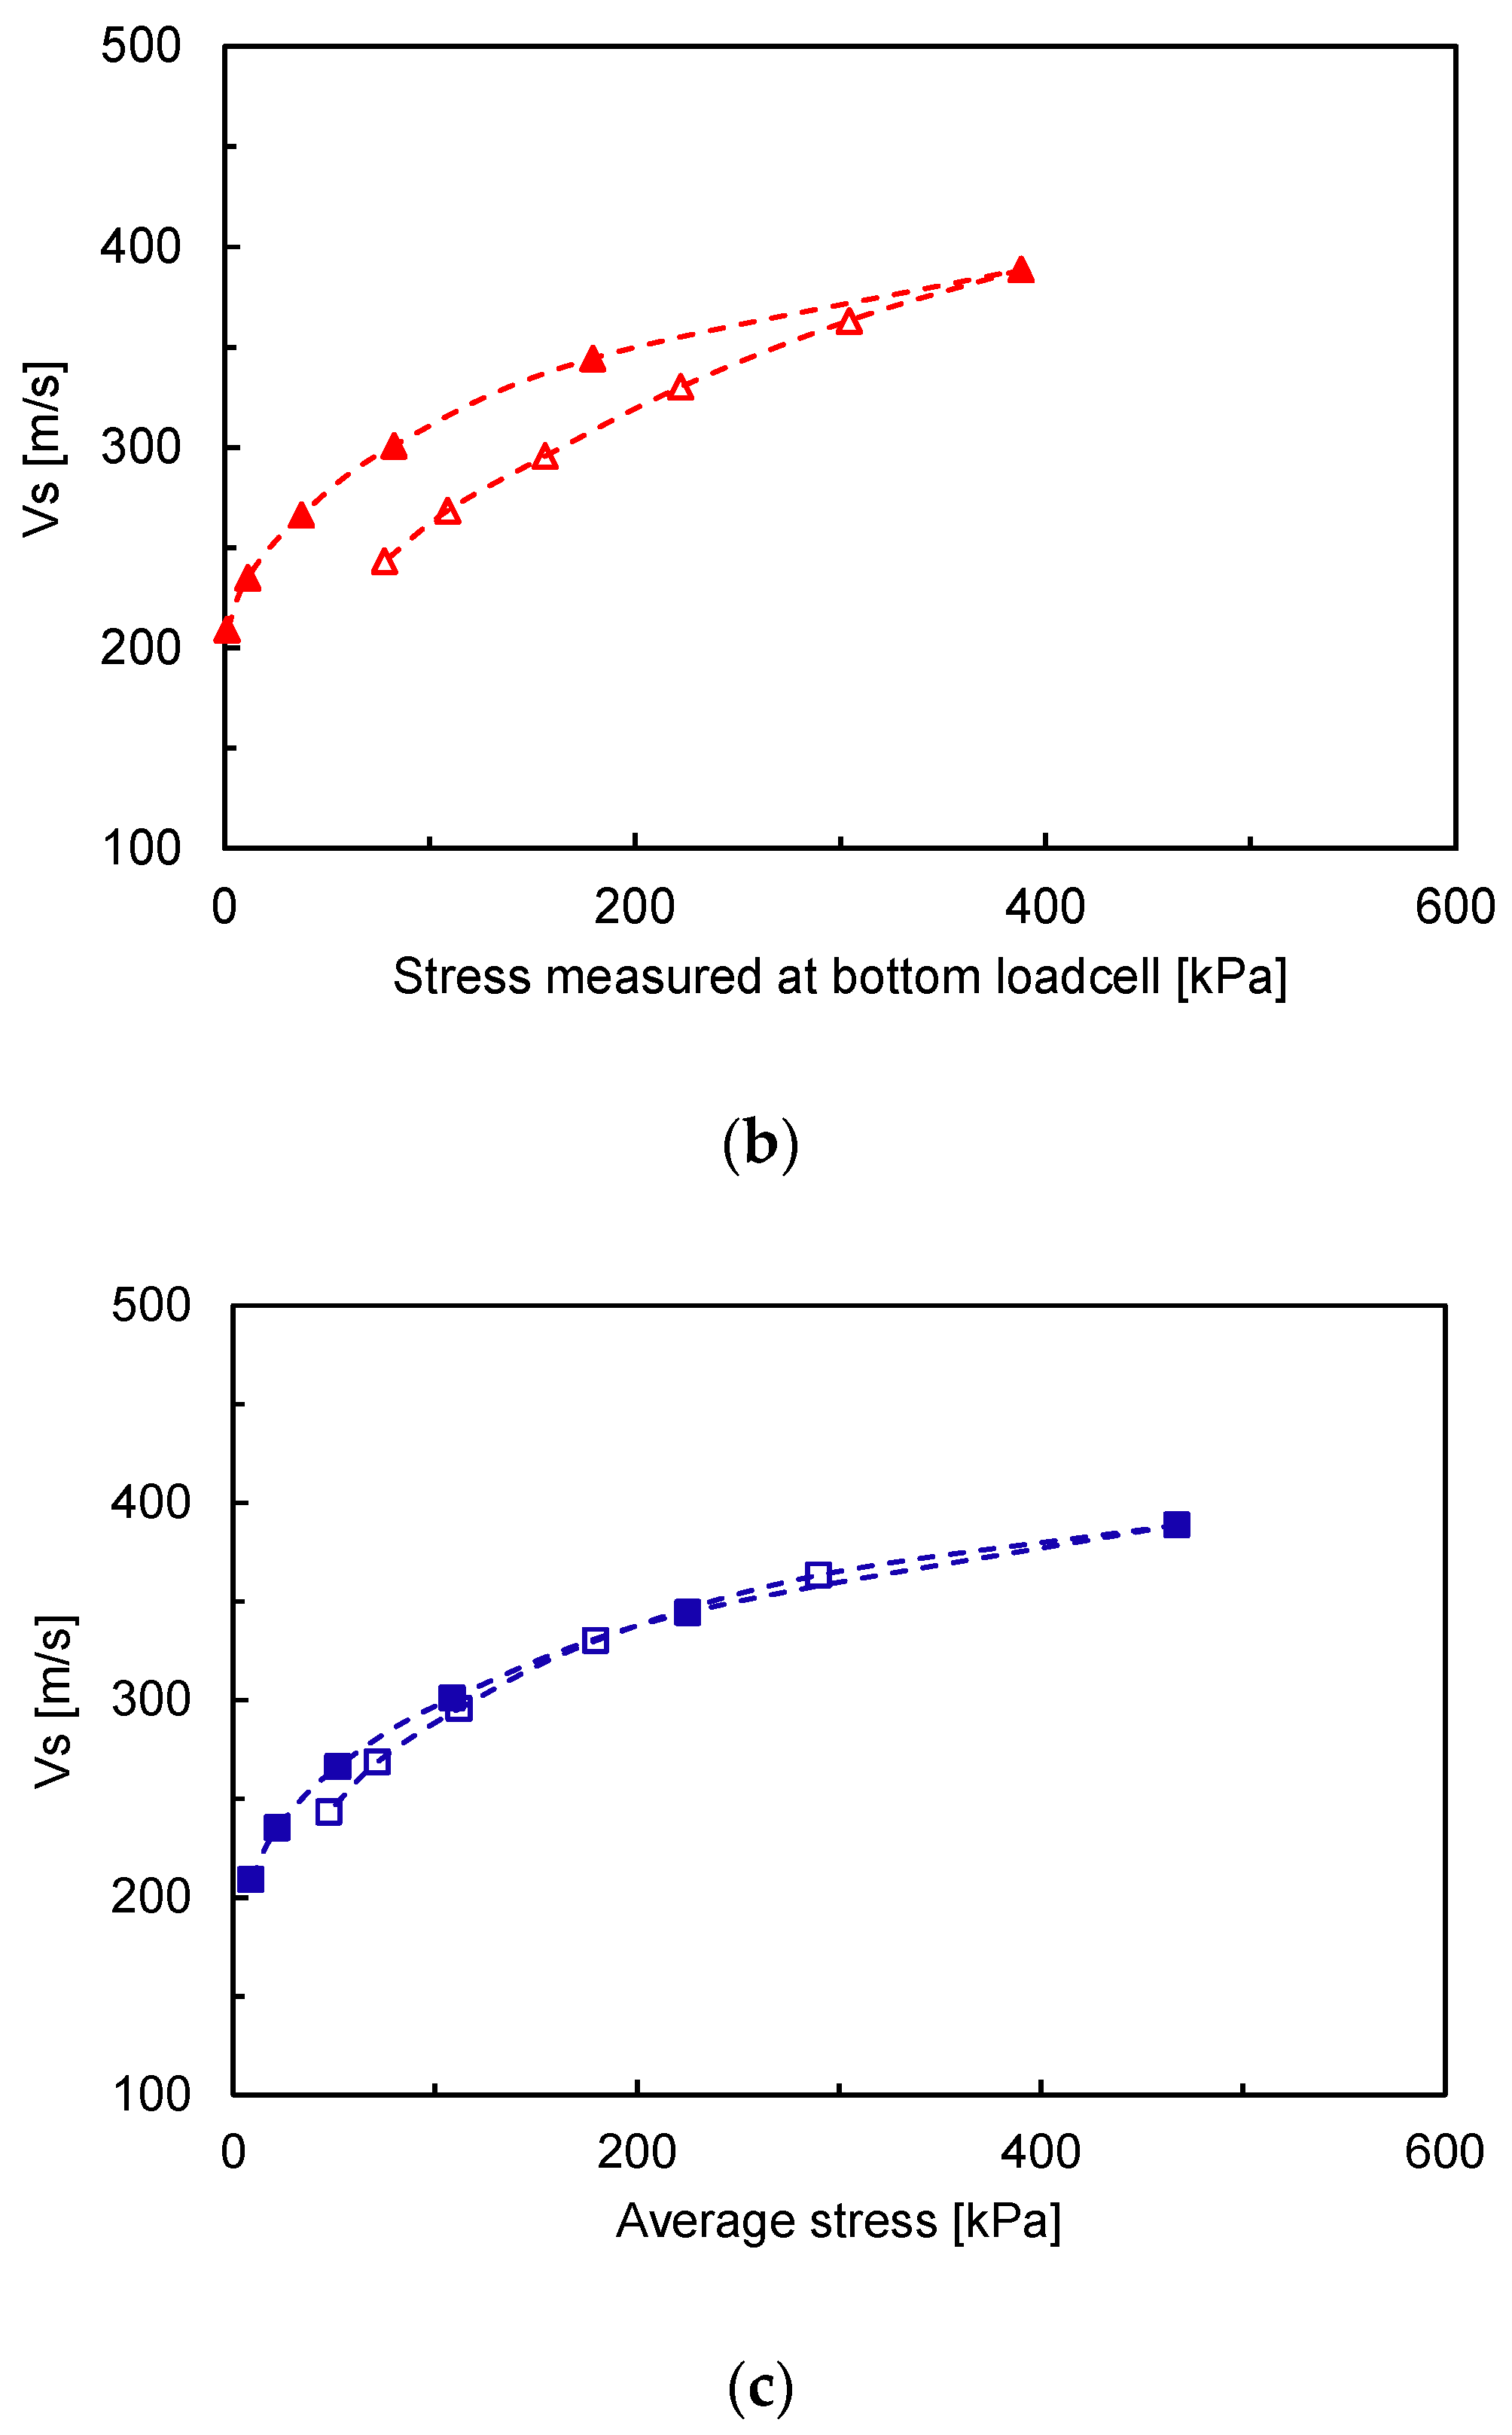
where both α and β are experimentally determined. The α factor denotes the wave velocity at 1 kPa, and the β exponent indicates the stress sensitivity of the wave velocity. Note that Equation (4) is valid the stress-induced skeletal forces control the behavior of the media [30]. Figure 5 shows the measured shear wave velocity vs. for various stresses measured at different locations. The measured shear wave velocities for all specimens generally increase with increases in the vertical effective stress: With plotting the effective stress measured at the top, the values of vs. calculated during unloading are higher than those calculated during loading, whereas with plotting the effective stress monitored at the bottom, the values of vs. calculated during loading are higher than those calculated during unloading. When the measured vs. is plotted with the average vertical effective stress calculated from the top and bottom measurements, similar values of vs. are observed during the loading and unloading. Note that similar trends are observed for other specimens. When a fixed wall oedometric cell is used, the vertical effective stress applied at top of the specimen is not uniformly distributed but decreases with depth owing to the upward wall friction. Although the reduction in the actual effective stress applied in the whole specimen depends on the stress level, it was reported that the friction ratio of the wall friction to the applied stress is almost constant with the applied stress after a yield point (e.g., preconsolidation stress) [31,32]. Note that the friction ratio is approximately 10% of the applied stress [32]. As shown in Equation (4), the stress dependence of vs. can be defined with the mean normal effective stress on the polarization plane. To precisely establish the stress dependence of VS, the distribution of the vertical and horizontal effective stresses when considering the stress reduction should be known when a pair of bender elements is installed at the top and bottom of the specimen. The vertical effective stress within the specimen consists of the self-weight of the specimen and the applied stress at top. Lovisa and Sivakugan [33] reported that the applied stress governs the vertical effective stress within the specimen for small diameters such as cells used in a laboratory with maintaining D/H = 1, and, in general, it governs the vertical effective stress with the specimen when the applied stress is larger than approximately 20 kPa. Some researchers have suggested the theoretical distribution of the vertical effective stress corrected with the side friction of the cell [31,33]; however, the soil–wall resistance of the cell should be measured to determine the exact distribution of the vertical effective stress. Therefore, the vertical effective stress within the specimen when considering the side friction of the cell for a small oedometric cell can be simply and approximately determined based on the average values calculated based on the effective stresses measured at the top and bottom of the specimens. This is because both values indicate the maximum and minimum effective stresses of the specimen, respectively, assuming a linear distribution of the soil–cell interface resistance. Note that the horizontal effective stress can be calculated based on the coefficient of the earth pressure at rest (K0), which was determined from using the K0 equation as follows:
where Φ is the internal friction angle of the soil. It is well known that the K0 equation proposed by Jaky [34] is commonly adopted to estimate the values of K0 in practice.
4. Conclusions
The modified zero-lateral strain cell was used to measure the stress-dependent geophysical properties and compressibility of the sand. The applied effective stresses were measured at the top and bottom of the specimen to investigate the side friction effect on the elastic wave velocity. The experimental results indicate that the measured compressional wave velocity (VP) is rarely affected by a change in the effective stress in the nearly saturated soils. When a pair of bender elements is installed at the top and bottom of the specimen, the stress reduction of the vertical effective stress by the side friction of the cell can be considered for precisely estimating the stress dependence of the shear wave velocity of the specimen. Although the distribution of soil–cell interface resistance is not linear along the specimen height, the vertical effective stress within the specimen for a small oedometric cell can be simply and approximately determined based on the average values calculated from the effective stresses measured at the top and bottom of the specimens.
Author Contributions
Conceptualization, J.-S.L.; methodology, G.P., Y.-H.B. and C.L.; formal analysis, J.-S.L. and G.P.; investigation, Y.-H.B. and C.L.; data curation, G.P. and Y.-H.B.; writing—original draft preparation, J.-S.L., G.P., Y.-H.B. and C.L.; supervision, J.-S.L. and C.L.; and funding acquisition, J.-S.L. All authors have read and agreed to the published version of the manuscript.
Funding
This research was supported by the Basic Science Research Program through the National Research Foundation of Korea (NRF) funded by the Ministry of Science, ICT & Future Planning (NRF-2020R1A2B5B03001470).
Conflicts of Interest
The authors declare no conflict of interest.
References
- Holtz, R.D.; Kovacs, W.D.; Sheahan, T.C. An Introduction to Geotechnical Engineering, 2nd ed.; Pearson: London, UK, 2010. [Google Scholar]
- Barnekow, U.; Paul, M. Use of special oedometer tests for the remediation of large uranium mill tailings impoundments at Wismut, Germany. Uranium Prod. Cycle Environ. 2000, 2, 386. [Google Scholar]
- Chenari, R.J.; Fard, M.K.; Maghfarati, S.P.; Pishgar, F.; Machado, S.L. An investigation on the geotechnical properties of sand–EPS mixture using large oedometer apparatus. Constr. Build. Mater. 2016, 113, 773–782l. [Google Scholar] [CrossRef]
- Karimpour-Fard, M.; Zarbakhash, S.; Soufi, G.R.; Ahadi, A.; Naveen, B.P. Design, fabrication and calibration of a tall pneumatic oedometer apparatus. Measurement 2020, 163, 107985. [Google Scholar] [CrossRef]
- Mokhtari, M.; Shariatmadari, N.; Salehzadeh, H. Design and fabrication of a large-scale oedometer. J. Cent. South Univ. 2015, 22, 931–936. [Google Scholar] [CrossRef]
- Ng, A.M.; Yeung, A.T.; Lee, P.K.; Tham, L. Design, fabrication, and assembly of a large oedometer. Geotech. Test. J. 2006, 29, 298–305. [Google Scholar]
- O’Kelly, B.C. Development of a large consolidometer apparatus for testing peat and other highly organic soils. Suoseura 2009, 60, 23–36. [Google Scholar]
- Oldecop, L.A.; Alonso, E.E. Measurement of lateral stress and friction in rockfill oedometer tests enabling the analysis of the experimental results in the p′-q space. Geotech. Test. J. 2017, 40, 822–832. [Google Scholar] [CrossRef]
- Ayala, J.L.; Villalobos, F.A.; Alvarado, G. Study of the elastic shear modulus of Bio Bio sand using bender elements in an oedometer. Geotech. Test. J. 2017, 40, 673–682. [Google Scholar] [CrossRef] [Green Version]
- Chamorro-Zurita, C.; Ovando-Shelley, E. Anisotropy of lacustrine soils in a large oedometer equipped with bender elements. Soils Found. 2020, 60, 372–383. [Google Scholar] [CrossRef]
- Dyvik, R.; Madshus, C. Lab Measurements of G max Using Bender Elements. In Advances in the Art Testing Soils Under Cyclic Conditions, Proceeding of the ASCE Convention, Detroit, MI, USA, 24 October 1985; American Society of Civil Engineers: New York, NY, USA, 1985; pp. 186–196. [Google Scholar]
- Lee, C.; Lee, J.S.; Lee, W.; Cho, T.H. Experiment setup for shear wave and electrical resistance measurements in an oedometer. Geotech. Test. J. 2008, 31, 149–156. [Google Scholar] [CrossRef]
- Zeng, X.; Ni, B. Application of bender elements in measuring G max of sand under K0 condition. Geotech. Test. J. 1998, 21, 251–263. [Google Scholar]
- Lee, J.-S.; Santamarina, J.C. Bender elements: Performance and signal interpretation. J. Geotech. Geoenviron. Eng. 2005, 131, 1063–1070. [Google Scholar] [CrossRef] [Green Version]
- ASTM-D854. Standard Test Methods for Specific Gravity of Soils by Water Pycnometer; Annual Book of ASTM Standards; ASTM: West Conshohocken, PA, USA, 2014. [Google Scholar]
- ASTM-D4253. Standard Test Methods for Maximum Index Density and Unit Weight of Soils Using a Vibratory Table; Annual Book of ASTM Standards; ASTM: West Conshohocken, PA, USA, 2006. [Google Scholar]
- ASTM-D4254. Standard Test Methods for Minimum Index Density and Unit Weight of Soils and Calculation of Relative Density; Annual Book of ASTM Standards; ASTM: West Conshohocken, PA, USA, 2006. [Google Scholar]
- ASTM-D421. Standard Practice for Dry Preparation of Soil Samples for Particle-Size Analysis and Determination of Soil Constant; Annual Book of ASTM Standards; ASTM: West Conshohocken, PA, USA, 2007. [Google Scholar]
- Lodahl, M.R.; Mortensen, N.; TrankjÊr, H. Oedometer tests with measurement of internal friction between oedometer ring and clay specimen. In Proceedings of the 17th Nordic Geotechnical Meeting, Reykjavik, Iceland, 25–28 May 2016; pp. 289–298. [Google Scholar]
- Monden, H. Characteristics of side friction in the one-dimensional consolidation test. Soils Found. 1969, 9, 11–41. [Google Scholar] [CrossRef] [Green Version]
- Biot, M.A. Theory of propagation of elastic waves in a fluid-saturated porous solid. I. Low-frequency range. J. Acoust. Soc. Am. 1956, 28, 168–178. [Google Scholar] [CrossRef]
- Yang, J. Liquefaction resistance of sand in relation to P-wave velocity. Geotechnique 2002, 52, 295–298. [Google Scholar] [CrossRef]
- Yang, J.; Sato, T. Interpretation of seismic vertical amplification observed at an array site. Bull. Seism. Soc. Am. 2000, 90, 275–285. [Google Scholar] [CrossRef]
- Bardet, J.; Sayed, H. Velocity and attenuation of compressional waves in nearly saturated soils. Soil Dyn. Earthq. Eng. 1993, 12, 391–401. [Google Scholar] [CrossRef]
- Nur, A.; Simmons, G. The effect of saturation on velocity in low porosity rocks. Earth Planet. Sci. Lett. 1969, 7, 183–193. [Google Scholar] [CrossRef]
- Emerson, M.; Foray, P. Laboratory P-wave measurements in dry and saturated sand. Acta Geotech. 2006, 1, 167–177. [Google Scholar] [CrossRef]
- Hardin, B.; Richart, J.F. Elastic wave velocities in granular soils. J. Soil Mech. Found. Div. 1963, 89, 3407. [Google Scholar]
- Roesler, S.K. Anisotropic shear modulus due to stress anisotropy. J. Geotech. Eng. Div. 1979, 105, 871–880. [Google Scholar]
- Santamarina, J.C.; Klein, A.; Fam, M.A. Soils and waves: Particulate materials behavior, characterization and process monitoring. J. Soils Sediments 2001, 1, 130. [Google Scholar] [CrossRef]
- Cha, M.; Santamarina, J.C.; Kim, H.-S.; Cho, G.-C. Small-strain stiffness, shear-wave velocity, and soil compressibility. J. Geotech. Geoenviron. Eng. 2014, 140, 06014011. [Google Scholar] [CrossRef] [Green Version]
- Kang, X.; Kang, G.-C.; Bate, B. Measurement of stiffness anisotropy in kaolinite using bender element tests in a floating wall consolidometer. Geotech. Test. J. 2014, 37, 869–883. [Google Scholar] [CrossRef]
- Sivrikaya, O.; Togrol, E. Measurement of side friction between specimen and consolidation ring with newly designed oedometer cell. Geotech. Test. J. 2006, 29, 87–94. [Google Scholar]
- Lovisa, J.; Sivakugan, N. Tall oedometer testing: Method to account for wall friction. Int. J. Geomech. 2015, 15, 04014045. [Google Scholar] [CrossRef]
- Jaky, J. The coefficient of earth pressure at rest. J. Soc. Hung. Archit. Eng. 1944, 78, 355–358. [Google Scholar]
Figure 1.
Schematic drawing of a modified oedometric cell with electronics. TL and BL denote the load cells installed at the top and bottom plates, respectively. In addition, BE and PDE denote the bender elements and piezo disk elements.
Figure 1.
Schematic drawing of a modified oedometric cell with electronics. TL and BL denote the load cells installed at the top and bottom plates, respectively. In addition, BE and PDE denote the bender elements and piezo disk elements.

Figure 2.
Calibration of load cells. Solid and hollow markers denote the loading and unloading steps, respectively.
Figure 2.
Calibration of load cells. Solid and hollow markers denote the loading and unloading steps, respectively.
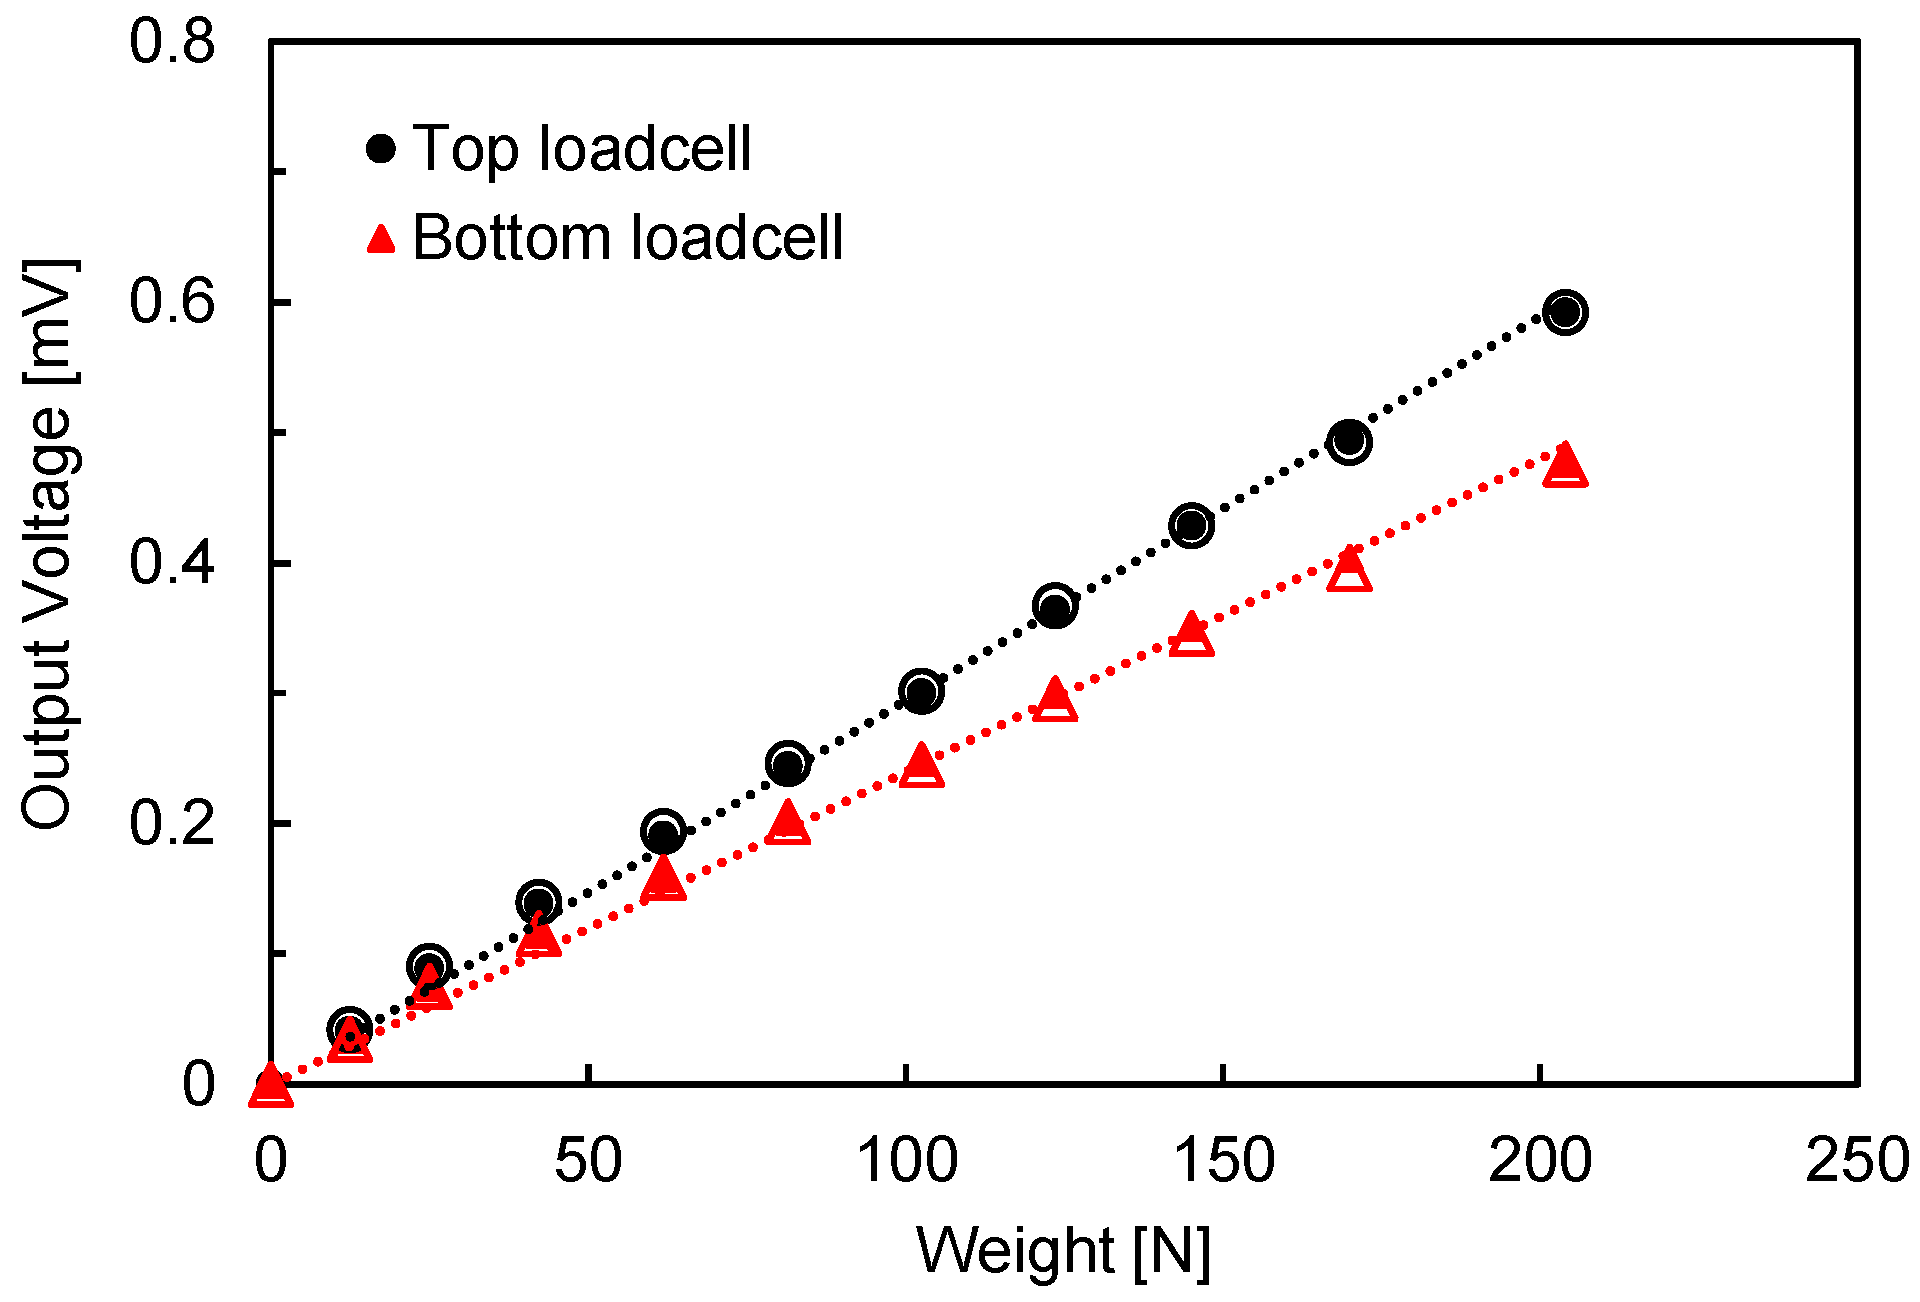
Figure 3.
Variation in void ratio along the applied stress: (a) Dr = 80% and D/H = 1; (b) Dr = 40% and D/H = 1; and (c) Dr = 40% and D/H = 2. Note that Cc and Cr are calculated based on the average stresses. Solid and hollow markers denote the loading and unloading steps, respectively.
Figure 3.
Variation in void ratio along the applied stress: (a) Dr = 80% and D/H = 1; (b) Dr = 40% and D/H = 1; and (c) Dr = 40% and D/H = 2. Note that Cc and Cr are calculated based on the average stresses. Solid and hollow markers denote the loading and unloading steps, respectively.
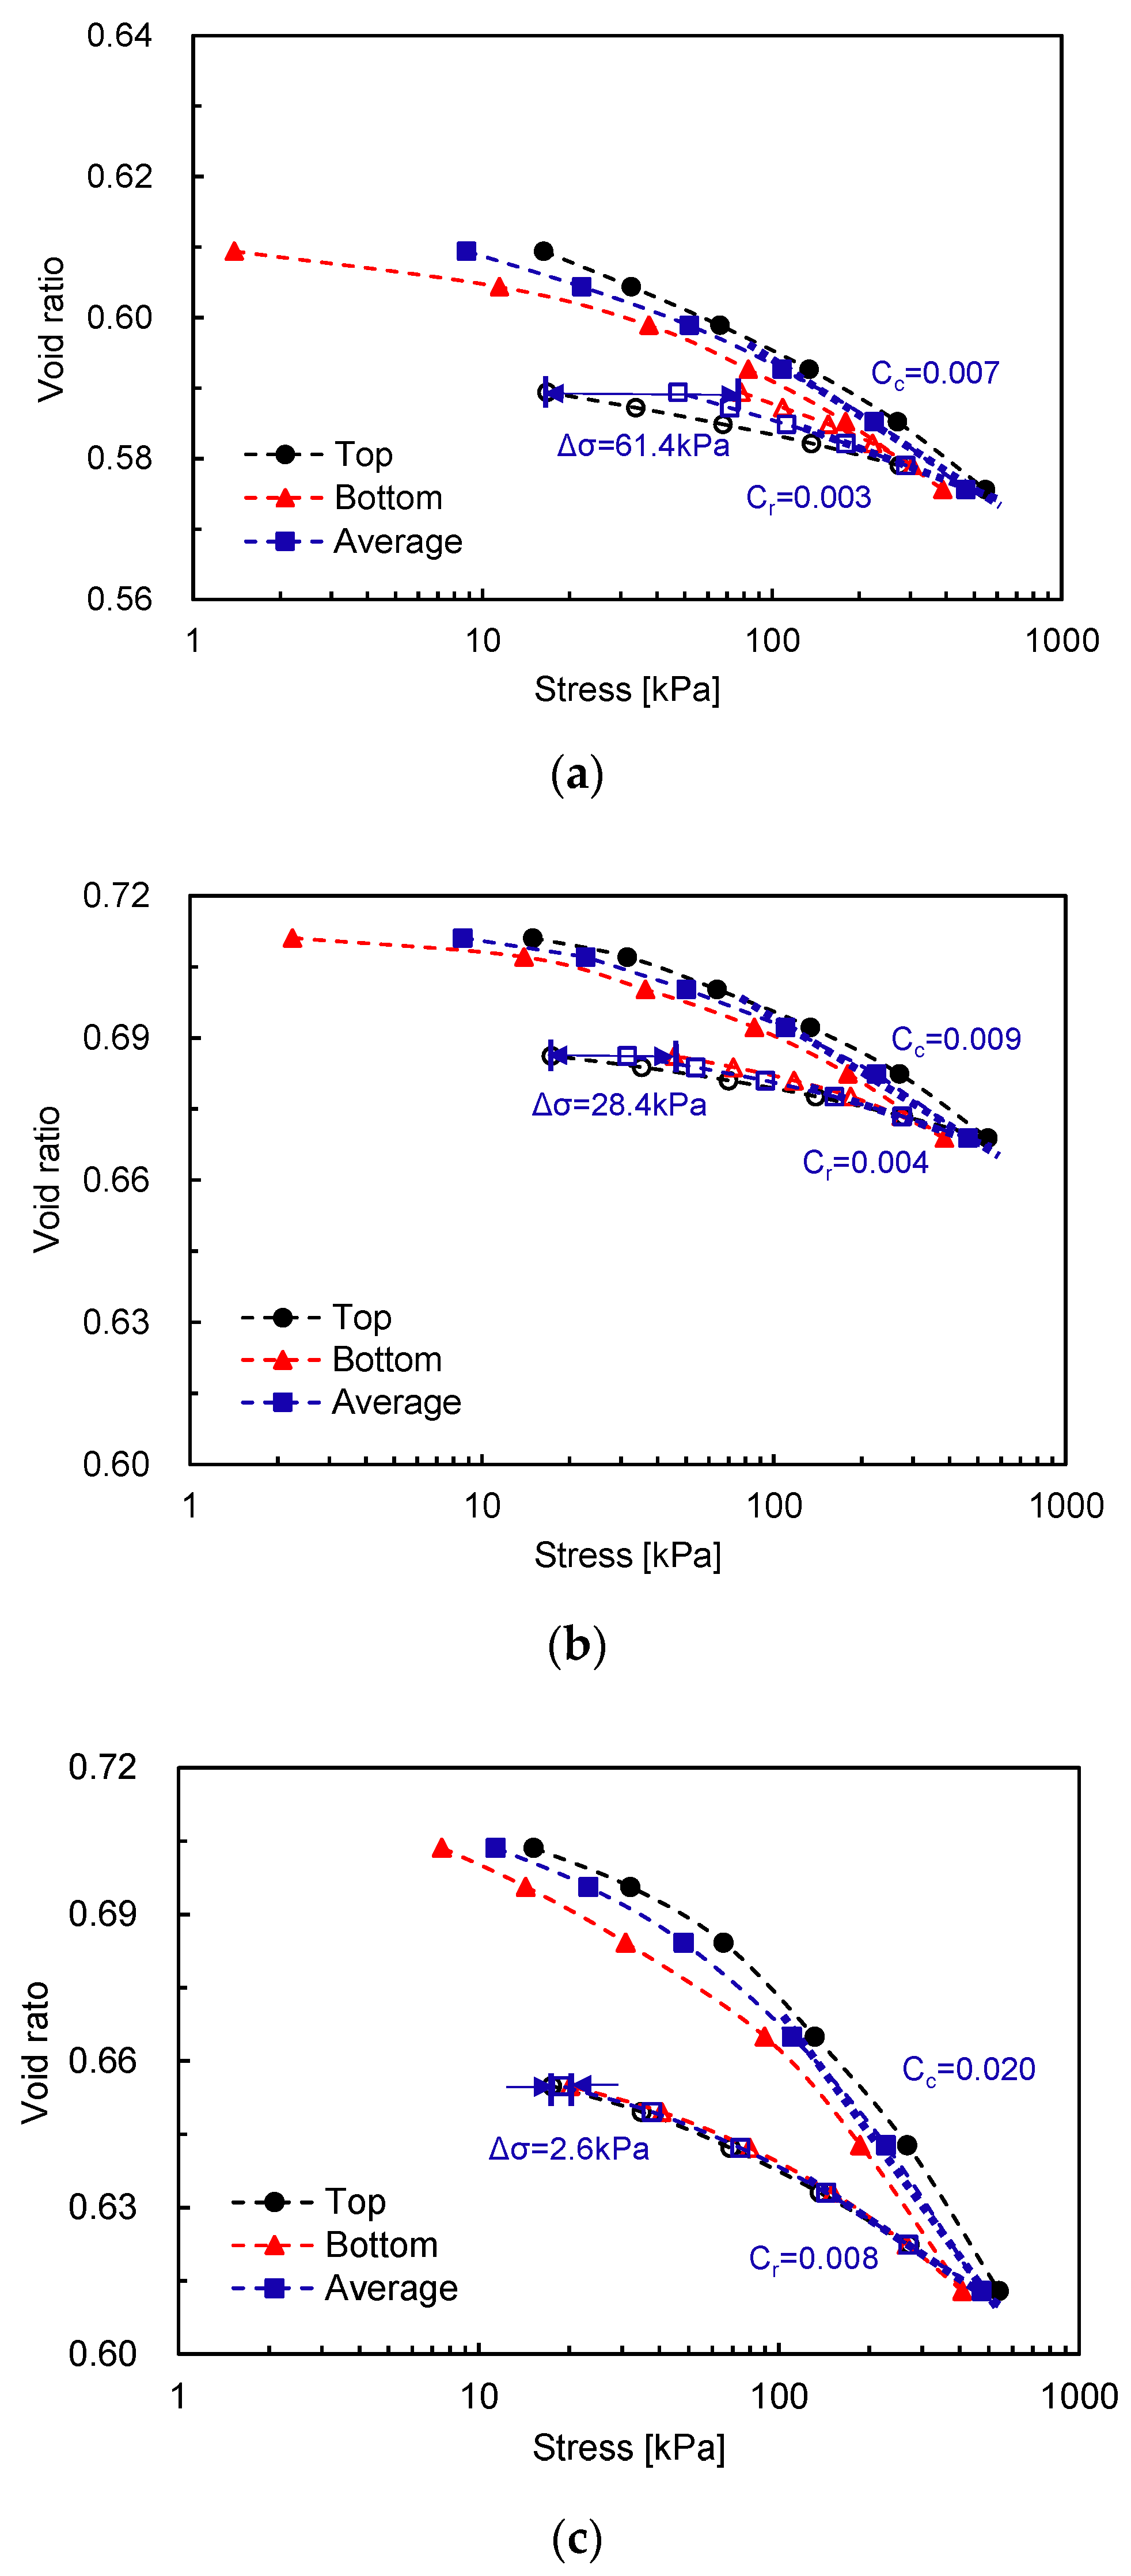
Figure 4.
Evolution of compressional wave velocity along applied stresses for Dr = 80% and D/H = 1. Solid and hollow markers denote the loading and unloading steps, respectively.
Figure 4.
Evolution of compressional wave velocity along applied stresses for Dr = 80% and D/H = 1. Solid and hollow markers denote the loading and unloading steps, respectively.
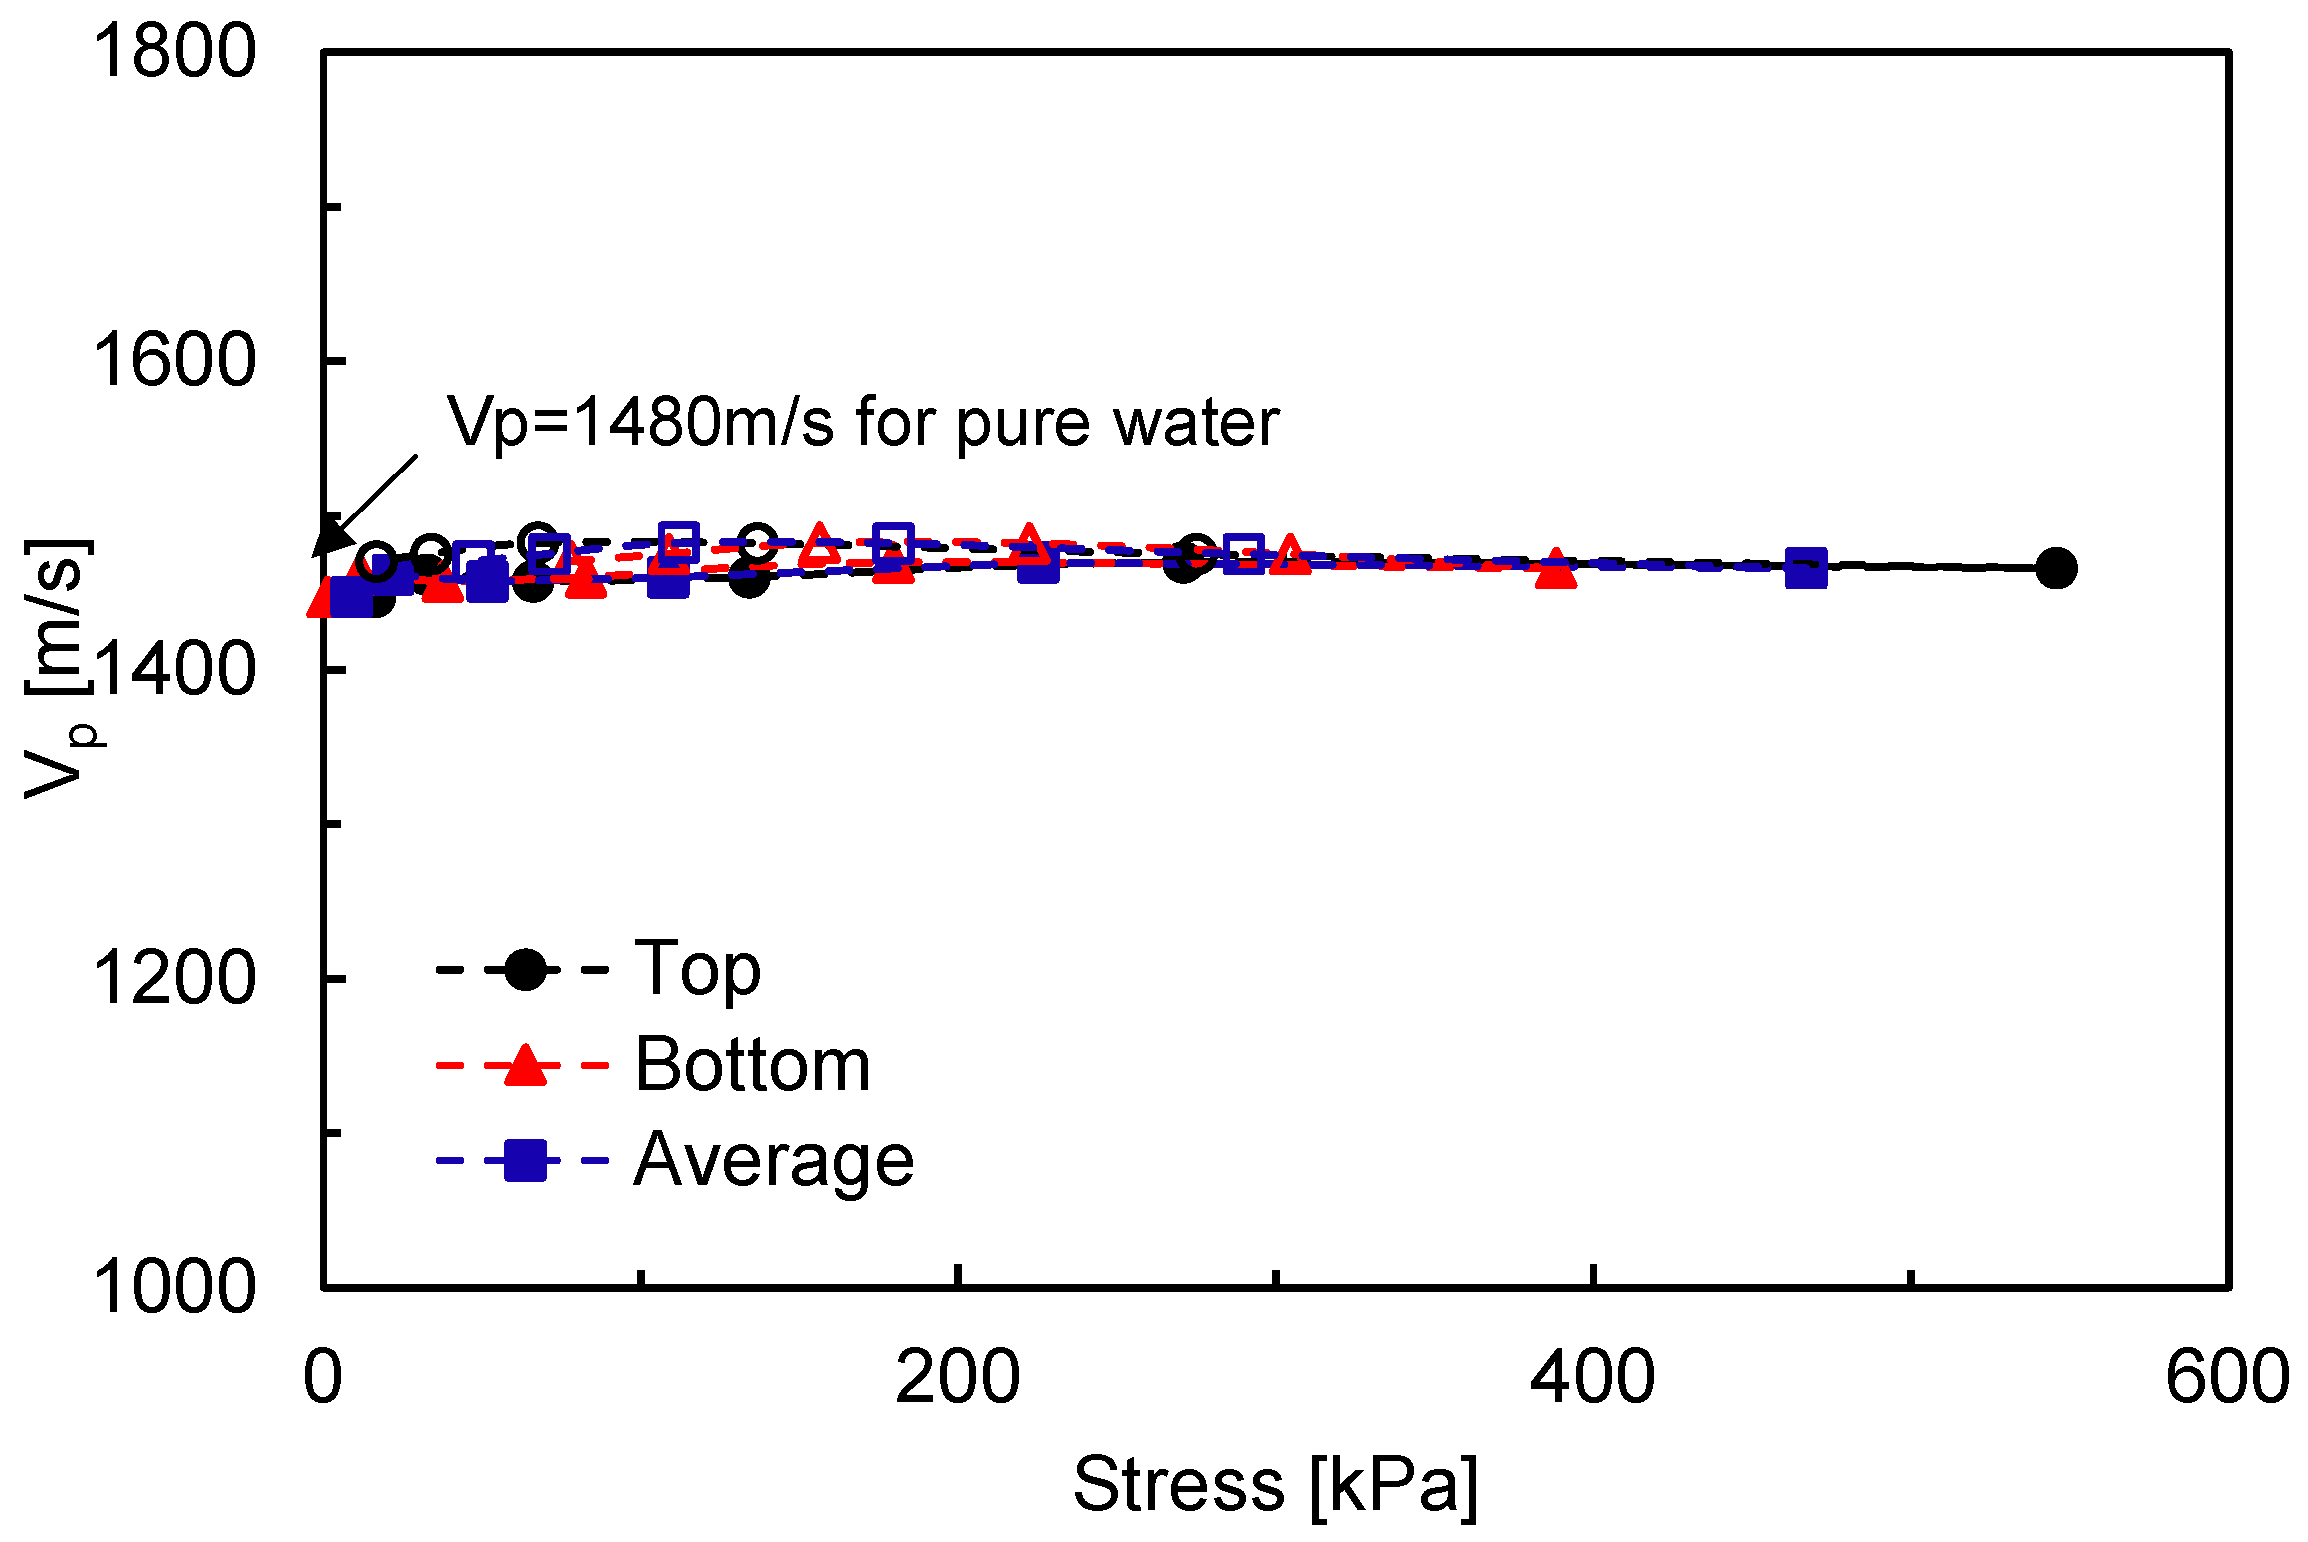
Figure 5.
Variation in shear wave velocities for Dr = 80% and D/H = 1 along: (a) the applied stress at top; (b) applied stress at the bottom; and (c) the average applied stress. The solid and hollow markers denote the loading and unloading steps, respectively.
Figure 5.
Variation in shear wave velocities for Dr = 80% and D/H = 1 along: (a) the applied stress at top; (b) applied stress at the bottom; and (c) the average applied stress. The solid and hollow markers denote the loading and unloading steps, respectively.

Table 1.
Specimen conditions tested in this study.
| No. | Relative Density (%) | Diameter-to-Height Ratio |
|---|---|---|
| 1 | 80 | 1 |
| 2 | 40 | 1 |
| 3 | 40 | 2 |
Publisher’s Note: MDPI stays neutral with regard to jurisdictional claims in published maps and institutional affiliations. |
© 2020 by the authors. Licensee MDPI, Basel, Switzerland. This article is an open access article distributed under the terms and conditions of the Creative Commons Attribution (CC BY) license (http://creativecommons.org/licenses/by/4.0/).
Share and Cite
MDPI and ACS Style
Lee, J.-S.; Park, G.; Byun, Y.-H.; Lee, C. Modified Fixed Wall Oedometer When Considering Stress Dependence of Elastic Wave Velocities. Sensors 2020, 20, 6291. https://doi.org/10.3390/s20216291
AMA Style
Lee J-S, Park G, Byun Y-H, Lee C. Modified Fixed Wall Oedometer When Considering Stress Dependence of Elastic Wave Velocities. Sensors. 2020; 20(21):6291. https://doi.org/10.3390/s20216291
Chicago/Turabian StyleLee, Jong-Sub, Geunwoo Park, Yong-Hoon Byun, and Changho Lee. 2020. "Modified Fixed Wall Oedometer When Considering Stress Dependence of Elastic Wave Velocities" Sensors 20, no. 21: 6291. https://doi.org/10.3390/s20216291
Note that from the first issue of 2016, this journal uses article numbers instead of page numbers. See further details here.