Development of a Portable All-Wavelength PPG Sensing Device for Robust Adaptive-Depth Measurement: A Spectrometer Approach with a Hydrostatic Measurement Example


Abstract
:1. Introduction
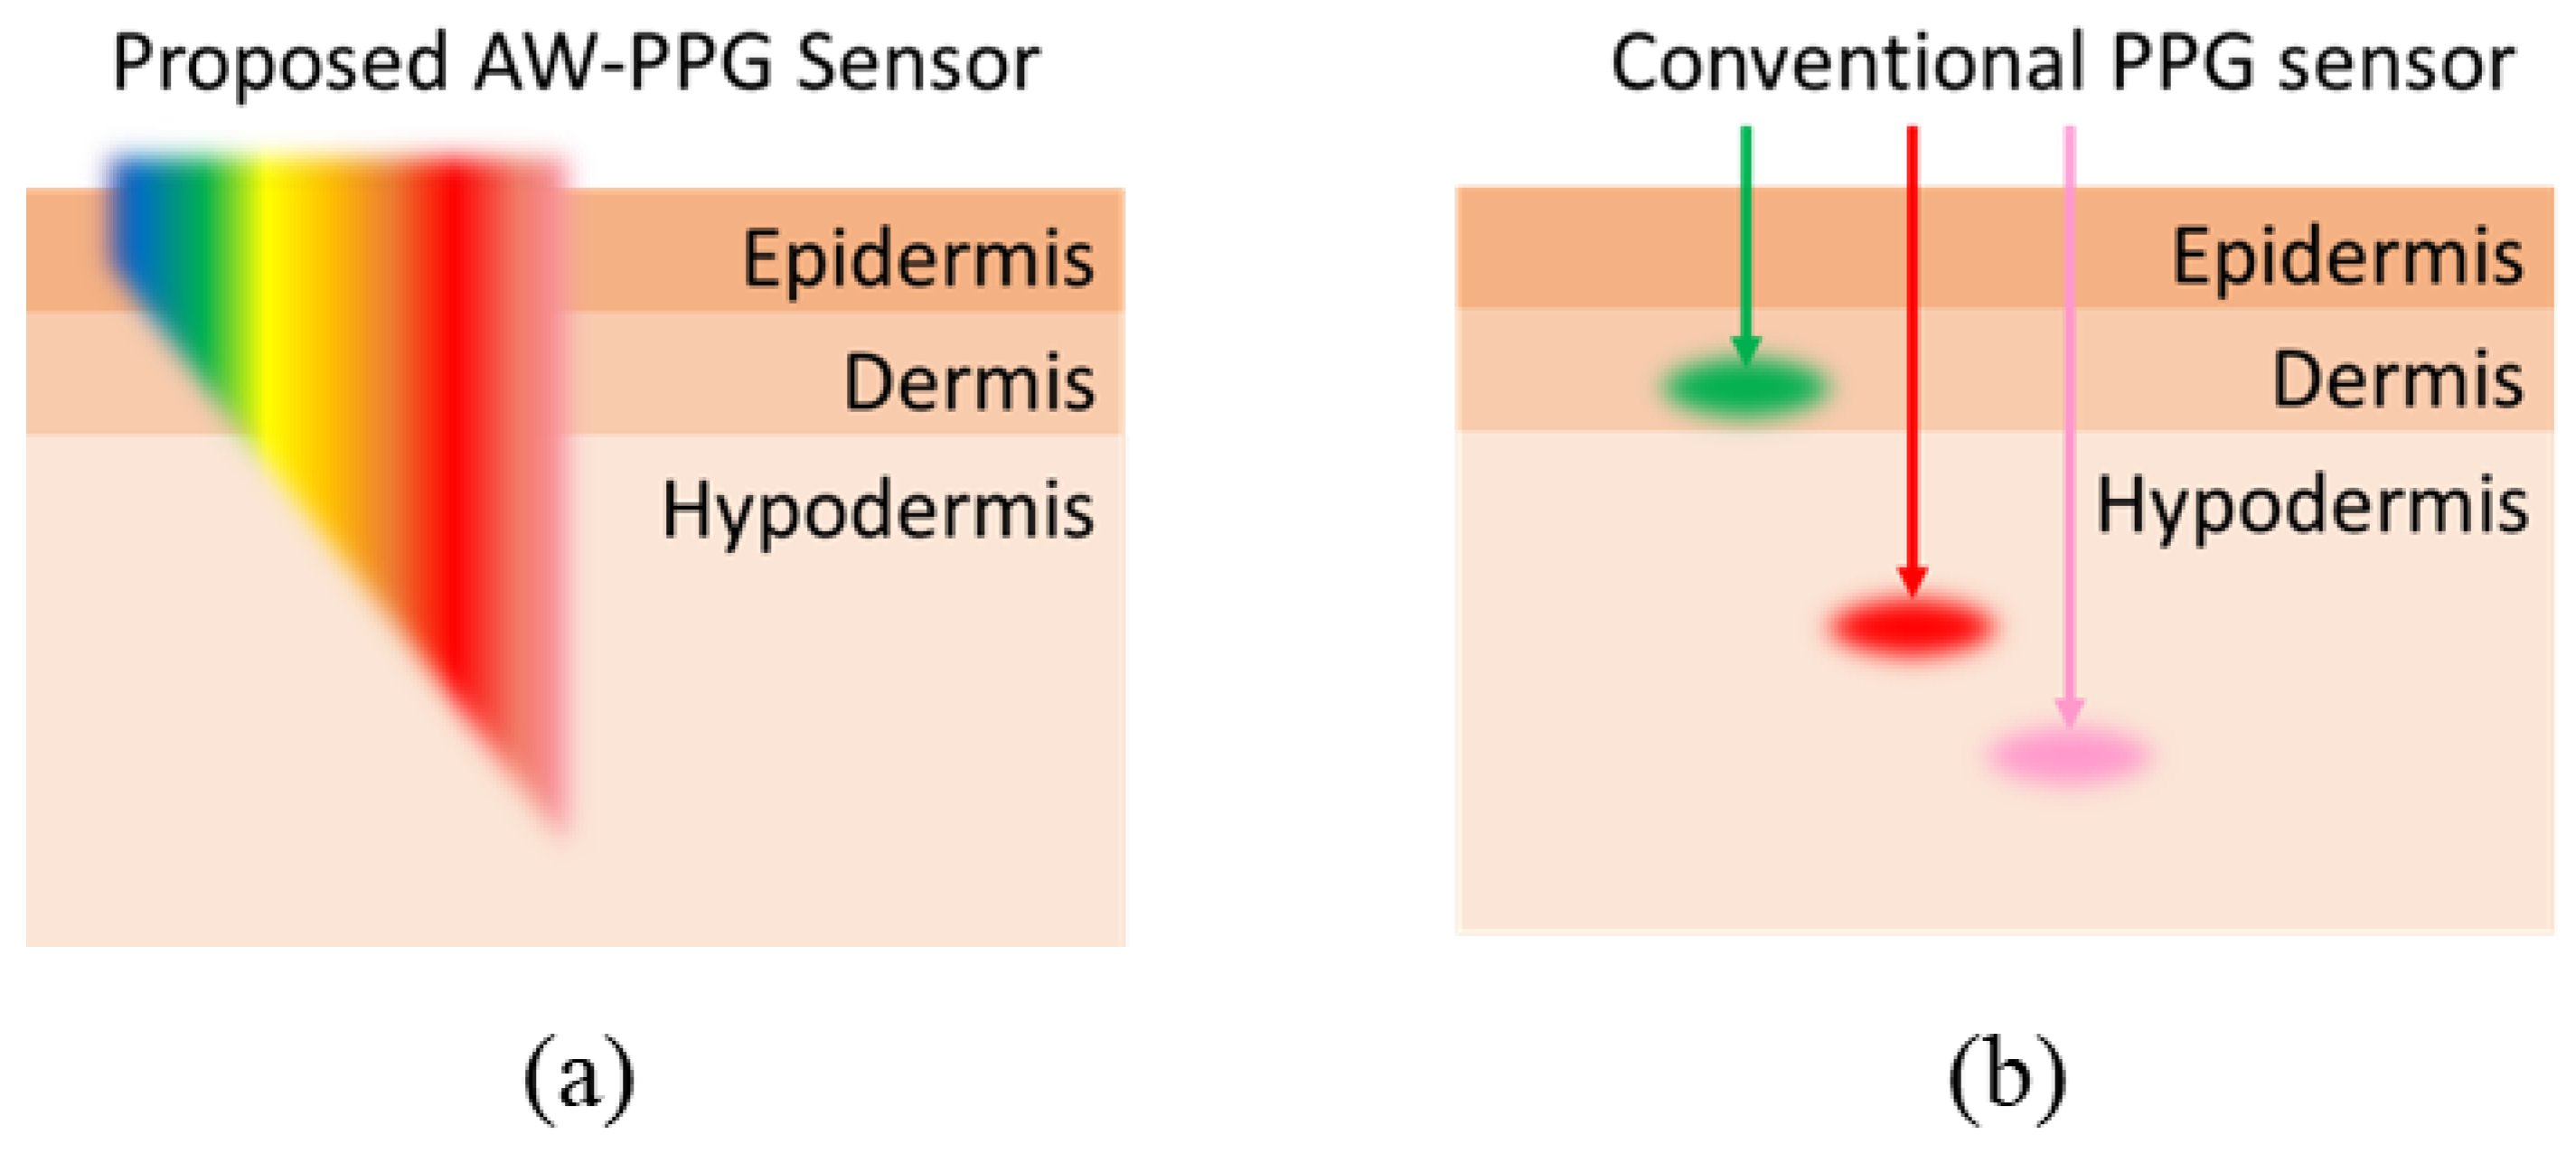
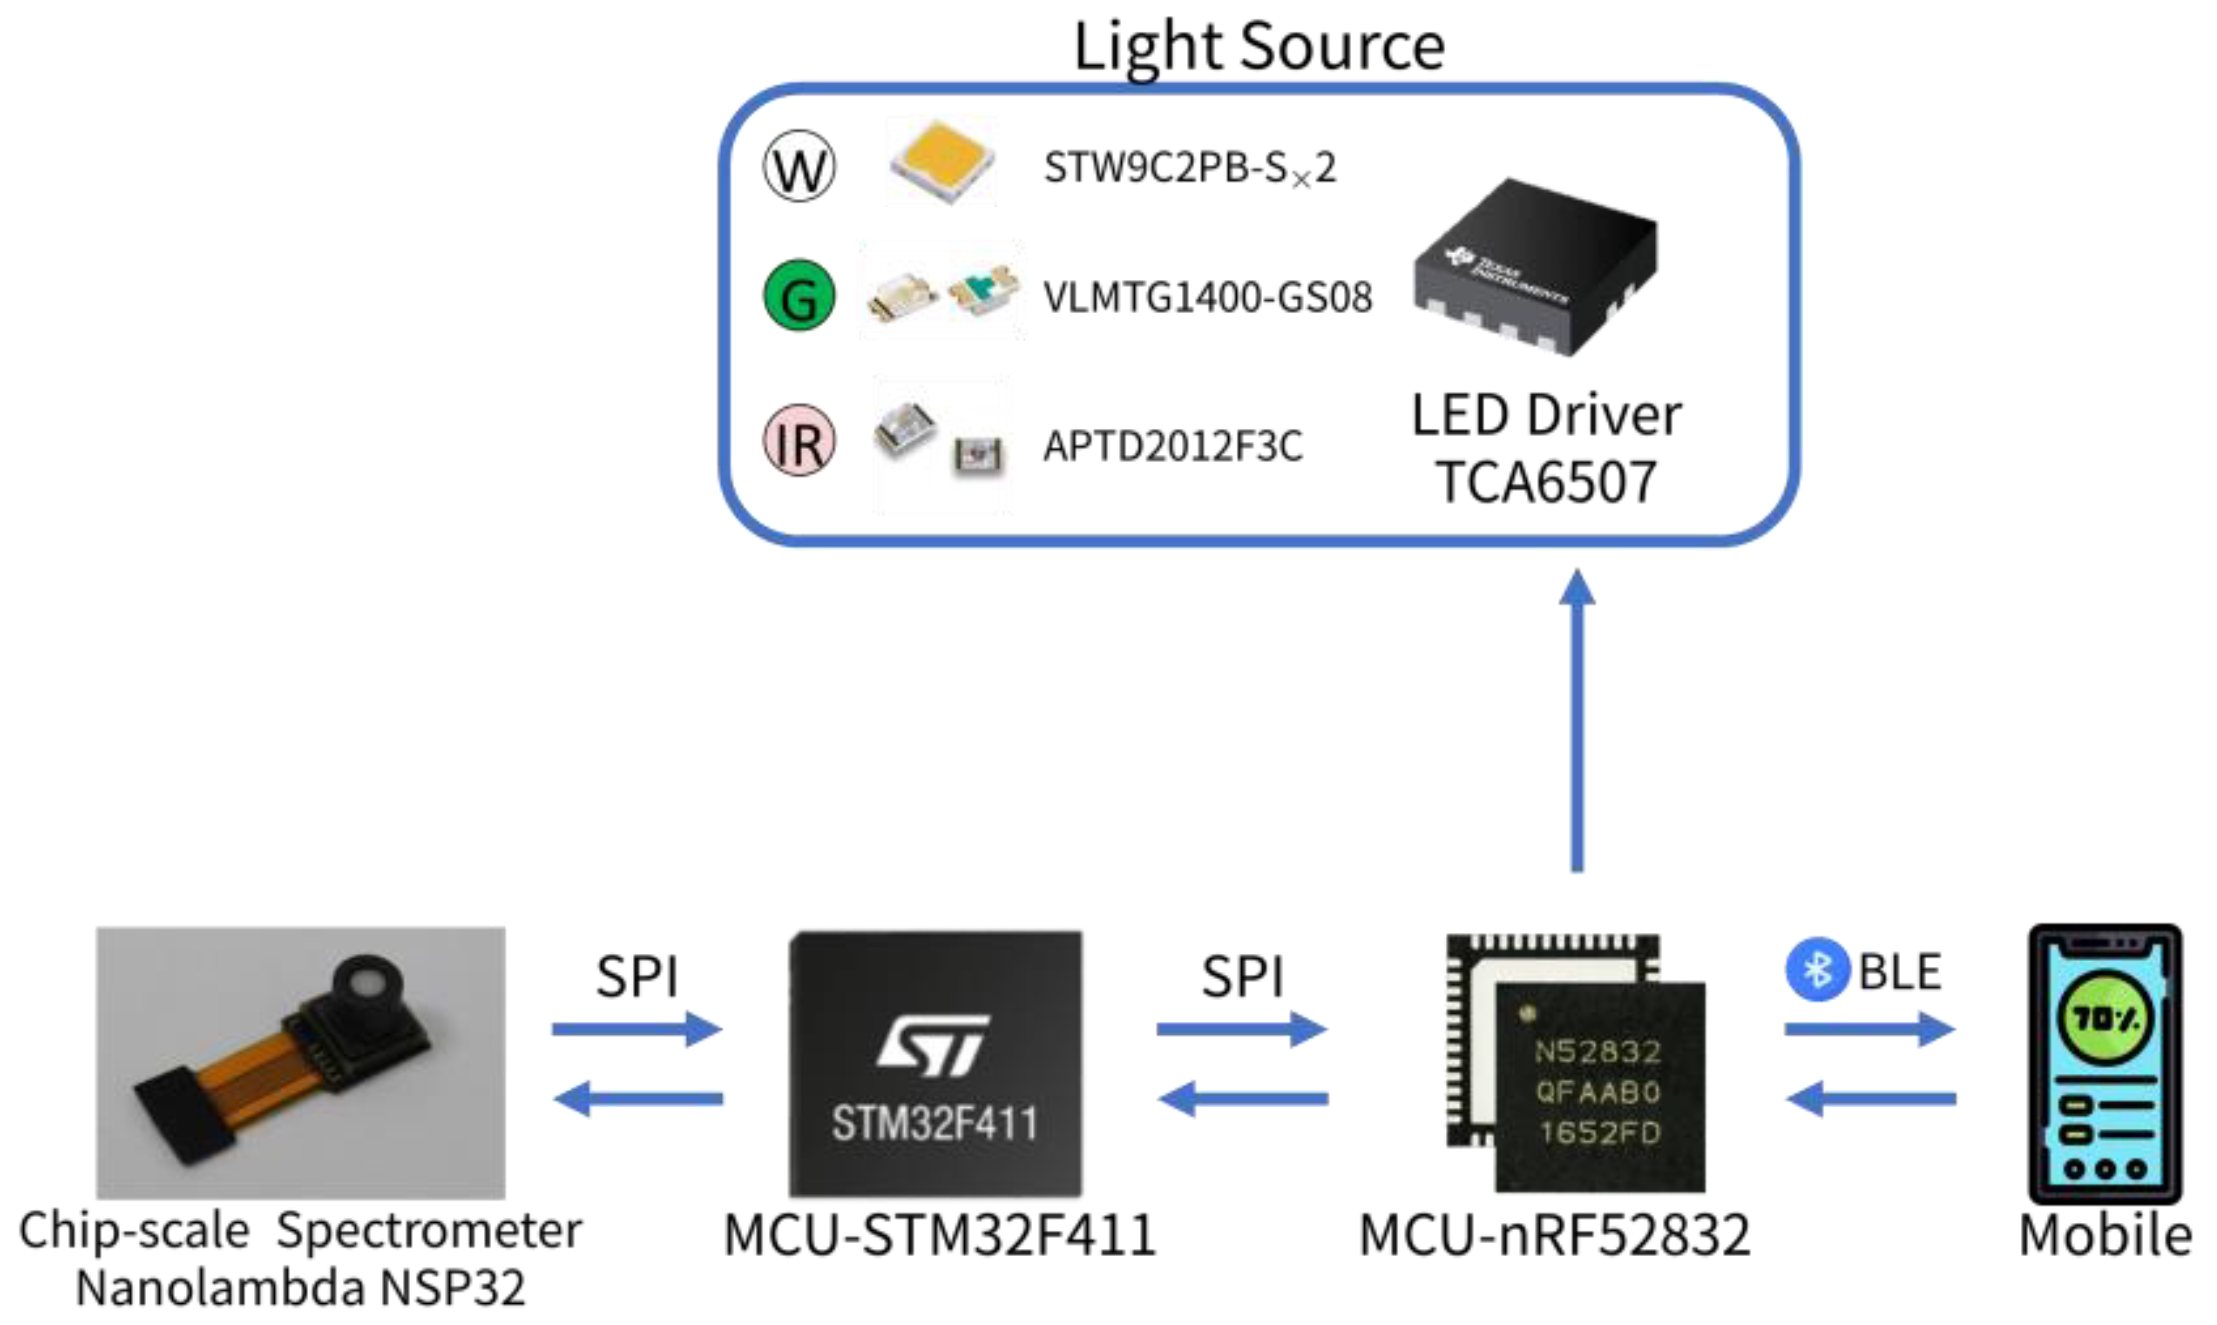
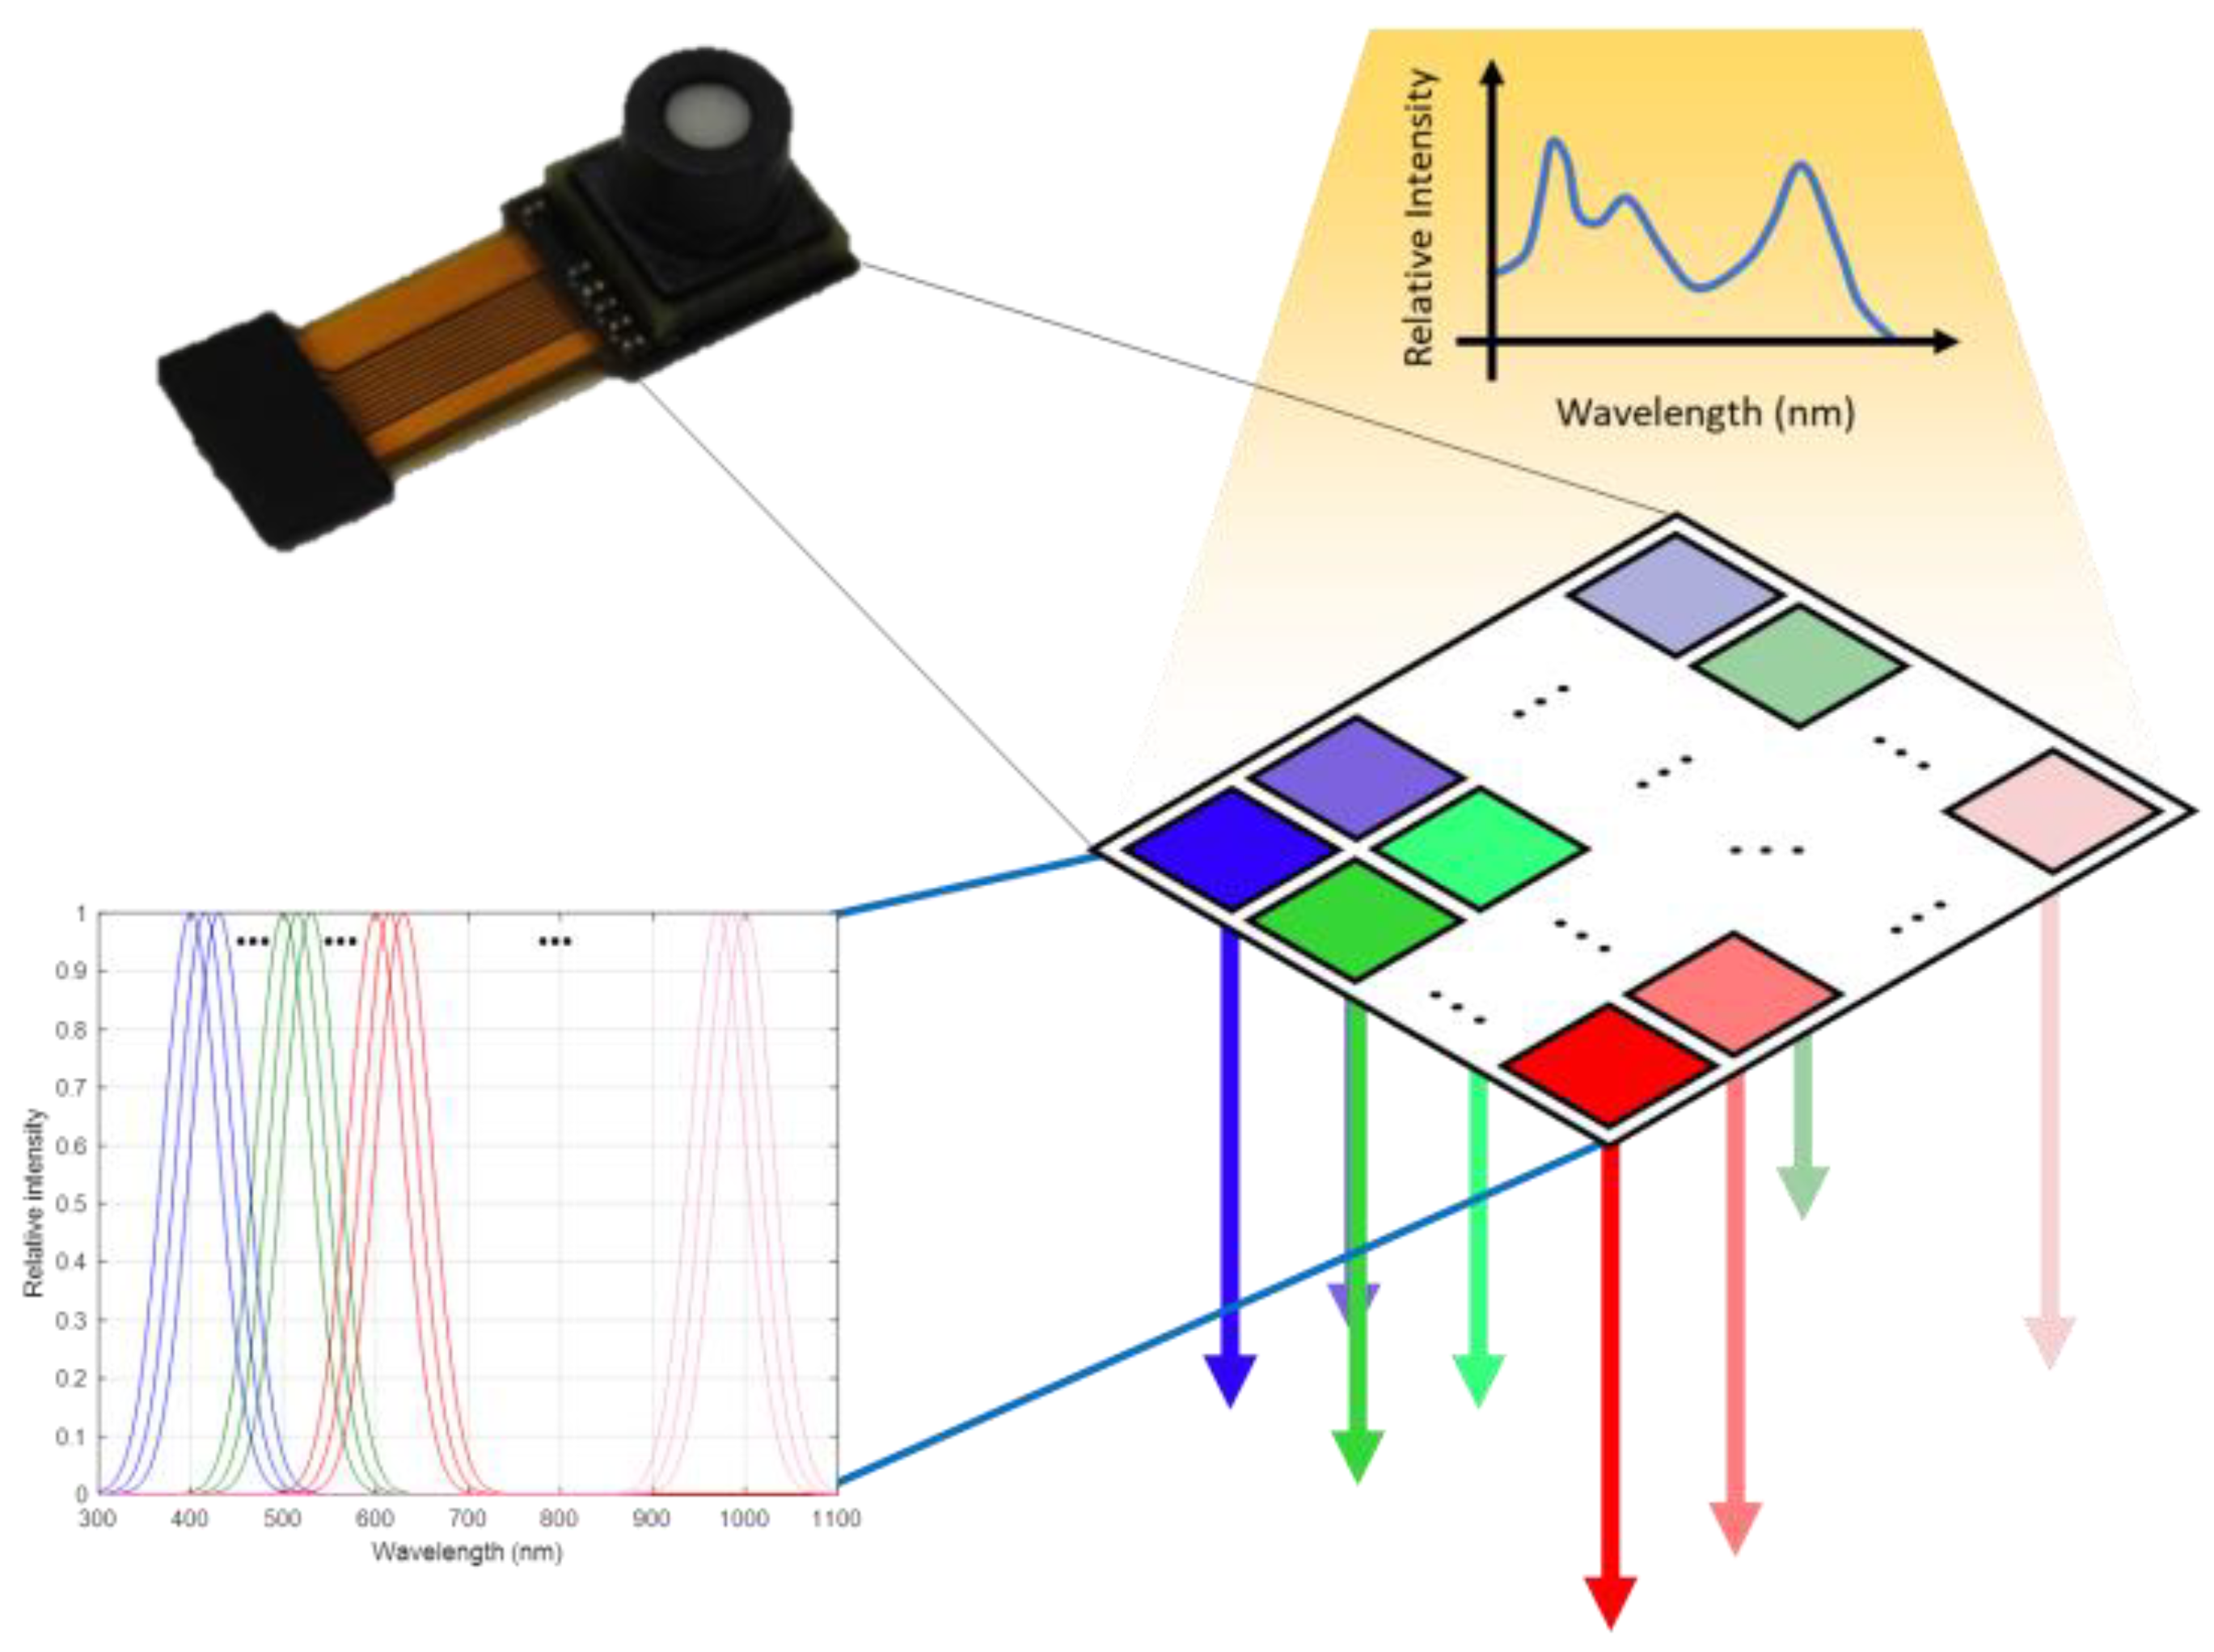
2. AW-PPG Device
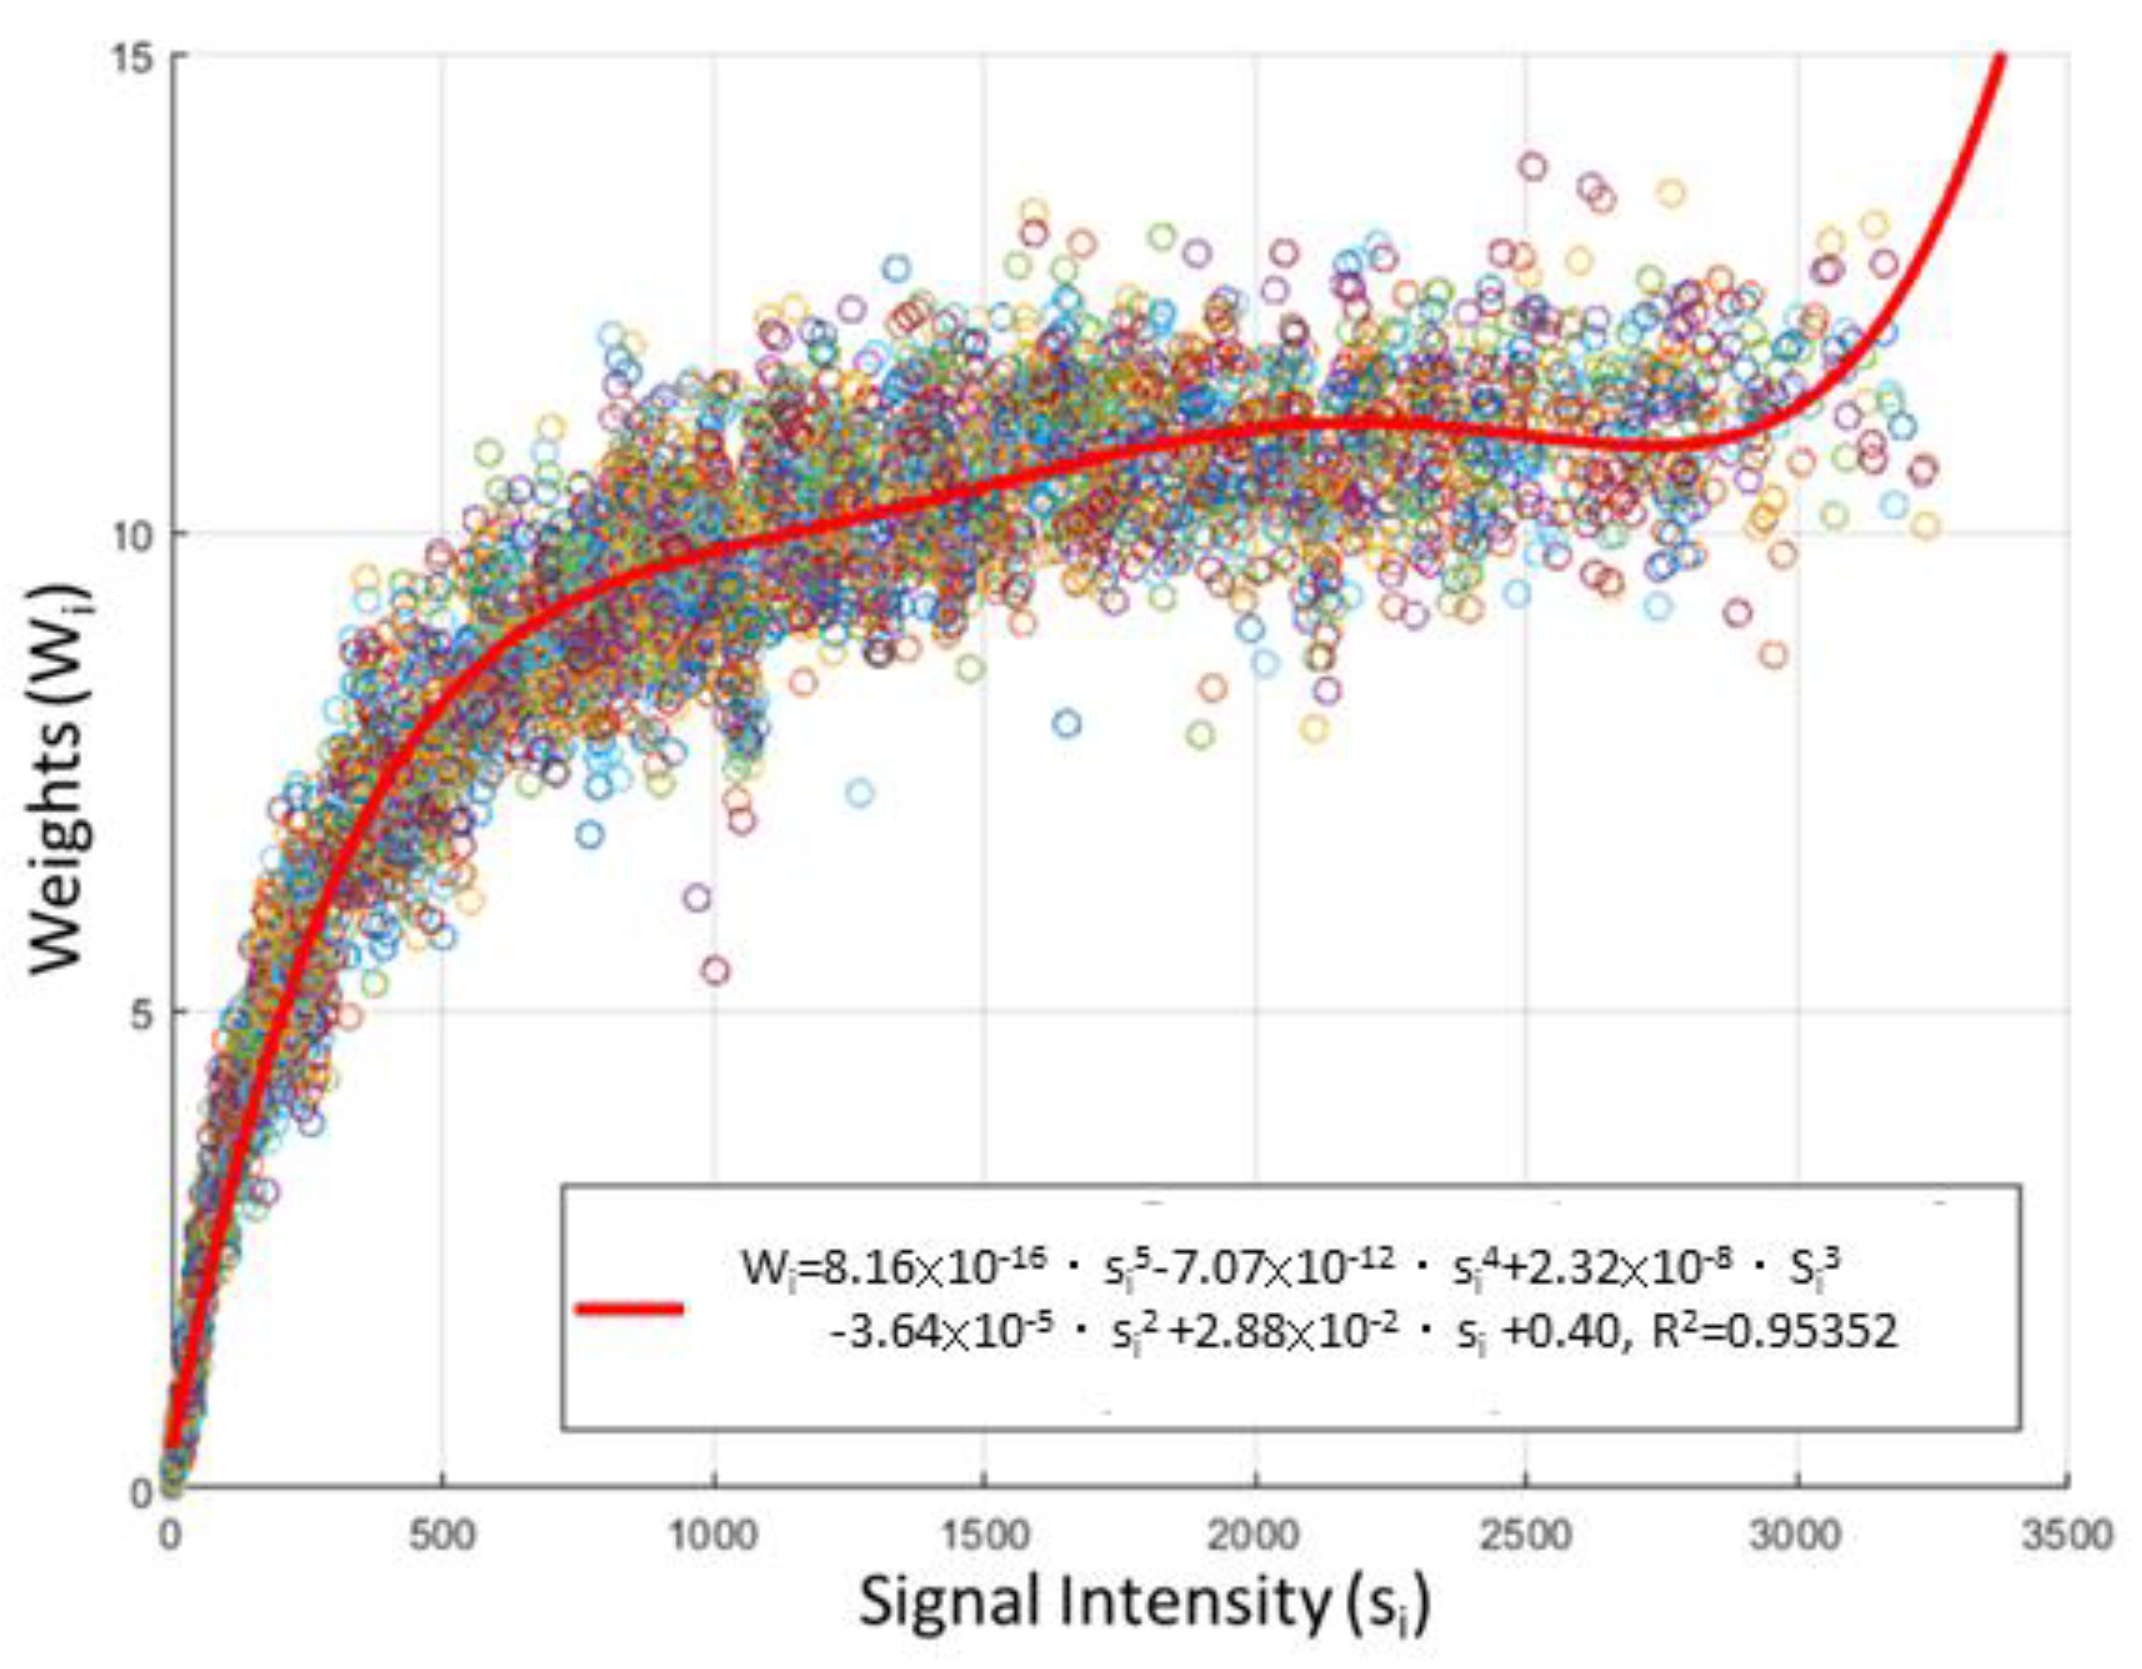
3. Algorithm: Maximum Ratio Combining and Filtering
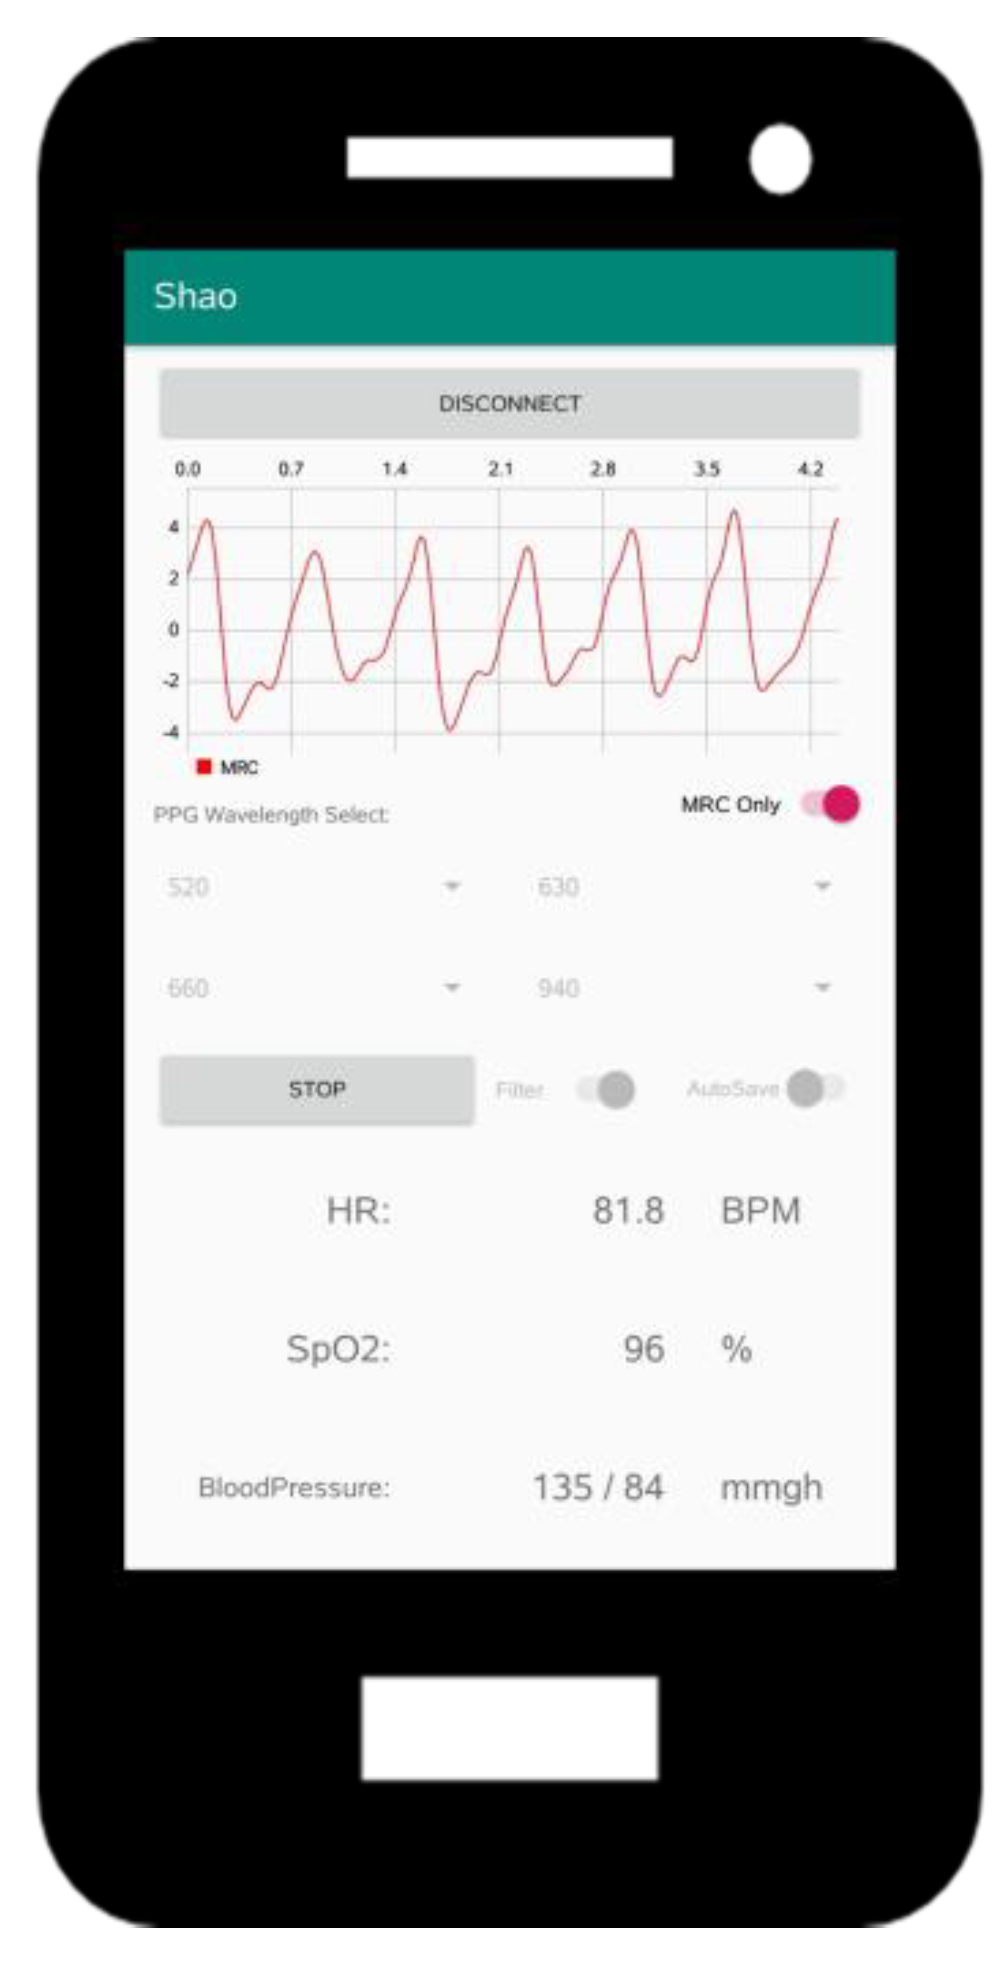
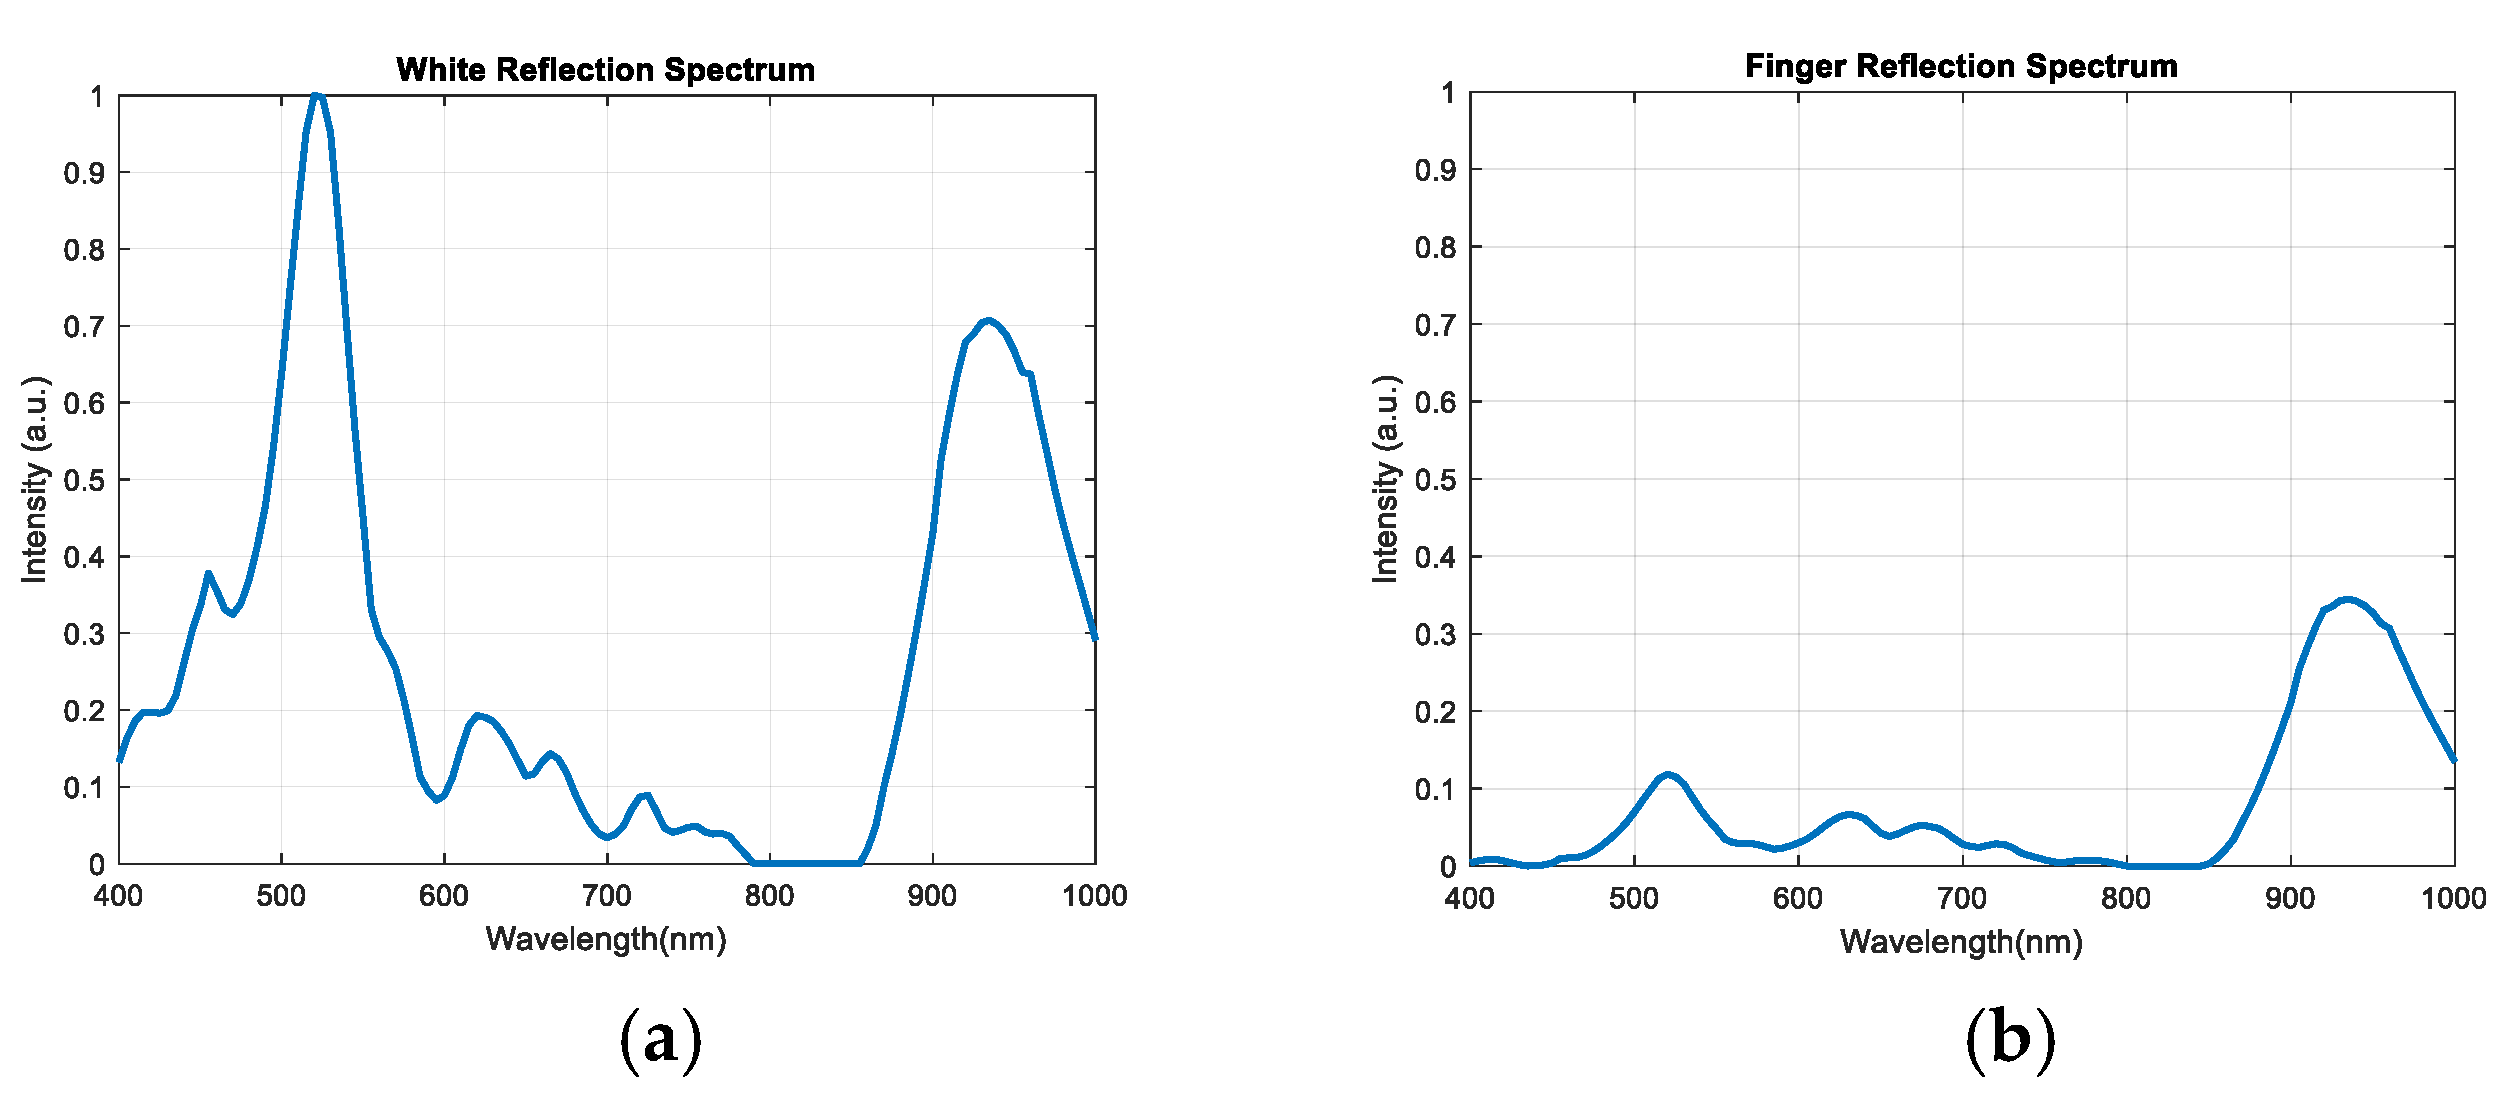
4. Experiment Results
5. Conclusions
Author Contributions
Funding
Conflicts of Interest
References
- Worldwide Wearables Shipments Surge 94.6% in 3Q 2019 Led by Expanding Hearables Market, Says IDC. Available online: https://www.idc.com/getdoc.jsp?containerId=prUS45712619 (accessed on 25 November 2019).
- Gartner Says Global End-User Spending on Wearable Devices to Total $52 Billion in 2020. Available online: https://www.gartner.com/en/newsroom/press-releases/2019-10-30-gartner-says-global-end-user-spending-on-wearable-dev (accessed on 13 November 2020).
- Spigulis, J.; Gailite, L.; Erts, R.; Lihachev, A. Contact probe pressure effects in skin multi-spectral photoplethysmography. In Proceedings of the Diagnostic Optical Spectroscopy in Biomedicine IV, Munich, Germany, 19–21 June 2007; pp. 307–314. [Google Scholar]
- Grabovskis, A.; Marcinkevics, Z.; Rubins, U.; Kviesis-Kipge, E. Effect of probe contact pressure on the photoplethysmographic assessment of conduit artery stiffness. J. Biomed. Opt. 2013, 18, 027004. [Google Scholar] [CrossRef] [PubMed]
- Liu, J.; Yan, B.P.-Y.; Dai, W.-X.; Ding, X.-R.; Zhang, Y.-T.; Zhao, N. Multi-wavelength photoplethysmography method for skin arterial pulse extraction. Biomed. Opt. Express 2016, 7, 4313–4326. [Google Scholar] [CrossRef] [PubMed] [Green Version]
- Moço, A.V.; Stuijk, S.; Haan, G.D. New insights into the origin of remote PPG signals in visible light and infrared. Sci. Rep. 2018, 8, 1–15. [Google Scholar] [CrossRef] [PubMed] [Green Version]
- Shaltis, P.; Reisner, A.; Asada, H. A hydrostatic pressure approach to cuffless blood pressure monitoring. In Proceedings of the 26th Annual International Conference of the IEEE Engineering in Medicine and Biology Society, San Francisco, CA, USA, 1–5 September 2004; pp. 2173–2176. [Google Scholar]
- Wang, Q.; Sheng, D.; Zhou, Z.; Liu, Z. Numerical and experimental study of the influence of device pressure on PPG signal acquisition. In Proceedings of the Optical Interactions with Tissue and Cells XXXI, San Francisco, CA, USA, 20 February 2020. [Google Scholar]
- Yuan, H.; Poeggel, S.; Newe, T.; Lewis, E.; Viphavakit, C.; Leen, G. An Experimental Study of the Effects of External Physiological Parameters on the Photoplethysmography Signals in the Context of Local Blood Pressure (Hydrostatic Pressure Changes). Sensors 2017, 17, 556. [Google Scholar] [CrossRef]
- Sato, H.; Koshimizu, H.; Yamashita, S.; Ogura, T. Blood pressure monitor with a position sensor for wrist placement to eliminate hydrostatic pressure effect on blood pressure measurement. In Proceedings of the 35th Annual International Conference of the IEEE Engineering in Medicine and Biology Society (EMBC), Osaka, Japan, 3–7 July 2013; pp. 1835–1838. [Google Scholar]
- Raamat, R.; Jagomägi, K.; Talts, J.; Kivastik, J. A hydrostatic pressure approach to assess accuracy of finger blood pressure measurement. In Proceedings of the 9th International Conference on Information Technology and Applications in Biomedicine, Larnaca, Cyprus, 5–7 November 2009; pp. 1–4. [Google Scholar]
- Poon, C.C.Y.; Zhang, Y.T. Using the Changes in Hydrostatic Pressure and Pulse Transit Time to Measure Arterial Blood Pressure. In Proceedings of the 29th Annual International Conference of the IEEE Engineering in Medicine and Biology Society, Lyon, France, 22–26 August 2007; pp. 2336–2337. [Google Scholar]
- Avci, P.; Gupta, A.; Gupta, M.; Vecchio, D.; Pam, Z.; Pam, N.; Hamblin, M.R. Low-level laser (light) therapy (LLLT) in skin: Stimulating, healing, restoring. Semin. Cutan. Med. Surg. 2013, 32, 41–52. [Google Scholar] [PubMed]
- Ash, C.; Dubec, M.; Donne, K.; Bashford, T. Effect of wavelength and beam width on penetration in light-tissue interaction using computational methods. Lasers Med. Sci. 2017, 32, 1909–1918. [Google Scholar] [CrossRef] [PubMed]
- Chatterjee, S.; Kyriacou, P.A. Monte Carlo Analysis of Optical Interactions in Reflectance and Transmittance Finger Photoplethysmography. Sensors 2019, 19, 789. [Google Scholar] [CrossRef] [PubMed] [Green Version]
- AFE4404EVM. Available online: http://www.ti.com/tool/AFE4404EVM?keyMatch=AFE4404EVM&tisearch=Search-EN-everything&usecase=part-number (accessed on 13 November 2020).
- MAX86150EVSYS. Available online: https://www.maximintegrated.com/en/products/sensors/MAX86150EVSYS.html (accessed on 13 November 2020).
- EVAL-ADPD144RI. Available online: https://www.analog.com/en/design-center/evaluation-hardware-and-software/evaluation-boards-kits/eval-adpd144ri.html#eb-overview (accessed on 13 November 2020).
- AS7026GG Evaluation Kit. Available online: https://ams.com/zh/eval-kit-as7026gg#tab/description (accessed on 13 November 2020).
- Chang, C.C.; Wu, C.-T.; Choi, B.; Fang, T.-J. MW-PPG Sensor: An on-Chip Spectrometer Approach. Sensors 2019, 19, 3698. [Google Scholar] [CrossRef] [Green Version]
- Lin, J.C. Recent Advances in Wireless Communications and Networks, 1st ed.; IntechOpen: London, UK, 2011. [Google Scholar]


 means difference between hands forward and hands up;
  means difference between hands forward and hands down.
means difference between hands forward and hands up; means difference between hands forward and hands down.
means difference between hands forward and hands down.
means difference between hands forward and hands up; means difference between hands forward and hands down.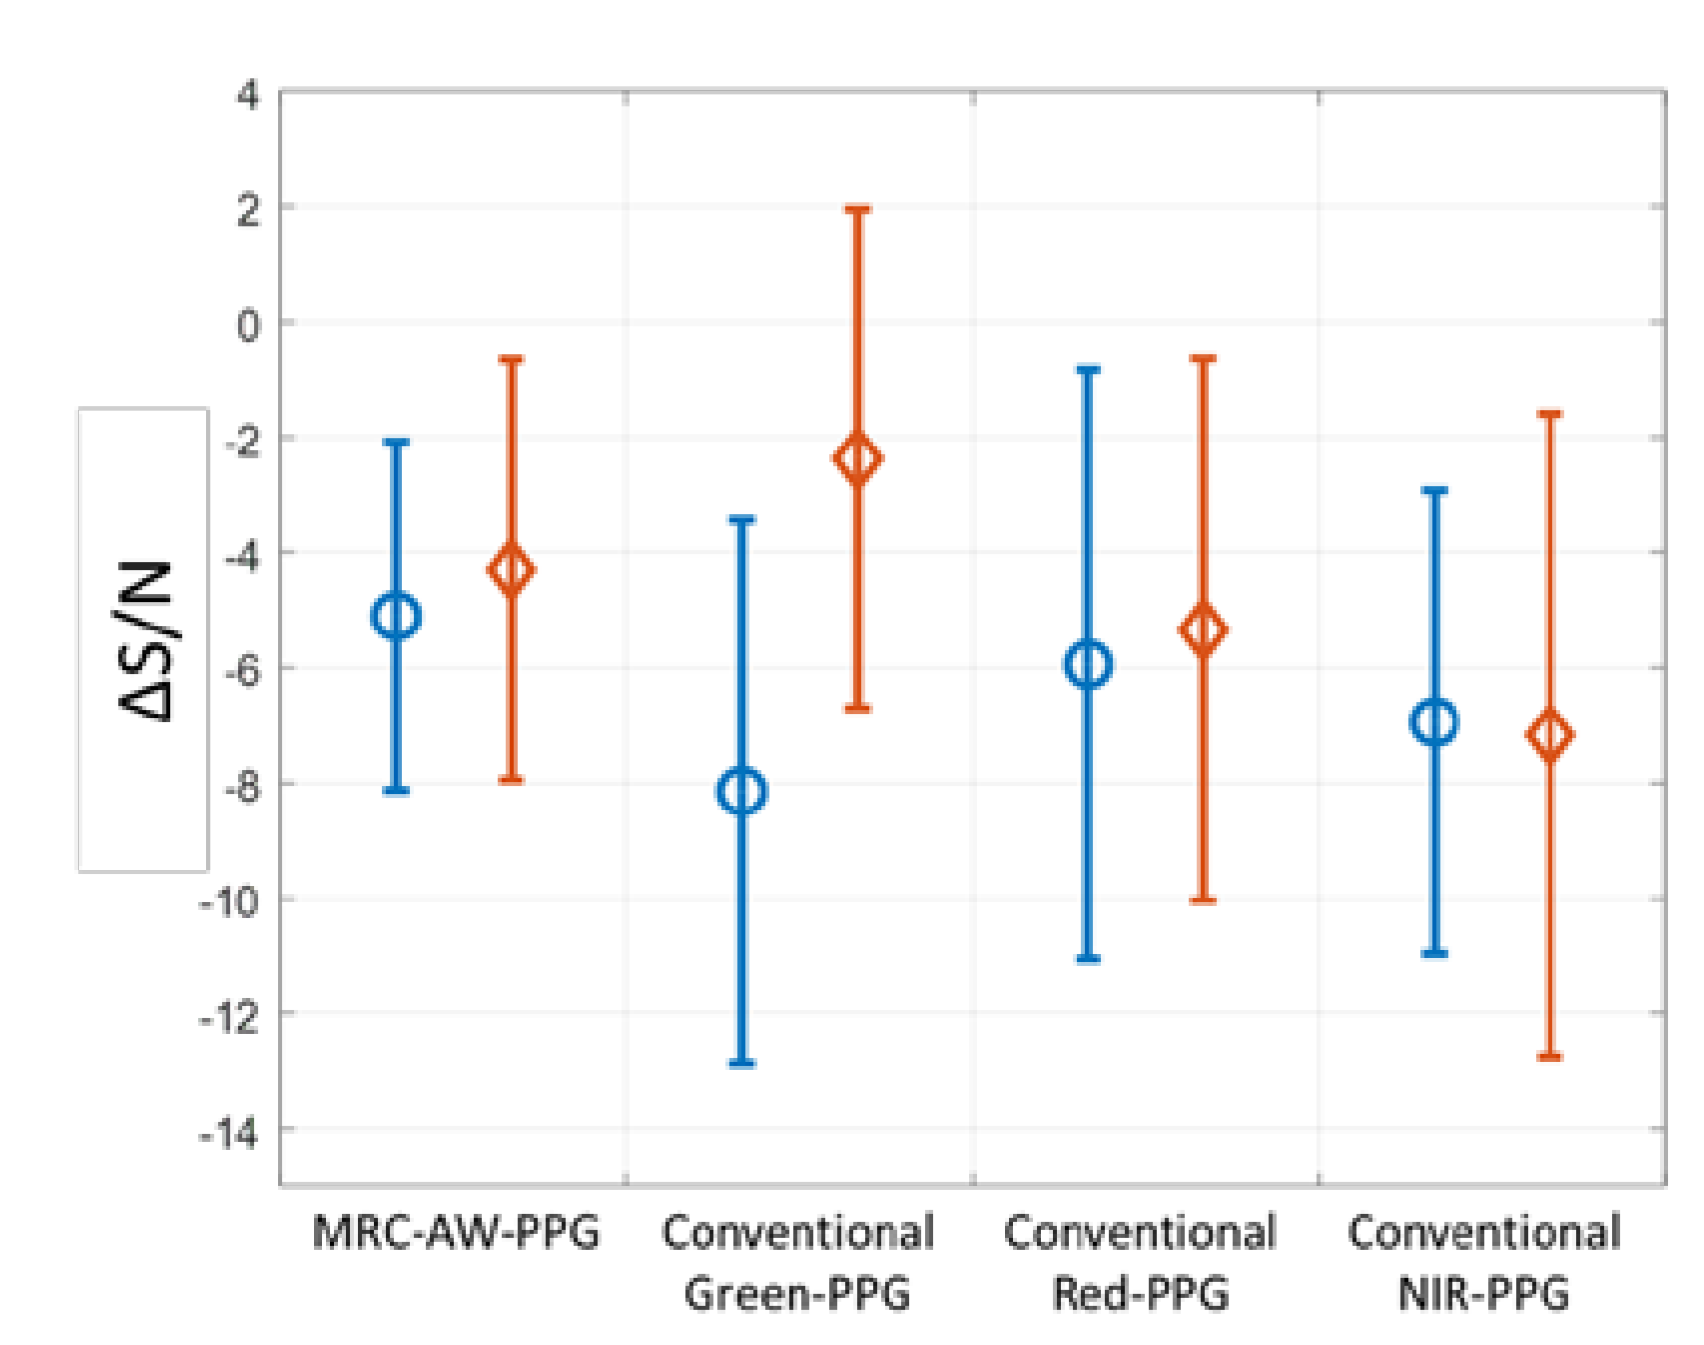

| Device | Light | A. Hands Up | B. Hands Forward | C. Hands Down | ΔS/N A-B (dB) | ΔS/N C-B (dB) | |
|---|---|---|---|---|---|---|---|
| Subject 1 | Proposed AW-PPG | AW | 39.05 | 41.72 | 42.00 | −2.67 | 0.28 |
| AFE4404EVM | Green | 40.88 | 49.46 | 47.42 | −8.57 | −2.03 | |
| Red | 42.16 | 47.17 | 43.65 | −5.01 | −3.52 | ||
| IR | 41.00 | 47.59 | 44.25 | −6.60 | −3.34 | ||
| Subject 2 | Proposed AW-PPG | AW | 42.00 | 46.40 | 40.65 | −4.40 | −5.76 |
| AFE4404EVM | Green | 30.05 | 35.76 | 40.48 | −5.71 | 4.72 | |
| Red | 25.44 | 40.15 | 35.56 | −14.72 | −4.59 | ||
| IR | 28.40 | 42.76 | 38.79 | −14.36 | −3.97 | ||
| Subject 3 | Proposed AW-PPG | AW | 43.90 | 48.49 | 38.51 | −4.59 | −9.98 |
| AFE4404EVM | Green | 46.94 | 47.44 | 43.83 | −0.50 | −3.61 | |
| Red | 46.46 | 47.51 | 41.81 | −1.04 | −5.69 | ||
| IR | 47.13 | 47.62 | 39.36 | −0.49 | −8.26 | ||
| Subject 4 | Proposed AW-PPG | AW | 38.27 | 48.31 | 46.45 | −10.04 | −1.86 |
| AFE4404EVM | Green | 33.74 | 50.09 | 50.24 | −16.35 | 0.14 | |
| Red | 34.30 | 39.25 | 40.55 | −4.95 | 1.30 | ||
| IR | 36.45 | 43.05 | 43.45 | −6.60 | 0.39 | ||
| Subject 5 | Proposed AW-PPG | AW | 39.43 | 47.27 | 40.00 | −7.84 | −7.27 |
| AFE4404EVM | Green | 42.85 | 51.05 | 47.16 | −8.20 | −3.89 | |
| Red | 41.89 | 51.93 | 37.41 | −10.04 | −14.52 | ||
| IR | 46.29 | 52.95 | 36.53 | −6.66 | −16.41 | ||
| Subject 6 | Proposed AW-PPG | AW | 44.85 | 45.91 | 44.69 | −1.06 | −1.23 |
| AFE4404EVM | Green | 46.14 | 55.65 | 46.08 | −9.51 | −9.57 | |
| Red | 45.99 | 45.89 | 40.86 | 0.10 | −5.03 | ||
| IR | 46.36 | 53.29 | 41.86 | −6.94 | −11.43 |
Publisher’s Note: MDPI stays neutral with regard to jurisdictional claims in published maps and institutional affiliations. |
© 2020 by the authors. Licensee MDPI, Basel, Switzerland. This article is an open access article distributed under the terms and conditions of the Creative Commons Attribution (CC BY) license (http://creativecommons.org/licenses/by/4.0/).
Share and Cite
Chen, S.-H.; Chuang, Y.-C.; Chang, C.-C. Development of a Portable All-Wavelength PPG Sensing Device for Robust Adaptive-Depth Measurement: A Spectrometer Approach with a Hydrostatic Measurement Example. Sensors 2020, 20, 6556. https://doi.org/10.3390/s20226556
Chen S-H, Chuang Y-C, Chang C-C. Development of a Portable All-Wavelength PPG Sensing Device for Robust Adaptive-Depth Measurement: A Spectrometer Approach with a Hydrostatic Measurement Example. Sensors. 2020; 20(22):6556. https://doi.org/10.3390/s20226556
Chicago/Turabian StyleChen, Shao-Hao, Yung-Chi Chuang, and Cheng-Chun Chang. 2020. "Development of a Portable All-Wavelength PPG Sensing Device for Robust Adaptive-Depth Measurement: A Spectrometer Approach with a Hydrostatic Measurement Example" Sensors 20, no. 22: 6556. https://doi.org/10.3390/s20226556