Sensing Framework for the Internet of Actors in the Value Co-Creation Process with a Beacon-Attachable Indoor Positioning System


1
Faculty of Engineering, Information and Systems, University of Tsukuba, Tsukuba 305-8573, Ibaraki, Japan
2
Graduate School of Systems and Information Engineering, University of Tsukuba, Tsukuba 305-8573, Ibaraki, Japan
*
Author to whom correspondence should be addressed.
Sensors 2021, 21(1), 83; https://doi.org/10.3390/s21010083
Submission received: 17 November 2020
/
Revised: 19 December 2020
/
Accepted: 22 December 2020
/
Published: 25 December 2020
(This article belongs to the Special Issue Novel Applications of Positioning Systems and Sensors)
Abstract
:To evaluate and improve the value of a service, it is important to measure not only the outcomes, but also the process of the service. Value co-creation (VCC) is not limited to outcomes, especially in interpersonal services based on interactions between actors. In this paper, a sensing framework for a VCC process in retail stores is proposed by improving an environment recognition based indoor positioning system with high positioning performance in a metal shelf environment. The conventional indoor positioning systems use radio waves; therefore, errors are caused by reflection, absorption, and interference from metal shelves. An improvement in positioning performance was achieved in the proposed method by using an IR (infrared) slit and IR light, which avoids such errors. The system was designed to recognize many and unspecified people based on the environment recognition method that the receivers had installed, in the service environment. In addition, sensor networking was also conducted by adding a function to transmit payload and identification simultaneously to the beacons that were attached to positioning objects. The effectiveness of the proposed method was verified by installing it not only in an experimental environment with ideal conditions, but posteriorly, the system was tested in real conditions, in a retail store. In our experimental setup, in a comparison with equal element numbers, positioning identification was possible within an error of 96.2 mm in a static environment in contrast to the radio wave based method where an average positioning error of approximately 648 mm was measured using the radio wave based method (Bluetooth low-energy fingerprinting technique). Moreover, when multiple beacons were used simultaneously in our system within the measurement range of one receiver, the appropriate setting of the pulse interval and jitter rate was implemented by simulation. Additionally, it was confirmed that, in a real scenario, it is possible to measure the changes in movement and positional relationships between people. This result shows the feasibility of measuring and evaluating the VCC process in retail stores, although it was difficult to measure the interaction between actors.
1. Introduction
To evaluate and improve the value of a service, it is important to measure not only the outcomes, but also the process of the service. Value co-creation (VCC) is not limited to outcomes, especially in interpersonal services based on interactions between actors [1,2,3,4,5]. In production management or mere sales, there may be no problems with the resulting productivity or sales data; for example, in the retail industry, involving customer service, it is possible to evaluate the value of the VCC process based only on the interaction between customers and stores and between customers and salespeople (Figure 1).
Customer behavior in stores plays a significant role in determining service value, and the boundary between companies and customers has become obscure in recent years. It is necessary to measure customer engagement behavior in VCC in multi-stakeholder service systems [6,7]. In the VCC process, which includes customer service and reception in retail stores, interaction information such as the positional relation and conversation content is important. As an example of positioning service, the Global Navigation Satellite System (GNSS; including Global Positioning System (GPS)) technology is used to position a moving vehicle in an automatic driving service such as Google car [8]. In addition, the position of both parties is determined in a delivery service in which individual drivers exist, such as Uber Eats [9]. The current GPS positions of mobile devices are used to match the receiver and deliverer to enable the delivery of goods between individuals. GPS technology is also used in mobile games using augmented reality such as Pokémon GO, which links the real position coordinates of the player with the content of the Pokémon game [10].
However, positioning becomes impossible in tunnels and indoor environments. GNSS technology performs positioning by receiving radio waves transmitted from an artificial satellite, but radio waves from the satellite are shielded by the walls and roofs of tunnels and buildings. Indoor positioning technology is required when GNSS positioning is unavailable. The indoor positioning technique is still being extensively studied through various techniques [11]. This is because several indoor positioning technologies require the use of transmitters, receivers, and computers to position environments and objects. Although various indoor positioning techniques are being used practically for each application, it is difficult to use them comprehensively; each technique has merits and demerits, and the error factors are different in each technique. For the purpose of measuring VCC process, there is no specific method suitable for a service environment with many and unspecified objects. In addition, it is difficult to install a smartphone in all measured objects in positioning using a mobile terminal, which is considered to be versatile, such as a smartphone. For example, in the case of a positioning method to track an object to be measured by using a camera, it is possible to position an unspecified number of objects; however, a computer with large computational power is required for further image processing. In addition, when the targeted object is a human, the consideration of privacy anonymization is necessary. Although there are certain methods used to measure a discrete area in which a customer is present using radio frequency identification (RFID) or analyze it using a monitoring camera, it is difficult to measure continuous interaction, and it is possible to measure only sensitive and positional information.
In this study, to measure the interaction between customers and stores or between customers and salespeople, we propose an environmental-recognition based indoor positioning system (infrared beacon localization system (IRBL)) using infrared (IR) rays in which the devices to be attached to measurement objects are small and are less affected by metal shelves, as shown in Figure 2. IR light, which is utilized to send the information containing the ID of a sender device attached on a targeted object, is measured by a receiver to obtain its direction of arrival; consequently, the receiver can simultaneously measure the positions of objects in large numbers. We reported some of these research results in [12,13].
In this paper, we first describe the basic principle and design of the positioning system and then present a comparison of the positioning accuracy in the metal shelf environment between the proposed method and the Bluetooth Low-Energy (BLE) method, which is widely used as a conventional method. Moreover, the movement of humans is measured in an environment in which the effect of metal shelving is significant, such as a retail store. In addition, this paper performs a basic examination in anticipation of the simultaneous recognition of several elements and sensor networking. Through the above, we aim to realize an Internet of Actors (IoA) that can monitor not only location information, but also the interaction among service actors that compose the services, including customers, salesperson, products, and other objects, in the service environment.
2. Related Works
There are various indoor positioning techniques that are characterized by their recognition type, communication system, signals used for positioning, calculation techniques, etc. Table 1 enumerates the major positioning methods classified by these features.
Recognition methods are predominantly classified into environment recognition and self-recognition methods [26,27]. Self-recognition methods include techniques used to estimate the relative position to the initial position of a measured object by attaching a transmitter, a receiver, and a computer. This method requires a device with a sensor and computational ability such as a smartphone, which is widely used predominantly in navigational applications, in which it is used as an interface [28,29].
The environment recognition method is used to estimate the position of a measured object within the range of the positioning environment by introducing a transmitter, a receiver, and a computer. There are few functions that must be given to the measurement target, and this method has the advantage that installation is easy even if there are many measurement targets. Conversely, when the positioning environment changes, it is necessary to adjust the attached equipment again. In particular, indoor positioning using the environment recognition method can track a large number of measurement objects because computational ability is not required for the equipment to be installed on a measurement object, thus incurring a low cost. For example, because anti-theft RFID tags are inexpensive, they can be attached to a large number of goods [30]. In recent years, the analysis of camera images has advanced, and the position of a person can be obtained from these images [31].
Communication systems are divided into active and passive types [32]. The active type is a positioning technique in which a system that computes a position actively transmits a signal necessary for positioning; moreover, in certain cases, the device attached to a positioning object is required to not only respond to the sender, but also to perform some calculations to obtain positions. Although there is strong merit of this technique in its robustness against disturbance, when the positioning object is a human, there are complications such as the starting of a device and the application for positioning. Thus, when the attachment of the device to the positioning object becomes complicated and the number of positioning objects is unspecified and large, it can be said that the introduction of the positioning environment and the manufacturing cost of the device represent disadvantages of this method. The passive method is a positioning technique in which a system computing a position does not transmit a signal. Therefore, when a positioning object is a human, processing such as starting a device or an application is unnecessary, and the positioning can be subconsciously performed. Moreover, the device attached to the positioning object can be simple and inexpensive for mass production, allowing a large number of positioning objects to be positioned.
The positioning method is also classified based on the signal used for positioning. Examples include the utilization of radio waves such as Wi-Fi and BLE, the visible light emitted by lighting equipment installed in indoor environments, sound waves such as ultrasonic waves, the angular velocity obtained using an acceleration sensor attached to the measurement object, odometry if the object moves by wheels, and image data [11]. When radio waves are used, a Wi-Fi system is often installed in indoor environments, and there is the advantage that using this technique without the positioning of an existing setup (such as a network infrastructure, which a Wi-Fi system originally is) is easy [33,34]. BLE has the advantage of being implemented as a smartphone application because a beacon, which acts as a transmitter, can be installed in the environment and a smartphone can be used as a receiver and attached to a positioning object. However, it has the disadvantage of being easily affected by interference, reflection, and diffraction by metals [16]. When visible or IR light is used, it is not affected by metals when compared to the case of using radio waves; however, there is a disadvantage that it is necessary to consider the effect of the shielding of light, and the problem of the disturbance of the light exists in the environment [35,36,37,38]. In the case of sound waves, installation in the environment is relatively easy; however, when multiple sounds are present, it is necessary to consider the effects of the superposition of sound waves and environmental sound [39,40,41]. When positioning is performed based on angular velocity or odometry, there is almost no requirement for a device to be introduced into the positioning environment, because only the movement of the moving object is measured. However, in several cases, changes in position coordinates are calculated by integration and anchoring, which result in measurement errors due to integration errors, making this approach unsuitable for long-term measurement [42,43]. When using image data, it is unnecessary to attach a measuring instrument to the object for measurement; moreover, it is possible to perform continuous measurement even when there are multiple objects to be measured. However, not only does the calculation cost increase, but also if the object is a human, the face of the person might be recorded; consequently, privacy anonymization is required [21,44].
A positioning method is also classified based on the calculation methods of an object’s position [45]. For example, in geometric calculation methods such as triangulation and trilateration, the relative position of a measurement object is estimated from the geometric relationship between known points and sensor values obtained by measurement equipment [46,47,48,49,50]. Therefore, even if positional relations of objects in the positioning environment change, if the positional relation of the measuring instrument does not change, it is possible to perform positioning as it does not require prior learning; moreover, the instrument can easily be attached in the environment. However, the positioning accuracy varies depending on individual differences in measuring instruments. When the position of the positioning object is calculated based on data matching, the sensor values obtained for each position pair of a transmitter and receiver are required to be measured beforehand and to be stored in a database. Then, the position is estimated by calculating the relative position by comparing the sensor value obtained in actual positioning with the value of the stored data [51,52,53,54,55,56,57,58,59]. As the positioning is performed by aggregating the data once, there is no effect on the positioning accuracy even if there is an individual difference in the measuring instruments; however, it can be said that the installation cost to the environment increases. This is because the data must be collected again when the positional relation of the goods and environmental objects in the positioning environment changes. When the position of the positioning object is calculated based on integration and anchoring, the positioning is performed by the double integration of data from an acceleration sensor or angular velocity sensor mounted on the positioning object [60,61,62,63,64,65]. However, there is no requirement for installing the equipment in the positioning environment, and the installation is comparatively simple; however, this method is not suitable for positioning over a long period of time because the integral error increases as the measurement period increases. Therefore, in the case of active self-positioning, a model that performs estimation by a combination of the integral of acceleration and RSSI (received signal strength indicator) based positioning by communication between target devices with a Kalman filter has also been developed [66]. However, this requires sufficient sensors and computing power for the positioning target.
The IRBL indoor positioning method proposed in this paper is an environment-recognition based, passive, and geometric calculation based method using IR light. This method results in an improvement in accuracy by its integration with other positioning methods; it is expected to perform in an environment surrounded by metal shelves such as retail stores, factories, and distribution warehouses. Thus, when we consider the measurement of customers and salespeople in retail stores, workers in factories and distribution warehouses, and working vehicles, a passive-type method is appropriate because the measured subjects are many and unspecified, and the hardware cost, installation cost, and calculation cost are low. Moreover, it is desirable to use IR light as it is not affected by a metal shelf or the moisture contained in the human body and is not visible to humans. Furthermore, since these environments are often changed by refurbishment, such as moving shelves and making modifications to the facilities, there is an advantage of a geometric method that does not require prior learning for position calculation. A similar technique was used to measure the angle of arrival (AoA) of signals using an IR phototransistor array to achieve indoor positioning in [25]. In the research, indoor positioning was realized by measuring the AoA of signals emitted from IR beacons mounted on shopping carts in supermarkets. This clearly showed that, compared to other methods, methods such as IRBL are most suitable for measuring human flow in an indoor space such as a store and are also superior to other methods for their combination and complementation. However, in order to realize an IoA that measures the interaction between service actors (customers, salesperson, products, and other objects) and clarifies the VCC process, which is the purpose of this research, positional information alone is insufficient. In the method proposed in this study, the function of a sensor network is considered as a development of the research in this field and a feasibility study is carried out. Based on the above, the VCC process is measured to realize an IoA.
3. Principal of Positioning System Based on the Angle of Arrival
3.1. Overview
The outline of the proposed positioning system is shown in Figure 3. The system consists of IR beacons attached to the measurement object, IR receivers attached to the environment, and an aggregation server to collect the signals of the receiver. The IR beacon emits IR light at intervals, and the light is measured by the receiver. The ID signal is modulated in the IR light, and different fluctuations in the interval enable simultaneous positioning for multiple beacons. The receiver obtains the sensor value based on the luminance distribution on the light-receiving surface corresponding to each incoming direction by receiving the IR signal emitted from each IR beacon through the slit by the diode array and estimates the incoming direction (angle of arrival (AoA)). By three-dimensionally matching the arrival directions of IR beacons detected by multiple receivers, the environment side calculates the measurement positions of the positioning objects.
3.2. Angle Detection on the Receiver
The angle measurement unit measures the angle of incidence of a signal emitted from a beacon by using a slit and a sensor (e.g., arrayed photodiodes (PDs) and a position-sensitive detector (PSD)).
The slit “spotlights” a part of the sensor, generating a unique luminance distribution on the sensor surface corresponding to the angle of incidence. The slit also has a spectral filter to remove noises. In this paper, IR-96 (Fujifilm) is used as the spectral filter. AoA measurement is achieved by utilizing the luminance distribution; in particular its centroid. For example, in case PDs arrayed on a plane are used, as the sensor is shown in Figure 3b, when two adjacent PDs are irradiated, the PDs output and the centroid of luminance distribution have the following relationship:
where and are the current flowing out from each PD, is the longitudinal size of the slit, is the gap between two PDs, and P denotes the centroid of the luminance distribution. P is arranged as follows:
In the case of PSD, AoA measurement is achieved in a similar manner, as follows:
where and are the current flowing out from output terminals of the PSD and L is the effective length of the PSD. P is calculated as:
Finally, the incident angle is obtained as:
where D is the distance between the sensor surface and the slit.
The maximum angular view , which is half of the angle of view, is determined as:
In this paper, , , and the PSD of S3270 (Hamamatsu Photonics, ) is used, resulting in a designed of approximately .
Because this method is basically used to measure the two-dimensional position of a beacon inside of a circular sector towards the front of a receiver, it is necessary to avoid receiving IR light from off-the-line positions. Therefore, the lateral size of the slit should be the minimum possible to cover the measurement area. This treatment would also reduce the effect of multipath, as most of the reflectors surrounding the measurement area (e.g., products displayed on metal shelves) would then be out of sight.
On the other hand, true three-dimensional positioning can be also achieved by placing two sensors orthogonally. In this case, the lateral size of the slit should be widened to cover the measurement area. However, the positioning might become less tolerant of reflection. Note that the discussion above only refers to a planar sensor surface for simplicity, but it is not a requirement.
The receiver also has the function of reading a beacon ID and the payload embedded in the signal. After AoA measurement, the receiver sends a report composed of the measured AoA, the beacon ID, the receiver ID, and the payload to the processing PC via the ZigBee network; the localization process is described below.
3.3. Identification of the Attachable Beacon
Because the IR beacon is assumed to be simply attached to the position measurement object, it is designed through inexpensive manufacturing processes and includes few processing abilities. It is composed of an IR light-emitting diode (LED), an ARM Cortex-M0 microcontroller, and a lithium polymer battery.
The main function of the beacon is to send information containing its unique ID and small payload to a receiver by blinking an IR LED, allowing the receiver to identify and localize the beacon. The payload can be utilized with some values obtained from the beacon’s sensor, which is described below.
In this paper, the emitting signal pattern is described as follows. A carrier wave is modulated by on–off keying, representing a leader symbol followed by information. The leader symbol, the binary “0” symbol and the binary “1” symbol are represented as different keying patterns: the leader symbol consists of ON for and OFF for ; the binary “0” symbol consists of ON for and OFF for ; and the binary “1” symbol consists of ON for and OFF for , where the pulse unit length is 562 µs. The amount of information is including a beacon ID and additional payload (described below). The mean signal length becomes under these parameters. A 38 kHz square wave is used as a carrier to avoid interference from noise, which is usually at a low frequency. An example of the signal is shown in Figure 3a. By emitting such a signal periodically, the position of the beacon is continuously localized by the receiver.
The transmission interval can be adjusted depending on the utilization condition. When multiple IR beacons exist within the coverage of one receiver, signal conflicts occur. After a transmission becomes conflicted, the following transmissions are also conflicted, if a constant transmission interval is used. Therefore, the transmission interval must have some jitter to avoid consecutive missing locations:
where T is a mean transmission interval, is a continuous uniform distribution in , and is a fluctuation ratio to T. Here, there is a trade-off relation between the number of beacons and the update frequency, and positioning is possible while avoiding temporal conflicts by reducing the number of beacons when frequent updates are desired or by reducing the update frequency when the number of beacons is an important factor.
3.4. Localization of the Attachable Beacon
One or more AoA reports about one transmission from a certain beacon would be received by the processing PC as the receivers’ coverages overlap with each other. The localization is performed on the PC by combining the reports.
Figure 3c shows how to localize the beacon when multiple receivers are receiving IR signals. As the absolute position of the receiver is known, the beacon can be localized three-dimensionally using two or more AoAs measured by the receivers. The beacon position is obtained by solving the following equations simultaneously:
where H is the pre-measured receiver height, N is the number of receivers that receive the signal from the beacon, is the pre-measured x-axis position of the i-th receiver, and is the AoA obtained by the i-th receiver. Finally, by combining , the y-axis position of the i-th receiver, the three-dimensional beacon position is obtained. If (9) is overdetermined (), it should be solved using the least squares method in order to minimize the localization error. Conversely, if (9) is underdetermined (), the reasonable assumption discussed below might be helpful in the case of incomplete measurement.
While this method can localize the beacon horizontally and vertically, each position in a measurement area must be covered by at least two receivers, increasing the number of receivers. However, by introducing the assumption that the beacon height is constant (e.g., the beacon is installed on a shopping cart is moving on a flat floor), it is possible to conduct localization with some accuracy even when the signal is received by a single receiver, as shown in Figure 3c. Under this assumption, the position x is obtained by solving the following equations simultaneously:
where is the pre-measured beacon height. If (10) is overdetermined (), it should be solved in a similar manner as (9). Utilizing this assumption even in the case of multiple receivers being available may be helpful to achieve higher accuracy.
Since these are AoA based triangulation methods, there is a trade-off between the coverage and the accuracy of measurement; the localization error becomes greater as H becomes larger.
3.5. Augmentation as a Sensor Network
As described in Section 3.3, the system can perform unidirectional communication to send an additional payload, as well as the beacon ID; therefore, it is possible to use the communication to form a sensor network. For example, when an IR beacon is attached to a shopping basket, the total weight of goods in the basket can be sensed and transmitted by attaching a strain gauge to the basket.
Therefore, the proposed system can be extended to a sensor network to gather the sensor data. Figure 3a illustrates how the beacon ID and the sensor data are packed into the signal. The additional payload follows the beacon ID. In this paper, the microcontroller installed in the IR beacon is programmed to send the 16 bit sensor data obtained from a strain gauge as the payload.
It can, of course, also be programmed to measure and send arbitrary sensor data, such as luminance, noise level, odor, and heartbeat rate. However, the mean signal length increases as the payload size increases, meaning that the possibility of collision with other beacons increases; therefore, the payload size should be determined according to the specifications required for applications. These are discussed in Section 5.4.
4. Indoor Positioning Experiment in an Environment Surrounded by Metal Shelves
4.1. Overview
To evaluate the positioning accuracy of the proposed system when compared to the existing method, a positioning experiment was performed in a passage-type environment surrounded by metal shelves, as shown in Figure 4. This positioning experiment was performed with the assumption of the following two situations regarding the movement of the object.
- Case 1
- The object continues to be stationary in the positioning environment (positioning in a static environment);
- Case 2
- The object continues to move in a positioning environment (positioning in a dynamic environment).
Case 1 is an indoor positioning system that uses an IR beacon and BLE when there is only one positioning object; moreover, positioning using a commercialized BLE beacon (iBeacon, Apple Inc., Cupertino, CA, USA) was performed as a benchmark. This indoor positioning system based on the iBeacon has an iPhone operating system based device attached that receives the radio wave from the iBeacon, which is transmitted through a Bluetooth device installed in the environment to the positioning object, which acts as a receiver [67,68]. This indoor positioning system uses the fingerprinting method, which estimates the position coordinates of the positioning object by comparing the value of the reception strength (received signal strength indicator (RSSI)) as in the case of the conventional system using BLE [69,70,71]. When the receiver receives the surrounding Bluetooth radio waves, it will self-localize with the data sets of the received strength associated with the position coordinates in the environment in advance. In addition, as the IR beacon is supposed to be used even when multiple IR beacons exist in the same environment, positioning is performed in this situation. As comparisons for indoor positioning, RFID and Wi-Fi signals can be considered as methods that use the same radio waves. However, these were excluded; they are not suitable for use at the mobile scale of shoppers, which is the subject of this research, because the former is a spot-detection technique. Additionally, it is not appropriate to increase the number of access points to improve accuracy because the latter is a positioning method that uses the existing infrastructure. In Case 1, the measurement accuracy was calculated for performance evaluation, and in Case 2, an experiment was conducted to verify the consistency of the measured movement as a reference for actual use.
4.2. Positioning in a Static Environment
In this experiment, two IR receivers (height: 2.6 m) and a dozen of iBeacons (height: 1.52 m) were used for one passage of 5.6 m in length; moreover, the positioning object in the passage was moved by 100 mm to perform positioning for 15 s at each point, and then, the positioning accuracy was compared. In the iBeacon system, the fingerprint of RSSI was measured in a 100 mm interval prior to the experiment, and positioning was performed based on coincidence. The results are shown in Figure 5. From these results, it can be noted that the average error of the iBeacon was 648 mm, while that of the IR beacon was 96.2 mm, and the usefulness of the indoor positioning system using the IR beacon was confirmed.
Moreover, in the positioning experiment with multiple IR beacons, a verification experiment on positioning accuracy using three IR beacons was performed on the assumption that multiple IR beacons were present. Moreover, the positioning of the IR beacon was performed in three ways and was performed for 15 s for each situation. The results are shown in Figure 6. The average error was 147 mm, and it was confirmed that effective positioning was possible even in situations in which multiple IR beacons were present.
4.3. Positioning in a Dynamic Environment
In the positioning experiment in Case 2, the dynamic measurement was conducted on the assumption that a pedestrian as a measurement object travels through the store. In this measurement experiment, the equipment to be attached to the measurement object was attached to the cart, as shown in Figure 4, and the state of traversing 10 times through the two passages was measured by pushing the cart. The results are shown in Figure 7. From this result, it can be observed that 10 round trips were measured in the positioning by the IR beacon; in contrast, the iBeacon results indicate a measurement of only five round trips. From this result, it can be said that the positioning result of the IR beacon captured the migration behavior more accurately.
4.4. Discussion
In both static and dynamic environments, the fingerprint-type indoor positioning method using BLE could not perform accurate positioning even though the number of elements was larger than the proposed method. This is thought to be due to the effects of reflection and absorption by metal shelves and, in some cases, absorption by the human body, because radio waves were used. Furthermore, the attitudes of the devices in the fingerprint learning phase and the verification phase were the same, but when considering actual use, those attitudes did not always match. It is easy to imagine that the performance would be made even worse due to the antenna directivity of the transmitter and receiver.
It is considered that the IR light of each beacon is received by the same receiver when multiple IR beacons are in the same area under the positioning environment. However, the timing of the light emission from each beacon is set to be random in time; consequently, multiple IR beacons are not simultaneously received by the same receiver. In addition, if simultaneous light reception occurs, the data of the sensor value at that time will be lost, but the operation of the positioning system will not be interrupted, and normal data will be acquired again in a state in which each beacon does not overlap temporally or positionally.
In a system in which a receiver and the aggregation server communicate in a one-to-one correspondence, it is assumed that the transmission loss of the data occurs when the distance between the receiver and the aggregation server exceeds the range at which communication is possible in a situation in which positioning is performed over a wide area. To cope with this problem, it is considered that equipment that can relay the communication between the receiver and the aggregation server is required.
The shielding of the IR light of the IR beacon is one of the factors that can result in a positioning error in this system. Therefore, it is desirable to install the receiver on the ceiling of an indoor environment where there is no shield between the receiver and the positioning object to which the IR beacon is attached (i.e., a place with a clear view).
5. Implementation in Retail Stores and Measurement of Human Movement
5.1. ZigBee Network
The communication system of the ZigBee module, which transmits the sensor value corresponding to the light of the beacon received by the IR receiver to the integration server, was installed in the IR receiver for practical installation in an actual store. When the receiver receives the light transmitted from the IR beacon, the module transmits the time data at that moment, the sensor value, the ID information of the beacon, and the identification number of the communicating module to the aggregation server. Here, the receiver that is installed in the environment that receives the signal of the IR beacon is identified by the correspondence between the individual identification number set in the communication module and the mounted receiver.
When multiple ZigBee modules are used, a communication environment called ad hoc communication is constructed. In the communication between the receiver transmitting the data and the aggregation server in this communication environment, the intermediate receiver can perform the communication as a repeater. On the other hand, true three-dimensional positioning can be also achieved by placing two sensors orthogonally. In this case, the lateral size of the slit should be widened to cover the measurement area. However, the positioning might become less tolerant of reflection.
5.2. Measurement of Pedestrian Flow
In this feasibility study, we measured the flow-line data, assuming that certain pedestrians were walking in the retail store.
This study was conducted in a section of a drug store with IR receivers installed on the ceiling, as shown in Figure 8. Five receivers were attached to the ceiling along each aisle, and the aisle consisted of three rows. The coverage of these receivers was about 40 m. All receivers were wirelessly connected by ZigBee, and along with the receiver ID, the beacon ID and its AoA information were sent to the server PC via the ZigBee network. Based on this information, the server PC could calculate the position of each beacon in real time.
We also conducted a verification experiment to verify whether the indoor positioning system could measure the transition of the positional relationship between two pedestrians. In this experiment, we measured the behavior of two participants in the store, simulating the behavior of a service employee and customer. The two participants performed the behavior three times according to the five scenarios listed in Table 2, which were considered to be the behaviors related to the service evaluation, obtained from interviews with the salesperson of a drug store.
Based on this experiment, Figure 9 shows the plots of the relative distance divided into the scenarios of two pedestrians, which were calculated using the obtained log data. There was a difference of approximately several seconds between the relative distances in Scenarios #A and #B before the distance converged to zero. In addition, when compared to Scenario #C, it is possible to observe that the relative distance converged to zero as Scenarios #A and #B monotonously decreased, while they moved away or approached, although they moved differently. Conversely, it was not possible to observe a significant difference between Scenarios #D and #E. However, it can be noted that the distance fluctuated as Scenario #E moved marginally up and down.
Furthermore, focusing on the relative velocity, it was interesting that there was no great difference in the maximum peak value between Scenarios #A and #B, which was different from the initial prediction. It can be observed that, even if an order is used, such as in Scenarios #A and #B, the salesperson will probably move quickly. This point shows that people behave naturally at the service site, unlike machine movements. Moreover, it can be observed that the number of vertical movements in Scenario #C was larger than that of #A and #B. With regard to Scenarios #D and #E, it can be observed that the dispersion of vertical movements was larger in Scenario #E, which suggests that a speed adjustment was made to maintain the distance between the pedestrians while they moved. Additionally, the analysis in [72] was performed using the proposed sensor in the store.
5.3. Improvement as a Sensor Network
As an example of extending this indoor positioning system to a sensor network, a system to monitor the weight in a shopping cart was constructed [13]. As shown in Figure 10, we attached a pressure sensor to the handle of the shopping basket at the junction of the body of the basket. The pressure sensor changed its resistance value by being compressed between the handle and the body owing to the weight inside the basket. The resistance value of the sensor was transmitted to the receiver by the adjacent IR beacon, and the weight in the shopping basket could be estimated based on the resistance value.
We conducted an experiment to verify the performance of our proposed sensor network system for retail stores. There were two types of shopping baskets: those on wheels that were pushed and those that were carried by hand. The former type could be equipped with a tablet. If baskets were built to certain specifications, it would be relatively easy to apply and thus develop a type of hand-held sensor.
Based on the size of a typical shopping basket, we added loads of approximately 5 kg. To imitate the real-life use of a shopping basket, we loaded items (945 g per item) into the basket and measured the resistance of the pressure sensor. This was conducted every 10 s starting from 1 min after loading to allow the system to stabilize. We measured the resistance 14 times in total, where the weight increased and decreased seven times each. To reduce the influence of the center of gravity, the pressure sensor was installed in a diagonal line. In addition, to produce a more sensitive response to weight, we connected the pressure sensors in series.
In Figure 11a, the horizontal axis shows the weight w in the shopping basket, and the vertical axis shows the resistance value R indicated by the pressure sensor. It can be observed that the standard error was large while the weight was low, and this became smaller as the weight increased. The standard deviation was approximately 2.2 at approximately 1 kg, but reduced to 0.1 and 0.2 at approximately 2 kg and to less than 0.03 at approximately 5.5 kg.
We estimated the weight of the actual load in the shopping basket using the sensor data, which were sampled from the sensor at 0.1 Hz. The linear prediction model was constructed from the measured data, and an experiment to estimate the weight in the shopping cart was conducted. The items in the shopping basket were changed, and the change in the estimated value was measured. We tracked the sequential behavior that resulted in increases (i.e., placing new items into the basket) and decreases (i.e., returning items to the shelf) in the load weight. The results are shown in Figure 11b. The data were unstable for approximately 10 s after loading the heavy objects, but stabilized thereafter. This was speculated to be due to the characteristics of the pressure sensor. Overall, it was determined that changes in the weight of the basket could be tracked using our proposed system.
5.4. Discussion
In this section, we examine the method used to acquire the traffic lines of multiple beacons in the receiving range of the receiver by using a simulation.
The beacon transmitted its own beacon ID after a random waiting time that was uniformly distributed in the range of before each transmission by using a preset average transmission interval T and fluctuation width J of the transmission interval. The receiver decoded the beacon ID from the transmitted signal and estimated the position to obtain a sample of the position of the beacon; furthermore, it estimated the flow line by interpolating and extrapolating the positions between the samples. Here, when multiple communications were performed simultaneously because the decoding of the beacon ID and estimation of the position could not be performed, the samples of all beacons transmitted at the time when the collision occurred could not be processed (Figure 12). In this case, it was considered that the error between the estimated flow line and the true flow line was larger than that in the case where no collision had occurred. Figure 13 shows an example of the true trajectory of a beacon, the estimated trajectory if no collision occurred, and the estimated trajectory if a collision occurred and certain samples were missing.
The simulation presented in this section was performed under the following conditions:
- The beacon moved along a path with a length of 5 m. The location of the beacon was expressed in one-dimensional coordinates, with one entrance at a point of 0 m and the other entrance at a point of 5 m.
- The receiver could receive a signal transmitted from a beacon moving in the passage at a time that did not collide with the beacon and obtain a sample of the beacon position without error. All signals transmitted at the time of collision were ignored.
- In the simulation of a single-trajectory estimation, the beacon looped through the next procedure to determine the next destination in the path.
- Step 1
- The starting point was 0 m.
- Step 2
- The following steps were selected at random:
- One-eighth of the time, move to the 0 m point, and exit the passage.
- Move to the 5 m point with a one-eighth chance of getting out of the way.
- Move randomly to [0, 5] m with a probability of three-quarters; then, rest for a random waiting time of [0, 5] s.
- Step 3
- If the path was exited, the simulation would end. Otherwise, the process returned to step 2.
- The beacon selected a moving speed of 80±10 m/min for each movement and performed uniform linear motion at this speed. However, when the selected moving speed was lower than 30 m/min, it was treated as 30 m/min, and when the selected moving speed was higher than 130 m/min, it was treated as 130 m/min.
- When the obtained number of sample points was zero or one in the simulation of a single flow line estimation, it was excluded from the calculation of the root mean squared error (RMSE) to the true value of the estimated flow line.
- The simulation was repeated until each value to be measured was sufficiently converged.
The collision rate with respect to the number of beacons when the average transmission interval T changed is shown in Figure 14a. In any T, the collision rate increases as the number of beacons increases. In addition, with the same number of beacons, as the value of T increases, the collision rate decreases. Similarly, when the average transmission interval T changes, the RMSE of the estimated flow line relative to the number of beacons relative to the true value is shown in Figure 14b.
It can be confirmed that the error tends to increase as the number of beacons increases. Further, in a region in which the number of beacons is small, as the value of T decreases, the error decreases; however, in the region in which the number of beacons is large, the relationship is generally reversed. It is assumed that this is because the small interval between samples in the region in which the number of beacons is small and the low collision rate in the region in which the number of beacons is large contributed to the improvement of the accuracy of the flow line estimation. Further, s and s show large errors in the region in which the number of beacons is small. It is considered that this is because the flow line generated by the simulation is satisfactory for the average transmission interval and the time length of the flow line is short for the average transmission interval; therefore, the details of the flow line could not be estimated correctly. Thus, it can be said that T must be appropriately set according to the size of the passage, the moving speed of the object, and the moving pattern.
Figure 14a,b show the long-term frequency of collisions and the accuracy of the trajectory estimates affected by them. While a large number of samples is important in the long term for flow estimation, it is also important from the perspective of data utilization, where the samples are not continuously missing. The likelihood of short-term collisions is considered to depend on the fluctuation width, J. For example, if there is no randomness in the latency (), the collision of the first transmission results in the collision of the subsequent transmissions. The rate at which the next transmission of a conflicting transmission will collide again for J is shown in Figure 15a. Thus, it was confirmed that as the value of J increases, the re-collision rate decreases; in particular, in the region where J is small, the decrease in the re-collision rate is more effective.
Similarly, the RMSE for the true value of the estimated flow line for J is shown in Figure 15b. It can be confirmed that the error tends to increase as J increases, regardless of the presence or absence of collision. It is considered that the accuracy of the flow line estimated by interpolation becomes worse because the samples become unequal because of the increase in J. Conversely, in the case of collision, the error decreases when J increases in the region where J is small. It is considered that this is because the loss of continuous samples is made less likely to occur by increasing J. Because of the collision, a loose V-shape is drawn as a whole to obtain the point in which the error reaches its minimum. It is necessary to select the value of J at which the error becomes minimal depending on the number of beacons and the value of T.
6. Conclusions
In this paper, a sensing framework for a VCC process in retail stores was proposed by improving an environment recognition based indoor positioning system with high positioning performance in a metal shelf environment. The conventional indoor positioning systems use radio waves; therefore, errors are caused by reflection, absorption, and interference from metal shelves. An improvement in positioning performance was achieved in the proposed method by using an IR slit and IR light, which avoids such errors. These positioning were calculated under the assumption that the IR beacon is located on a straight line (e.g., the aisle between the shelves) beneath the receiver, whereas the real movements could perform off-the-line as well. The system was designed to recognize many and unspecified people based on the environment recognition method that the receivers had installed, in the service environment. In addition, sensor networking was also conducted by adding a function to transmit payload and identification simultaneously to the beacons that were attached to positioning objects. The effectiveness of the proposed method was verified by installing it not only in an experimental environment with ideal conditions, but posteriorly, the system was tested in real conditions, in a retail store. In our experimental setup, in a comparison with equal element numbers, positioning identification was possible within an error of 96.2 mm in a static environment in contrast to the radio wave based method where an average positioning error of approximately 648 mm was measured using the radio wave based method (Bluetooth low-energy fingerprinting technique). Moreover, when multiple beacons were used simultaneously in our system within the measurement range of one receiver, the appropriate setting of the pulse interval and jitter rate was implemented by simulation. Additionally, it was confirmed that, in a real scenario, it is possible to measure the changes in movement and positional relationships between people. This result shows the feasibility of measuring and evaluating the VCC process in retail stores, although it was difficult to measure the interaction between actors.
In future work, in order to measure the interaction between service actors more accurately, it will be necessary to measure dynamic measurement performance. Moreover, it will be important to combine this approach with other sensors; in particular, a positioning system that obtains its own position by integral calculation and a technology that corrects the estimated position based on its statistical information. In addition, since the light emission timing can be adjusted by bidirectional communication instead of one-way communication, as in this case, positioning efficiency should be improved even when multiple IR beacons are present. However, this leads to increased battery consumption and hardware, so there is a trade-off between the desired accuracy and how complicated the system can be in the usage environment. In the future, we plan to work on a feasibility study of how the quality of service will change by measuring and intervening in the interaction between salespeople and customers at actual stores.
Author Contributions
Conceptualization, K.Z. and Y.O.; methodology, K.Z.; software, T.A. (Takuya Aoki); validation, T.A. (Taiga Arai) and T.A. (Takuya Aoki); writing, original draft preparation, K.Z.; writing, review and editing, Y.O.; visualization, K.Z. and T.A. (Takuya Aoki). All authors read and agreed to the published version of the manuscript.
Funding
This work is based on results obtained from the SamuRAI (Strategic Advancement of Multi-Purpose Ultra-Human Robot and Artificial Intelligence Technologies) project commissioned by the New Energy and Industrial Technology Development Organization (NEDO).
Institutional Review Board Statement
The study was conducted according to the guidelines of the Declaration of Helsinki, and approved by the Ethics Review Committee of Faculty of Engineering, Information and Systems, University of Tsukuba (2017R196, 14 December, 2017).
Informed Consent Statement
Informed consent was obtained from all subjects involved in the study.
Acknowledgments
The authors are grateful to K. Onuma (Welcia Holdings Co., Ltd.) for providing the place and opportunity for this experiment. The authors would also thank Y. Fujita, N. Sakai, T. Yoshizawa, K. Shinbayashi, and Y. Suda for their development and experimental cooperation.
Conflicts of Interest
The authors declare no conflict of interest.
References
- Vargo, S.L.; Lusch, R.F. Service-dominant logic: Continuing the evolution. J. Acad. Mark. Sci. 2008, 36, 1–10. [Google Scholar] [CrossRef]
- Merz, M.A.; Zarantonello, L.; Grappi, S. How valuable are your customers in the brand value co-creation process? The development of a Customer Co-Creation Value (CCCV) scale. J. Bus. Res. 2018, 82, 79–89. [Google Scholar] [CrossRef] [Green Version]
- Andreu, L.; Sánchez, I.; Mele, C. Value co-creation among retailers and consumers: New insights into the furniture market. J. Retail. Consum. Serv. 2010, 17, 241–250. [Google Scholar] [CrossRef]
- Spena, T.R.; Caridà, A.; Colurcio, M.; Melia, M. Store experience and co-creation: The case of temporary shop. Int. J. Retail. Distrib. Manag. 2012. [Google Scholar] [CrossRef]
- Turner, T.; Shockley, J. Creating shopper value: Co-creation roles, in-store self-service technology use, and value differentiation. J. Promot. Manag. 2014, 20, 311–327. [Google Scholar] [CrossRef]
- Jaakkola, E.; Alexander, M. The role of customer engagement behavior in value co-creation: A service system perspective. J. Serv. Res. 2014, 17, 247–261. [Google Scholar] [CrossRef] [Green Version]
- Ranjan, K.R.; Read, S. Value co-creation: Concept and measurement. J. Acad. Mark. Sci. 2016, 44, 290–315. [Google Scholar] [CrossRef]
- Urmson, C.; Anhalt, J.; Bagnell, D.; Baker, C.; Bittner, R.; Clark, M.; Dolan, J.; Duggins, D.; Galatali, T.; Geyer, C.; et al. Autonomous driving in urban environments: Boss and the urban challenge. J. Field Robot. 2008, 25, 425–466. [Google Scholar] [CrossRef] [Green Version]
- Wahl, C. Uber Eats the World. In New Labor Forum; SAGE Publications Sage CA: Los Angeles, CA, USA, 2019; Volume 28, pp. 87–90. [Google Scholar]
- Althoff, T.; White, R.W.; Horvitz, E. Influence of Pokémon Go on physical activity: Study and implications. J. Med. Internet Res. 2016, 18, e315. [Google Scholar] [CrossRef] [PubMed]
- Mendoza-Silva, G.M.; Torres-Sospedra, J.; Huerta, J. A meta-review of indoor positioning systems. Sensors 2019, 19, 4507. [Google Scholar] [CrossRef] [Green Version]
- Arai, T.; Yoshizawa, T.; Aoki, T.; Zempo, K.; Okada, Y. Evaluation of indoor positioning system based on attachable infrared beacons in metal shelf environment. In Proceedings of the 2019 IEEE International Conference on Consumer Electronics (ICCE), Las Vegas, NV, USA, 11–13 January 2019; pp. 1–4. [Google Scholar]
- Suda, Y.; Arai, T.; Yoshizawa, T.; Fujita, Y.; Zempo, K.; Okada, Y. Shopping baskets for on-line beacon sensor network in retail store. In Proceedings of the 2019 16th IEEE Annual Consumer Communications & Networking Conference (CCNC), Las Vegas, NV, USA, 11–14 January 2019; pp. 1–2. [Google Scholar]
- Fujii, K.; Sakamoto, Y.; Wang, W.; Arie, H.; Schmitz, A.; Sugano, S. Hyperbolic positioning with antenna arrays and multi-channel pseudolite for indoor localization. Sensors 2015, 15, 25157–25175. [Google Scholar] [CrossRef] [Green Version]
- Li, Z.; Feng, L.; Yang, A. Fusion based on visible light positioning and inertial navigation using extended Kalman filters. Sensors 2017, 17, 1093. [Google Scholar]
- Ramadhan, H.; Yustiawan, Y.; Kwon, J. Applying Movement Constraints to BLE RSSI-Based Indoor Positioning for Extracting Valid Semantic Trajectories. Sensors 2020, 20, 527. [Google Scholar] [CrossRef] [PubMed] [Green Version]
- Wang, X.; Chen, G.; Yang, M.; Jin, S. A Multi-Mode PDR Perception and Positioning System Assisted by Map Matching and Particle Filtering. ISPRS Int. J. Geoinf. 2020, 9, 93. [Google Scholar] [CrossRef] [Green Version]
- Wang, X.; Jiang, M.; Guo, Z.; Hu, N.; Sun, Z.; Liu, J. An indoor positioning method for smartphones using landmarks and PDR. Sensors 2016, 16, 2135. [Google Scholar] [CrossRef]
- Klein, I. Smartphone location recognition: A deep learning-based approach. Sensors 2020, 20, 214. [Google Scholar] [CrossRef] [Green Version]
- Duque Domingo, J.; Cerrada, C.; Valero, E.; Cerrada, J.A. An improved indoor positioning system using RGB-D cameras and wireless networks for use in complex environments. Sensors 2017, 17, 2391. [Google Scholar] [CrossRef] [Green Version]
- Merriaux, P.; Dupuis, Y.; Boutteau, R.; Vasseur, P.; Savatier, X. A study of vicon system positioning performance. Sensors 2017, 17, 1591. [Google Scholar] [CrossRef]
- Huang, C.H.; Lee, L.H.; Ho, C.C.; Wu, L.L.; Lai, Z.H. Real-time RFID indoor positioning system based on Kalman-filter drift removal and Heron-bilateration location estimation. IEEE Trans. Instrum. Meas. 2014, 64, 728–739. [Google Scholar] [CrossRef]
- Shen, J.; Jin, C.; Liu, D. A Survey on the Research of Indoor RFID Positioning System. In International Conference on Cloud Computing and Security; Springer: Berlin/Heidelberg, Germany, 2016; pp. 264–274. [Google Scholar]
- Raharijaona, T.; Mawonou, R.; Nguyen, T.V.; Colonnier, F.; Boyron, M.; Diperi, J.; Viollet, S. Local positioning system using flickering infrared leds. Sensors 2017, 17, 2518. [Google Scholar] [CrossRef] [Green Version]
- Arbula, D.; Ljubic, S. Indoor Localization Based on Infrared Angle of Arrival Sensor Network. Sensors 2020, 20, 6278. [Google Scholar] [CrossRef] [PubMed]
- Cong, L.; Wang, H.; Qin, H.; Liu, L. An Environmentally-Adaptive Positioning Method Based on Integration of GPS/DTMB/FM. Sensors 2018, 18, 4292. [Google Scholar] [CrossRef] [PubMed] [Green Version]
- Liao, X.; Chen, R.; Li, M.; Guo, B.; Niu, X.; Zhang, W. Design of a Smartphone Indoor Positioning Dynamic Ground Truth Reference System Using Robust Visual Encoded Targets. Sensors 2019, 19, 1261. [Google Scholar] [CrossRef] [PubMed] [Green Version]
- Baronti, P.; Barsocchi, P.; Chessa, S.; Mavilia, F.; Palumbo, F. Indoor Bluetooth low energy dataset for localization, tracking, occupancy, and social interaction. Sensors 2018, 18, 4462. [Google Scholar] [CrossRef] [PubMed] [Green Version]
- Wang, S.S. A BLE-based pedestrian navigation system for car searching in indoor parking garages. Sensors 2018, 18, 1442. [Google Scholar] [CrossRef] [PubMed]
- Xu, H.; Ding, Y.; Li, P.; Wang, R.; Li, Y. An RFID indoor positioning algorithm based on Bayesian probability and K-nearest neighbor. Sensors 2017, 17, 1806. [Google Scholar] [CrossRef] [PubMed] [Green Version]
- Sun, J.; Li, B.; Jiang, Y.; Wen, C.Y. A camera-based target detection and positioning UAV system for search and rescue (SAR) purposes. Sensors 2016, 16, 1778. [Google Scholar] [CrossRef] [Green Version]
- Deak, G.; Curran, K.; Condell, J. A survey of active and passive indoor localisation systems. Comput. Commun. 2012, 35, 1939–1954. [Google Scholar] [CrossRef]
- Zhuang, Y.; Lan, H.; Li, Y.; El-Sheimy, N. PDR/INS/WiFi integration based on handheld devices for indoor pedestrian navigation. Micromachines 2015, 6, 793–812. [Google Scholar] [CrossRef] [Green Version]
- Si, M.; Wang, Y.; Xu, S.; Sun, M.; Cao, H. A Wi-Fi FTM-Based Indoor Positioning Method with LOS/NLOS Identification. Appl. Sci. 2020, 10, 956. [Google Scholar] [CrossRef] [Green Version]
- Do, T.H.; Yoo, M. An in-depth survey of visible light communication based positioning systems. Sensors 2016, 16, 678. [Google Scholar] [CrossRef] [PubMed] [Green Version]
- Zhuang, Y.; Hua, L.; Qi, L.; Yang, J.; Cao, P.; Cao, Y.; Wu, Y.; Thompson, J.; Haas, H. A survey of positioning systems using visible LED lights. IEEE Commun. Surv. Tutor. 2018, 20, 1963–1988. [Google Scholar] [CrossRef] [Green Version]
- Afzalan, M.; Jazizadeh, F. Indoor positioning based on visible light communication: A performance-based survey of real-world prototypes. ACM Comput. Surv. 2019, 52, 1–36. [Google Scholar] [CrossRef]
- Cadena, C.; Carlone, L.; Carrillo, H.; Latif, Y.; Scaramuzza, D.; Neira, J.; Reid, I.; Leonard, J.J. Past, present, and future of simultaneous localization and mapping: Toward the robust-perception age. IEEE Trans. Robot. 2016, 32, 1309–1332. [Google Scholar] [CrossRef] [Green Version]
- Shi, G.; Ming, Y. Survey of indoor positioning systems based on ultra-wideband (UWB) technology. In Wireless Communications, Networking and Applications; Springer: Berlin/Heidelberg, Germany, 2016; pp. 1269–1278. [Google Scholar]
- Alarifi, A.; Al-Salman, A.; Alsaleh, M.; Alnafessah, A.; Al-Hadhrami, S.; Al-Ammar, M.A.; Al-Khalifa, H.S. Ultra wideband indoor positioning technologies: Analysis and recent advances. Sensors 2016, 16, 707. [Google Scholar] [CrossRef]
- Mazhar, F.; Khan, M.G.; Sällberg, B. Precise indoor positioning using UWB: A review of methods, algorithms and implementations. Wirel. Pers. Commun. 2017, 97, 4467–4491. [Google Scholar] [CrossRef]
- Yang, Z.; Wu, C.; Zhou, Z.; Zhang, X.; Wang, X.; Liu, Y. Mobility increases localizability: A survey on wireless indoor localization using inertial sensors. ACM Comput. Surv. 2015, 47, 1–34. [Google Scholar] [CrossRef]
- Diaz, E.M.; Ahmed, D.B.; Kaiser, S. A review of indoor localization methods based on inertial sensors. In Geographical and Fingerprinting Data to Create Systems for Indoor Positioning and Indoor/Outdoor Navigation; Elsevier: Amsterdam, The Netherlands, 2019; pp. 311–333. [Google Scholar]
- Huynh, P.; Yoo, M. VLC-based positioning system for an indoor environment using an image sensor and an accelerometer sensor. Sensors 2016, 16, 783. [Google Scholar] [CrossRef] [Green Version]
- Correa, A.; Barcelo, M.; Morell, A.; Vicario, J.L. A review of pedestrian indoor positioning systems for mass market applications. Sensors 2017, 17, 1927. [Google Scholar] [CrossRef] [Green Version]
- Niculescu, D.; Nath, B. Ad hoc positioning system (APS) using AOA. In Proceedings of the IEEE INFOCOM 2003. Twenty-Second Annual Joint Conference of the IEEE Computer and Communications Societies (IEEE Cat. No. 03CH37428), San Francisco, CA, USA, 30 March–3 April 2003; Volume 3, pp. 1734–1743. [Google Scholar]
- Pierlot, V.; Van Droogenbroeck, M. A new three object triangulation algorithm for mobile robot positioning. IEEE Trans. Robot. 2014, 30, 566–577. [Google Scholar] [CrossRef] [Green Version]
- Shang, J.; Hu, X.; Gu, F.; Wang, D.; Yu, S. Improvement schemes for indoor mobile location estimation: A survey. Math. Probl. Eng. 2015, 2015. [Google Scholar] [CrossRef]
- Liu, H.; Darabi, H.; Banerjee, P.; Liu, J. Survey of wireless indoor positioning techniques and systems. IEEE Trans. Syst. Man Cybern. 2007, 37, 1067–1080. [Google Scholar] [CrossRef]
- Boukerche, A.; Oliveira, H.A.; Nakamura, E.F.; Loureiro, A.A. Localization systems for wireless sensor networks. IEEE Wirel. Commun. 2007, 14, 6–12. [Google Scholar] [CrossRef]
- Bahl, P.; Padmanabhan, V.N. RADAR: An in-building RF-based user location and tracking system. In Proceedings of the IEEE INFOCOM 2000, Conference on Computer Communications, Nineteenth Annual Joint Conference of the IEEE Computer and Communications Societies (Cat. No. 00CH37064), Tel Aviv, Israel, 26–30 March 2000; Volume 2, pp. 775–784. [Google Scholar]
- Han, D.; Jung, S.; Lee, M.; Yoon, G. Building a practical Wi-Fi-based indoor navigation system. IEEE Pervasive Comput. 2014, 13, 72–79. [Google Scholar]
- Nuño-Barrau, G.; Páez-Borrallo, J.M. A new location estimation system for wireless networks based on linear discriminant functions and hidden Markov models. EURASIP J. Adv. Signal Process. 2006, 2006, 068154. [Google Scholar] [CrossRef] [Green Version]
- Subbu, K.P.; Gozick, B.; Dantu, R. Indoor localization through dynamic time warping. In Proceedings of the 2011 IEEE International Conference on Systems, Man, and Cybernetics, Anchorage, AK, USA, 9–12 October 2011; pp. 1639–1644. [Google Scholar]
- Wu, H.; He, S.; Chan, S.H.G. Efficient sequence matching and path construction for geomagnetic indoor localization. In Proceedings of the 2017 International Conference on Embedded Wireless Systems and Networks, Uppsala, Sweden, 20–22 February 2017; pp. 156–167. [Google Scholar]
- Youssef, M.; Agrawala, A. The Horus WLAN location determination system. In Proceedings of the 3rd International Conference on Mobile Systems, Applications, and Services, Seattle, WA, USA, 6–8 June 2005; pp. 205–218. [Google Scholar]
- Madigan, D.; Einahrawy, E.; Martin, R.P.; Ju, W.H.; Krishnan, P.; Krishnakumar, A. Bayesian indoor positioning systems. In Proceedings of the IEEE 24th Annual Joint Conference of the IEEE Computer and Communications Societies, Miami, FL, USA, 13–17 March 2005; Volume 2, pp. 1217–1227. [Google Scholar]
- Mirowski, P.; Whiting, P.; Steck, H.; Palaniappan, R.; MacDonald, M.; Hartmann, D.; Ho, T.K. Probability kernel regression for WiFi localisation. J. Locat. Based Serv. 2012, 6, 81–100. [Google Scholar] [CrossRef]
- Khandker, S.; Torres-Sospedra, J.; Ristaniemi, T. Analysis of Received Signal Strength Quantization in Fingerprinting Localization. Sensors 2020, 20, 3203. [Google Scholar] [CrossRef]
- Foxlin, E. Pedestrian tracking with shoe-mounted inertial sensors. IEEE Comput. Graph. Appl. 2005, 25, 38–46. [Google Scholar] [CrossRef]
- Jiménez, A.R.; Seco, F.; Prieto, J.C.; Guevara, J. Indoor pedestrian navigation using an INS/EKF framework for yaw drift reduction and a foot-mounted IMU. In Proceedings of the 2010 7th Workshop on Positioning, Navigation and Communication, Dresden, Germany, 11–12 March 2010; pp. 135–143. [Google Scholar]
- Zampella, F.; Khider, M.; Robertson, P.; Jiménez, A. Unscented Kalman filter and magnetic angular rate update (MARU) for an improved pedestrian dead-reckoning. In Proceedings of the 2012 IEEE/ION Position, Location and Navigation Symposium, Myrtle Beach, SC, USA, 23–26 April 2012; pp. 129–139. [Google Scholar]
- Munoz Diaz, E. Inertial pocket navigation system: Unaided 3D positioning. Sensors 2015, 15, 9156–9178. [Google Scholar] [CrossRef] [Green Version]
- Kang, W.; Han, Y. SmartPDR: Smartphone-based pedestrian dead reckoning for indoor localization. IEEE Sens. J. 2014, 15, 2906–2916. [Google Scholar] [CrossRef]
- Jimenez, A.R.; Seco, F.; Prieto, C.; Guevara, J. A comparison of pedestrian dead-reckoning algorithms using a low-cost MEMS IMU. In Proceedings of the 2009 IEEE International Symposium on Intelligent Signal Processing, Budapest, Hungary, 26–28 August 2009; pp. 37–42. [Google Scholar]
- Xu, H.; Li, Q.; Wang, J.; Chen, K.; Sun, W. An improved MDS localisation algorithm for a WSN in a sub-surface mine. Int. J. Sens. Netw. 2019, 29, 58–73. [Google Scholar] [CrossRef]
- Zou, H.; Jiang, H.; Luo, Y.; Zhu, J.; Lu, X.; Xie, L. Bluedetect: An ibeacon-enabled scheme for accurate and energy-efficient indoor-outdoor detection and seamless location-based service. Sensors 2016, 16, 268. [Google Scholar] [CrossRef] [Green Version]
- Liu, Q.; Yang, X.; Deng, L. An IBeacon-based location system for smart home control. Sensors 2018, 18, 1897. [Google Scholar] [CrossRef] [Green Version]
- Tang, K.; Liu, A.; Wang, W.; Li, P.; Chen, X. A novel fingerprint sensing technology based on electrostatic imaging. Sensors 2018, 18, 3050. [Google Scholar] [CrossRef] [Green Version]
- Li, M.; Zhao, L.; Tan, D.; Tong, X. BLE fingerprint indoor localization algorithm based on eight-neighborhood template matching. Sensors 2019, 19, 4859. [Google Scholar] [CrossRef] [Green Version]
- Chen, L.; Li, B.; Zhao, K.; Rizos, C.; Zheng, Z. An improved algorithm to generate a Wi-Fi fingerprint database for indoor positioning. Sensors 2013, 13, 11085–11096. [Google Scholar] [CrossRef] [Green Version]
- Arai, T.; Chida, Y.; Okada, Y.; Zempo, K. Sensor network to measure MAAI on value co-creation process: Feasibility study of MAAI optimization on customer service. In Proceedings of the 2019 ACM International Joint Conference on Pervasive and Ubiquitous Computing, London, UK, 11–13 September 2019; pp. 1–4. [Google Scholar]
Figure 1.
Value co-creation process of services that should be measured, which has been overlooked, considering customer service in retail stores as an example.
Figure 1.
Value co-creation process of services that should be measured, which has been overlooked, considering customer service in retail stores as an example.

Figure 2.
(a) Infrared (IR) beacon and applications; (b) hand cart; (c) small robots; (d) shopping basket; and (e) multicopters.
Figure 2.
(a) Infrared (IR) beacon and applications; (b) hand cart; (c) small robots; (d) shopping basket; and (e) multicopters.
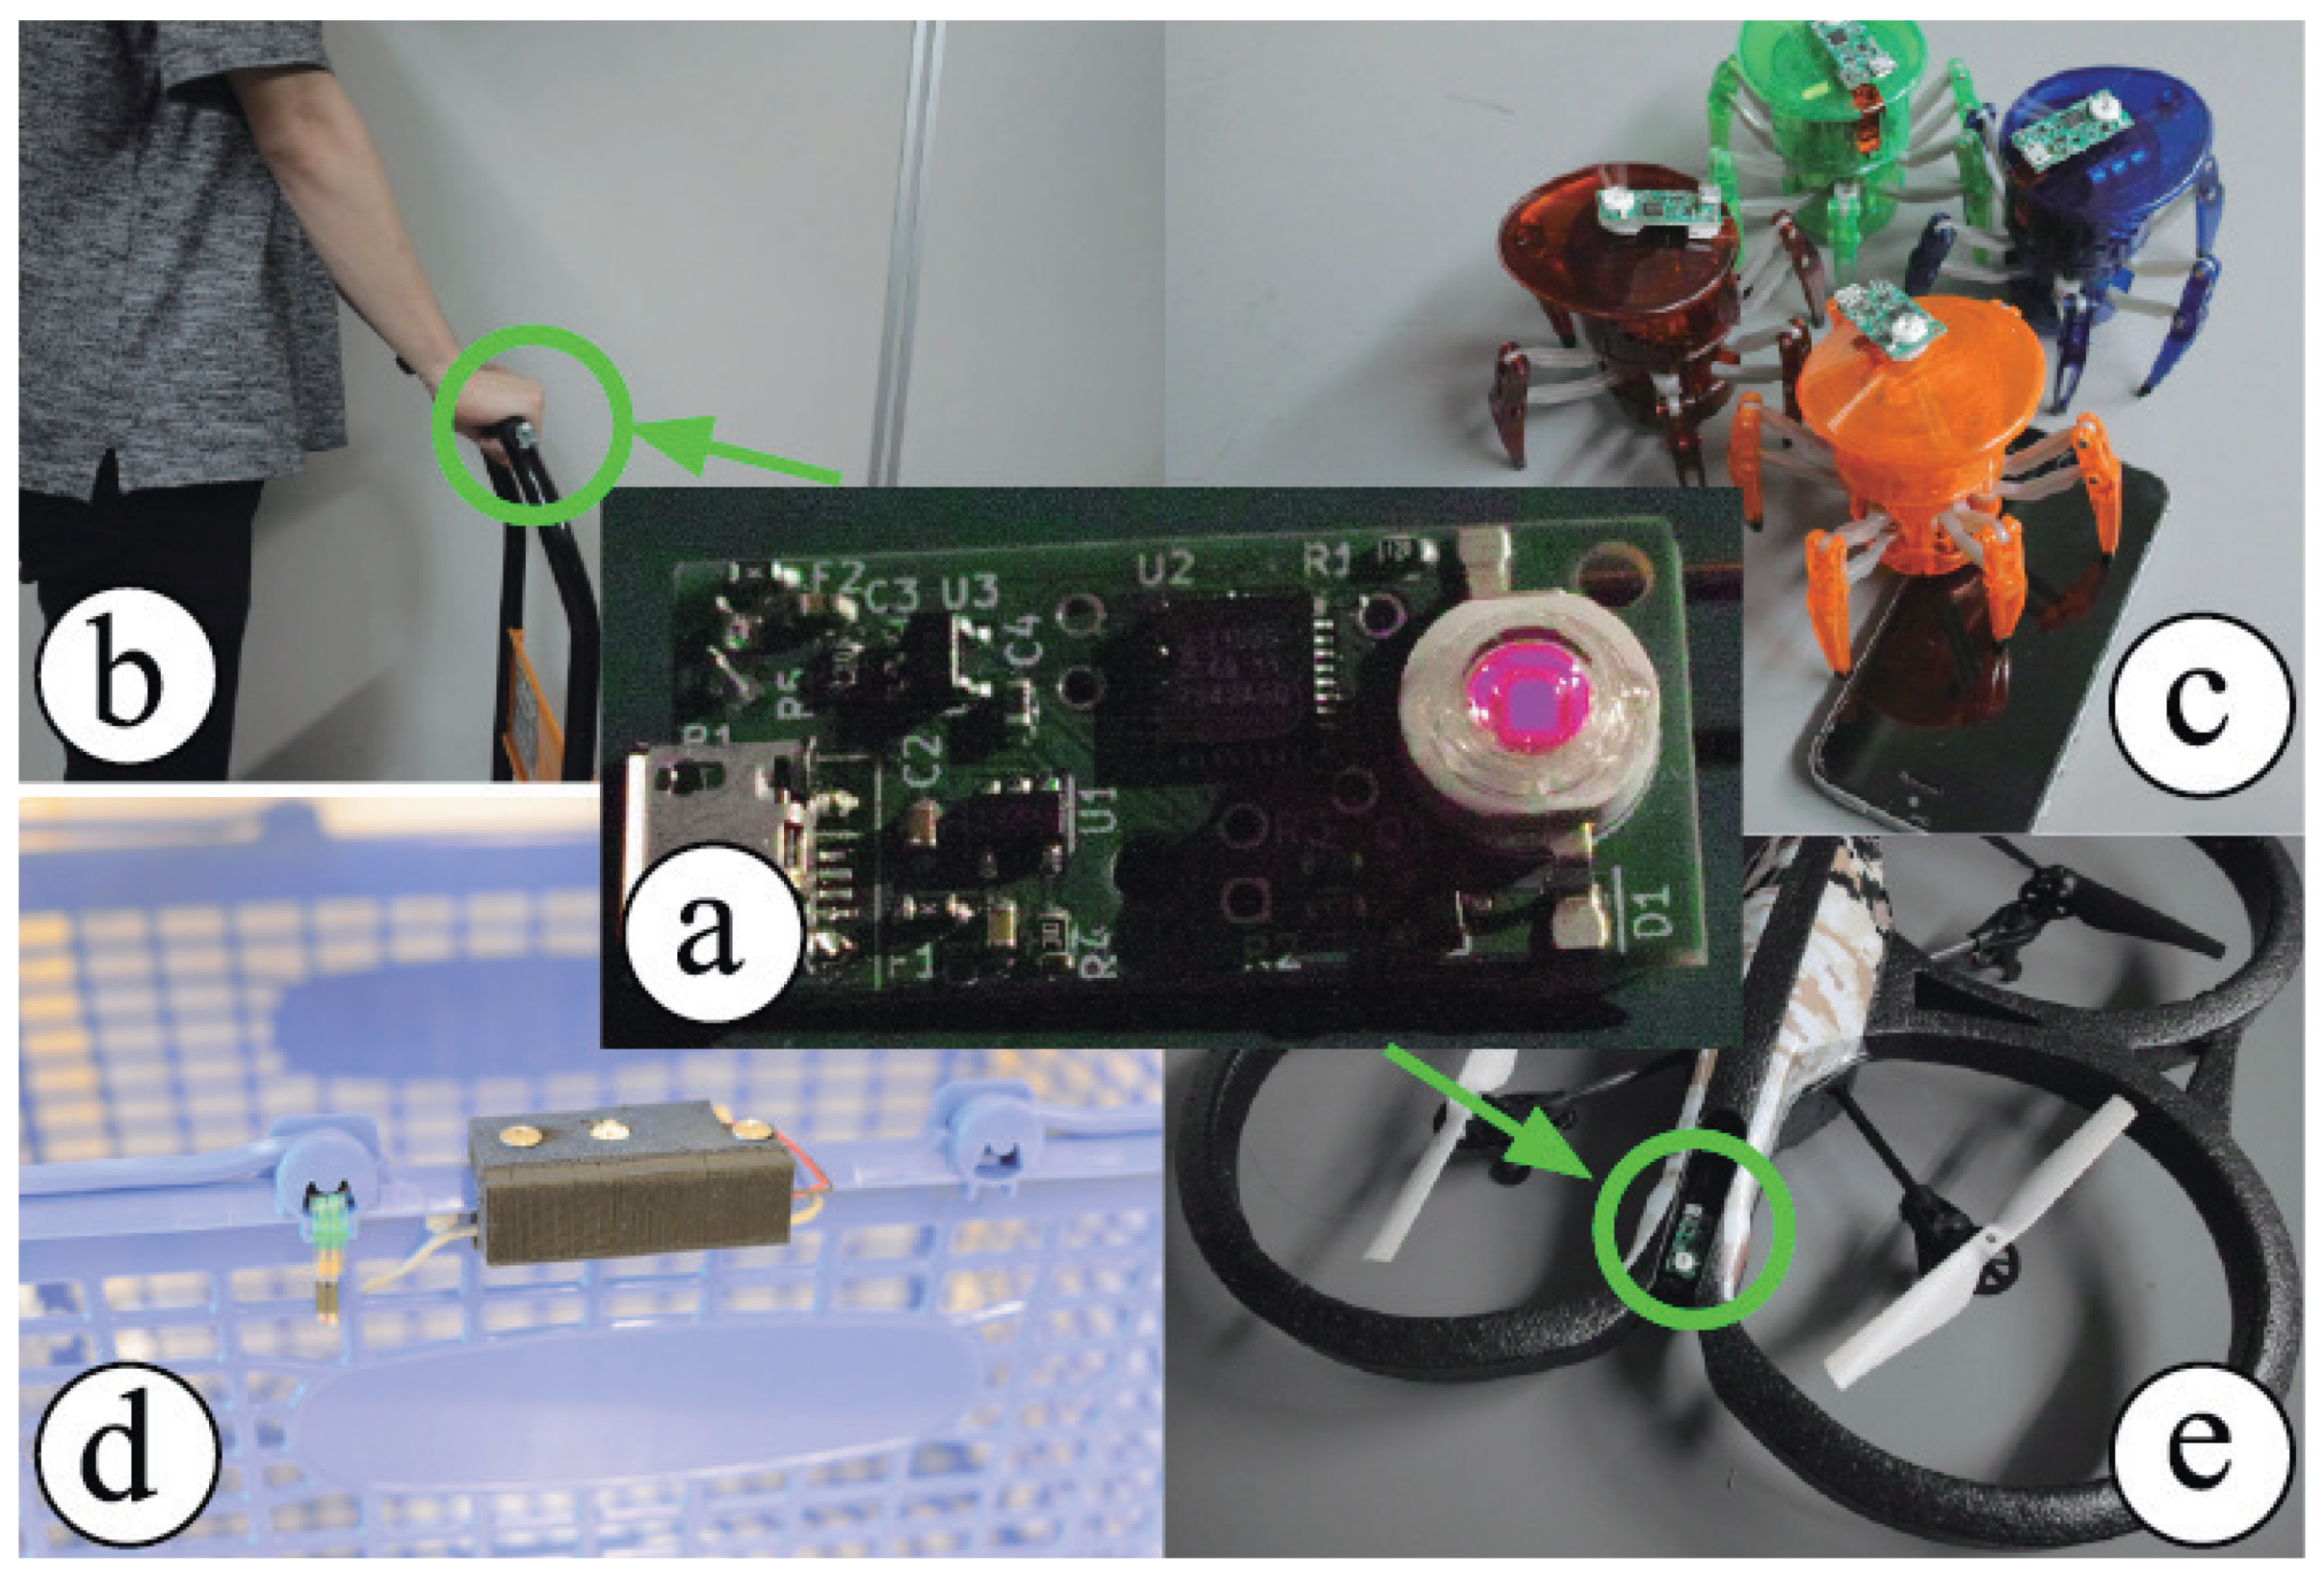
Figure 3.
Architecture of the indoor positioning system. This positioning system is composed of beacons, receivers, and the processing PC. The IR beacon sends ID signals and is attached to objects. The receivers are installed on the ceiling. They demodulate the IR signal into information that the processing PC uses to construct the movement map. (a) Example of the emission pattern of the IR LED modulated by pulse-width modulation and the method for inserting the payload into the IR signal; (b) Mechanism of the slit “spotlights”, a part of the measurement plane; (c) Indoor positioning method for performing positioning with multiple angles of arrival, i.e., and , and when a signal is received by only one receiver. PSD, position-sensitive detector.

Figure 4.
Passage environment surrounded by metal shelves. An IR beacon and Bluetooth Low-Energy (BLE) receiver (iPhone operating system based device) were placed on the cart, as a mobile object, to perform positioning simultaneously.
Figure 4.
Passage environment surrounded by metal shelves. An IR beacon and Bluetooth Low-Energy (BLE) receiver (iPhone operating system based device) were placed on the cart, as a mobile object, to perform positioning simultaneously.
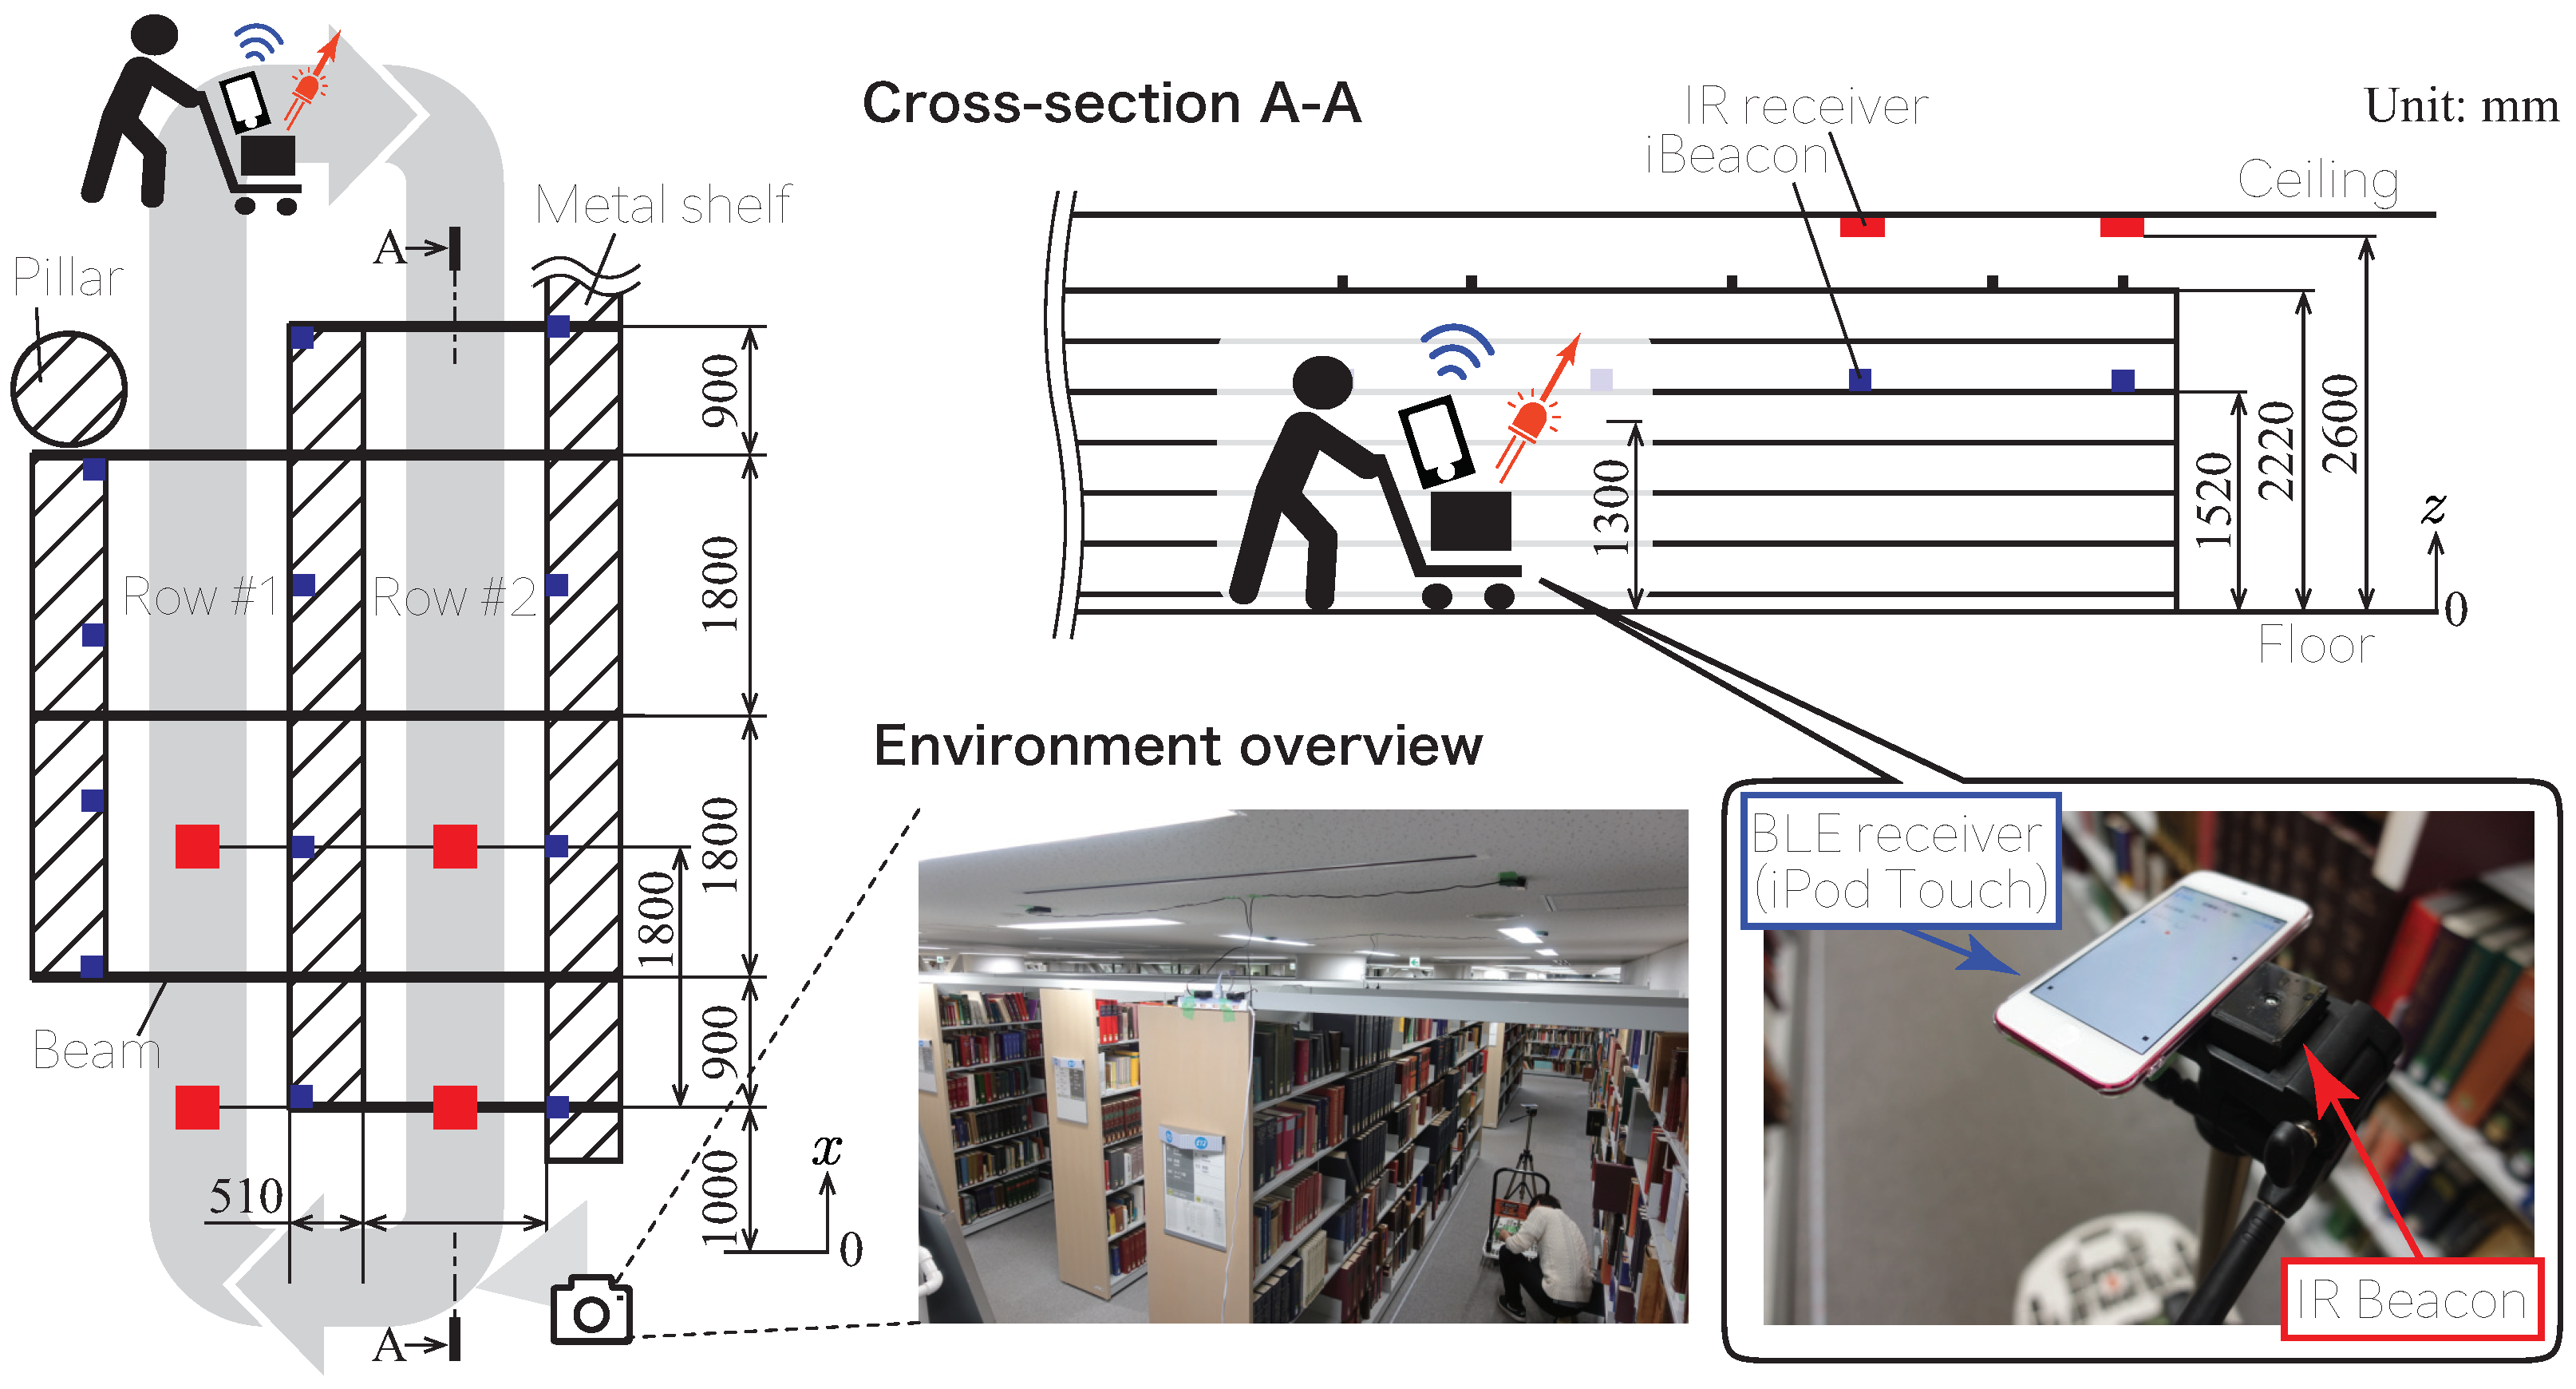
Figure 5.
Comparison of positioning performance using a single beacon (the two receivers were installed on the ceiling at distances of 1000 mm and 2800 mm).
Figure 5.
Comparison of positioning performance using a single beacon (the two receivers were installed on the ceiling at distances of 1000 mm and 2800 mm).

Figure 6.
Comparison of positioning performance using multiple beacons (beacons were arranged at 1200, 1900, and 3000 mm distances for a widely distributed configuration, 1500, 2000, and 2800 mm for the medium condition, and 1200, 1500, and 1800 mm for a narrowly distributed configuration, respectively.).
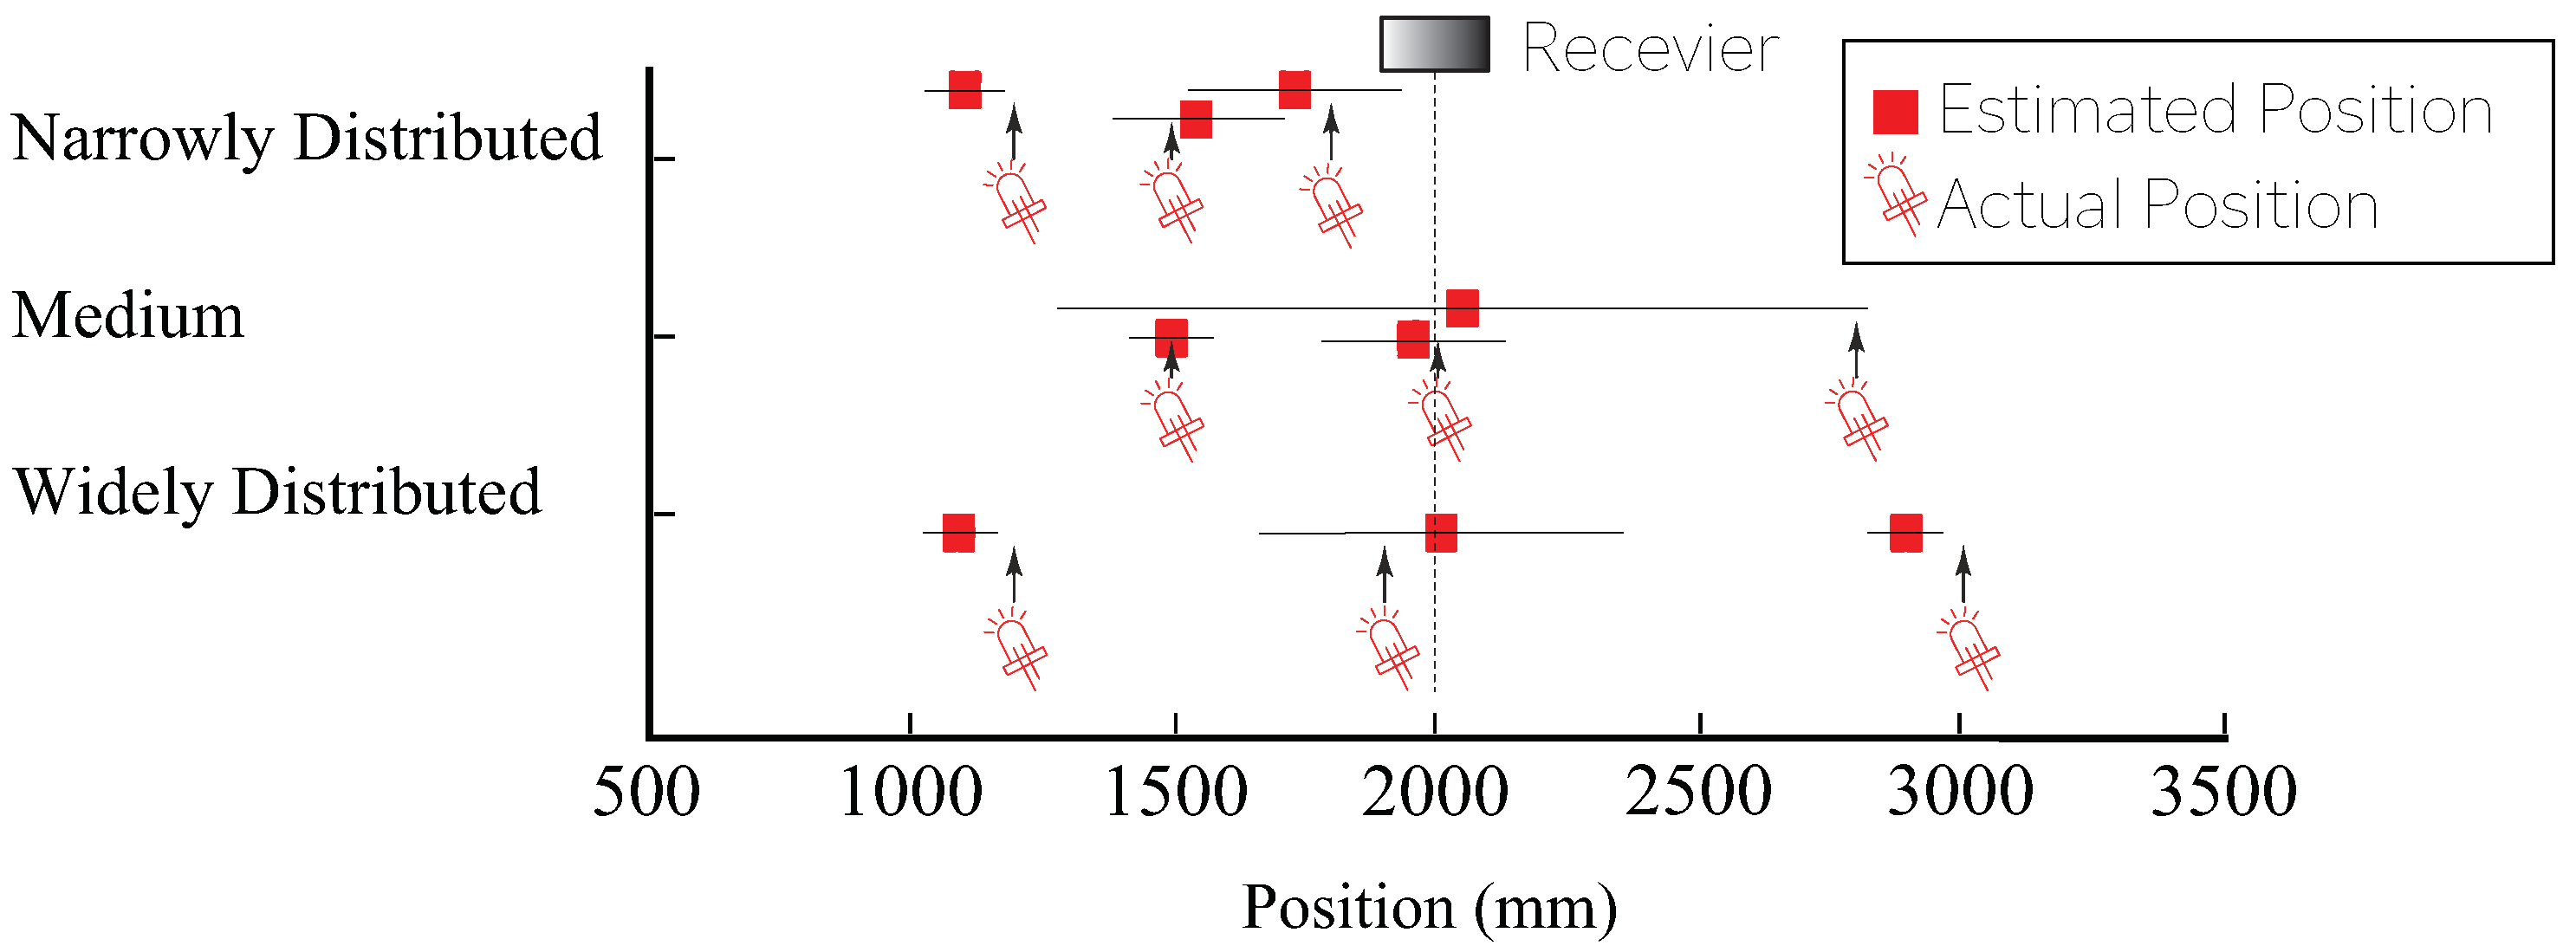
Figure 7.
Three-dimensional plot of positioning results. The red line represents the IR beacon, and the blue line represents the BLE beacon. The transverse axis of the graph represents the passage of time; the longitudinal axis represents the depth of the passage (position described as x in Figure 4); moreover, the depth axis represents the two passages (transverse axis in Figure 4). While the IR beacon is able to track movement for 10 laps by moving back and forth between two paths, the BLE beacon failed to track the movement correctly.
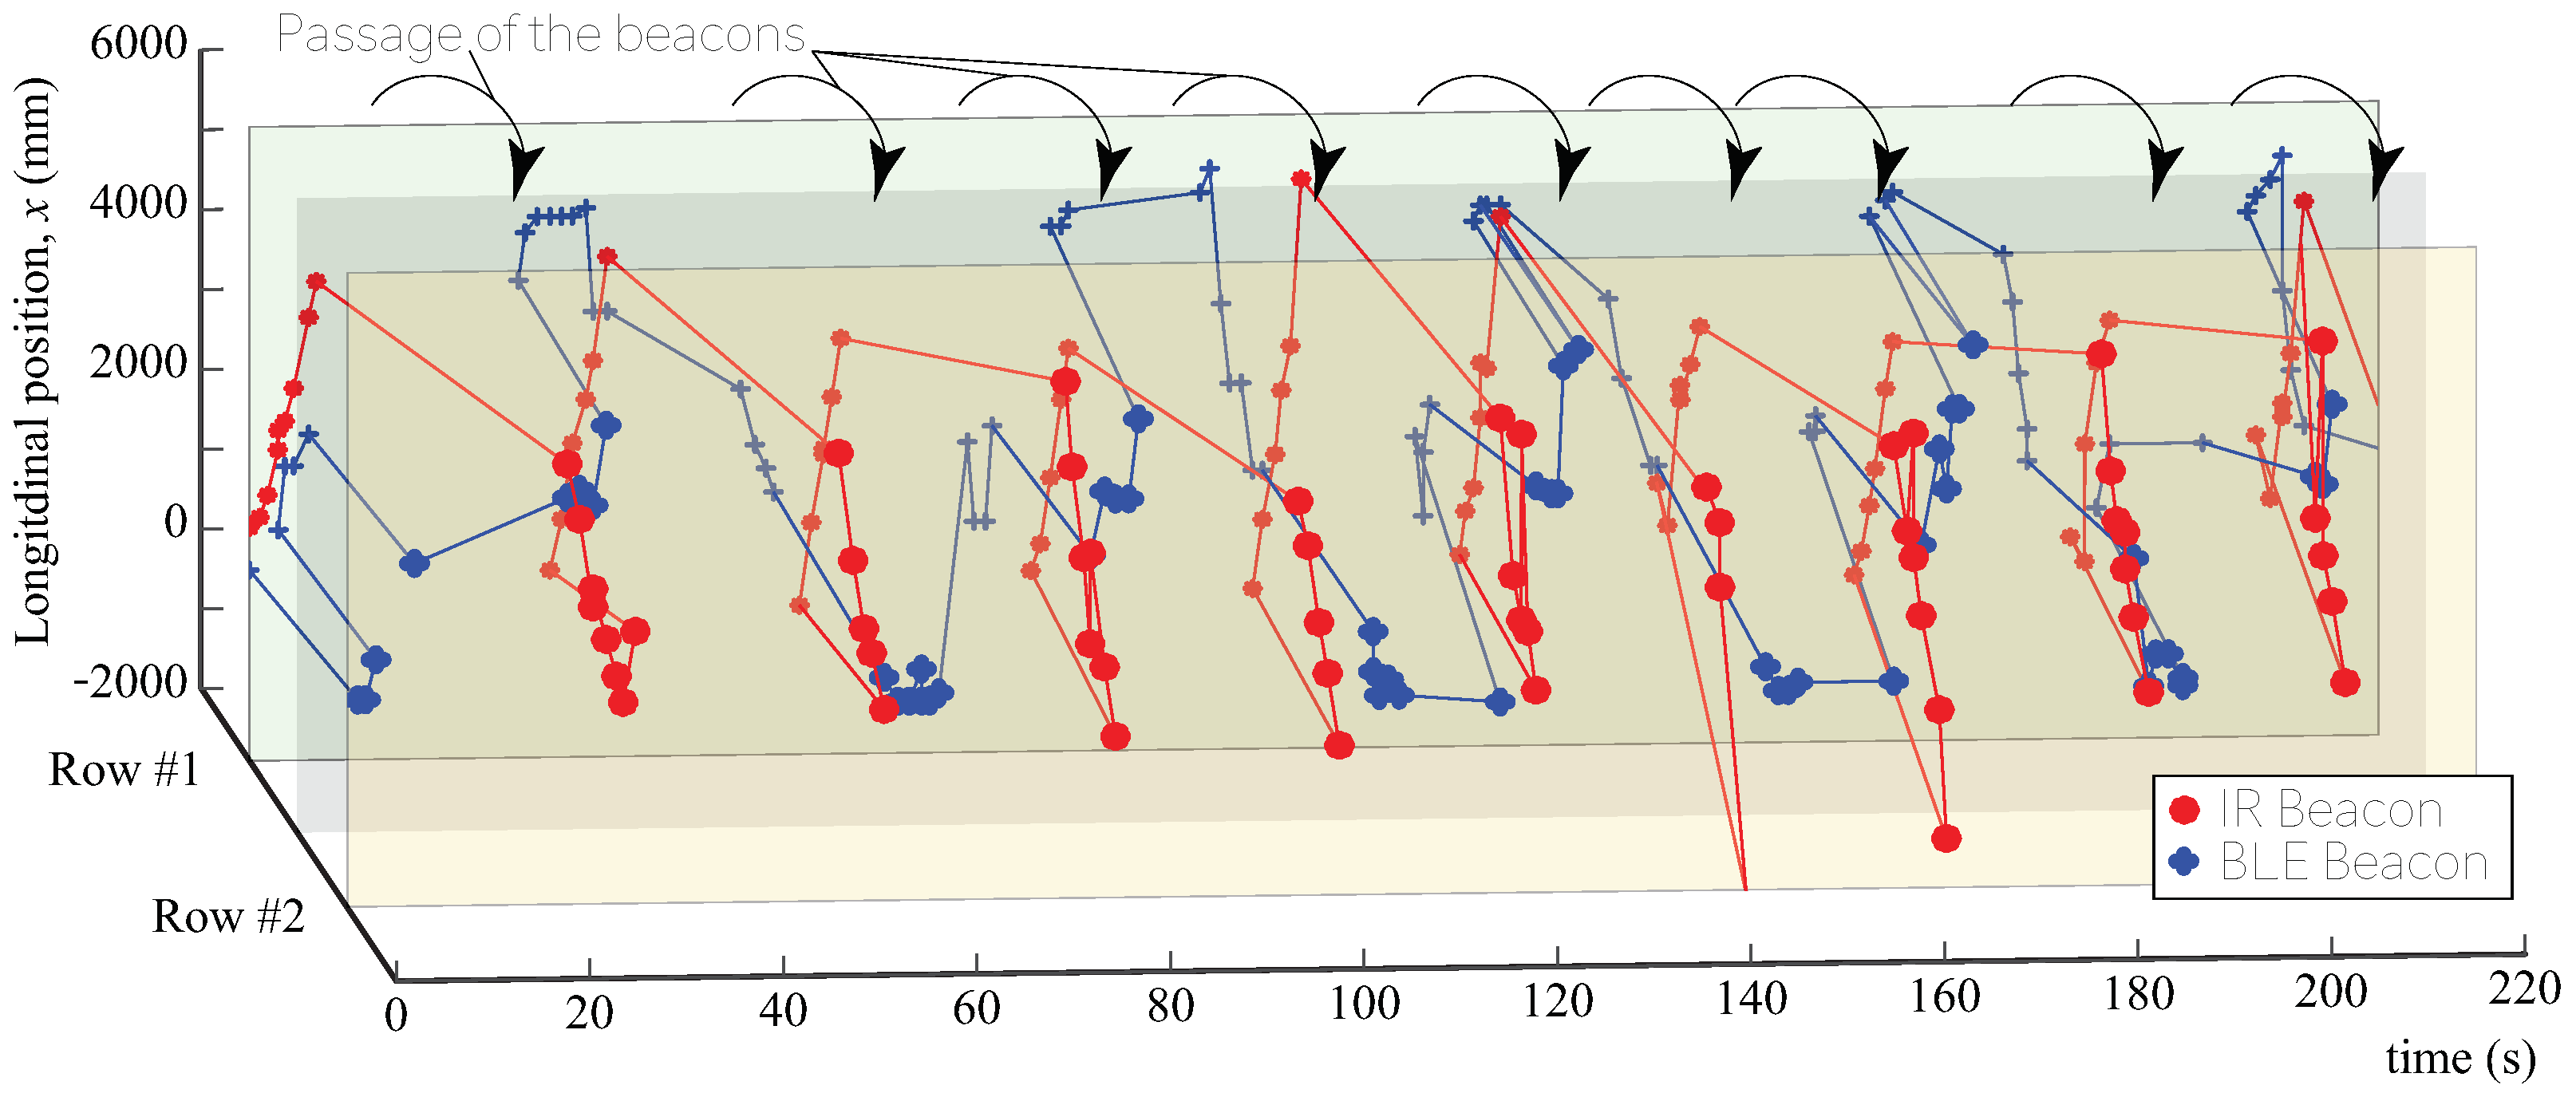
Figure 8.
Layout of IR receivers installed in the retail store. The receivers were connected using ZigBee, and power was taken from the outlet. IR receivers were installed on the ceiling of the retail store in the cosmetics sales area (∼40 m).
Figure 8.
Layout of IR receivers installed in the retail store. The receivers were connected using ZigBee, and power was taken from the outlet. IR receivers were installed on the ceiling of the retail store in the cosmetics sales area (∼40 m).

Figure 9.
Behavior of the tracked relative relationships among multiple IR Beacons.

Figure 10.
Measuring the interaction between service actors (customer and merchandise) while customers moved in stores [13].
Figure 10.
Measuring the interaction between service actors (customer and merchandise) while customers moved in stores [13].
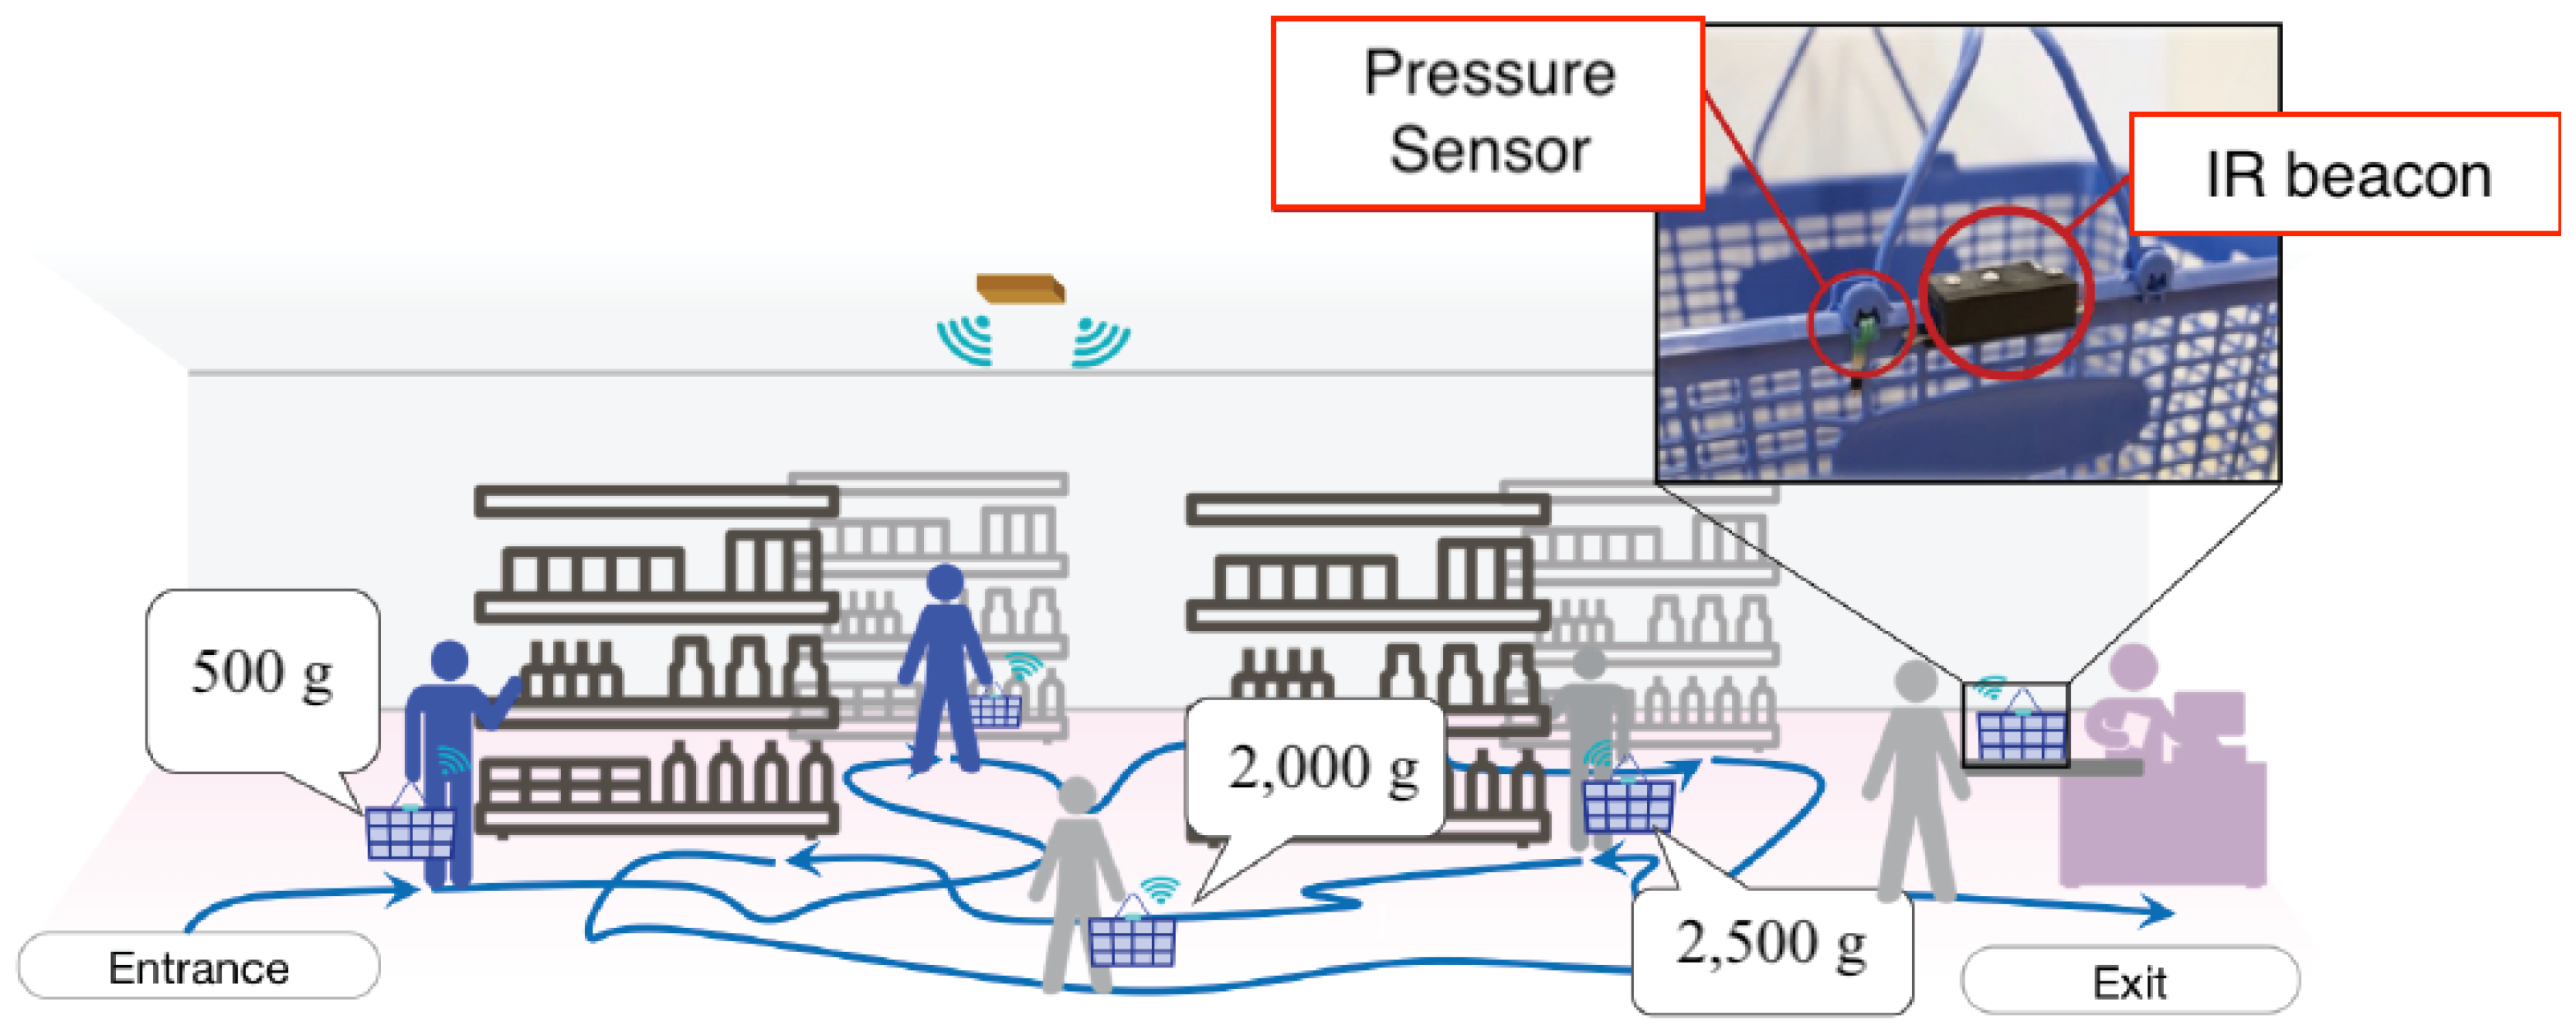
Figure 11.
(a) Behavior of the strain gauge resistance to loading weight. (b) Behavior of estimated weight with changes of the load weight.
Figure 11.
(a) Behavior of the strain gauge resistance to loading weight. (b) Behavior of estimated weight with changes of the load weight.
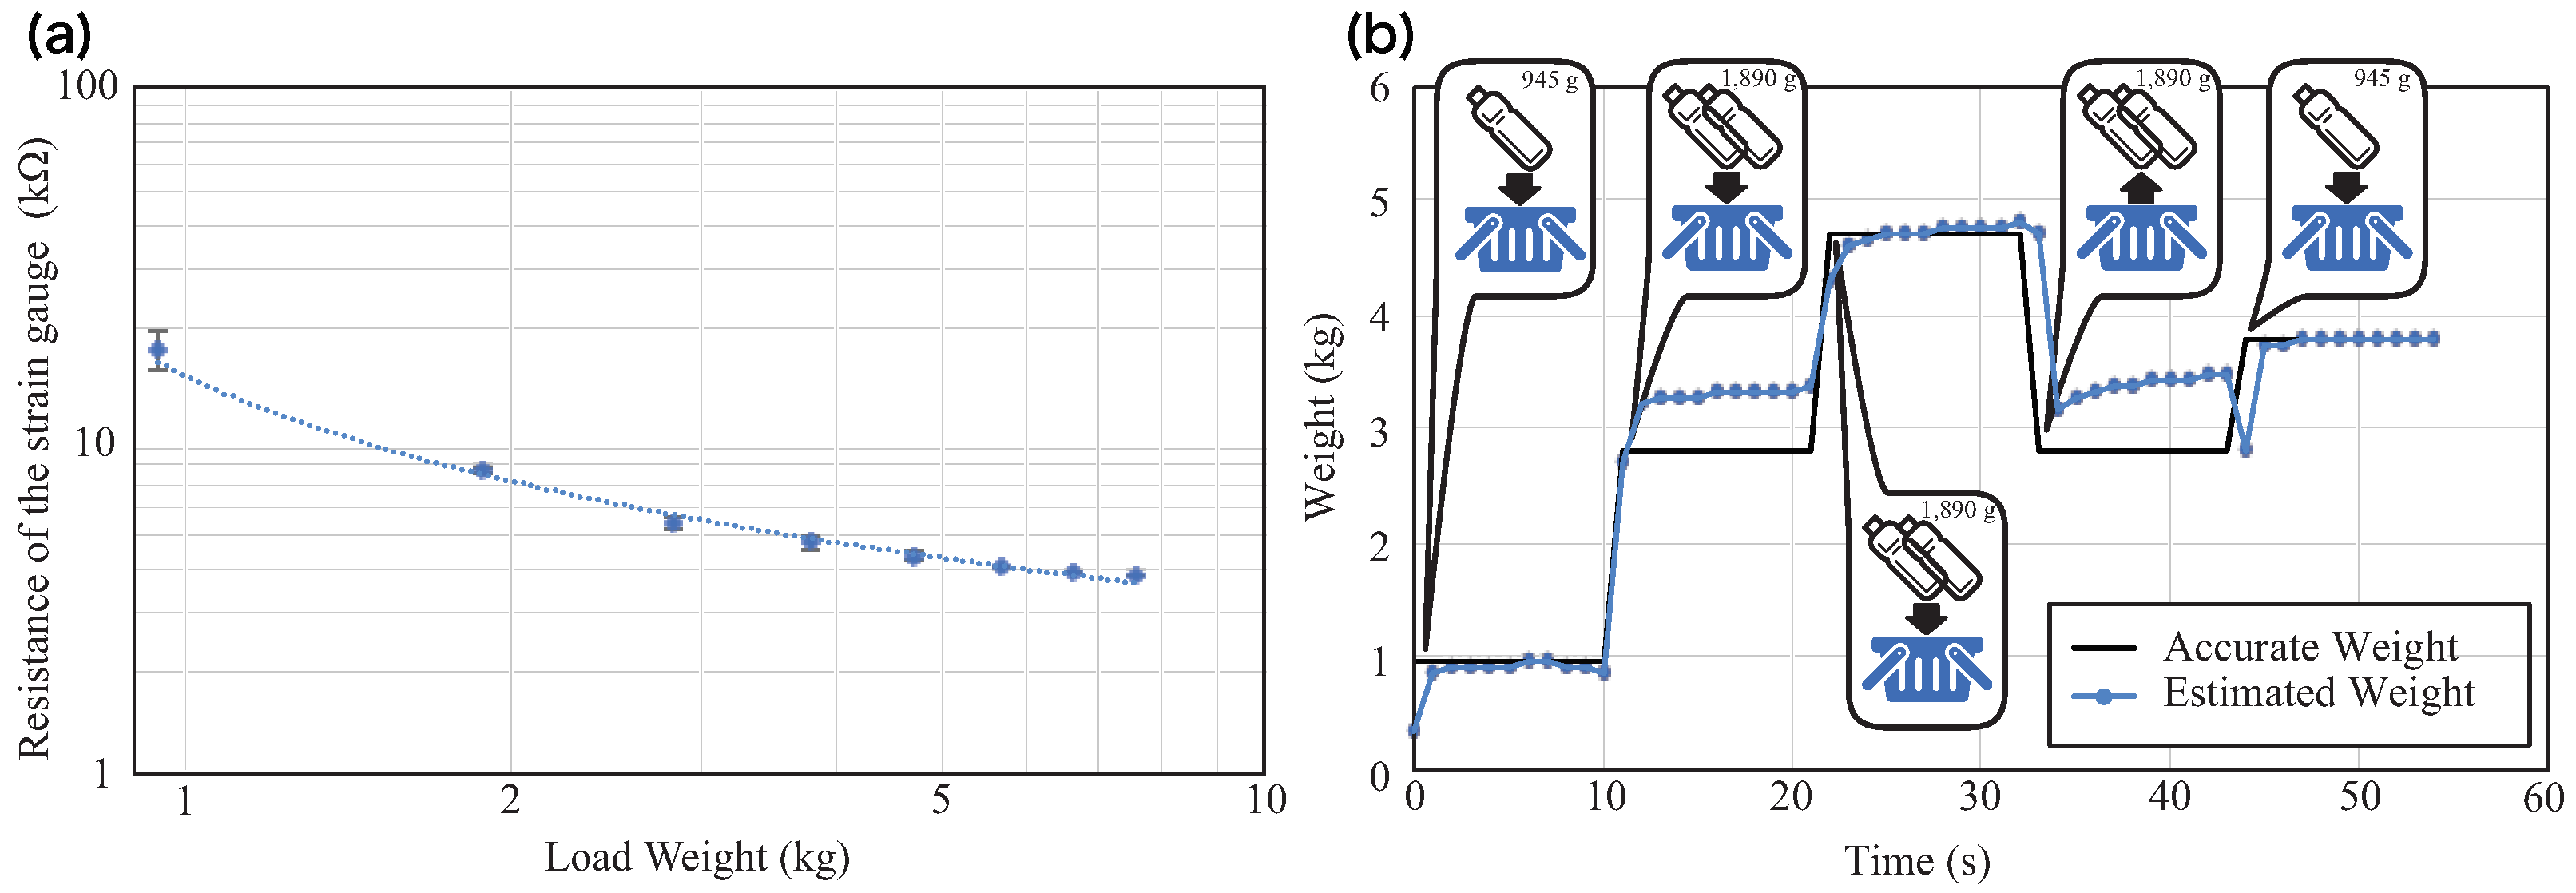
Figure 12.
Data loss due to temporal conflict caused by increasing the number of beacons.
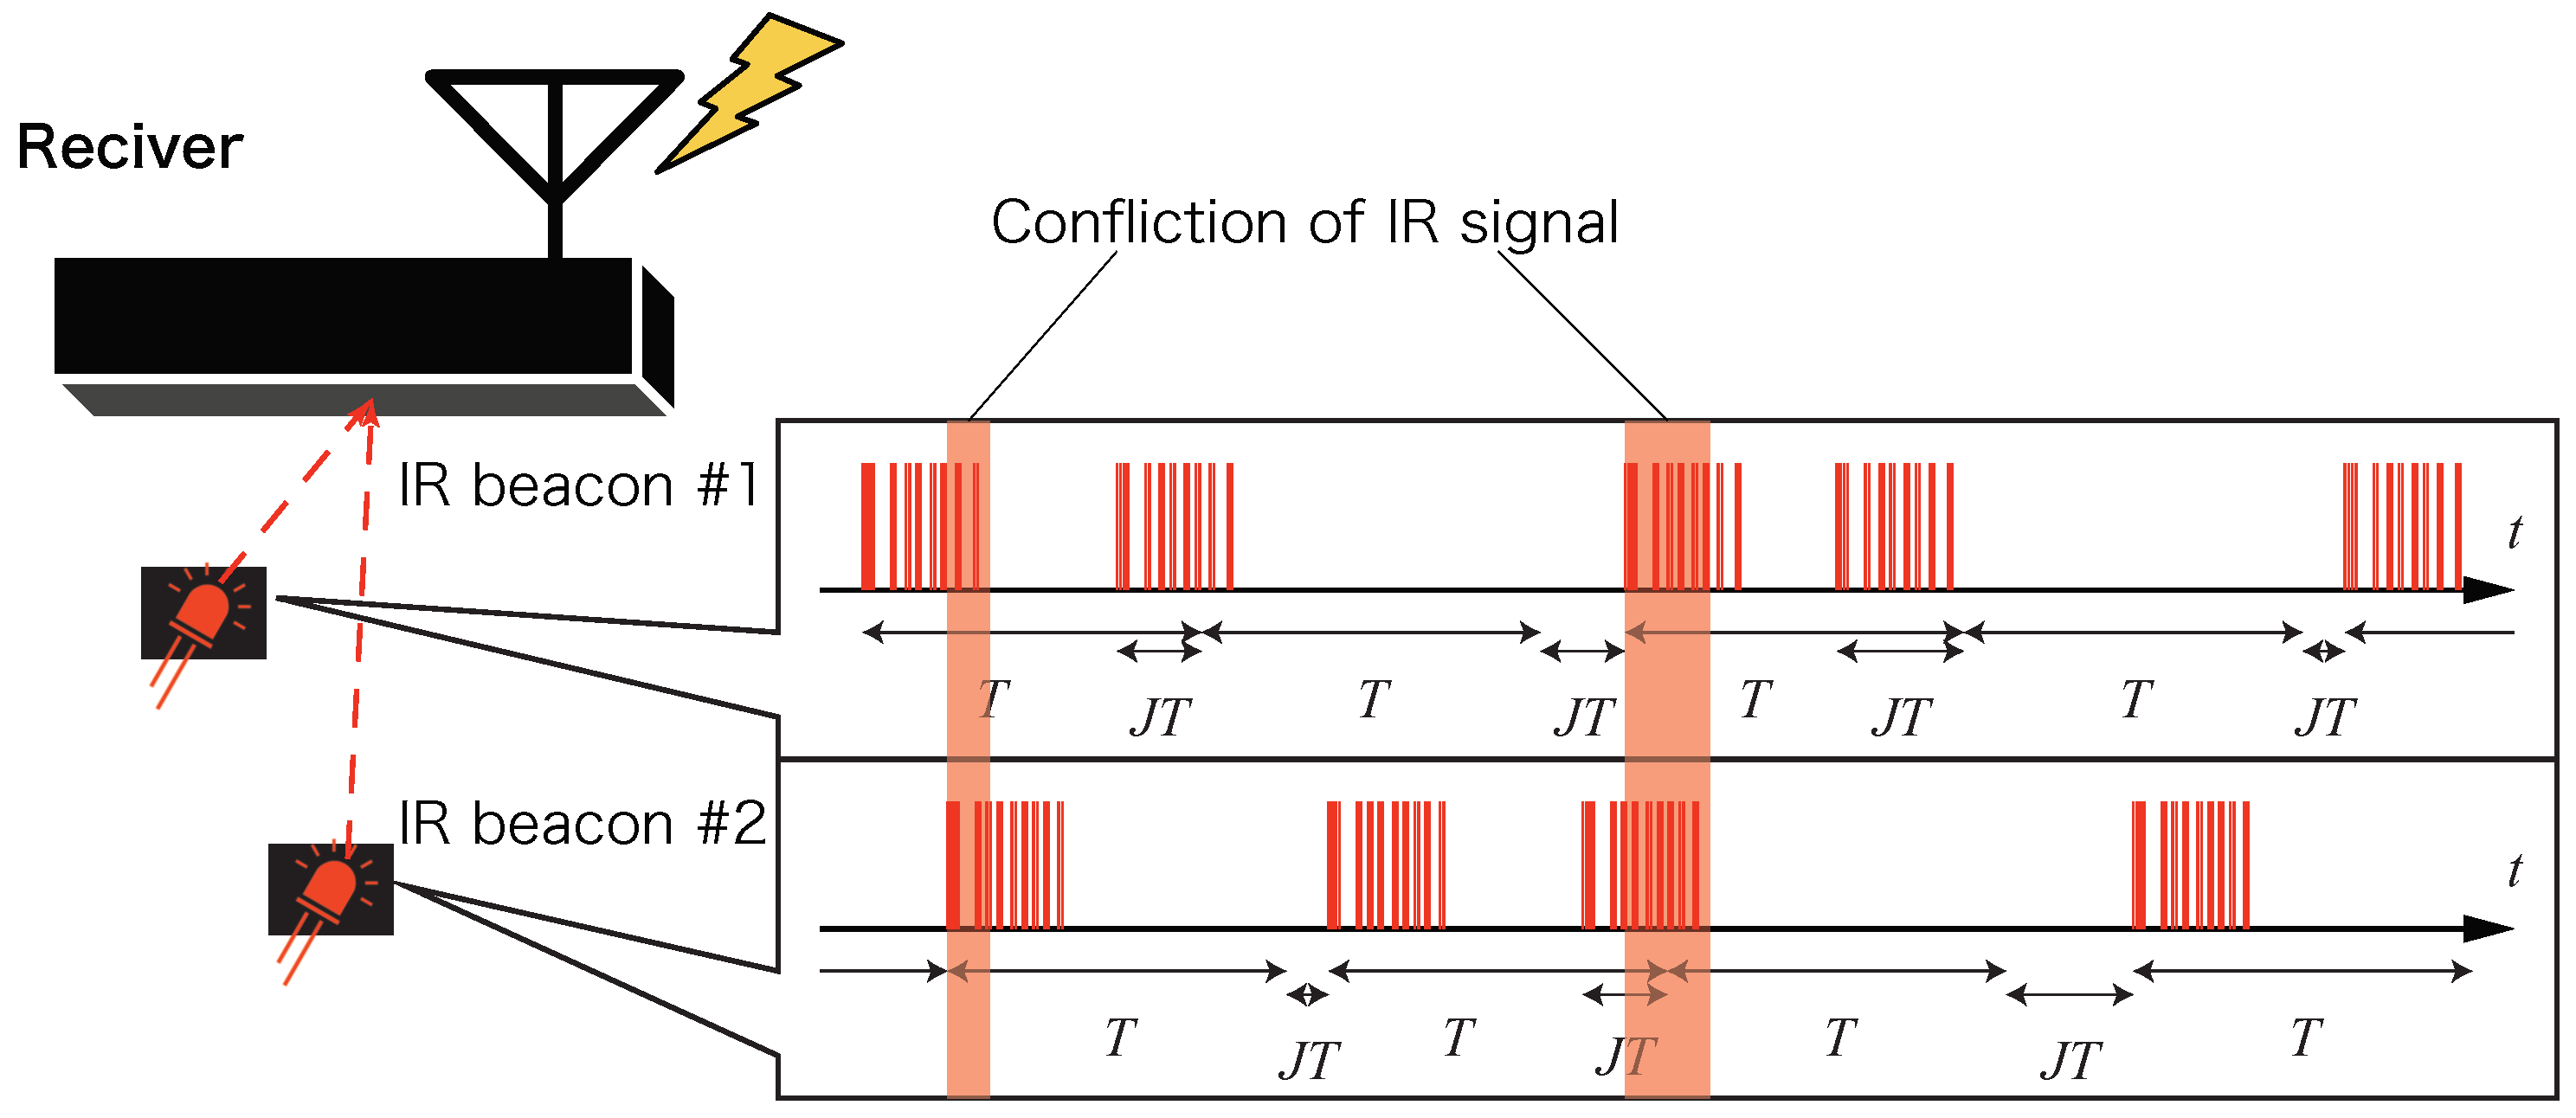
Figure 13.
Example of estimated flow lines including collision.

Figure 14.
(a) Collision rate vs. the number of beacons (). (b) Root mean squared error (RMSE) of the estimated path vs. the number of beacons (). Dashed lines show the RMSE without collision for each T.
Figure 14.
(a) Collision rate vs. the number of beacons (). (b) Root mean squared error (RMSE) of the estimated path vs. the number of beacons (). Dashed lines show the RMSE without collision for each T.
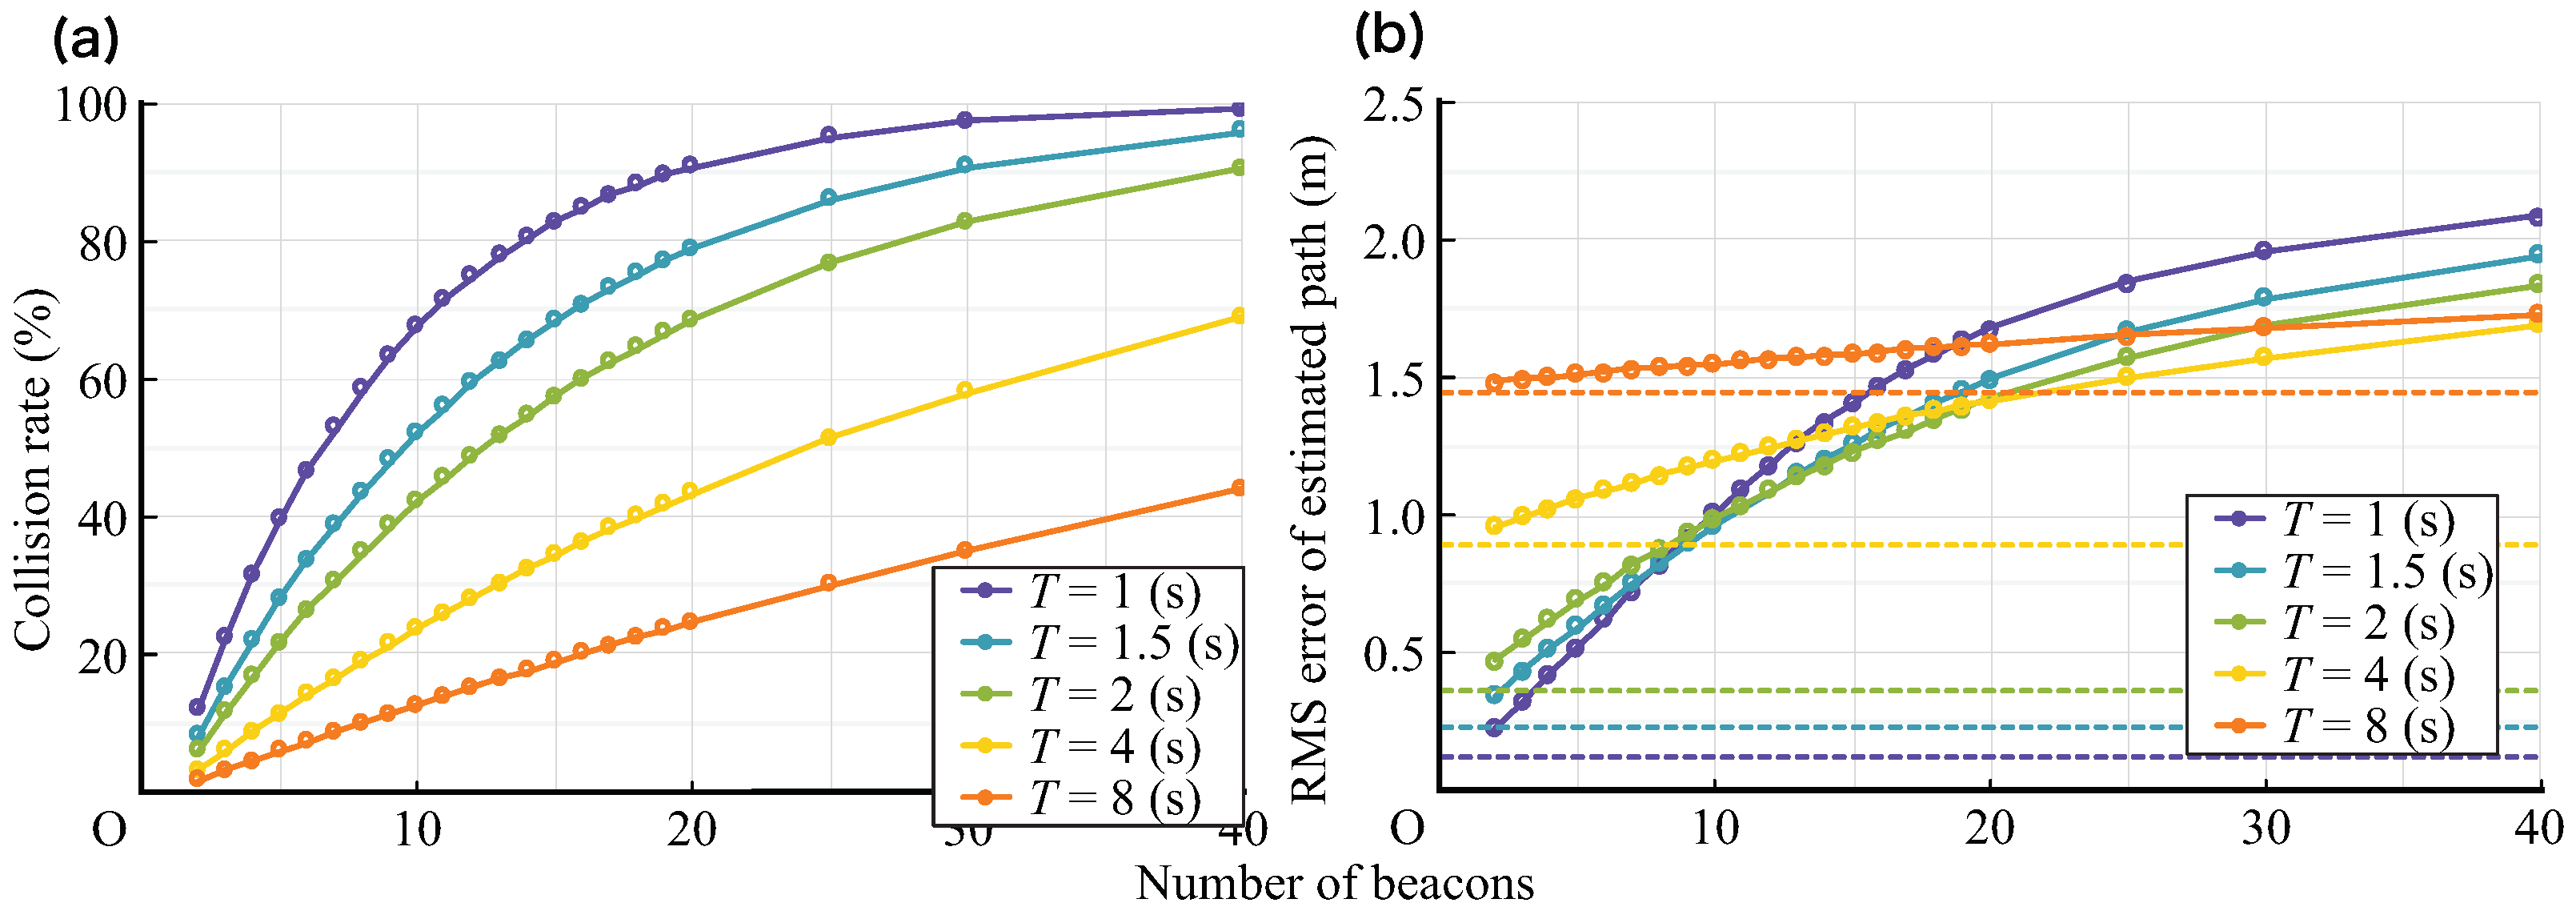
Figure 15.
(a) Re-collision rate vs. jitter ratio J ( s). (b) RMSE of estimated path vs. jitter ratio ( s).
Figure 15.
(a) Re-collision rate vs. jitter ratio J ( s). (b) RMSE of estimated path vs. jitter ratio ( s).
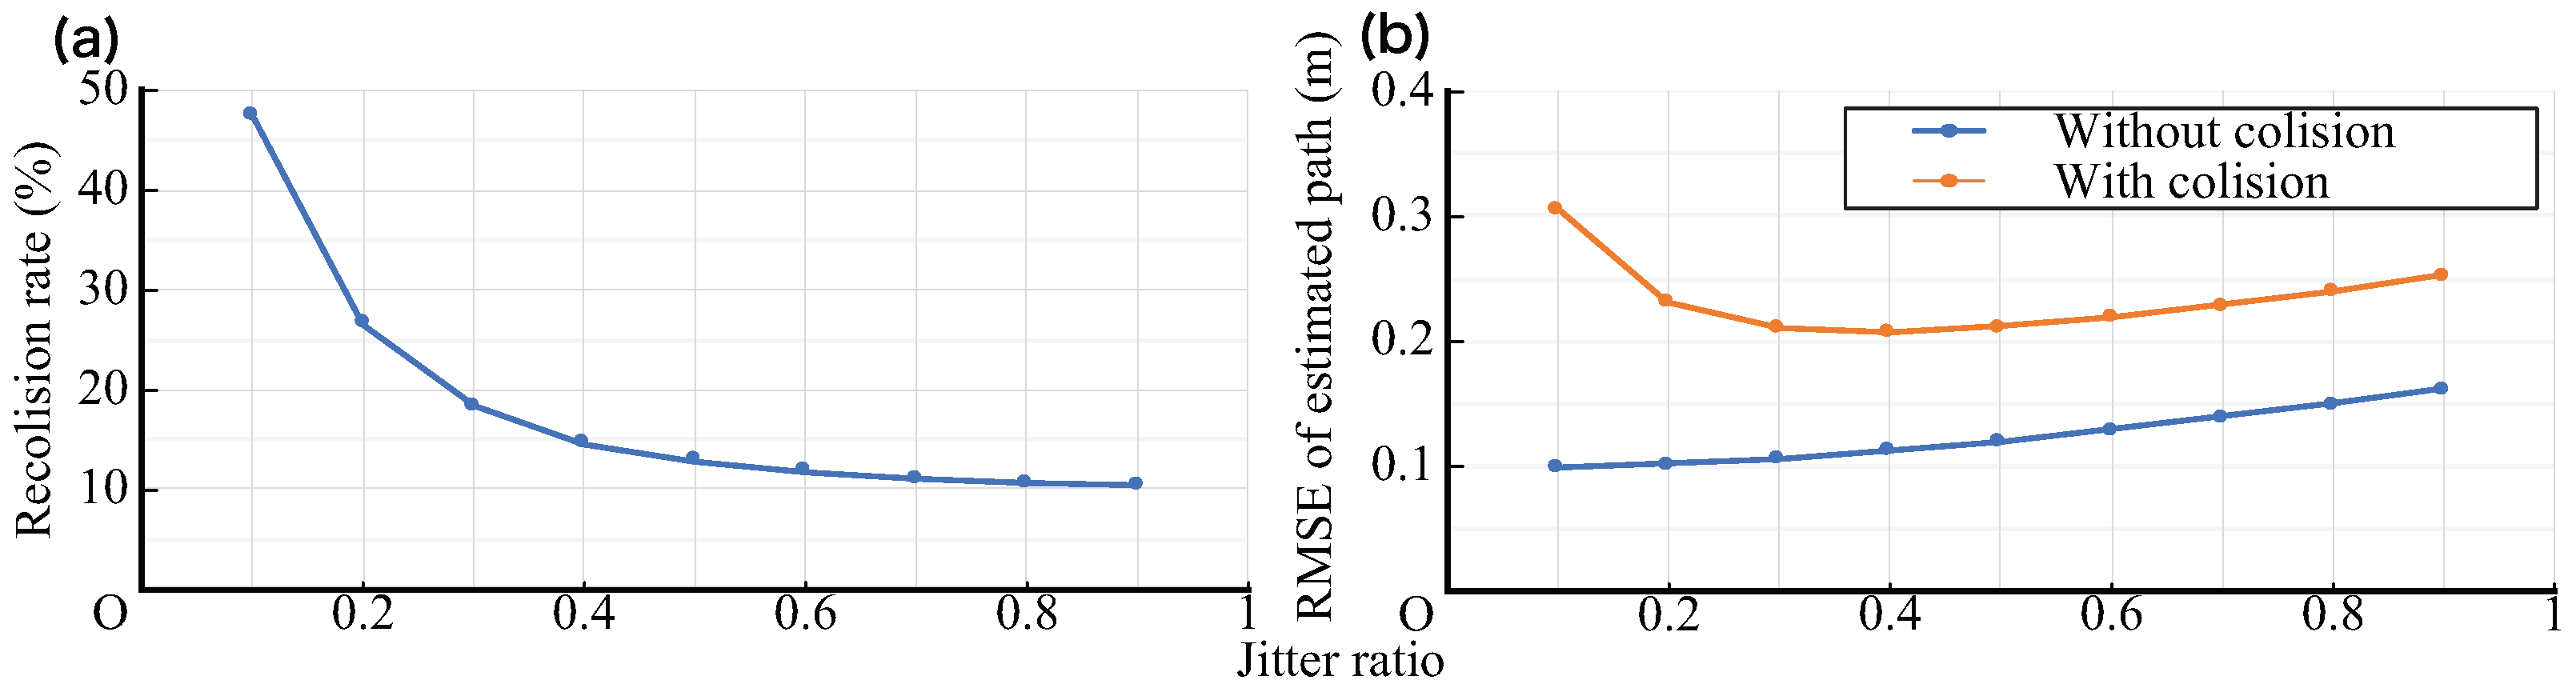
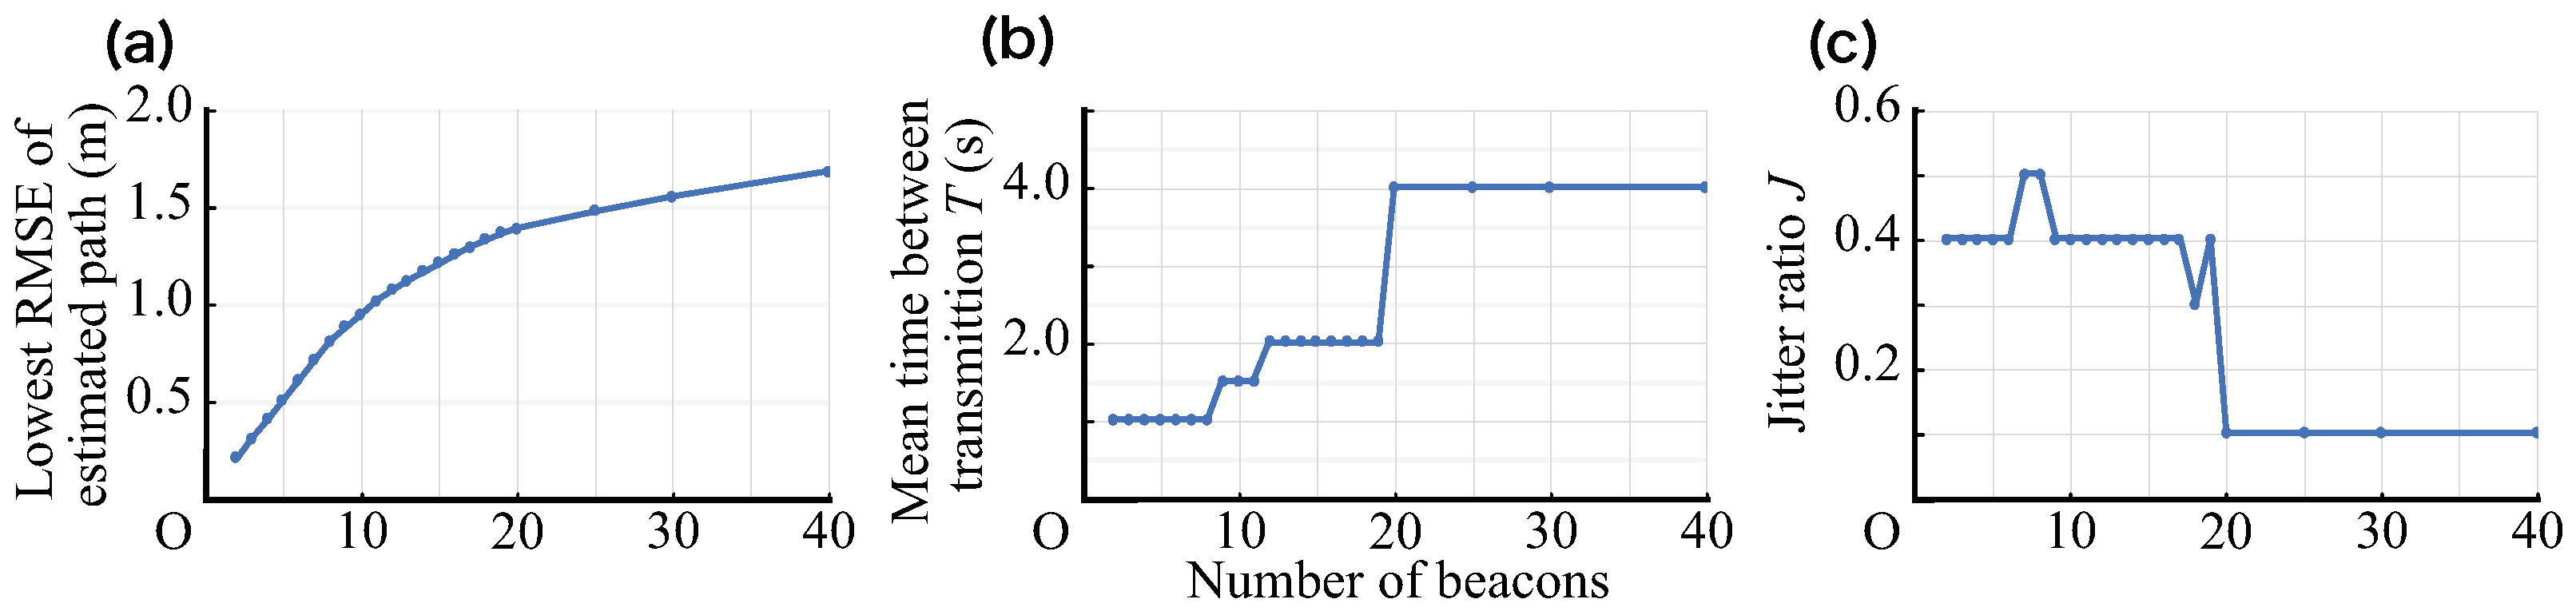
Figure 16.
(a) Lowest RMSE of the estimation path vs. the number of beacons. (b) Mean time between transmissions T that achieved the lowest RMSE, which is shown in Figure 16a. (c) Jitter ratio J that achieved the lowest RMSE, which is shown in Figure 16a.

Table 1.
Comparison of popular indoor positioning methods.
| Positioning Method | GPS, IMES [14] | IPS [15] | BLE [16] | PDR [17,18,19] | Camera [20] | Motion Capture [21] | RFID [22,23] | IR Beacon [24,25] |
|---|---|---|---|---|---|---|---|---|
| Recognition Type | Self-positioning | Environmental positioning | ||||||
| Positioning Method | Passive | Active | Passive | Active | ||||
| Signal | Radio wave | Visible light | Radio wave | Acceleration, angular velocity, magnetism, atmospheric pressure | Visible light | Infrared light | Radio wave | Infrared light |
| Localization Method | Code localization | Finger-printing | Lateration, fingerprinting | Strapdown systems | Triangulation | Triangulation | Proximity method | Triangulation |
| Equipment for Positioning Object | Smartphone | - | Reflection marker | RFID tag | IR beacon | |||
| Equipment for Environment | IMES transmitter | Lighting equipment | BLE transmitter | - | Camera | Capture camera | RFID receiver | IR receiver |
| Error factor | Reflection, absorption | Reflection, absorption | Reflection, absorption | Accumulated error | Shielding | Shielding | Reflection, absorption | Shielding |
| Installation Cost | - | Low | Low | - | Medium | Low | Medium | Medium |
| Hardware Cost | Low | Medium | Medium | Medium | Low | High | Medium | Low |
| Calculating Cost | Medium | Medium | Medium | High | High | Low | Low | Low |
| Multiple Recognition | Strong | Week | Strong | |||||
| Order of Estimation Error | ∼10 m | ∼3 m | ∼3 m | Time increase | ∼0.2 m | ∼0.1 m | ∼5 m | ∼1 m |
| Accuracy in Metal Shelf Environment | Unavailable | Available | Low | Available | High | High | Low | High |
Table 2.
Five configured operational scenarios and physical characteristics.
| Scenario | Order to the Participants | Expected Relative Distance | Expected Relative Velocity |
|---|---|---|---|
| #A | Staff approaches the customer slowly at the shortest distance | Decrease slowly and monotonically | The maximum value is large and converges to zero |
| #B | Staff approaches the customer quickly at the shortest distance | Decrease sharply and monotonically | The maximum value is small and converges to zero |
| #C | Staff approaches the customer while taking an evasive action | Decrease with variation | Converge to zero with variation |
| #D | Staff stops at the same point and talks with the customer | Maintain a constant value | Maintain zero with few variations |
| #E | Staff walks while talking with the customer | Maintain almost a constant value with small fluctuation | Maintain almost zero with small fluctuation |
Publisher’s Note: MDPI stays neutral with regard to jurisdictional claims in published maps and institutional affiliations. |
© 2020 by the authors. Licensee MDPI, Basel, Switzerland. This article is an open access article distributed under the terms and conditions of the Creative Commons Attribution (CC BY) license (http://creativecommons.org/licenses/by/4.0/).
Share and Cite
MDPI and ACS Style
Zempo, K.; Arai, T.; Aoki, T.; Okada, Y. Sensing Framework for the Internet of Actors in the Value Co-Creation Process with a Beacon-Attachable Indoor Positioning System. Sensors 2021, 21, 83. https://doi.org/10.3390/s21010083
AMA Style
Zempo K, Arai T, Aoki T, Okada Y. Sensing Framework for the Internet of Actors in the Value Co-Creation Process with a Beacon-Attachable Indoor Positioning System. Sensors. 2021; 21(1):83. https://doi.org/10.3390/s21010083
Chicago/Turabian StyleZempo, Keiichi, Taiga Arai, Takuya Aoki, and Yukihiko Okada. 2021. "Sensing Framework for the Internet of Actors in the Value Co-Creation Process with a Beacon-Attachable Indoor Positioning System" Sensors 21, no. 1: 83. https://doi.org/10.3390/s21010083
Note that from the first issue of 2016, this journal uses article numbers instead of page numbers. See further details here.