Article

Optimal Scheduling of Campus Microgrid Considering the Electric Vehicle Integration in Smart Grid

1
Department of Electrical Engineering, NFC Institute of Engineering and Technology, Multan 60000, Pakistan
2
Department of Electrical Engineering, Bahauddin Zakariya University, Multan 60000, Pakistan
3
Department of Electrical Engineering Technology, Punjab Tianjin University of Technology, Lahore 54770, Pakistan
4
Department of Electronic Engineering, Jeju National University, Jejusi 63243, Korea
5
Department of Computer Engineering, Jeju National University, Jejusi 63243, Korea
6
CES Laboratory, National School of Engineers of Sfax, University of Sfax, Sfax 3038, Tunisia
7
Department of Computer Engineering, College of Computers and Information Technology, Taif University, Taif 21944, Saudi Arabia
8
Faculty of Engineering, Moncton University, Moncton, NB E1A3E9, Canada
*
Authors to whom correspondence should be addressed.
These authors contributed equally to this work.
Sensors 2021, 21(21), 7133; https://doi.org/10.3390/s21217133
Submission received: 24 August 2021 / Revised: 3 October 2021 / Accepted: 16 October 2021 / Published: 27 October 2021

Abstract

:
High energy consumption, rising environmental concerns and depleting fossil fuels demand an increase in clean energy production. The enhanced resiliency, efficiency and reliability offered by microgrids with distributed energy resources (DERs) have shown to be a promising alternative to the conventional grid system. Large-sized commercial customers like institutional complexes have put significant efforts to promote sustainability by establishing renewable energy systems at university campuses. This paper proposes the integration of a photovoltaic (PV) system, energy storage system (ESS) and electric vehicles (EV) at a University campus. An optimal energy management system (EMS) is proposed to optimally dispatch the energy from available energy resources. The problem is mapped in a Linear optimization problem and simulations are carried out in MATLAB. Simulation results showed that the proposed EMS ensures the continuous power supply and decreases the energy consumption cost by nearly 45%. The impact of EV as a storage tool is also observed. EVs acting as a source of energy reduced the energy cost by 45.58% and as a load by 19.33%. The impact on the cost for continuous power supply in case of a power outage is also analyzed.

1. Introduction

In this technologically advanced period, the rising demand of energy is fulfilled by fossil fuels that add to most of the greenhouse gas emissions and are becoming expensive and scarce due to climatic changes. Countries around the globe are switching to renewable energy resources (RERs) for energy generation.
RERs are becoming increasingly common due to numerous related benefits such as low carbon emission, no reliance on fuel, clean energy, etc. Regardless of such incredible characteristics, RERs are inherently intermittent and unpredictable as they are weather dependent, resulting in unstable output power. For this reason, energy storage systems are used. Energy storage has piqued a lot of interest globally and will continue to do so in the future [1].
The concept of microgrids has been introduced to enable the integration of RERs evading the need of complex algorithms for managing the renewables. Microgrids are compact energy networks comprising of various loads, conventional and/or renewable distributed energy resources, and energy storage systems [2]. Conventional resources may include several diesel generators and renewable resources that primarily include photovoltaic and wind power systems. A distribution network may contain many microgrids. These microgrids having distributed generators (DGs), ESS, and demand response (DR) programs [3], can help lower the electricity cost and load on distribution networks.
Global demand for energy has grown rapidly since 1965 with an average annual rate of 2.2 percent. A growth of 30 percent is expected by 2040 according to world energy outlook. South Asia, along with several other regions in the world, is a significant contributor. It includes eight countries and accounts for 6.42 percent of the overall world energy consumption [4]. Pakistan is one of the developing countries in South Asia that is facing a severe energy crisis ascribed to an ever-increasing population density. It has the sixth largest population in the world [5]. Consumers are subjected to power interruption lasting several hours daily [6]. However, it is an exceptionally rich country in terms of RERs. These resources, if used efficiently, can ultimately mitigate the severe energy crisis. Microgrid implementation is the only viable, safe and optimal approach for ensuring access to cost-efficient, secure, and sustainable energy [7], for all.
The total installed generation capacity of Pakistan is about 38,719 MW, as of June 2020, out of which 24,817 MW is thermal, 9861 MW is hydroelectric, 1248 MW is wind, 530 MW is solar, 369 MW is bagasse, 1467 MW is nuclear, and 427 MW is SPPs/CPPs. The electricity generation has decreased from 136,532 GWh during 2018–2019 to 134,745.70 GWh during 2019–2020, indicating a drop of 1786.30 GWh [8].
Energy generation shares from different sources in Pakistan are depicted in the chart shown in Figure 1 [9].
Among the various types of heavy load microgrids, institutional buildings fall under the commercial customer’s class. Institutional buildings constitute a diverse variety of load coming from lecture halls, laboratories, libraries, faculty offices, and residential blocks. With onsite distributed generation sources, the prosumers can sell excess power to the grid and can buy power from the grid in case of insufficient generation to meet the load demand. Microgrids taking part in grid functions can reduce loads on power distribution networks.
As power uncertainty is a major issue in the energy sector, institutional microgrids require implementation of optimal energy management systems (EMS) for uninterrupted power supply. Interruptions in power supply to the institutional load may result in loss of crucial data, disrupted academic classes, and equipment damage due to low voltage, among other serious issues. Therefore, a continuous and reliable power supply must be ensured through proper EMS implementation.
Prior studies have focused on the optimal scheduling of microgrid components using various techniques. Problems associated with power outages and power interruptions have also been recognized in previous research. However, electric vehicle scheduling is not widely considered in the context of university campuses. These issues have been addressed separately and there is presently no microgrid optimization tool that considers these issues together. This paper addresses the idea of advancement in the current grid framework at a university campus, focusing on various types of DERs, mainly photovoltaic (PV) system, battery energy storage system (BESS), and electric vehicles (EVs) as prosumers. The concept of an EMS to optimally schedule the power from various energy sources in a grid connected network is proposed. The advantages of the proposed EMS are observed using real data from a university campus as a case study. Grid unavailability in emergency situations is also considered. Currently, the campus load demand is supplied through the local utility. The system used in this study is completely described in Section 3.
The main contributions of this work are as follows:
  • An EMS is proposed for optimal scheduling of available energy resources and grid power using robust Linear Programming based on time of use (ToU) pricing scheme to ensure power supply continuity and reduction in energy consumption cost.
  • Power outage and power interruption modes are considered for estimating the effect on cost for continuous power supply.
  • Effect of integrating EV as a storage device in the proposed microgrid structure is also considered.
The rest of the paper is organized as follows. Section 2 presents the literature review. Section 3 presents the description of the proposed system. Section 4 and Section 5 present the problem formulation. Results and discussion are presented in Section 6. The findings of this paper are concluded in Section 7.

2. Literature Review

Microgrid is a combination of distributed generators (DGs), load and storage system as shown in Figure 2. Microgrids can operate in grid-connected mode or the islanded mode (off-grid mode) [10]. Typically, the islanded mode allows the system to operate in undesirable situations, such as high rates of electricity from main grid, faults in grid, and supplying power to remote areas. In grid-connected mode, the microgrid interacts with the main power grid and can sell or supply surplus energy to the main grid.
The possibility of incorporating usually more than one energy source in the microgrids continues to remain a concern in their planning and analysis.
Microgrid planning has been the subject of numerous research articles. The issue is addressed using mathematical models or software tools and various optimization algorithms. HOMER is a software tool used by many researchers for planning and analysis of microgrids [10,11,12,13,14]. Authors in [12] focused on the feasibility analysis for the development of PV generation plant in one of the campuses of Sebelas Maret University, Indonesia, as a solution for increasing energy demand. The techno-economic analysis was done using HOMER software and was based on NPC (net present cost) and IRR (internal rate of return).
In [13], the authors proposed to develop a grid-connected microgrid including PV and battery storage system to satisfy the load demand and reduce the grid dependency of a campus in Malaysia. HOMER was used to model and simulate the microgrid. The challenges to the introduction of microgrids in the world power sector are described in [14]. The implementation of microgrid technology on a campus in Brazil is considered to illustrate these challenges and to reduce the energy cost. HOMER was used to simulate six arrangements to identify the most techno-economically feasible solution. In [15], a microgrid model comprising combined heat and power plant, diesel generators, PV system and battery storage system was developed to minimize the energy generation cost, greenhouse gas emission, total NPC, and to supply thermal and electrical loads simultaneously. The simulations were carried out using HOMER Pro on six cities in Pakistan to find the best city for the proposed microgrid model.
In [16], the authors proposed a binary backtracking search algorithm to optimally schedule the DGs in microgrids as virtual power plant (VPP). The proposed model was simulated and tested on IEEE 14-bus system based on real data. The results showed a decrease in power losses and cost of generated energy and an increase in reliability. The proposed algorithm gave better results compared to binary particle swarm optimization.
A “Microgrid decision support tool (MDSTool)” for optimal planning of microgrid considering renewable energy incentives, grid ancillary services and tax benefits was developed in [17]. The MDSTool allowed the flexibility to model a wide range of dispatch algorithms. It was a performance and economic model used to find the optimal sizing and financial feasibility of the microgrid. A prototype software architecture was demonstrated in [18] for supporting the data driven demand response (DR) optimization in a campus microgrid. The architecture proposed there has three main components that, when run, displayed the load curtailment patterns in real time and forecasted energy consumption of the campus. In [19], the authors developed a BESS scheduling model for addressing the DR problems. Simulation results showed reduction in operating cost and in DR implementation uncertainty.
The control and monitoring of a functional microgrid at the Illinois Institute of Technology (Chicago, IL, USA) for improving the economics and reliability of microgrids was discussed in [20]. Functions like economical DR, economical dispatch, emergency DR, resynchronization and islanding, self-healing, for implementing microgrid objectives were also discussed. In [21], the authors presented an energy management system (EMS) to integrate PV and BESS in a campus for reducing the energy costs. “Simulated annealing algorithm” was used for implementing the methodology. Simulations were carried out using meteorological data for predicting PV output, real demand, and ToU tariff.
A DSM approach that considered the non-controllable loads triggered by sub-decision makers was proposed in [22]. A micro market model was presented to influence these non-controllable loads. A self-crossover genetic algorithm (SCGA) was proposed to solve the optimization problem. In [23], the authors focused on designing an inertia-based microgrid and its associated controller for the main campus of Clemson University (Clemson, CA, USA). The microgrid could exhibit both on- and off-grid modes and the transition between the two modes was nearly seamless. The idea of development of a microgrid at the Faculty of Technical Sciences at the University of Novi Sad (Novi Sad, Serbia), with various DERs was presented in [24]. That study focused on the technical, economic, and ecological analysis of the microgrid.
In [25], the authors used non-dominated sorting genetic algorithm II (NSGA-II) to optimize the proposed model size comprising PV system, batteries, and grid, in a university in Japan. The authors proposed to use the constant power instead of real-time power. Three scenarios were considered to validate the proposed scheme. It was observed that energy waste was 70 times less if constant power was used throughout the year and 60 times less if it was used daily. The authors in [26] proposed an EMS to analyze the economic and environmental effects of PV and ESS in a campus microgrid located in Pakistan. An EMS is proposed in [27] to optimally schedule the PV and storage system in a campus microgrid for reducing energy consumption cost and battery degradation cost. The non-linear problem was formulated using mixed-integer nonlinear programming (MINLP) and simulated in MATLAB.
Considering the previous literature, it can be inferred that most of the work is focused on technical and economic feasibility of the microgrid. Some researchers focused on reducing the grid dependency. PV system and ESS integration and management are mostly considered for electricity cost reduction. Moreover, previously proposed studies have rarely focused on EV integration. A comparative analysis of related work is given below in Table 1.
With the introduction of EVs, the issue of catering the increased demand from EVs has become a pressing concern. The management of EVs is currently a serious challenge. This paper considers the effect of application of PV system, ESS and EVs as prosumers at a university campus in smart grid. An EMS is proposed to optimally dispatch the energy from available energy resources to ensure continuous power supply and reduce the energy consumption cost.

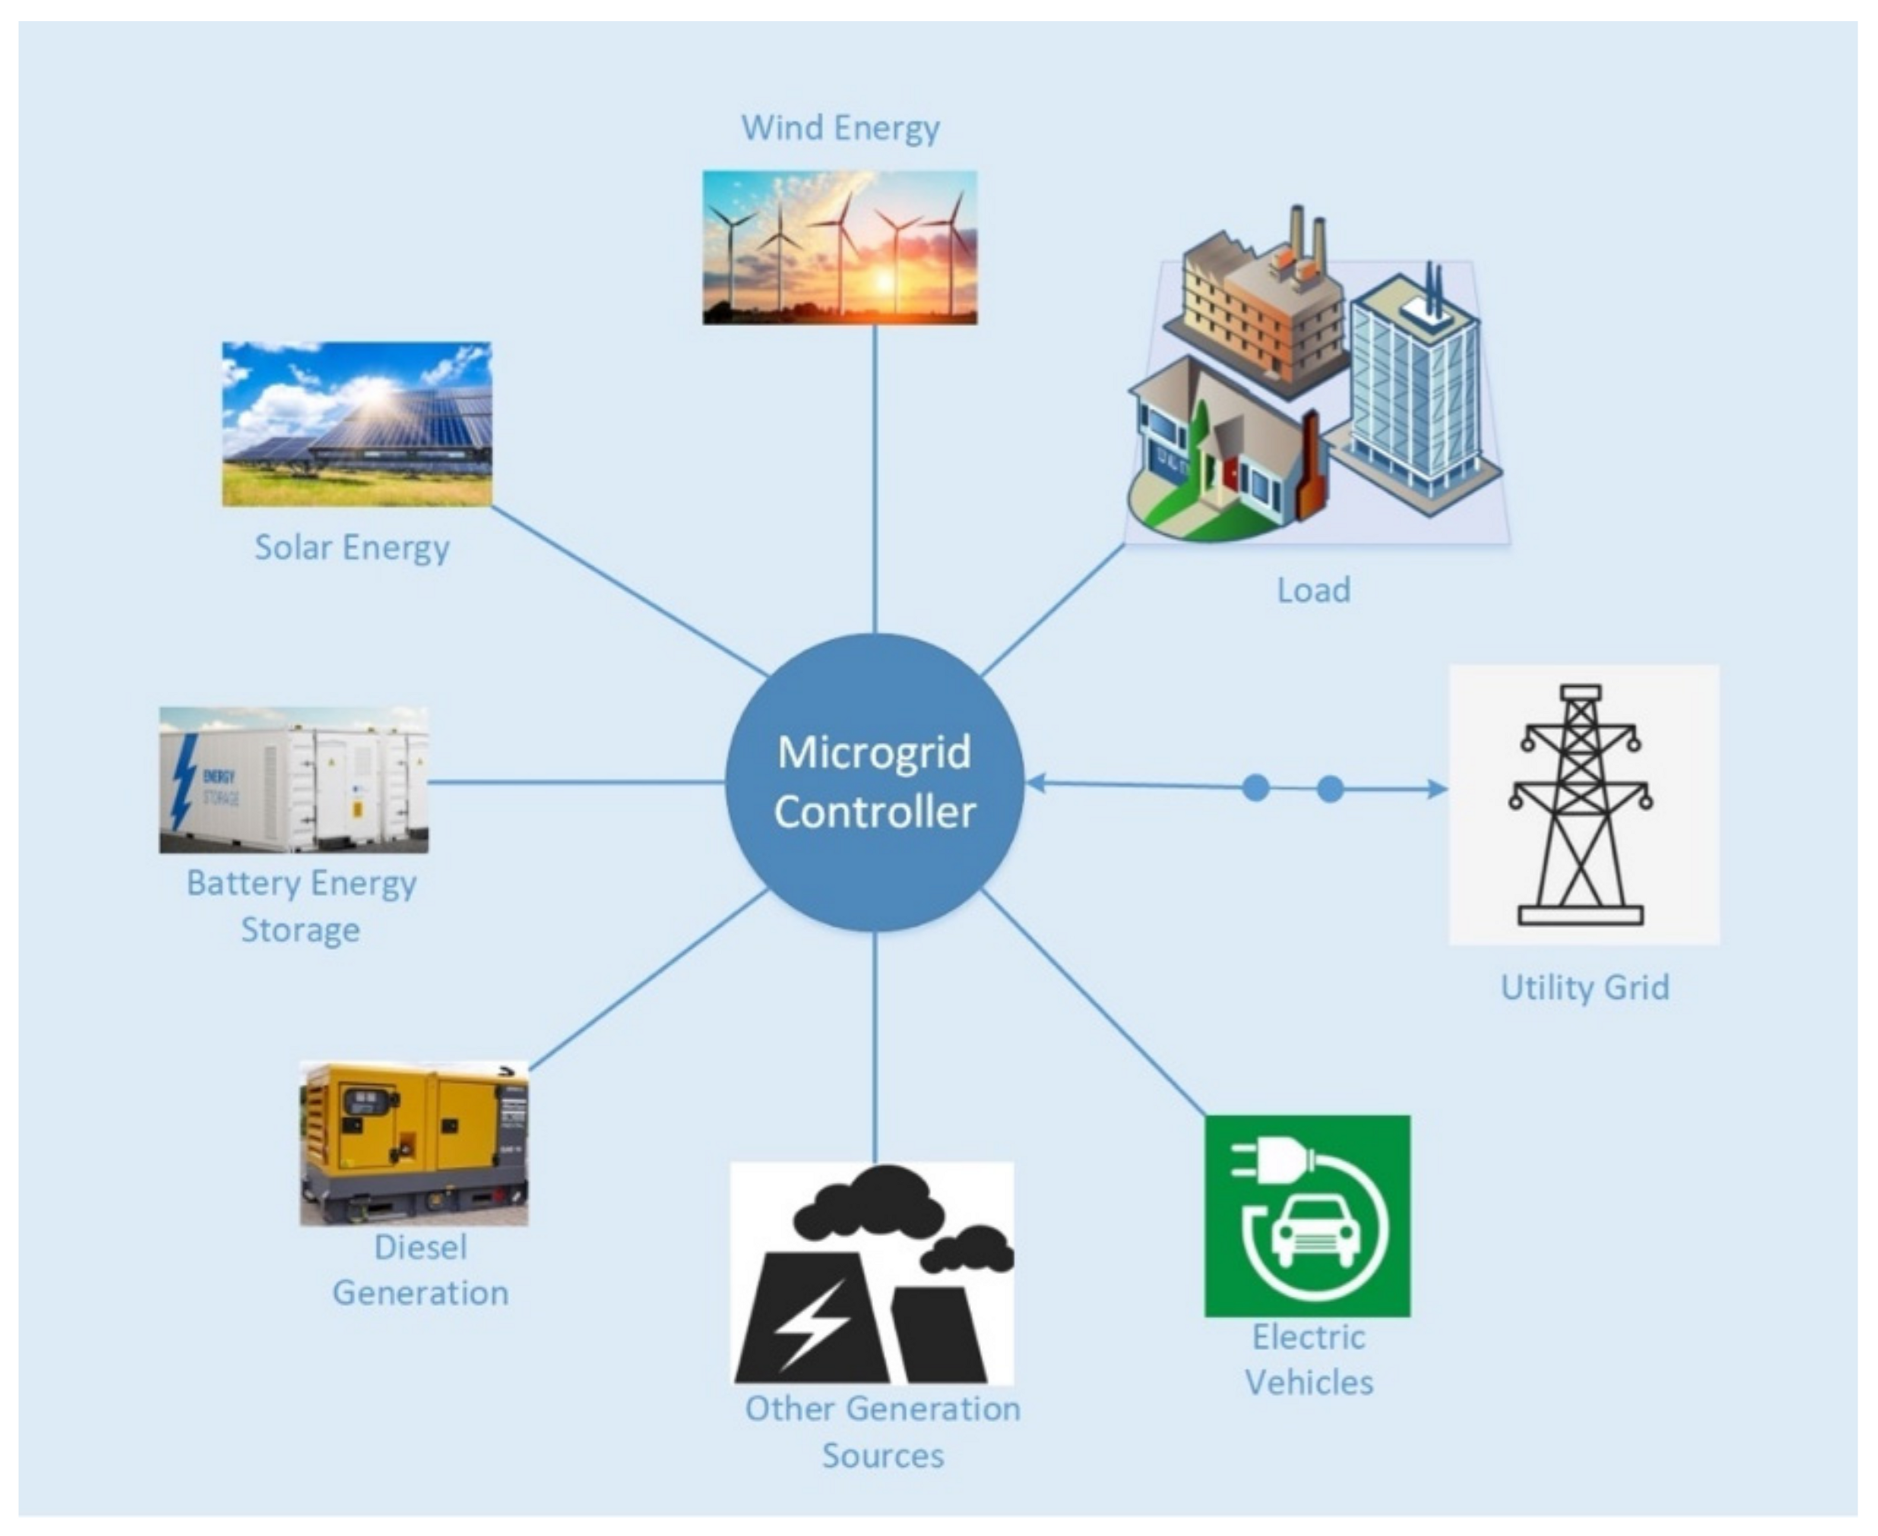
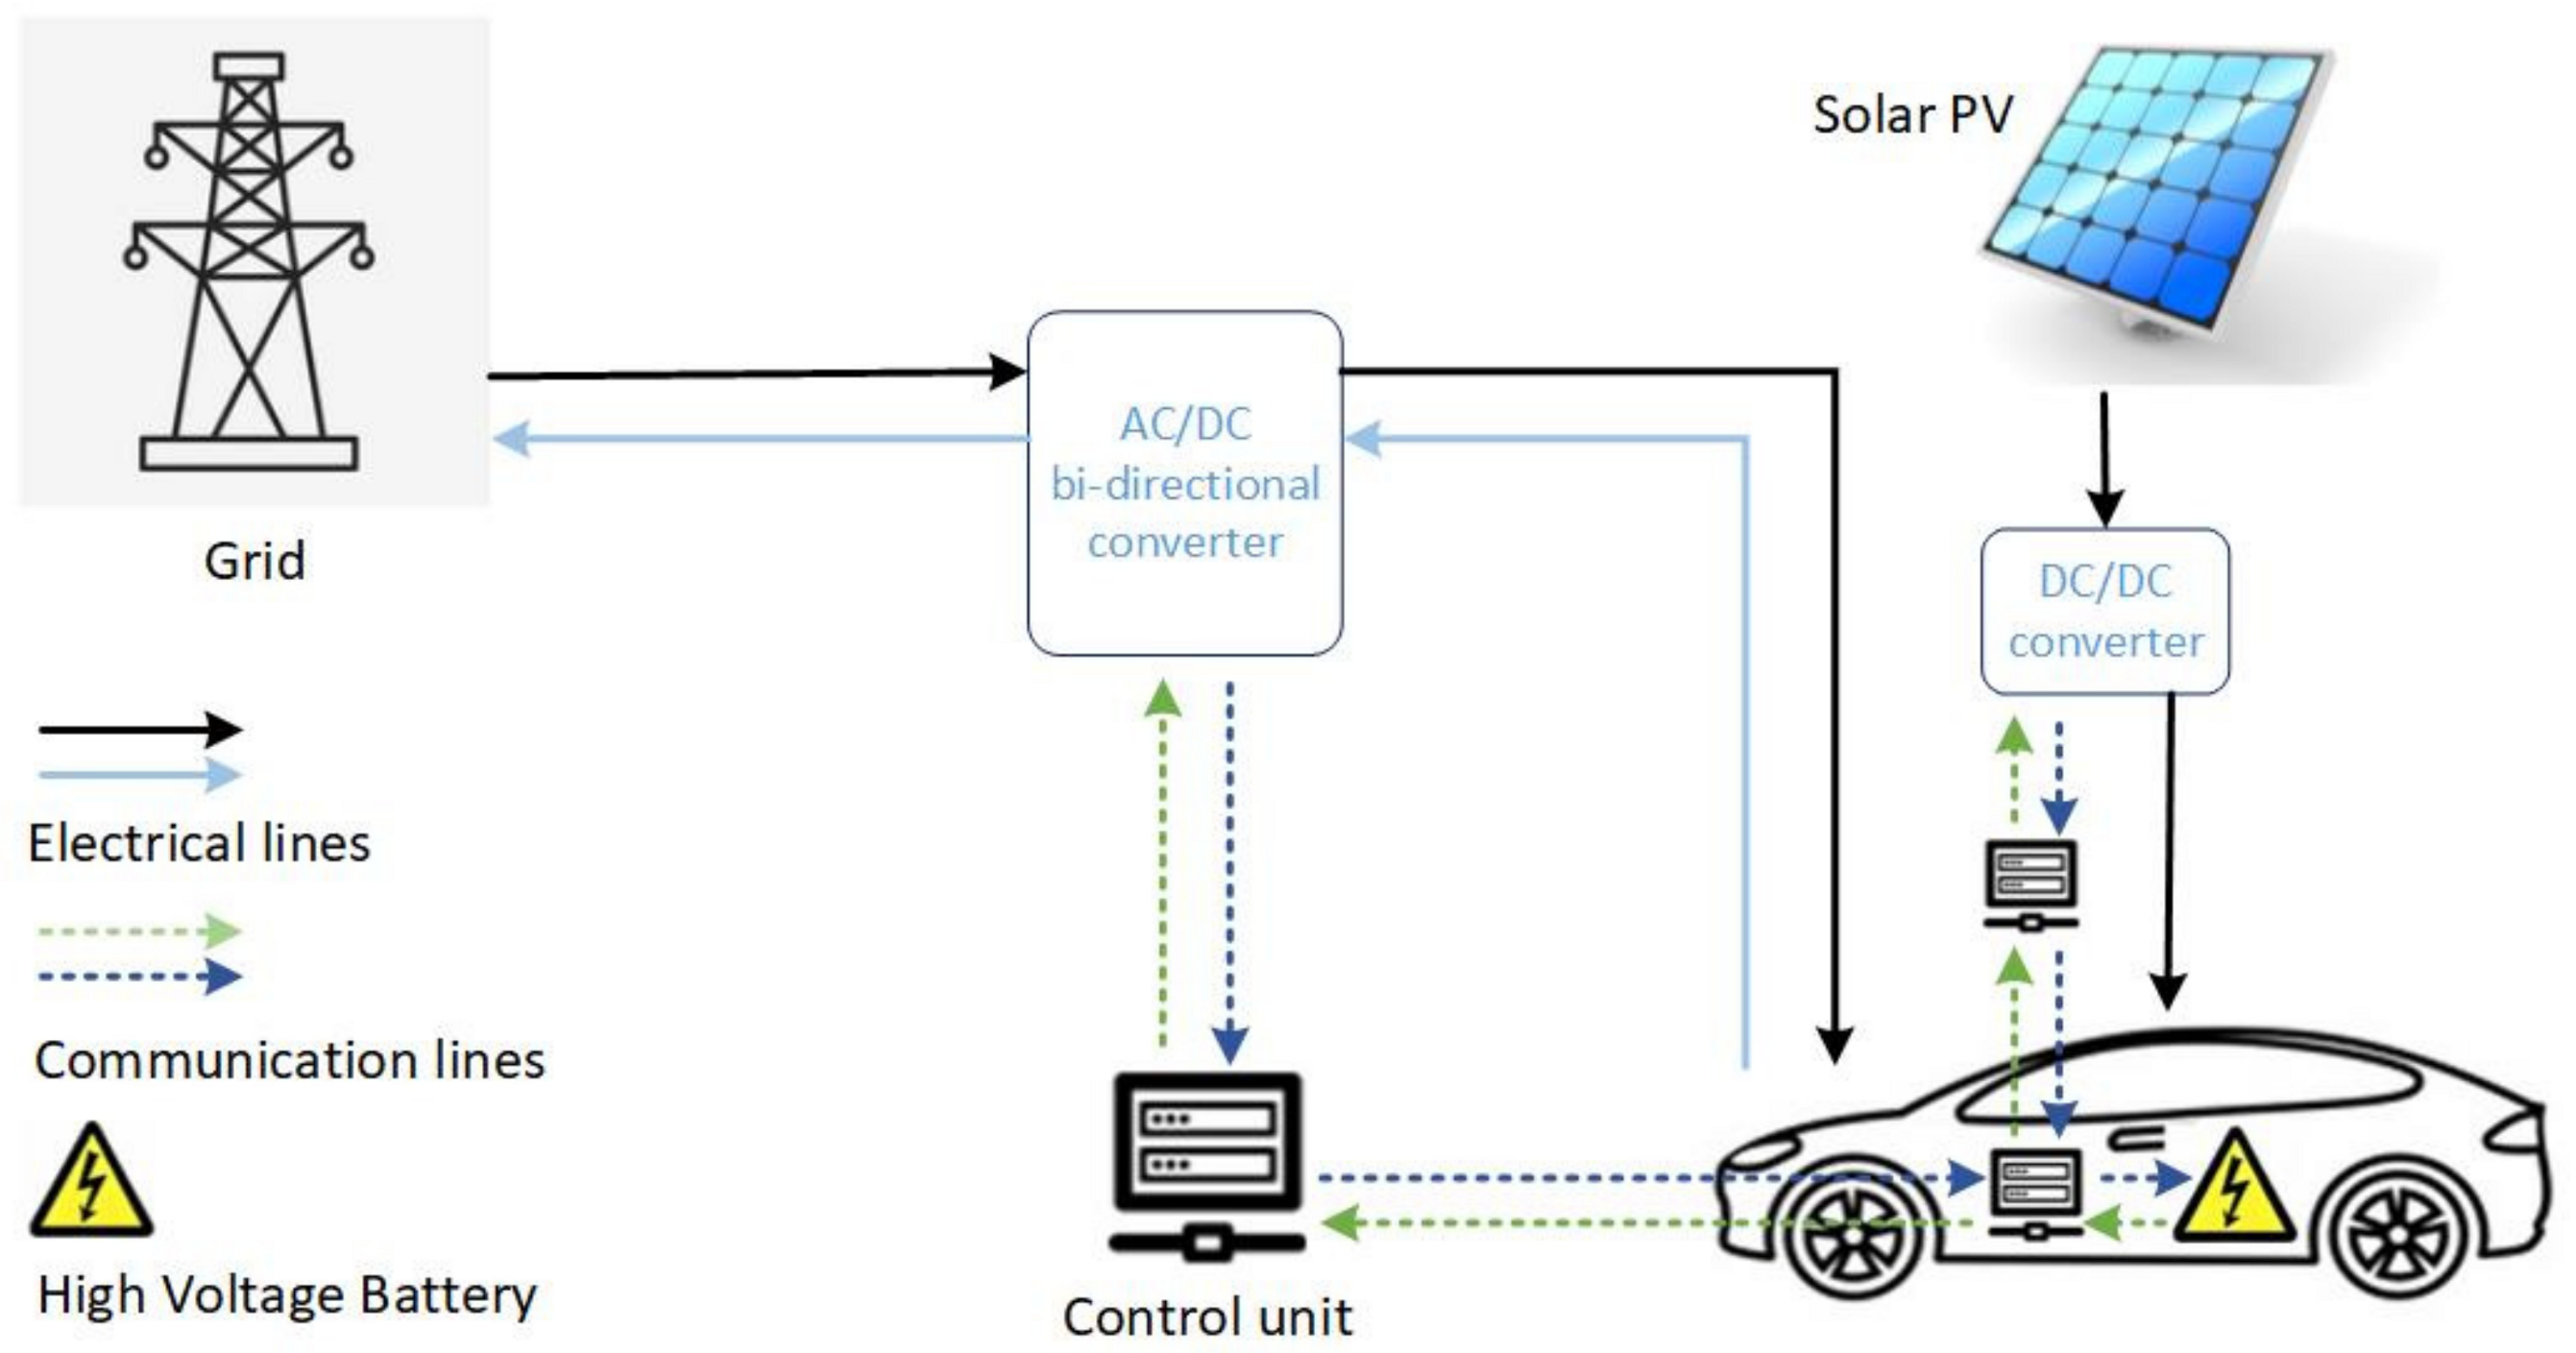
3. System Architecture/Description

The system used in this study is a college on a university campus located in Pakistan. The university main campus encompasses 388.5 ha (960 acres) of land. Currently, it includes over 51 colleges/departments/institutes. The college under study is spread over 28.3 ha (70 acres) of land. It has five departments, a library, a hostel, and residential blocks for staff and faculty.
Figure 3 shows the daily average load profile of the College. The primary source of power is the power from the local distribution company named Multan Electric Power Company (MEPCO).
The price of electricity from grid in the time of use (ToU) tariff scheme is shown in Table 2 [28]. Peak hours are from 18:00 to 22:00.
The total average college electrical load is made up of the average academic, hostel and residential load combined as shown in the Figure 4. The load profile depicts an increase in demand during college timing due to academic load and in the night after college timing due to residential load.
This paper proposes the integration of a PV system, battery energy storage system (BESS) and electric vehicles (EV) with the distribution system to achieve the energy supply–demand balance and to reduce the electricity consumption cost. Figure 5 shows the proposed system architecture. Following are the details of the proposed system.

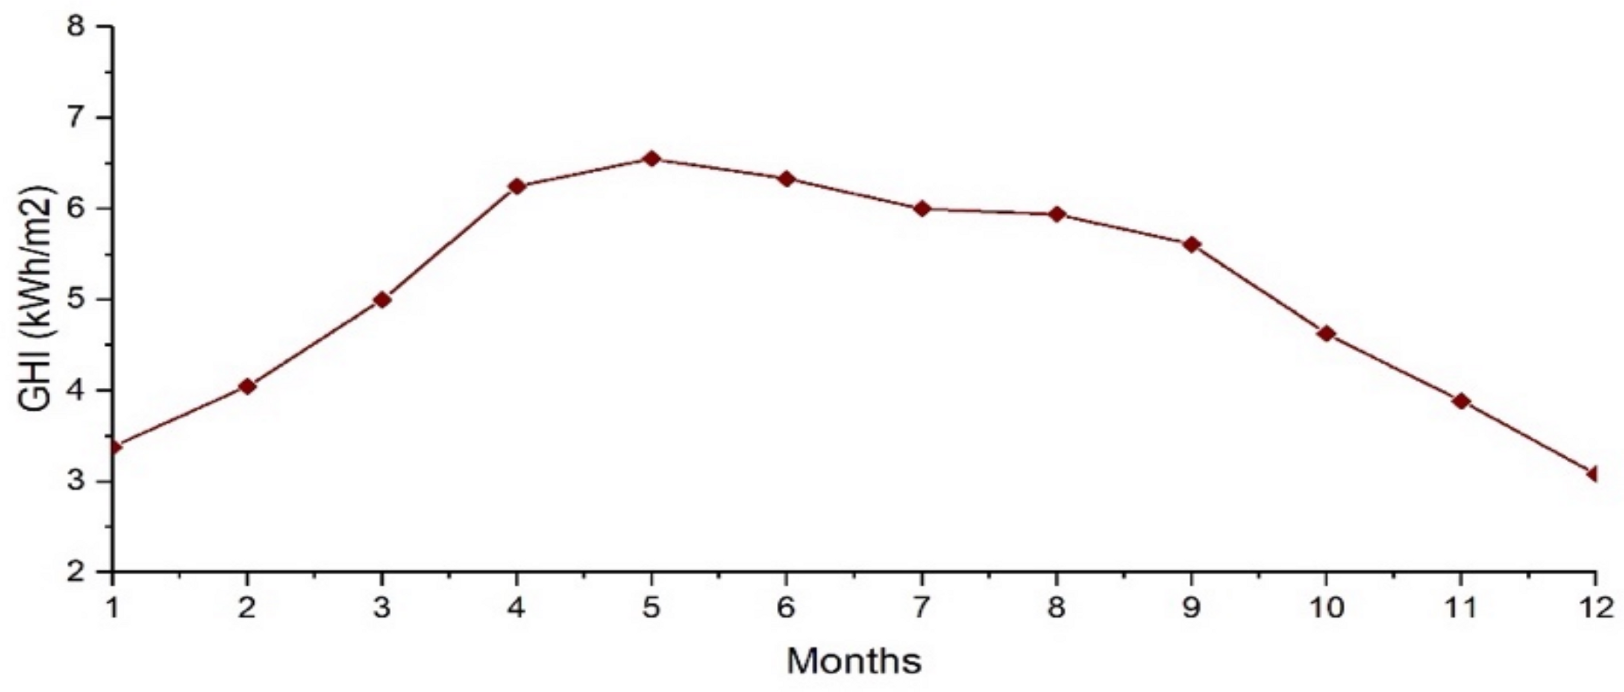
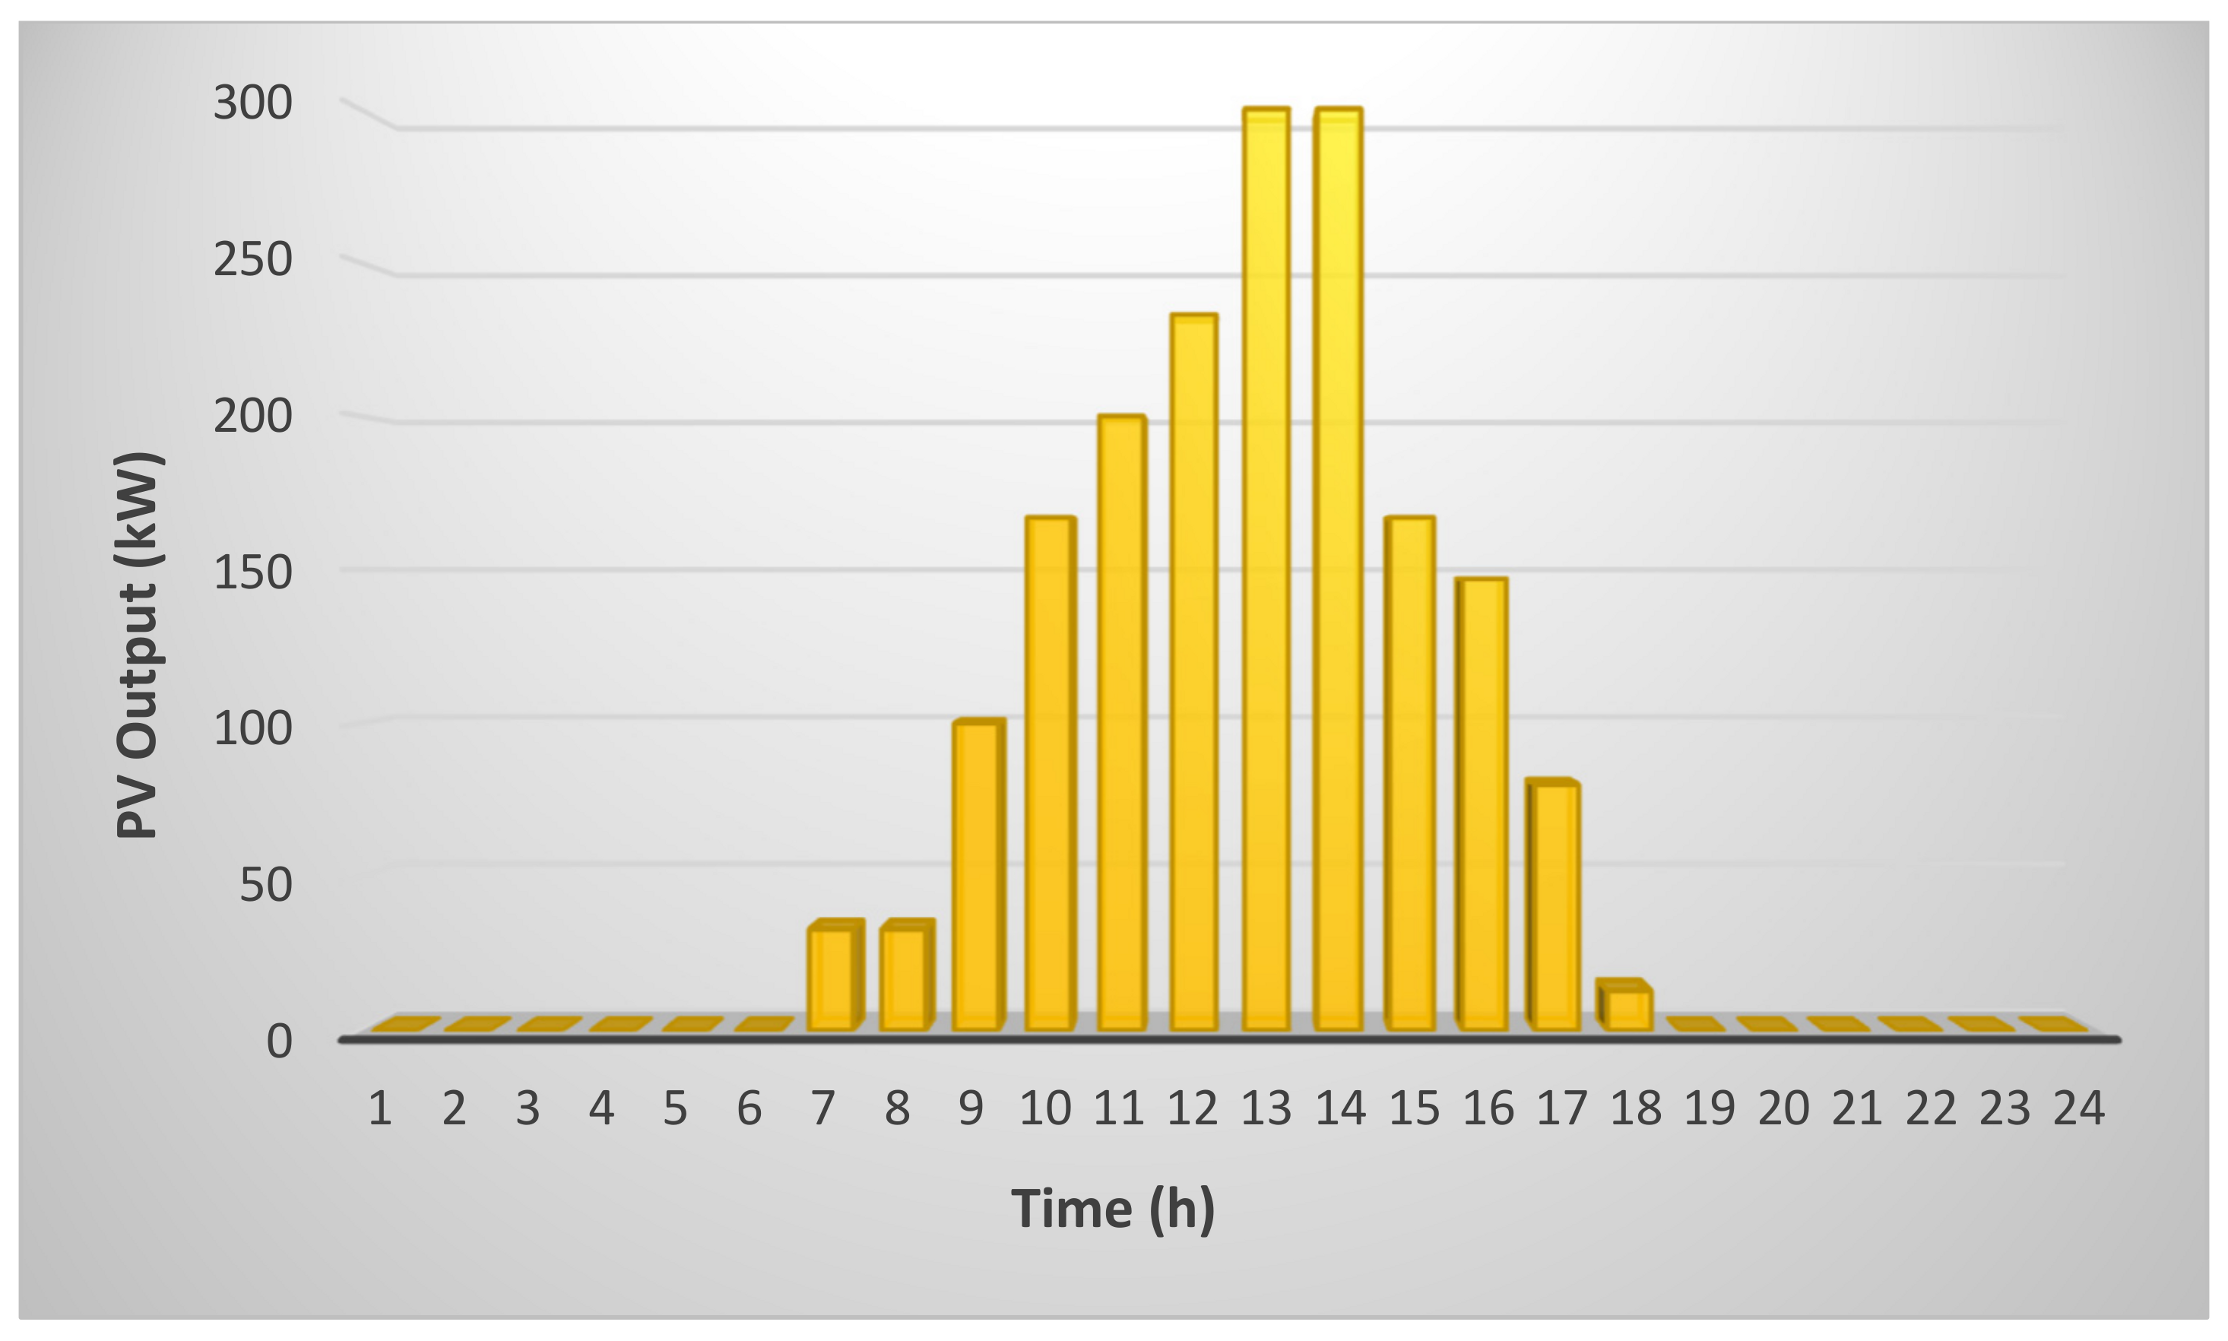
3.1. Photovoltaic System

Pakistan is one of the world’s fortunate places in terms of solar energy consumption. On a horizontal plane, the average sunlight hours per year are around 1700 to 2200, the average solar radiation range is around 2000 kWh/m2/year, 200–250 Watts/m2/day, and 2400 kWh/m2/year is observed at 30° slope facing South [29,30]. Figure 6 shows the monthly mean daily GHI (global horizontal irradiation) of Multan, Pakistan [31].
In this paper, a total of 400 kW solar PV system is proposed to be built on the building’s rooftops and a solar canopy to be installed at charging station to charge electric vehicles.

3.2. Energy Storage System (ESS)

ESS technology refers to the process of transforming one form of energy (mostly electrical energy) into another form that can be stored in different mediums. This stored energy can then be transformed back into electrical energy when required [32]. ESS are becoming an essential part of smart grid and microgrid infrastructure along with renewable energy sources. An ESS helps to overcome the intermittency associated with renewables but also provides the opportunities to apply peak shaving and demand response policies [33,34,35,36]. ESS also supports controlling power flow and managing energy storage for grids [37].
BESS [38], flywheel energy storage [39], super capacitors [40], compressed-air energy storage [41], hydrogen energy storage [42], etc. are various types of the ESS available. Lithium-ion (Li-ion) batteries are becoming more popular as BESS for their minimal self-discharge rate, better reliability, high power and energy density and extensive lifetime [43]. A Li-ion battery system with 100 kWh of storage capacity is proposed in this paper. The allowable maximum charge and discharge powers are 100 kW and −100 kW respectively. This battery size is selected so that it can store the surplus power generated through PV system and can provide electricity when there are power interruptions or during peak hours.

3.3. Electric Vehicle (EV)

Due to increased environmental concerns, many studies are focusing on development of the conventional transport system to AMoD (Autonomous Mobility-on-Demand Systems) [44,45]. Autonomous cars are expected to transform the urban environment, while EVs are already assisting in the transportation sector’s decarbonization.
EVs are an eminent constituent of the modern era, playing a major role in making the road transport greener. However, a large incorporation of EVs in power systems poses new challenges to the power system’s stability and economy attributed to the ample power required for charging their batteries. The deployment of vehicle to grid (V2G) technology can help cope with this issue. In V2G technology, EVs act as storage devices that can store power at off-peak times and can help power the grid at peak times.
To evaluate the effect of incorporating EVs in the proposed system, it is assumed that the faculty members and the students can park their cars at the charging station during office hours, i.e., 09:00 to 15:00. EVs will get charged through the PV generation and the grid supply. The cars can only charge and discharge while parked. EVs will try to get charged to their maximum capacity. EVs will act as a source to supply power to grid when there is a fault in grid or when there is an instant increase in load demand. Figure 7 shows the integration of EVs in the proposed system [46].

4. Mathematical Modelling

4.1. PV System Modelling

PV modules power output generally depends on solar irradiance and temperature, and can be calculated as follows [21]:
P P V = N η i n v P n , r G k G k , r 1 + γ T c T r ,
where P P V is the PV output power, n is the total number of modules in the PV system, η i n v is the efficiency of inverter, P n , r is the nominal power under reference test conditions for each module, G k is the solar irradiance at time instant t, G k , r is the solar irradiance under reference test conditions, γ is the temperature coefficient, T c and T r represent the cell temperature and cell temperature under reference test conditions, respectively. The model is further explained in the relationship:
T c = T a m b + N o 20 0.8 G k ,
where N o is the “Nominal Operating Cell Temperature” and T a m b is the ambient temperature. The installed PV capacity, P C , can be determined using the following equation [12]:
P C = η p v . A . ω p ,
where η p v is the efficiency of PV, A is the area of solar panel and ω p is the peak solar insulation. PV operating costs are considered to be a fixed cost of maintenance per time interval. The DC power output of the PV system is converted to AC power through the application of an inverter. The solar modules power P A and typical efficiency of the inverter are used to estimate the rating of the inverter, according to the following equation:
C i n v = P A 100 η i n v
The solar data used in this paper are taken from [26].

4.2. Energy Storage System Constraints

The binary variable for charging and discharging state of battery are X E S S c and X E S S d ,
X E S S c , X E S S d 0 , 1
Charging and discharging power level constraints are given in the equations below. It shows that the charging power will be zero if X E S S c = 0 , that is, ESS is not in the charging mode, and the same holds true for discharging mode if X E S S d = 0 .
P m i n c P t c X E S S c P m a x c ,
P m i n d P t d X E S S d P m a x d ,
where P c and P d are the charging and discharging powers respectively.
At each time instant, the battery must either be in charging or discharging state.
X E S S c + X E S S d 1
Fully discharging the battery can damage the system. For that reason, the charging and discharging of ESS must be within the limits specified by the following equations [27]:
S O C t 1 S O C m a x 100 C E S S P E S S , t ,
S O C t 1 S O C m i n 100 C E S S P E S S , t ,
where SOC is the state of charge of battery, and P E S S is the power output of the battery.
The S O C t level of battery at time instant t depends on the previous state S O C t 1 , and can be calculated using the equation given below:
S O C t = S O C t 1 P E S S , t × 100 C E S S
To avoid accelerated aging of the battery, the following equation must be satisfied
S O C m i n S O C t S O C m a x
The SOC level should be the same at the end and start of an optimization period as ESS is operated daily.
S O C t o = S O C t e n d

4.3. Electric Vehicle Constraints

EVs act as storage tools, provided that they are connected to a charging station. The SOC for the kth EV S O C k , between the arrival and departure time, can be evaluated using the equation given below [47]:
S O C k , t = S O C k , t 1 + η E V c P k , t c P k , t d η E V d
The power demand of the kth EV at time t, P k , t , can be calculated from the following equation [48]:
P k , t = P k s t ω t h t ,
where, P k is the rated power of the kth EV, s t represents the connectivity status of EV in time t, ω t denotes the weekdays and h t denotes the working hours. For various EVs, the aggregated EV power demand is calculated by adding power demand of each EV.
P E V , t = k = 1 N P k , t , t i m e   t o   c h a r g e   E V s 0 , e l s e
The charging and discharging power level constraints are considered to ensure that the charging and discharging power levels at each time interval are within the limits.
P k , m i n c P k , t c P k , m a x c ,
P k , m i n d P k , t d P k , m a x d
The SOC for the kth EV at time t, must be within limits to prevent the impact on state of health (SOH) of the battery.
S O C k , t m i n S O C k , t S O C k , t m a x

4.4. Grid Connection

The connection between the grid and microgrid has a maximum power exchange limit, implying that the power purchased from the grid or the power sold to the grid should be within the limits as given below [49],
P G r i d m i n P G r i d P G r i d m a x
To achieve the supply–demand balance, the following equation must be satisfied.
P G r i d , t + P P V , t + P E S S , t + P E V , t = P L o a d , t

5. Objective Function

The objective problem is formulated as a linear optimization problem to minimize the daily electricity consumption cost by optimally scheduling the power sources as given below,
m i n   J = t = 1 T J G r i d , t + J P V , t + J E S S , t + J E V , t ,
where,
J G r i d , t = ( P G r i d , t ) R G r i d , t ,
J P V , t = ( P P V , t ) R P V , t ,
J E S S , t = ( P E S S , t ) R E S S , t ,
J E V , t = ( P E V , t ) R E V , t
In Equation (22)–(26), J represents the electricity cost, J G r i d , t , J P V , t , J E S S , t and J E V , t are the electricity costs at time t, associated with grid, photo-voltaic system, energy storage system and electric vehicles, respectively. The unit price at any time is represented by R t .

Solution Methodology

The optimization problem is solved using robust linear programming. It is a technique that considers linear relationships to find the optimal solution for the given problem. It reaches towards the global optima using less computation time and is seldom used at campus microgrid sites. The general expression of linear programming is as follows:
m i n x   f T x ,
such that
A . x b , A e q . x = b e q , u b x l b .
In Equations (27) and (28), f, x, b, beq, lb, and ub are vectors, and A and Aeq are matrices.
Interior-point method is used in MATLAB to solve the objective function. Internet of things (IoT) based devices are used for monitoring and control [50,51]. IoT plays an essential role in connecting devices, processes, and things. It considerably improves communication features and provides latest data to the distributed networks.

6. Results and Discussion

Following cases are analyzed using Linear programming in MATLAB to achieve the best outcome. These cases differ with respect to the components and parameters that are used in them. Comparing the cases with a reference or base case is important for microgrid analysis and planning. The reference case is how the system is currently operating prior to microgrid implementation. The reference case and the other cases compared to the reference case are described in this section.
Table 3 lists the components and parameters used in each case.

6.1. Case 1, Grid Only

No PV, ESS and EV are considered in this case. Power is solely supplied by the utility grid. The electricity cost using ToU tariff in this case is evaluated to be $622.42 per day. This case is considered as a reference case. It indicates how the system is operating currently.

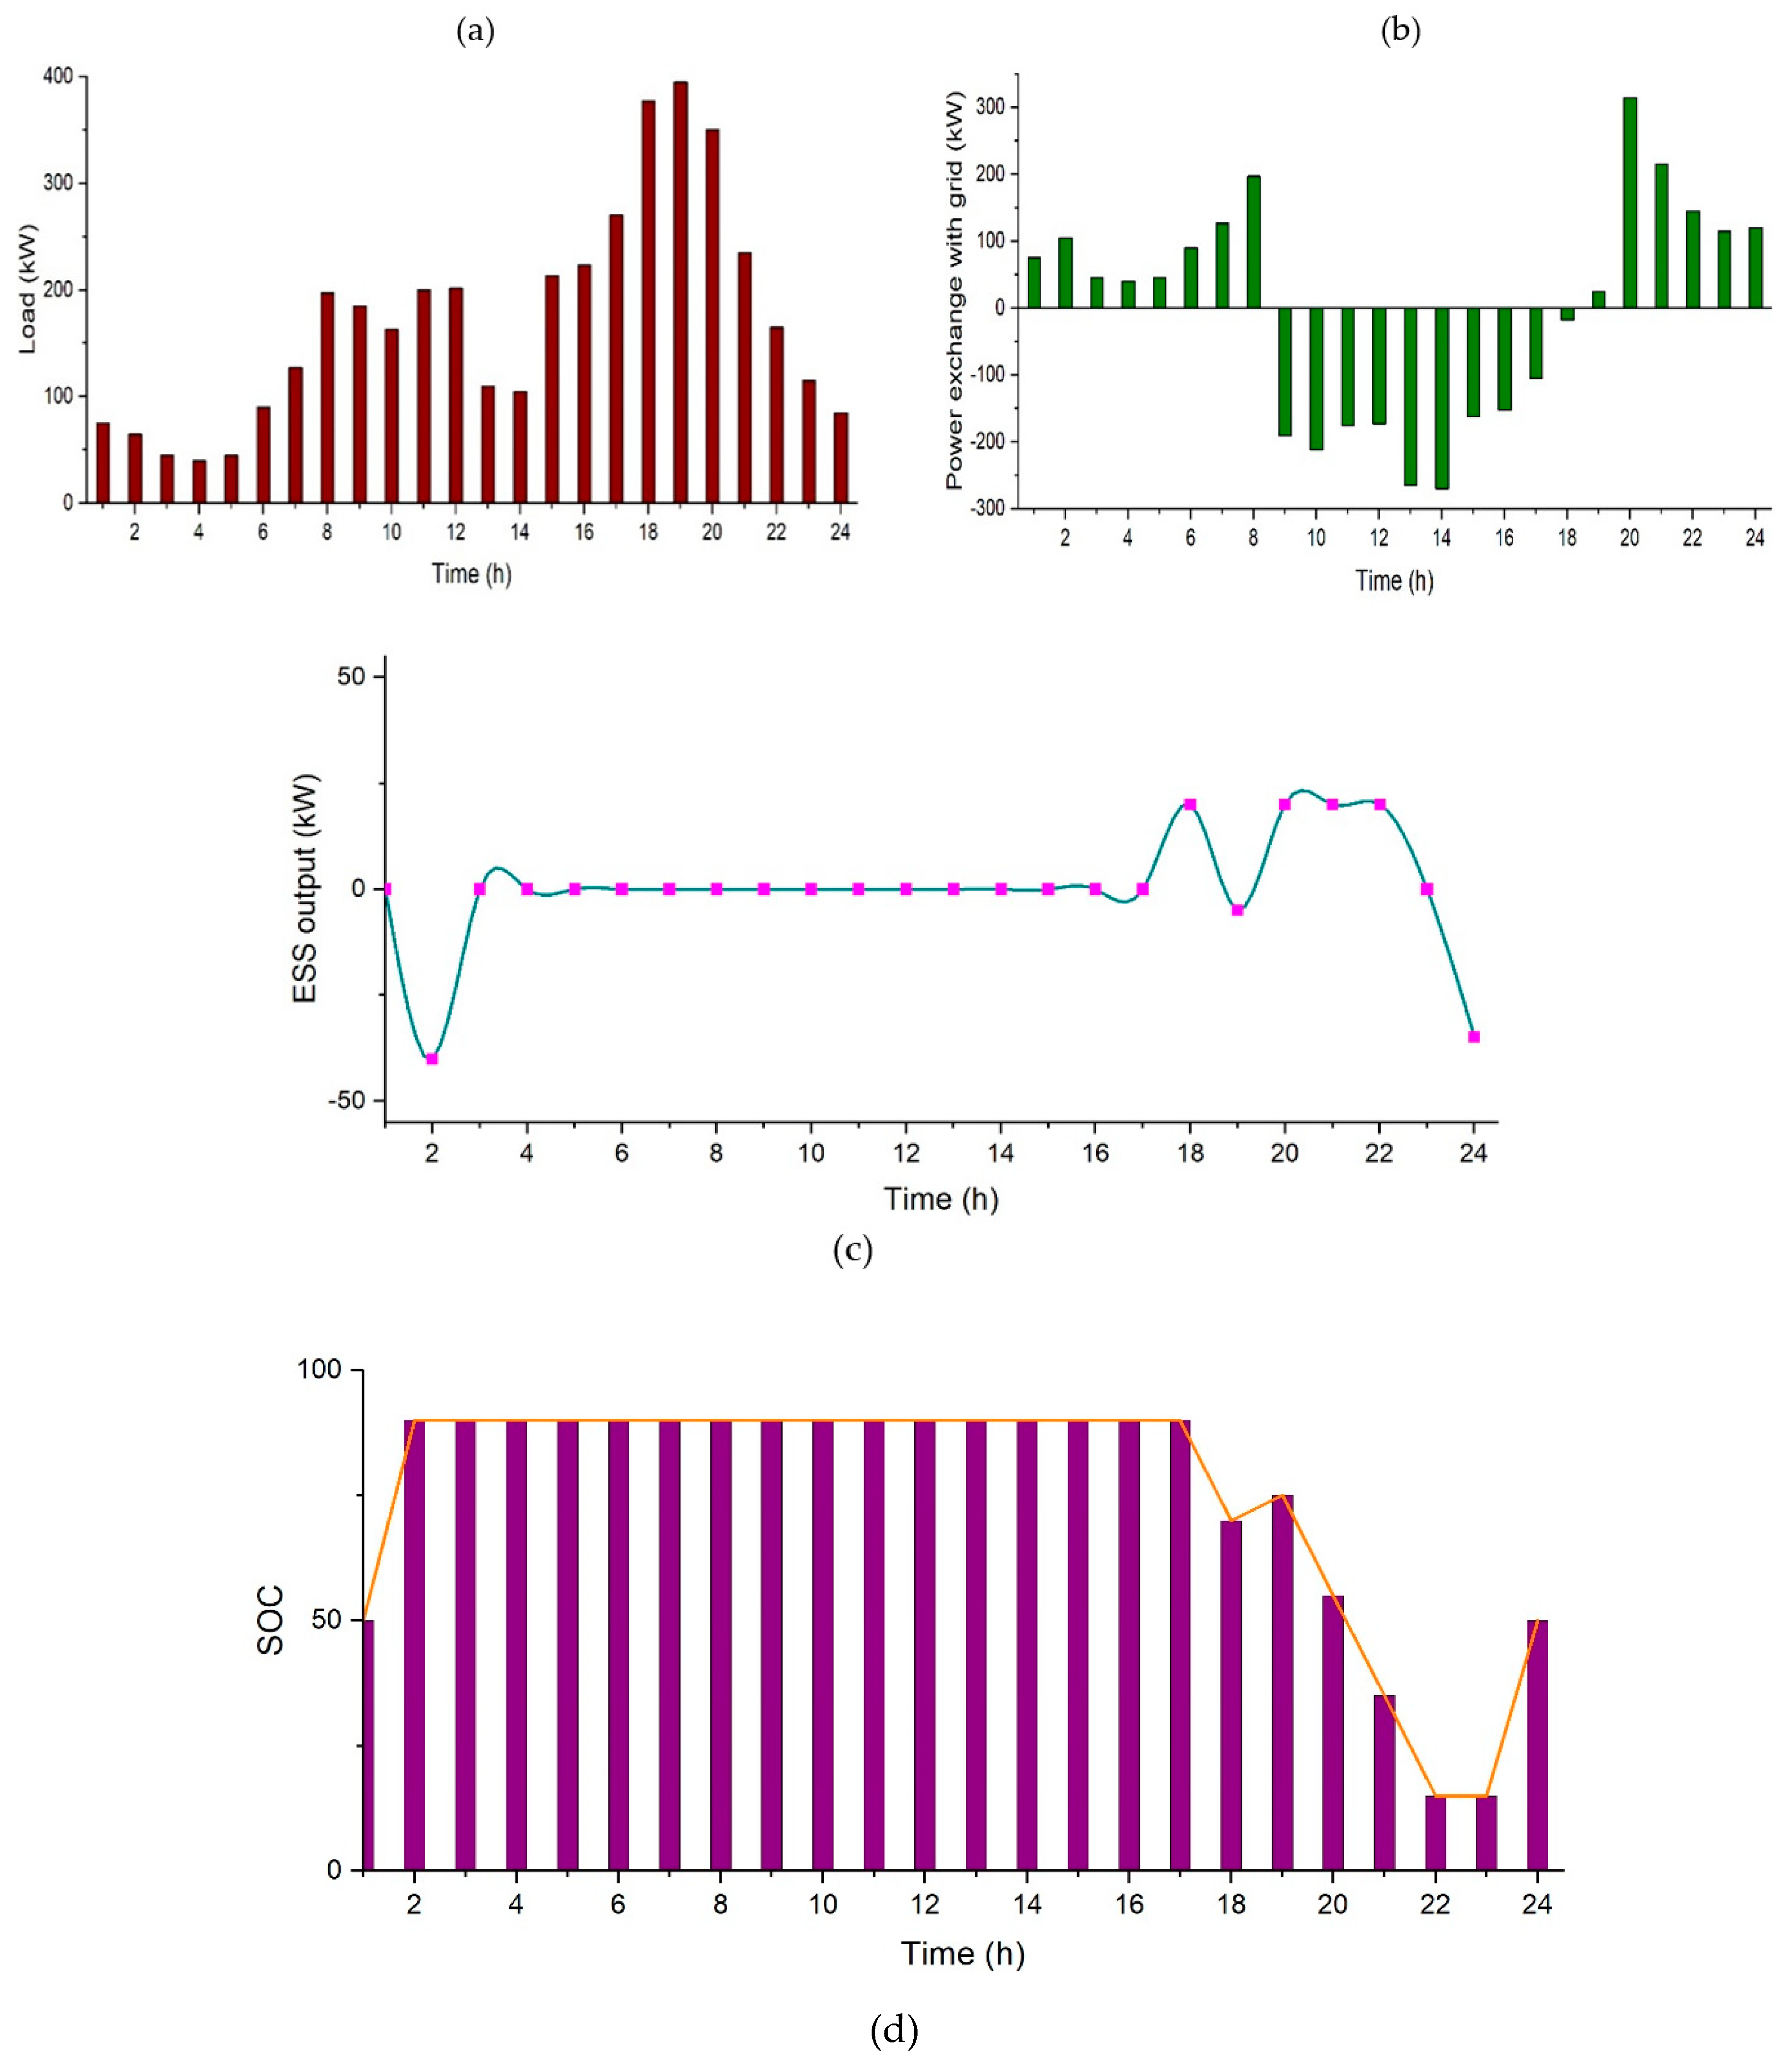
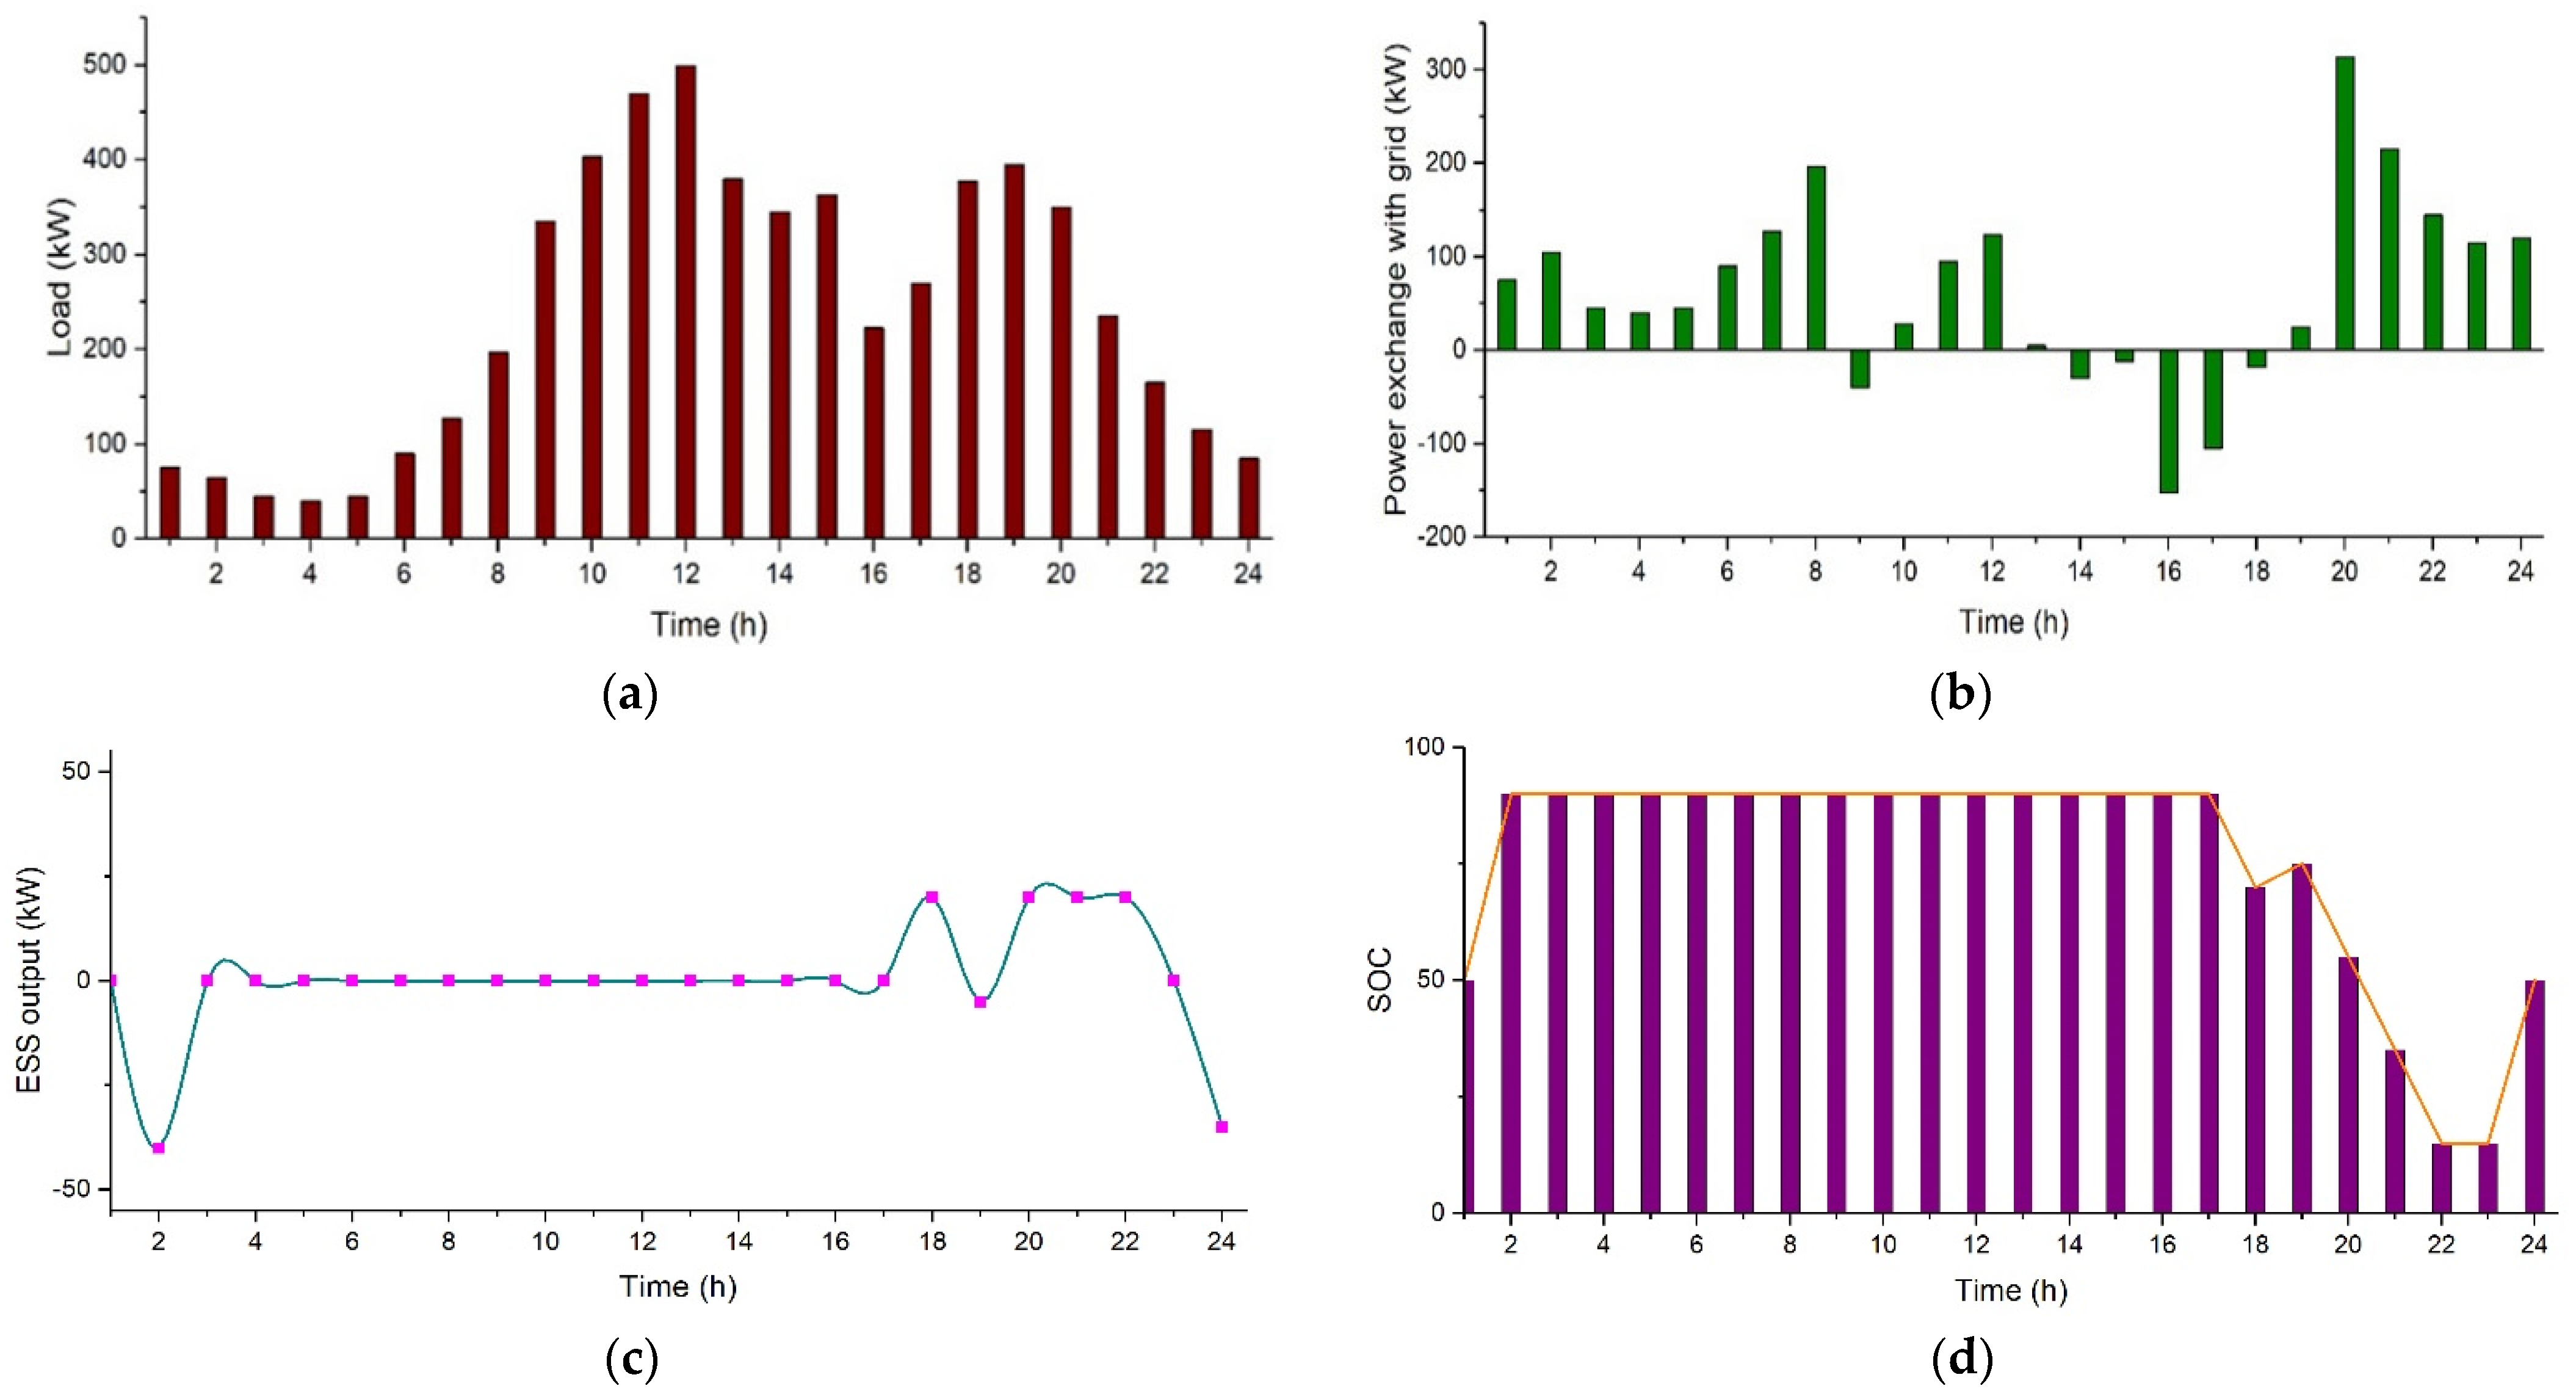
6.2. Case 2, Grid with PV and ESS

In this case, the effect of implementation of PV and ESS are considered along with grid. PV production on an average day during a year is shown in Figure 8 [26]. It can be observed in the figure that from night until 7:00 in morning, there is little or no sunlight to produce power. After this, PV captures sunlight to produce power, reaching its maximum at noon.
The daily average load profile of the college is shown in Figure 3, which is the normal load profile in the absence of any generation or storage by the microgrid. However, after setting up the PV system with ESS, the load profile changes entirely. This is because when we have a PV system coupled with some load, the final load profile is a result of the difference between the original load profile and PV production. This is clearly shown in Figure 9b, where the load has been fairly reduced, and the reduction corresponds to the production from the PV system.
The total electricity cost comes out to be $343.64 over a day. There is a reduction of nearly 45% from the original cost considering only grid. Figure 9 shows the simulation results for this case, where Figure 9a represents the college prosumer load profile, Figure 9b shows the power exchange with the grid, Figure 9c represents the power output of ESS, and Figure 9d shows the state of charge of the battery.

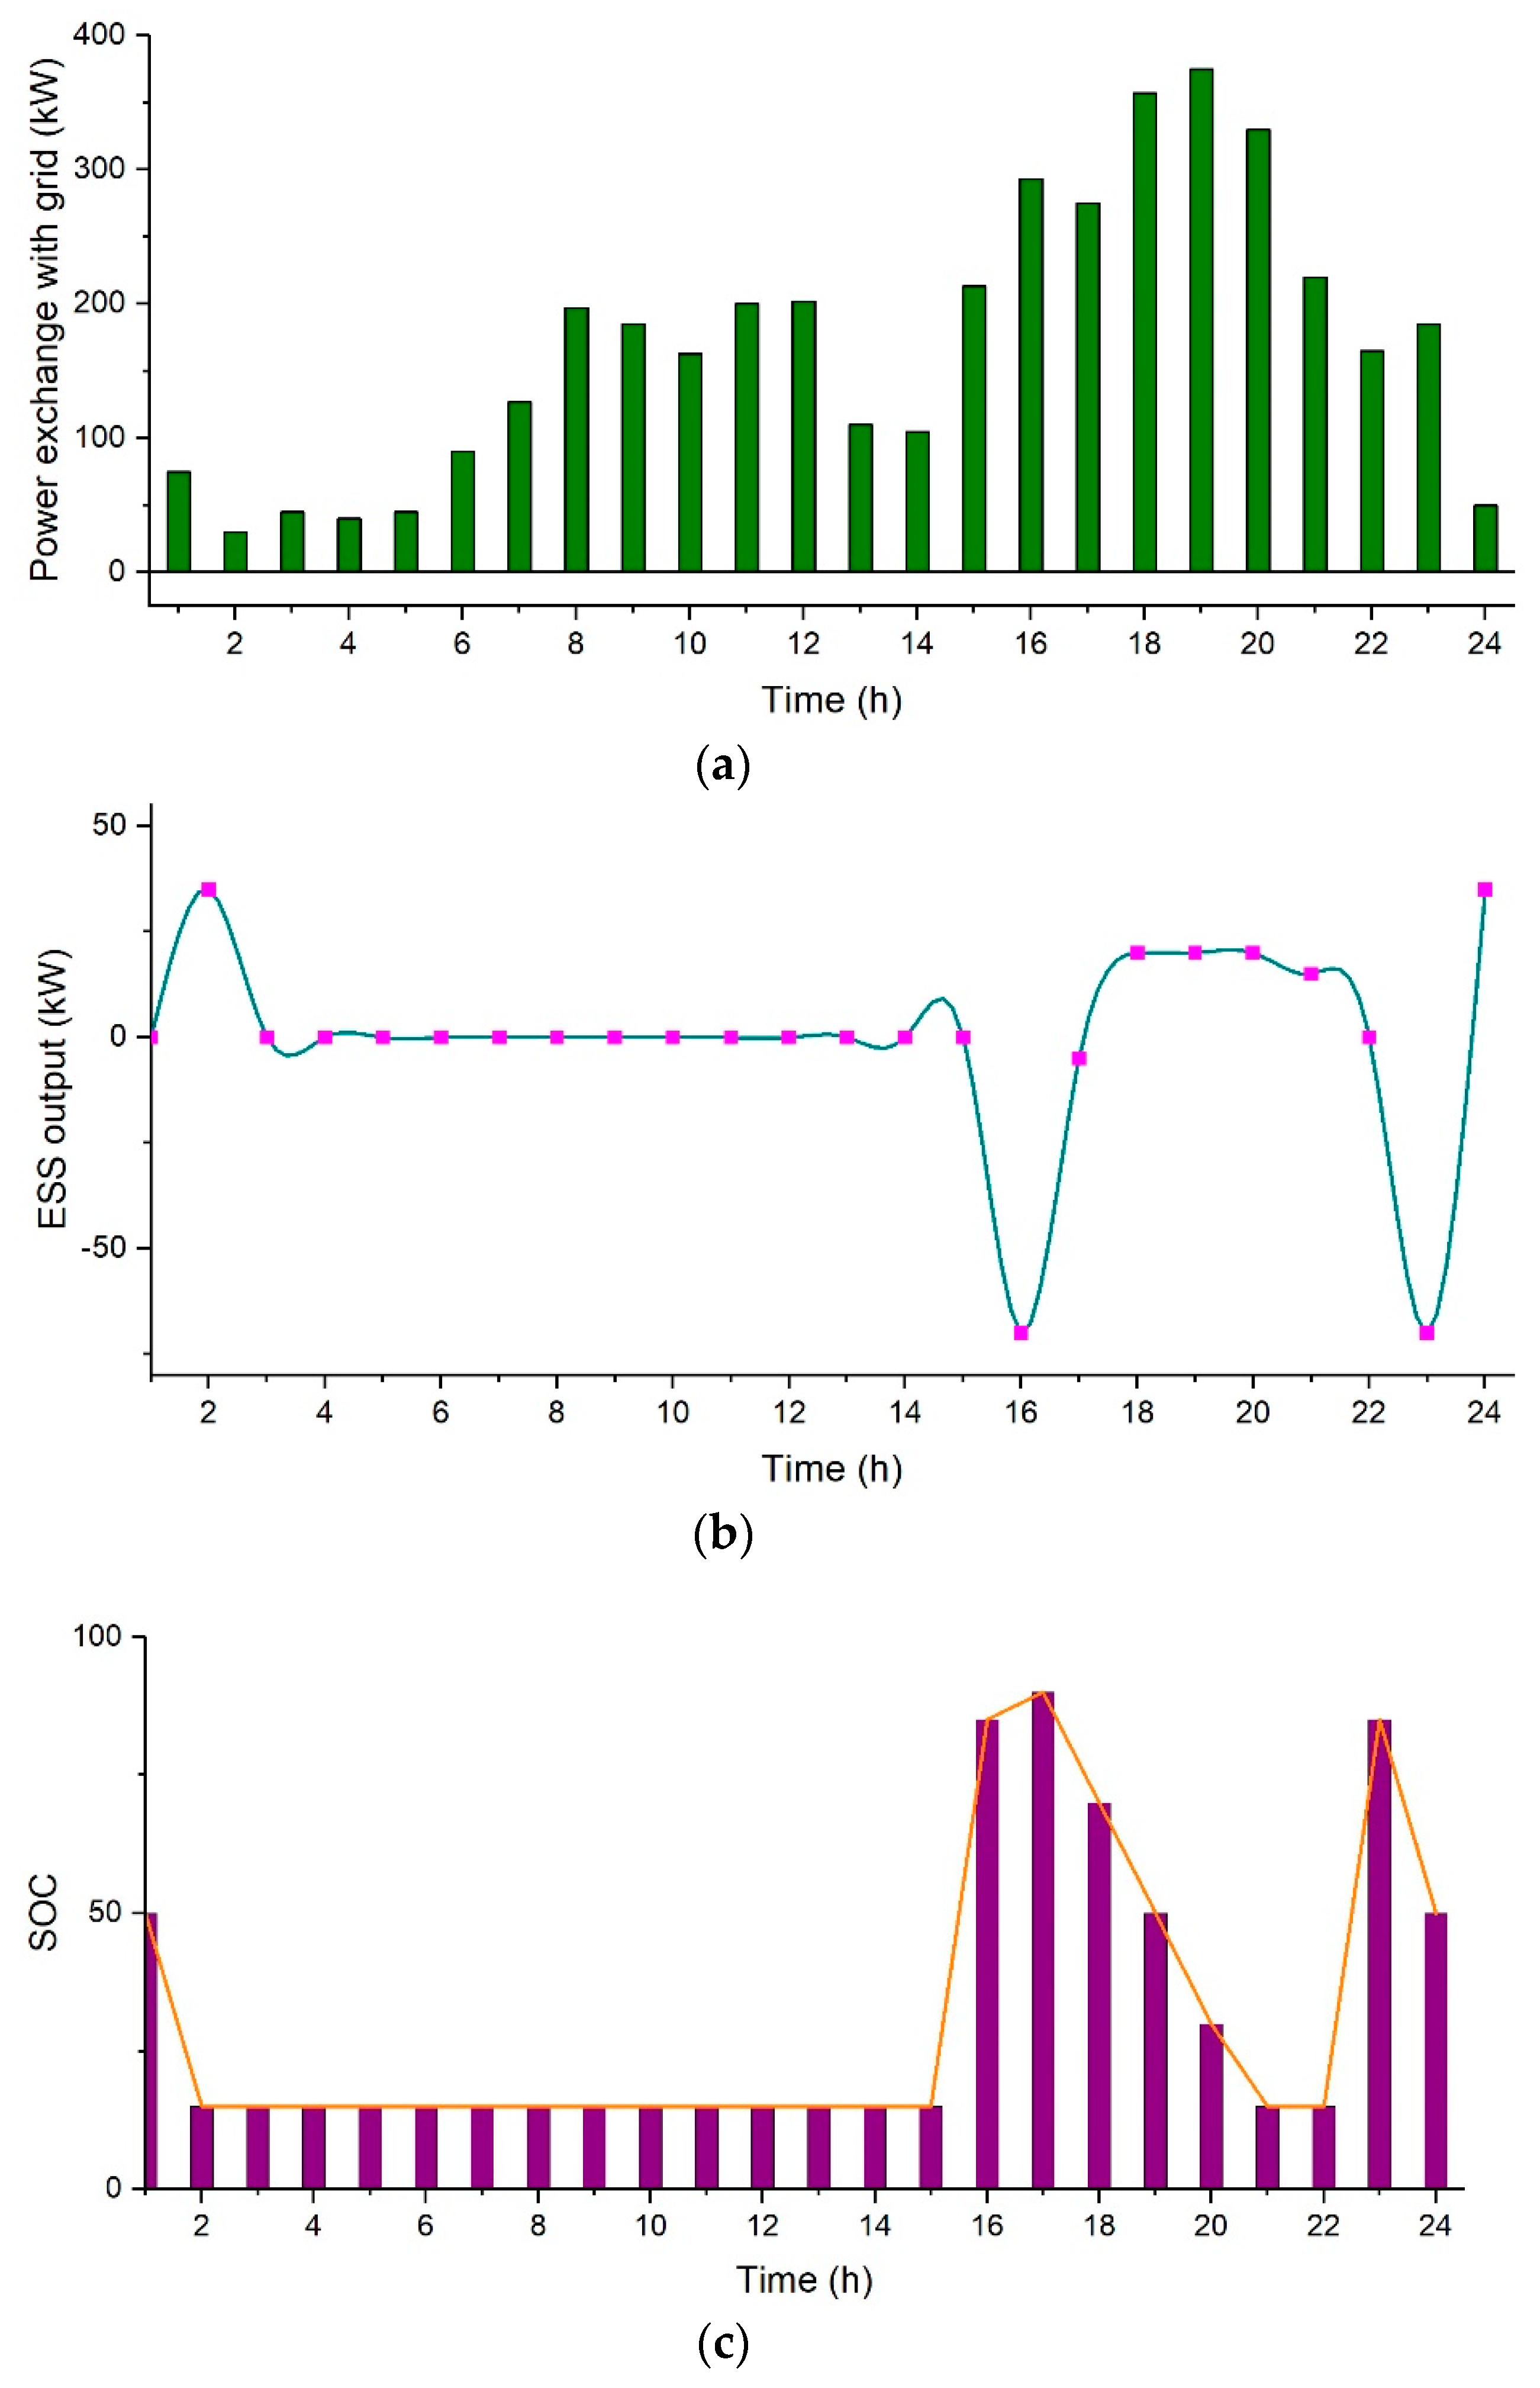
6.3. Case 3, Grid with PV and ESS Considering Power Interruptions

There are situations when the main grid is not available to support the load demand such as during power outages. In these situations, the microgrid is on its own, i.e., the microgrid is operating in off-grid mode. In this case, the effect of power outages is evaluated along with PV, ESS and grid. It is assumed that there is shortage of power from 11:00 to 12:00 and 17:00 to 18:00. At that time, the power will be supplied through ESS and PV as depicted through the simulation results. PV production is near the maximum from 11:00 to 12:00, so the batteries stay idle, and the load is fed directly by the PV system. During hours with low PV production, such as from 17:00 to 18:00, the load is being fed by the batteries instead, which can be clearly seen in the SOC curve where the batteries are in a discharging state from 17:00–18:00 h. The total cost in this case comes out to be $461.99 per day. In Figure 10, Figure 10a shows power exchange with the grid, Figure 10b represents the power output of ESS, and Figure 10c represents the state of charge of battery.

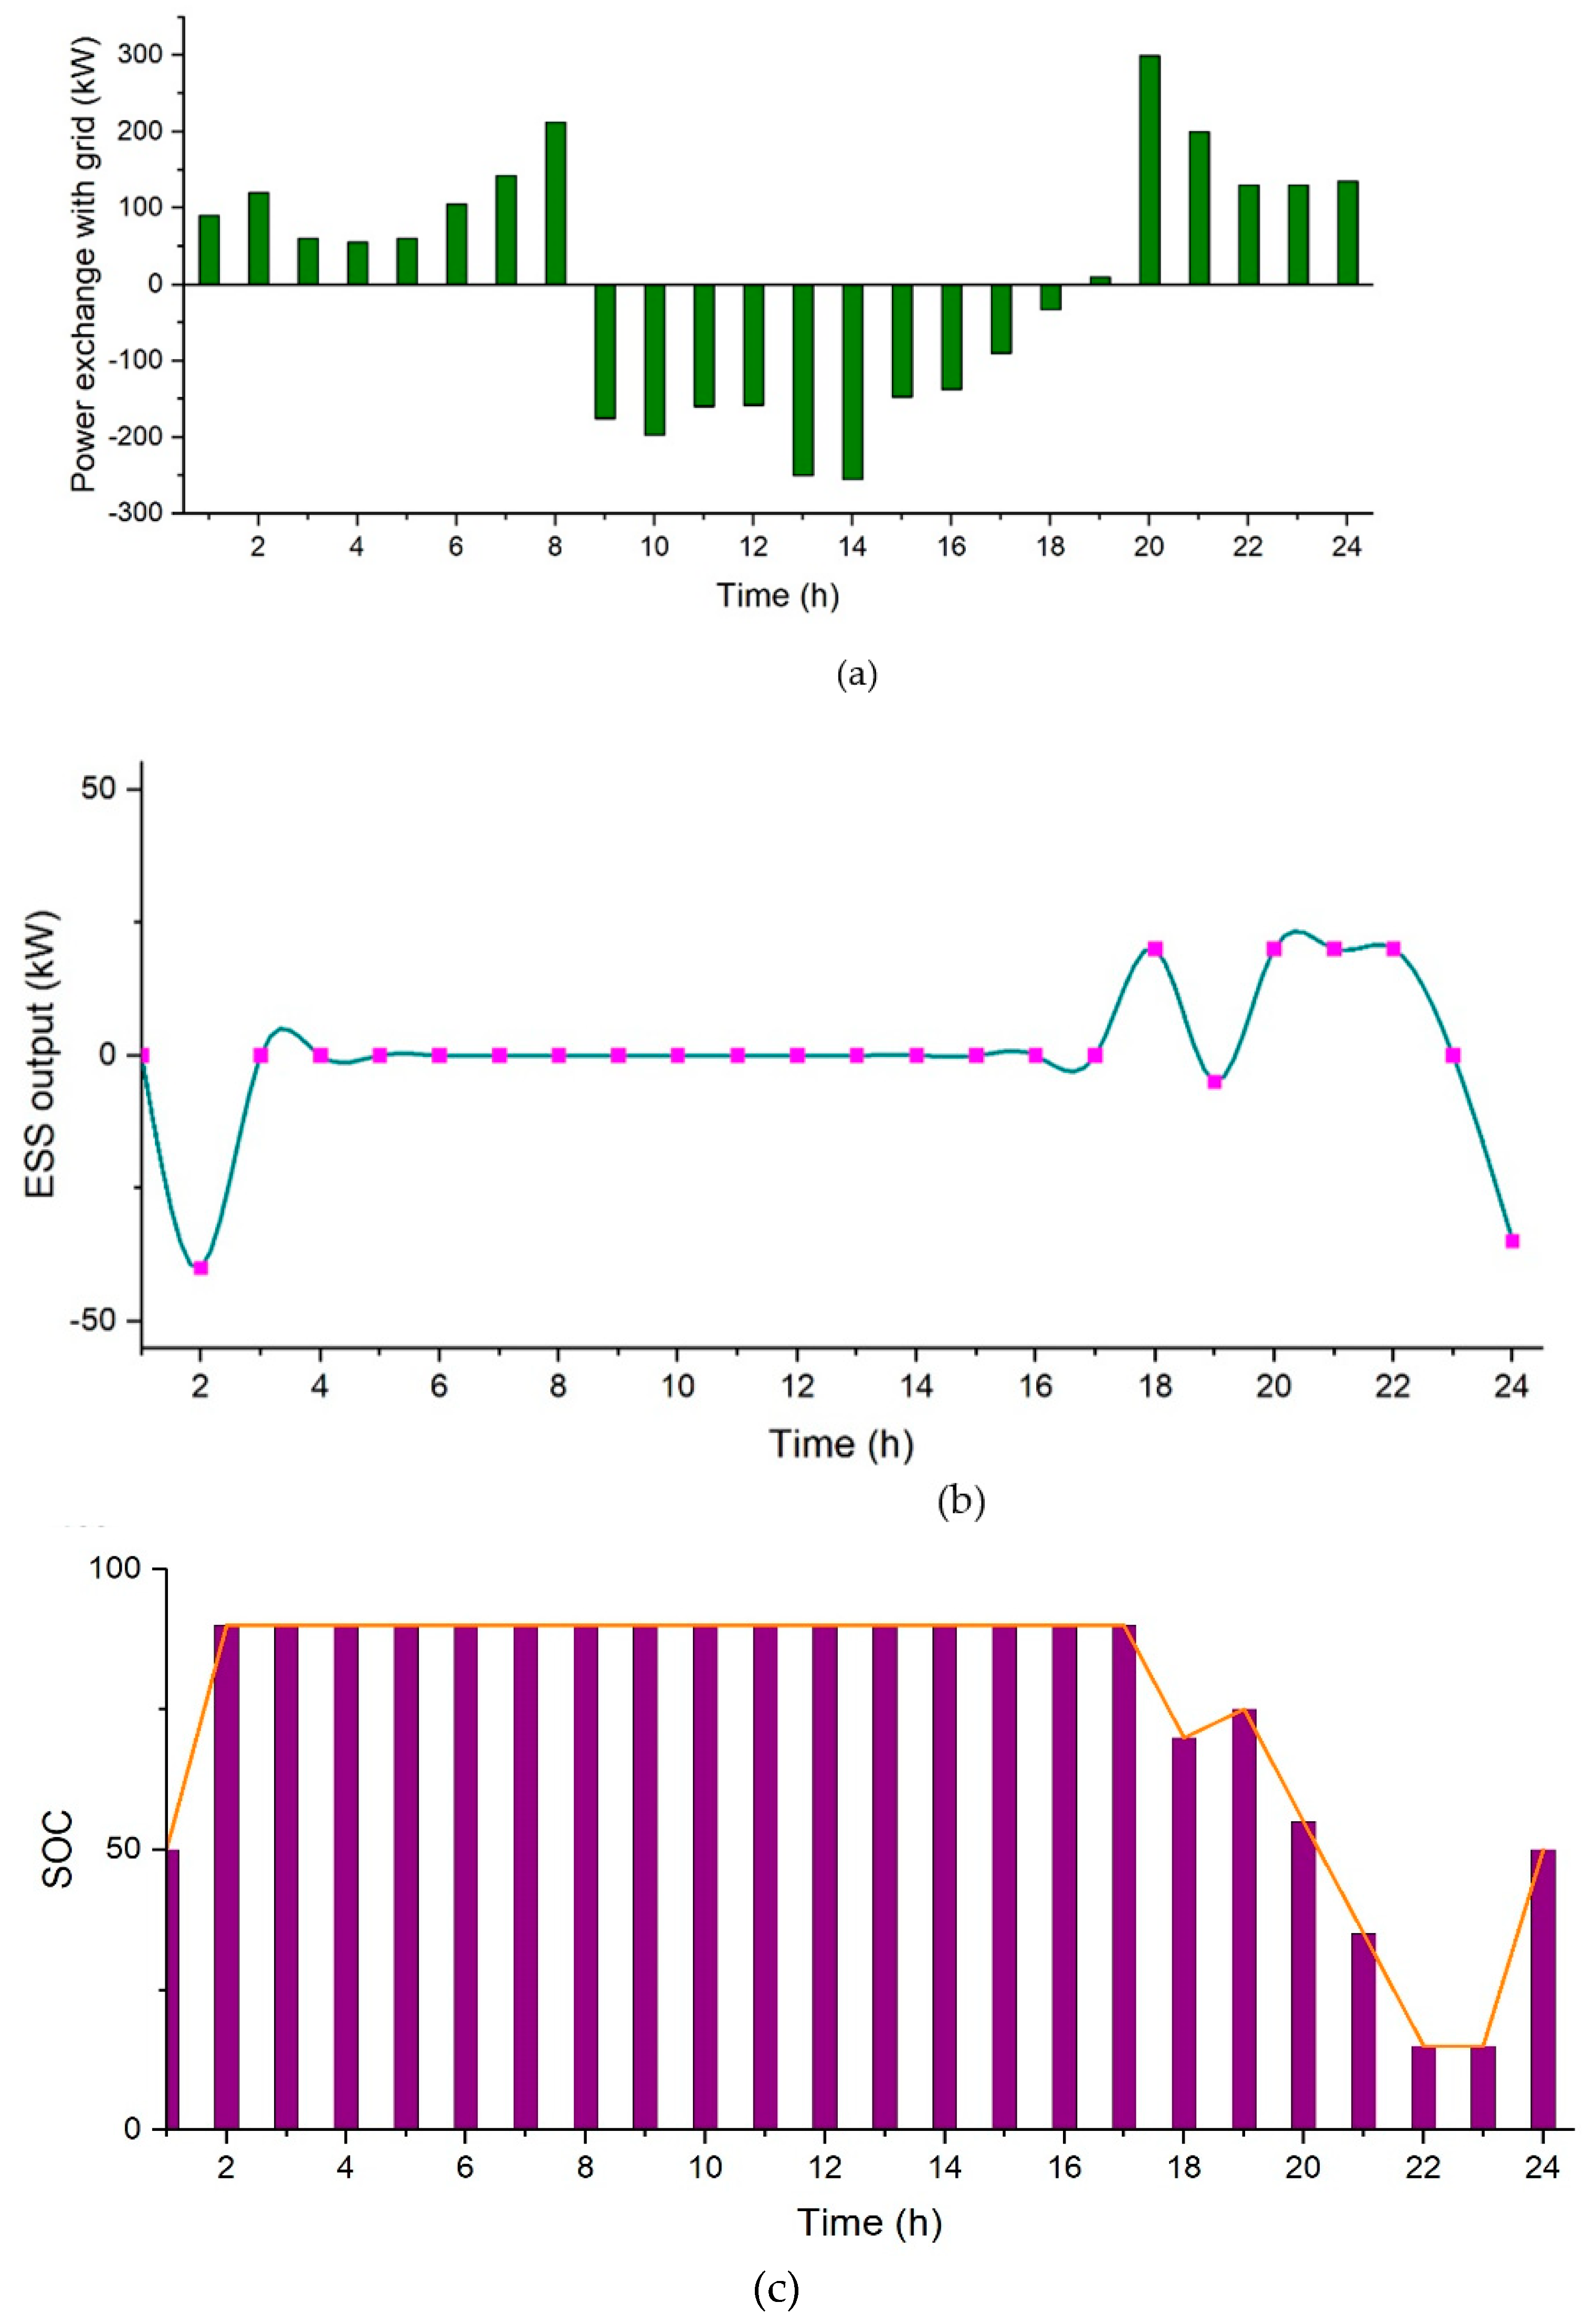
6.4. Case 4, Grid with PV, ESS, and EV

In this case, the effect of integrating EVs is estimated. A total of 100 EVs are assumed for the case study. Two scenarios are considered, (I): EVs are acting as a load, and (II): EVs are acting as a source.

6.4.1. EV as a Load

In this scenario, EVs are acting as a load. The average load profile with EVs integrated in the system is shown in Figure 11a [52]. EVs will try to get charged to their maximum capacity. EVs can store energy while acting as a load and can supply this stored energy to the grid during peak times. Simulation results show that the total electricity cost for this case is $502.10 per day. Figure 11 b depicts that less power is exported to the grid in this case from 09:00 to 15:00, as most of the power is used to charge the EVs during that time. In Figure 11, Figure 11a represents the college prosumer load profile with EVs integration, Figure 11b shows power exchange with the grid, Figure 11c represents the power output of ESS, and Figure 11d represents the state of charge of battery.

6.4.2. EV as a Source

In this case, EVs act as a source of electricity by supplying the stored energy to the loads and grid. It is assumed that the EVs act as a storage system of 100 kWh. Simulation results show that the total electricity cost for this case is $338.72 per day. In Figure 12, Figure 12a shows power exchange with the grid, Figure 12b represents the power output of ESS, and Figure 12c represents the state of charge of battery. It can be seen in Figure 12a that a large amount of power is exported to the grid, in this case with an added storage of 100 kWh.
Integrating DERs with existing grid and optimal scheduling of available energy resources is analyzed in the above-mentioned cases. The electricity cost and cost saving associated with each case is summarized in Table 4. The cost is highest in the reference case without any DERs. Integrating PV and ESS with the grid has decreased the cost by nearly 45%. Of note, in [26], the cost saving was 35% with PV, ESS, and diesel generator, using mixed-integer linear programming. EVs were not considered in this work.
Integrating EVs as source has reduced the cost by 45.58% and as load by 19.33%. In case of power interruptions, the EMS optimally utilizes the energy reserves to ensure continuous power supply and the cost is reduced by 25.78%. Thus, a microgrid scheduler is required for seamless and cost-effective operation. The last column shows the levelized cost of energy (LCOE) ($/kWh), which is based on the installation, operation, and maintenance costs.

7. Conclusions

In this paper, the effect of incorporating PV system, ESS and EVs are studied in a distribution network of a university campus. The study proposes the application of an optimal EMS to the system considering the future connections of the proposed DERs. The problem was formulated using the linear optimization technique and simulated in MATLAB. The impact of the proposed EMS was observed considering various cases. The energy requirement of the college was solely supplied through the local utility under the time of use (ToU) tariff without any DERs, resulting in high energy consumption cost. Integrating PV and ESS in the system implied a cost saving of 44.80% daily. The impact of real-time local problems like power outages was also investigated. The proposed EMS ensured the continuous power supply to the load during the grid outage hours without compromising the daily activities at the college. Moreover, the effect of integrating EVs in the current infrastructure was also studied. The impact of EV as a load and as an energy source were investigated discretely. Providing the load demand presented by EVs resulted in a daily percentage saving of 19.33% and the savings increased to 45.58% when EVs were used as a source to provide for the load. The future work will involve expanding the project to encompass the whole main campus. The uncertainties associated with DERs and complex mathematical models will be researched in the future.

Author Contributions

Conceptualization, T.N. and M.A.; methodology, S.R. and H.A.u.M.; software, T.N.; validation, H.J, F.Q. and O.C.; formal analysis, T.N, F.A.; investigation, H.H.; resources, H.J., F.Q, O.C.; data curation, H.A.u.M.; writing—original draft preparation, T.N.; writing—review and editing, H.J., F.Q.; visualization, S.R.; supervision, S.R., M.A. and H.A.u.M.; project administration, H.J.; funding acquisition, H.J. All authors have read and agreed to the published version of the manuscript.

Funding

This work is funded by Taif University, TURSP-2020/150.

Institutional Review Board Statement

Not applicable.

Informed Consent Statement

Not applicable.

Data Availability Statement

Not Applicable.

Acknowledgments

We deeply acknowledge Taif University for supporting this study through Taif University Researchers Supporting Project Number (TURSP-2020/150), Taif University, Taif, Saudi Arabia.

Conflicts of Interest

The authors declare no conflict of interest.

References

  1. Boicea, B.V.A. Energy Storage Technologies: The Past and the Present. Proc. IEEE 2014, 102, 1777–1794. [Google Scholar] [CrossRef]
  2. Hirsch, A.; Parag, Y.; Guerrero, J. Microgrids: A review of technologies, key drivers, and outstanding issues. Renew. Sustain. Energy Rev. 2018, 90, 402–411. [Google Scholar] [CrossRef]
  3. Nasir, T.; Sabir, S.; Bukhari, H.; Raza, S.; Munir, H.M.; Abrar, M.; Abd, H.; Bhatti, K.L.; Ro, J.; Masroor, R. Recent Challenges and Methodologies in Smart Grid Demand Side Management: State-of-the-Art Literature Review. Math. Probl. Eng. 2021, 2021, 5821301. [Google Scholar] [CrossRef]
  4. Salam, R.A.; Amber, K.P.; Ratyal, N.I.; Alam, M.; Akram, N.; Quiterio, C.; Pedro, F. An Overview on Energy and Development of Energy Integration in Major South Asian Countries: The Building Sector. Energies 2020, 13, 5776. [Google Scholar] [CrossRef]
  5. Qasim, M. Population Explosion—A Real Threat to Pakistan; The News International: Islamabad, Pakistan, 2018. [Google Scholar]
  6. Rehman, U.; Riaz, M. Feasibility of the Smart Grid Implementation for Better Load Management in Pakistan. In Proceedings of the 2018 5th International Multi-Topic ICT Conference (IMTIC), Jamshoro, Pakistan, 25–27 April 2018; pp. 1–5. [Google Scholar]
  7. Kanwal, S.; Khan, B.; Rauf, M.Q. Infrastructure of Sustainable Energy Development in Pakistan: A Review. J. Mod. Power Syst. Clean Energy 2020, 8, 206–218. [Google Scholar] [CrossRef]
  8. National Electric Power Regulatory Authority (NEPRA). State of Industry Report 2020; National Electric Power Regulatory Authority (NEPRA): Islamabad, Pakistan, 2020. [Google Scholar]
  9. Masroor, F.; Ashfaq, M.; Siddiqui, M.; Hussain, M.M.; Shahbaz, M.H. The Power Sector of Pakistan. A Brief Review; Research and Development IEEE PES NEDUET BRANCH: Karachi, Pakistan, 2021; pp. 2–6. [Google Scholar]
  10. Li, Y.; Yang, Z.; Li, G.; Zhao, D.; Member, S. Optimal Scheduling of an Isolated Microgrid with Battery Storage Considering Load and Renewable Generation Uncertainties. IEEE Trans. Ind. Electron. 2018, 66, 1565–1575. [Google Scholar] [CrossRef] [Green Version]
  11. Sinha, S.; Chandel, S.S. Review of software tools for hybrid renewable energy systems. Renew. Sustain. Energy Rev. 2014, 32, 192–205. [Google Scholar] [CrossRef]
  12. Kristiawan, R.B.; Widiastuti, I.; Suharno, S. Technical and economical feasibility analysis of photovoltaic power installation on a university campus in indonesia. MATEC Web Conf. 2018, 197, 08012. [Google Scholar] [CrossRef] [Green Version]
  13. Khan, M.R.B.; Pasupuleti, J.; Al-fattah, J.; Tahmasebi, M. Optimal Grid-Connected PV System for a Campus Microgrid. Indones. J. Electr. Eng. Comput. Sci. 2018, 12, 899–906. [Google Scholar] [CrossRef]
  14. Huamani, M.; Pinguelli, L.; Olímpio, A. Barriers, challenges and opportunities for microgrid implementation: The case of Federal University of Rio de Janeiro. J. Clean. Prod. 2021, 188, 203–216. [Google Scholar]
  15. Waqar, A.; Tanveer, M.S.; Ahmad, J.; Aamir, M.; Yaqoob, M.; Anwar, F. Multi-Objective Analysis of a CHP Plant Integrated Microgrid in Pakistan. Energies 2017, 10, 1625. [Google Scholar] [CrossRef] [Green Version]
  16. Abdolrasol, M.G.M.; Hannan, M.A.; Member, S.; Mohamed, A.; Member, S.; Abidin, I.Z.; Member, S.; Uddin, M.N.; Member, S. An Optimal Scheduling Controller for Virtual Power Plant and Microgrid Integration using Binary Backtracking Search Algorithm. IEEE Trans. Ind. Appl. 2018, 54, 2834–2844. [Google Scholar] [CrossRef]
  17. Husein, M.; Chung, I. Optimal design and fi nancial feasibility of a university campus microgrid considering renewable energy incentives. Appl. Energy 2018, 225, 273–289. [Google Scholar] [CrossRef]
  18. Simmhan, Y.; Prasanna, V.; Aman, S. Toward Data-Driven Demand-Response Optimization in a Campus Microgrid. In BuildSys’11: Proceedings of the 3rd ACM Workshop on Embedded Sensing Systems for Energy-Efficiency in Buildings; Association for Computing Machinery: New York, NY, USA, 2011; pp. 41–42. [Google Scholar]
  19. Hao, S.; Coe, S. Scheduling of Site Battery Energy Storage for Demand Response Capacity. In Proceedings of the Seventh Annual IEEE Green Technologies Conference, New Orleans, LA, USA, 15–17 April 2015; pp. 169–175. [Google Scholar]
  20. Shahidehpour, M.; Khodayar, M. Cutting Campus Energy Costs with Hierarchical Control. IEEE Electrif. Mag. 2013, 1, 40–56. [Google Scholar] [CrossRef]
  21. Angelim, J.H. Energy Management on University Campus with Photovoltaic Generation and BESS using Simulated Annealing. In Proceedings of the 2018 IEEE Texas Power and Energy Conference (TPEC), College Station, TX, USA, 8–9 February 2018; pp. 1–6. [Google Scholar]
  22. Xu, F.; Wu, W.; Zhao, F.; Zhou, Y.; Wang, Y.; Wu, R.; Zhang, T.; Wen, Y.; Fan, Y.; Jiang, S. A micro-market module design for university demand-side management using self-crossover genetic algorithms. Appl. Energy 2019, 252, 113456. [Google Scholar] [CrossRef]
  23. Nazir, M. Hybrid Microgrid Controller Analysis and Design for a Campus Grid. In Proceedings of the 2019 IEEE 10th International Symposium on Power Electronics for Distributed Generation Systems (PEDG), Xi’an, China, 3–6 June 2019; pp. 958–963. [Google Scholar]
  24. Savi, N.S.; Kati, V.A. Techno-Economic and Environmental Analysis of a Microgrid Concept in the University Campus. In Proceedings of the International Symposium on Industrial Electronics (INDEL), Banja Luka, Bosnia and Herzegovina, 1–3 November 2018; pp. 1–6. [Google Scholar]
  25. Huang, Y.; Masrur, H.; Shigenobu, R.; Hemeida, A.M.; Mikhaylov, A.; Senjyu, T. A Comparative Design of a Campus Microgrid Considering a Multi-Scenario and Multi-Objective Approach. Energies 2021, 14, 2853. [Google Scholar]
  26. Abd, H.; Muqeet, U.L.; Member, S.; Ahmad, A. Optimal Scheduling for Campus Prosumer Microgrid Considering Price Based Demand Response. IEEE Access 2020, 8, 71378–71394. [Google Scholar]
  27. Abd, H.; Munir, H.M.; Ahmad, A.; Sajjad, I.A.; Jiang, G.; Chen, H. Optimal Operation of the Campus Microgrid considering the Resource Uncertainty and Demand Response Schemes. Math. Probl. Eng. 2021, 2021, 5569701. [Google Scholar]
  28. MEPCO. “MEPCO Tariff”. 2021. Available online: https://mepcobill.pk/mepco-tariff/ (accessed on 21 April 2021).
  29. Abbas, Z.; Shaikh, P.H.; Valasai, G. Effect of Ambient Temperature and Relative Humidity on Solar PV System Performance: A Case Study of Quaid-e-Azam Solar Park, Pakistan. Sindh Univ. Res. J. 2017, 49, 721–726. [Google Scholar] [CrossRef]
  30. Harijan, K.; Uqaili, M.A.; Mirza, U.K. Assessment of Solar PV Power Generation Potential in Pakistan. J. Clean Energy Technol. 2015, 3, 54–56. [Google Scholar] [CrossRef] [Green Version]
  31. Muneer, T.; Maubleu, S.; Asif, M. Prospects of solar water heating for textile industry in Pakistan. Renew. Sustain. Energy Rev. 2006, 10, 1–23. [Google Scholar] [CrossRef]
  32. Luo, X.; Wang, J.; Dooner, M.; Clarke, J. Overview of current development in electrical energy storage technologies and the application potential in power system operation. Appl. Energy 2014, 137, 511–536. [Google Scholar] [CrossRef] [Green Version]
  33. Chen, C.; Duan, S.; Cai, T.; Liu, B.; Hu, G. Optimal Allocation and Economic Analysis of Energy Storage System in Microgrids. IEEE Trans. Power Electron. 2011, 26, 2762–2773. [Google Scholar] [CrossRef]
  34. Bahrani, B.; Member, S.; Saeedifard, M.; Member, S. A Multivariable Design Methodology for Voltage Control of a Single-DG-Unit Microgrid. IEEE Trans. Ind. Inform. 2013, 9, 589–599. [Google Scholar] [CrossRef]
  35. Valverde, L.; Rosa, F.; Bordons, C. Design, Planning and Management of a Hydrogen-Based Microgrid. IEEE Trans. Ind. Informat. 2013, 9, 1398–1404. [Google Scholar] [CrossRef]
  36. Luisa, M.; Silvestre, D.; Graditi, G.; Sanseverino, E.R. A Generalized Framework for Optimal Sizing of Distributed Energy Resources in Micro-Grids Using an Indicator-Based Swarm Approach. IEEE Trans. Ind. Inform. 2014, 10, 152–162. [Google Scholar]
  37. Kim, J.; Jeon, J.; Kim, S.; Cho, C.; Park, J.H.; Kim, H.; Nam, K. Cooperative Control Strategy of Energy Storage System and Microsources for Stabilizing the Microgrid during Islanded Operation. IEEE Trans. Power Electron. 2010, 25, 3037–3048. [Google Scholar]
  38. Divya, K.C.; Østergaard, J. Battery energy storage technology for power systems—An overview. Electr. Power Syst. Res. 2009, 79, 511–520. [Google Scholar] [CrossRef]
  39. Arani, A.A.K.; Karami, H.; Gharehpetian, G.B.; Hejazi, M.S.A. Review of Flywheel Energy Storage Systems structures and applications in power systems and microgrids. Renew. Sustain. Energy Rev. 2017, 69, 9–18. [Google Scholar] [CrossRef]
  40. Jing, W.; Lai, C.H.; Wong, S.H.W.; Wong, M.L.D. Battery-Supercapacitor Hybrid Energy Storage System in Standalone DC Microgrids: A Review. IET Renew. Power Gener. 2017, 11, 461–469. [Google Scholar] [CrossRef]
  41. Venkataramani, G.; Parankusam, P.; Ramalingam, V.; Wang, J. A review on compressed air energy storage—A pathway for smart grid and polygeneration. Renew. Sustain. Energy Rev. 2016, 62, 895–907. [Google Scholar] [CrossRef]
  42. Soloveichik, B.G.L. Regenerative Fuel Cells for Energy Storage. Proc. IEEE 2014, 102, 964–975. [Google Scholar] [CrossRef]
  43. Huang, S.; Tseng, K.; Liang, J.; Chang, C. An Online SOC and SOH Estimation Model for Lithium-Ion Batteries. Energies 2017, 10, 512. [Google Scholar] [CrossRef]
  44. Pavone, M. Autonomous Mobility-on-Demand Systems for Future Urban Mobility. In Autonomes Fahren; Maurer, M., Gerdes, J., Lenz, B., Winner, H., Eds.; Springer: Berlin/Heidelberg, Germany, 2015. [Google Scholar]
  45. Dia, H.; Javanshour, F. Autonomous Shared Mobility-On-Demand: Melbourne Pilot Simulation Study. Transp. Res. Procedia 2017, 22, 285–296. [Google Scholar] [CrossRef]
  46. Al-badi, A.H.; Ahshan, R.; Hosseinzadeh, N.; Ghorbani, R. Survey of Smart Grid Concepts and Technological Demonstrations Worldwide Emphasizing on the Oman Perspective. Appl. Syst. Innov. 2020, 3, 5. [Google Scholar] [CrossRef] [Green Version]
  47. Aluisio, B.; Dicorato, M.; Ferrini, I.; Forte, G.; Sbrizzai, R. Optimal Sizing Procedure for Electric Vehicle Supply Infrastructure Based on DC Microgrid with Station Commitment. Energies 2019, 12, 1901. [Google Scholar] [CrossRef] [Green Version]
  48. Bhatti, A.R.; Awan, A.B.; Sultana, U.; Younas, M. Optimized sizing of photovoltaic grid—Connected electric vehicle charging system using particle swarm optimization. Int. J. Energy Res. 2019, 43, 500–522. [Google Scholar] [CrossRef]
  49. Muqeet, H.A.; Ahmad, A.; Sajjad, I.A.; Liaqat, R.; Raza, A.; Iqbal, M.M. Benefits of Distributed Energy and Storage System in Prosumer Based Electricity Market. In Proceedings of the 2019 IEEE International Conference on Environment and Electrical Engineering and 2019 IEEE Industrial and Commercial Power Systems Europe (EEEIC/I&CPS Europe), Genova, Italy, 10–14 June 2019; pp. 1–6. [Google Scholar]
  50. Wang, C.; Li, X.; Liu, Y.; Wang, H. The research on development direction and points in IoT in China power grid. In Proceedings of the 2014 International Conference on Information Science, Electronics and Electrical Engineering, Sapporo, Japan, 26–28 April 2014; Volume 1, pp. 245–248. [Google Scholar]
  51. Saleem, Y.; Member, S.; Crespi, N.; Member, S. Internet of Things-Aided Smart Grid: Technologies, Architectures, Applications, Prototypes, and Future Research Directions. IEEE Access 2019, 7, 62962–63003. [Google Scholar] [CrossRef]
  52. Pina, A.; Ferrão, P.; Fournier, J.; Lacarrière, B.; Corre, O. Le Study on the Effects of EV Charging to Global Load via Charging Aggregators. Energy Procedia 2018, 145, 175–180. [Google Scholar]
Figure 1. Energy generation sources in Pakistan.
Sensors 21 07133 g001
Figure 2. Microgrid system.
Sensors 21 07133 g002
Figure 3. Daily average load profile.
Sensors 21 07133 g003
Figure 4. Daily average electrical load distribution pattern.
Sensors 21 07133 g004
Figure 5. System Architecture.
Sensors 21 07133 g005
Figure 6. Monthly mean daily GHI of Multan, Pakistan.
Sensors 21 07133 g006
Figure 7. EV integration in the proposed system.
Sensors 21 07133 g007
Figure 8. PV production on an average day during the year.
Sensors 21 07133 g008
Figure 9. Case 2, (a) College prosumer load profile, (b) Power exchange with the grid, (c) Power output of ESS, and (d) State of charge of the battery.
Sensors 21 07133 g009
Figure 10. Case 3, (a) Power exchange with the grid, (b) Power output of ESS, and (c) State of charge of battery.
Sensors 21 07133 g010
Figure 11. Case 4 (I), (a) College prosumer load profile with EVs integration, (b) Power exchange with the grid, (c) Power output of ESS, and (d) State of charge of battery.
Sensors 21 07133 g011
Figure 12. Case 4 (II), (a) Power exchange with the grid, (b) Power output of ESS, and (c) State of charge of battery.
Sensors 21 07133 g012
Table 1. Comparative study of related work.
Ref[12][13][14][17][18][20][21][22][23][24][26]
ComponentsPV, BESSPV, BESSPV, WindPV, ESS, ConverterPV, wind, BESS, natural-gas turbine generatorPV, BESSPV, BESS, Inverters, Diesel generatorPV, Wind, EV, BESS, CHP power plantPV, BESS, Diesel generator
AlgorithmsDispatch AlgorithmMachine-learning techniques, complex event processing (CEP)Simulated Annealingself-crossover genetic algorithmMixed-integer linear programming
SoftwareHOMERHOMERHOMERMATLABSemantic databaseSCADAMATLABMATLAB ToolboxPSCADMATLAB
Campus NameSebelas Maret University, IndonesiaUniversity of Kuala Lumpur, MalaysiaFederal University of Rio de Janeiro, BrazilSeoul National University, South KoreaUniversity of Southern California (USC), Los AngelesIllinois Institute of Technology (IIT), ChicagoFederal University of Para, BrazilAnonymousClemson University, South CarolinaUniversity of Novi Sad, SerbiaU.E.T, Taxila, Pakistan
ValidityThe results were analyzed based on NPC and IRR methodsBased on total net present costComparison between six different technical arrangementsComparison without microgridThe portal will display real-time load curtailment patterns that are detected by the CEP system for these buildingsPermanent 20% decrease in the peak load from the 2007 levelThree cases, Reference, PV, PV and BESS, are comparedComparison with traditional optimization algorithmsThe system satisfies IEEE Std 1547.4The microgrid is analyzed on technical, economic and ecological basis.The microgrid is analyzed on economic and environmental basis
ObjectivesMinimize the net present and operating costs of the systemMeet the campus load demand and minimize grid dependencyMinimize energy costsMinimize total operating costData driven DR optimizationEnhancing the microgrid reliability and economicsMinimize campus energy consumption costMinimize overall energy cost of the systemGHG emission reductionEnergy cost and GHG emission reduction
ConstraintsBudgetary constraintsPower balance, operational, ramp up/downState of charge and Power constraints of BESSEquality and inequality constraintsSOC constraintsESS constraints
Voltage/System levelLarge office buildingBritish Malaysian InstituteTechnology CenterThree buildings (selected)Three buildings on campus13.8-kVEducation and research12.5 kVFaculty of Technical SciencesUniversity campus
Table 2. Electricity prices.
Time (h)Price ($/kWh)
1:00–18:00Off peak0.098
18:00–22:00Peak0.13
22:00–24:00Off peak0.098
Table 3. Case studies profile.
Components & ParametersCase 1
(Reference Case)
Case 2Case 3Case 4
Grid
PV×
BESS×
EV×××
Power interruptions×××
Table 4. Comparison of electricity cost for each case.
CasesCost ($/Day)Cost Saving (%)LCOE ($/kWh)
1 (Reference case)622.4200.097
2343.6444.800.053
3461.9925.780.072
4 (I)502.1019.330.078
4 (II)338.7245.580.052
Publisher’s Note: MDPI stays neutral with regard to jurisdictional claims in published maps and institutional affiliations.

