
Simple and Sensitive Detection of Bacterial Hydrogen Sulfide Production Using a Paper-Based Colorimetric Assay


1
Department of Biomedical Engineering, College of Medicine, Kyung Hee University, Seoul 02447, Korea
2
Department of Orofacial Pain and Oral Medicine, Kyung Hee University Dental Hospital, Kyung Hee University School of Dentistry, Seoul 02447, Korea
3
Department of Medical Engineering, Kyung Hee University Graduate School, Seoul 02447, Korea
*
Author to whom correspondence should be addressed.
†
These authors contributed equally to this paper.
Sensors 2022, 22(15), 5928; https://doi.org/10.3390/s22155928
Submission received: 8 July 2022
/
Revised: 2 August 2022
/
Accepted: 5 August 2022
/
Published: 8 August 2022
(This article belongs to the Special Issue Paper-Based Biosensing Platforms)
Abstract
:Hydrogen sulfide (H2S) is known to participate in bacteria-induced inflammatory response in periodontal diseases. Therefore, it is necessary to quantify H2S produced by oral bacteria for diagnosis and treatment of oral diseases including halitosis and periodontal disease. In this study, we introduce a paper-based colorimetric assay for detecting bacterial H2S utilizing silver/Nafion/polyvinylpyrrolidone membrane and a 96-well microplate. This H2S-sensing paper showed a good sensitivity (8.27 blue channel intensity/μM H2S, R2 = 0.9996), which was higher than that of lead acetate paper (6.05 blue channel intensity/μM H2S, R2 = 0.9959). We analyzed the difference in H2S concentration released from four kinds of oral bacteria (Eikenella corrodens, Streptococcus sobrinus, Streptococcus mutans, and Lactobacillus casei). Finally, the H2S level in Eikenella corrodens while varying the concentration of cysteine and treatment time was quantified. This paper-based colorimetric assay can be utilized as a simple and effective tool for in vitro screening of H2S-producing ability of many bacteria as well as salivary H2S analysis.
1. Introduction
Hydrogen sulfide (H2S) is the third member of small gaseous transmitters (or gasotransmitters) family, together with nitric oxide and carbon monoxide. The abnormal concentration of H2S may correlate with many diseases including Alzheimer’s disease [1], Parkinson’s disease [2], liver diseases [3], acute pancreatitis [4], and diabetes [5]. Moreover, high concentration of H2S in oral cavity has also been linked to the progression of oral diseases such as halitosis, gingivitis, and periodontitis [6,7,8]. In particular, the increase in H2S level as a result of the accumulation of pathogenic bacteria can facilitate periodontal diseases such as gingivitis and periodontitis [8], which have been known to be associated with anaerobic and proteolytic bacterial metabolism [9,10,11]. Oral malodor is mainly due to putrefactive actions of oral bacteria producing volatile sulfur compounds (VSC)—including H2S, methyl mercaptan, and dimethyl sulfide—on endogenous or exogenous proteins and peptides [9]. Therefore, it is necessary to quantify H2S produced by oral bacteria for the diagnosis and treatment of oral diseases.
Conventional methods for detection of bacterial H2S include gas chromatography [12] and spectrophotometric analysis based on methylene blue (MB) assay [11] or bismuth sulfide (BS) assay [13]. Although gas chromatography-based analysis was highly sensitive with a limit of detection (LOD) of 1.6 ng/mL [12], it needed special instrument and complicated sample pretreatment. In addition, MB and BS assays had a main drawback of a relatively low sensitivity. Basic et al. [11] reported that the visual detection limit for H2S was 0.6 mM for the BS assay and 2 mM for the MB assay. In addition, Zhu and Chu [14] suggested a simple visual method to detect H2S in bacteria using a modified version of BS precipitation that used 96-well plates. However, its sensitivity was low with 0.2 mM of visual detection limit. Lead acetate paper strip, which reacts with H2S to produce a brown lead sulfide, has been utilized to monitor H2S production in bacteria [15,16]. Although lead acetate paper is simple, easy to use, and cost-effective, it needs to use a toxic chemical.
Paper-based analytical devices (PADs) have received great attention for point-of-care applications including clinical analysis, food safety, and environmental assessment to improve human health [17,18,19]. According to the World Health Organization (WHO), low-cost sensors for use in developing countries must fulfill the “ASSURED” criteria which stands for Affordable, Sensitive, Specific, User-friendly, Rapid and robust, Equipment-free, and Delivered to end-users [19,20]. Among them, user-acceptance such as UED determine the commercial potential of the devices [20]. The main advantages of PADs are affordability, portability, and disposability. In addition, they can be designed with sufficient sensitivity and specificity for field use [20], thus can satisfying the “ASSURED” criteria. Our previous report has shown that a paper-based colorimetric assay utilizing silver/Nafion™/polyvinylpyrrolidone (Ag/Nafion/PVP) membranes could quantify endogenous H2S released from living cancer cells [21]. This paper assay, fabricated with a 96-well microplate type, possessed good sensitivity, high selectivity, and good stability, as well as excellent reproducibility. Moreover, we successfully detected H2S from 3D-culture, live cancer cells using a H2S sensing paper with 4 circles which was modified to fit the paper-integrated analytical device [22].
In this study, we analyzed bacterial H2S production from four kinds of oral bacteria including Eikenella corrodens (E. corrodens), Streptococcus sobrinus (S. sobrinus), Streptococcus mutans (S. mutans), and Lactobacillus casei (L. casei) that could be cultured under aerobic condition utilizing an Ag/Nafion/PVP-coated paper. This paper was patterned with 24 multi-zones which were fitted to a diameter of each well in a microplate and spaced apart at regular intervals. The color of Ag/Nafion/PVP on the paper was changed by free H2S gas, because it reacted with Ag ion to form a brownish Ag2S. First, we re-optimized compositions of coating solutions to maximize the color change in the detection zone on the wax-patterned paper. We then compared the analytical performance of this H2S-sensing paper with that of lead acetate paper as a reference. Finally, we measured H2S released from four kinds of oral bacteria. The concentration of H2S in E. corrodens was quantified by varying the concentration of L-cysteine (Cys) and treatment time. The experimental scheme is presented in Figure 1A.
2. Materials and Methods
2.1. Chemicals
PVP (K90), silver nitrate (AgNO3, ≥99.0%), Nafion™ perfluorinated resin solution, sodium sulfide (Na2S), Cys (≥98.0%), L-homocysteine (H-Cys, ≥98.0%), dithiothreitol (DTT), and reduced L-glutathione (GSH) were purchased from Sigma Aldrich (St. Louis, MO, USA). Columbia broth and sheep blood defibrillated were obtained from MB cell (Seoul, Korea). Brain heart infusion (BHI) broth and De Man, Rogosa and Sharpe (MRS) broth were purchased from Difco Lab. Inc. (Detroit, MI, USA). All chemicals and reagents were of an analytical grade. They were used as received without further purification. All aqueous solutions were prepared with de-ionized water (DW) of 18.3 MΩ/cm resistivity.
2.2. Preparation of H2S-Sensing Paper
A paper substrate (width: 126 mm; length: 81 mm; thickness: 0.18 mm in thickness) based on Whatman® filter paper (Grade 1; GE Healthcare Bio-Sciences, Pittsburgh, PA, USA) was designed using AutoCAD. It contained 24 circular detection areas with each of an inner diameter of 7 mm (Figure 1), which was larger circle than that in our previous report [21]. To diminish unwanted error caused by gas diffusion, sensing zones were spaced 9 mm apart. A Xerox ColorQube™ 8570N printer (Fuji Xerox, Tokyo, Japan) was used to pattern hydrophobic wax barriers. The wax-patterned paper was heated in a BF-150C drying oven (DAIHAN Scientific, Seoul, Korea) at 130 °C for 90 s for uniform impregnation of wax. Finally, the paper was pulled from the oven and cooled to room temperature (RT).
The H2S sensing paper was fabricated as described previously [21,23]. Briefly, PVP (5% w/v) solution was mixed with Nafion™ in the ratio of 10:0, 9:1, 6:4, 4:6, and 0:10 (v/v). Then, 30 μL of AgNO3 solution (0.025, 0.05, 0.1, 0.2, and 0.4 M) was added into 1 mL of Nafion™/PVP mixture, respectively, and mixed well using a vortex mixer. After 20 μL of the mixture was dropped on each detection zone in the wax-patterned paper substrate, the paper substrate was dried in a clean room (23.5 ± 1.0 °C, 25.0 ± 5.0% humidity) for at least 3 h.
2.3. Evaluation of Analytical Performance of the H2S-Sensing Paper
A standard solution of Na2S as H2S donor with different concentrations (6.25, 12.5, 25, and 50 μM) was prepared with 100 mM phosphate buffered saline (PBS, pH 7.4). The analytical performance of the H2S sensing paper was evaluated using previously reported procedures [21,24]. Briefly, a 300 μL of Na2S solution with each concentration was added into each well of a microplate which was matched on the detection zone in the paper. In addition, the H2S-sensing paper was placed on the Na2S-loaded microplate and covered with a microplate lid. Figure 1B show photographic images of the paper-based colorimetric assay. H2S gas formed from Na2S was reacted with this paper for 1 h at RT. Considering the two-step dissociation of H2S and equilibrium coefficients (K1 and K2) [25], the actual H2S concentration was converted to about 0.33 times the Na2S concentration. After reaction with H2S for 1 h, the H2S-sensing paper was taken out from the microplate. Color changes in this paper were firstly confirmed with naked eyes and the image was subsequently obtained using an Epson scanner (Perfection V700 Photo flatbed scanner, Seiko Epson, Nagano, Japan). The blue channel intensity of the circular area (4.5 mm in diameter) on each detection zone was measured using ImageJ (National Institutes of Health, Bethesda, MD, USA) [21,22]. All values of the blue channel intensity were displayed as corrected blue channel intensity by subtracting the measured value on the detection zone from the intensity of blank zone in the Ag/Nafion/PVP-coated paper.
To compare the sensing performance of the Ag/Nafion™/PVP-coated H2S-sensing paper with that of a lead acetate paper as a reference, we measured the change in blue channel intensity of the lead acetate paper after reaction with H2S gas. The standard solution of Na2S (300 μL) with the same concentrations ranging from 6.25 to 50 μM was added into each well of a 96-well microplate. The lead acetate paper was also placed on the Na2S-loaded 96-well microplate and covered with a lid. After exposure to H2S for 1 h at RT, the lead acetate paper was analyzed using the same methodology described above.
2.4. Bacterial Strains and Culture Conditions
Four kinds of bacteria including E. corrodens (KCTC15198), S. sobrinus (KCTC5134), S. mutans (KCTC5365), and L. casei (KCTC3109) were purchased from Korea Collection for Type Cultures (KCTC, Jeongeup, Jeollabuk-do, Korea). E. corrodens was grown in a Columbia broth supplemented with 5% sheep blood at 37 °C for 40 h. S. sobinus and S. mutans were grown in BHI broth at 37 °C in a 5% CO2 incubator for 18 h. L. casei was grown in a MRS broth at 37 °C in a 5% CO2 incubator for 18 h. Following incubation, bacteria were centrifuged at 6000× g for 3 min and supernatants were discarded. S. sobrinus, S. mutans, and L. casei pellets were resuspended in PBS to approximately 1 × 10⁸ CFU/mL. For E. corrodens, bacteria were resuspended in 1 mL of DW to lyse blood and re-centrifuged at 3000× g for 3 min twice. The supernatant was discarded and E. corrodens pellet was resuspended in sterilized saline to approximately 1 × 10⁸ CFU/mL.
2.5. Detection of Bacterial H2S Using the H2S-Sensing Paper
Prepared bacterial suspensions (1 × 10⁸ CFU/mL) of four kinds of bacteria were serially diluted to 1 × 101, 1 × 10², 1 × 10⁴, and 1 × 10⁶ CFU/mL. A 300 μL of each bacterial suspension was transferred to a 96-well microplate. The plate was covered with the H2S-sensiing paper and the lid. After incubation at 37 °C for 6 and 24 h, respectively, the H2S-sensing paper was analyzed using the methodology described above. In addition, 20 mM Cys was added into each bacterial suspension of four kinds of bacteria (1 × 10⁸ CFU/mL). A 300 μL of each bacterial suspension with Cys was transferred to a 96-well microplate. After incubation at 37 °C for 1 h, the H2S-sensing paper was analyzed using the same method.
Next, to investigate the effect of Cys on bacterial H2S production in E. corrodens, bacterial suspensions (1 × 10⁸ CFU/mL) were treated with various concentrations of Cys (0, 5, 10, and 20 mM). Then 300 μL of each bacterial suspension with Cys was loaded into each well and reacted for 1.5 h. After 10 mM Cys was added to E. corrodens, they were incubated for 0.5, 1, 1.5, and 2 h, respectively. Color changes in H2S-sensing paper were measured using a scanner and ImageJ.
3. Results
3.1. Fabrication of H2S-Sensing Paper
PADs provide several advantages, including low manufacturing cost, simplicity, portability, small sample volume, and ease of handling, making them attractive for use in many applications including clinical diagnostics and food safety analysis [17]. In addition, a white paper is a good substrate for colorimetric detection because it gives strong contrast with a color, allowing results to be assessed directly by naked eyes [26]. To apply paper as an analytical tool for the detection of bacterial H2S, we designed a multi-zone patterned form that was easily fitted to each well in the microplate. Next, we introduced an Ag/Nafion/PVP membrane to 24 detection zones on the paper. Although we optimized the mixing ratio of PVP and Nafion, as well as the concentration of AgNO3 in our previous report [21], we re-optimized compositions of the Ag/Nafion/PVP solution in the paper substrate because the diameter of detection zone changed from 4 to 7 mm. First, we measured the blue channel intensity of the H2S-sensing paper according to the mixing ratio of PVP/Nafion at a fixed concentration (0.05 M) of AgNO3. As shown in Figure 2A, the mixing ratio of PVP and Nafion markedly affected the blue channel intensity of the H2S-sensing paper. In particular, a 9:1 ratio of PVP and Nafion showed the greatest color change in the paper after reaction with 50 µM Na2S. As previously reported [21], this result might be due to the fact that a small volume of Nafion in the mixture could disperse the Ag ion homogeneously and give an excellent colorimetric response. However, the more Nafion in the coating solution, the better the invasion into the hydrophobic wall, subsequently causing a weak color change. Therefore, we selected a 9:1 ratio of PVP and Nafion for the H2S-sensing paper. Next, we optimized the concentration of AgNO3 to have the maximum color change in the H2S-sensing paper. Figure 2B indicates the change in the blue channel intensity of coating membrane according to the concentration of AgNO3. Based on the maximum color change in the detection zone, we selected the optimal concentration of AgNO3 in the PVP/Nafion (9:1) coating solution as 0.05 M. In addition, it was concordant with that in our previous report [21].
3.2. Analytical Performance of H2S-Sensing Paper
We evaluated the analytical performance of our H2S-sensing paper. Color changes in coating membranes in detection zones on the paper were analyzed after reaction with various concentrations of Na2S solution to each well in the microplate for 1 h at RT. As shown in Figure 3A, the calibration curve showed a good linearity over the concentration range of 2.05 to 16.4 μM for H2S (slope: 8.27 blue channel intensity/μM H2S, R2 = 0.9996). The LOD was 0.96 μM H2S (n = 4), based on the standard deviation of the blank (sbl) and the slope of the calibration curve (3 sbl/slope) [27]. In addition, the limit of quantification (LOQ) was found to be 3.20 μM H2S (n = 4), based on 10 sbl/slope.
To evaluate the feasibility of the H2S-sensing paper, we compared the analytical performance of our paper assay with that of the lead acetate paper as a reference. Lead acetate test paper has been utilized to detect H2S gas produced by microorganisms and for evaluating the quality of water and food [15,28]. Lead acetate forms a brown lead sulfide after reaction with H2S gas, resulting in a color change to brown. As shown in Figure 3A, the change in blue channel intensity of lead acetate paper also showed a linear relationship with H2S concentration ranging from 2.05 to 16.4 μM (R2 = 0.9959). However, its sensitivity (6.05 blue color intensity/μM H2S) was lower than that of our H2S-sensing paper (8.27 blue channel intensity/μM Na2S) in the same concentration range of H2S. The LOD and LOQ of the lead acetate paper were found to be 1.31 and 4.25 μM H2S (n = 4), respectively, which were 1.4 times higher than those of our H2S-sensing paper.
To examine the sensitivity of our H2S-sensing paper at 37 °C, we analyzed the change in blue color intensity after adding Na2S in the concentration range from 6.25 to 50 μM. As shown in Figure 3B, the sensitivity of this paper at 37 °C (slope: 9.61 blue channel intensity/μM H2S, R2 = 0.9947) was higher than that at RT. The LOD and LOQ were 0.23 μM (n = 4) and 0.70 μM H2S (n = 4), respectively. This difference in sensitivity might be attributed to the faster gas diffusion at 37 °C. Therefore, we used the calibration plot of the H2S-sensing paper at 37 °C to quantify the H2S level from bacteria.
To examine the specificity of H2S-sensing paper, we compared the change in blue channel intensity of this paper by Na2S (50 μM) with that by biologically-relevant sulfur-containing molecules (10 mM) including DTT, GSH, Cys, and H-Cys at RT and 37 °C. As shown in Figure 3C, only H2S gas from Na2S caused a great change in blue channel intensity. Therefore, this H2S-sensing paper detects only H2S gas and is not affected by other biological sulfur-containing molecules in the solution.
We also investigated the reproducibility of this H2S-sensing paper by evaluating changes in blue channel intensity to H2S in papers (n = 8) fabricated at different time points. As a result, the relative standard deviation was 2.86%, showing that H2S sensing papers were highly reproducible.
3.3. Detection of Bacterial H2S Production Using H2S-Sensing Paper
As oral bacteria can be biomarkers that distinguish healthy from pathological conditions within the oral cavity, oral microbiota research has potential application to develop a diagnostic and prognostic tool for human health [29]. In particular, Cys activity of oral bacteria which release H2S by Cys substrate can be used to check an individual’s tendency to produce oral malodor [30]. The most active oral bacteria that produce H2S from Cys are Peptostreptococcus spp., Eubacterium spp., Selenomonas spp., Centipeda spp., Bacteroides spp., and Fusobacterium spp. [31]. Basic et al. [11] have reported that Fusobacterium spp. have the most rapid and the highest production of H2S using both colorimetric methods such as BS and MB assays. However, some bacteria strains including E. corrodens and Tannerella forsythia known to produce H2S did not induce color changes with these two methods. This discrepancy might be attributed to the low sensitivity of the two colorimetric methods.
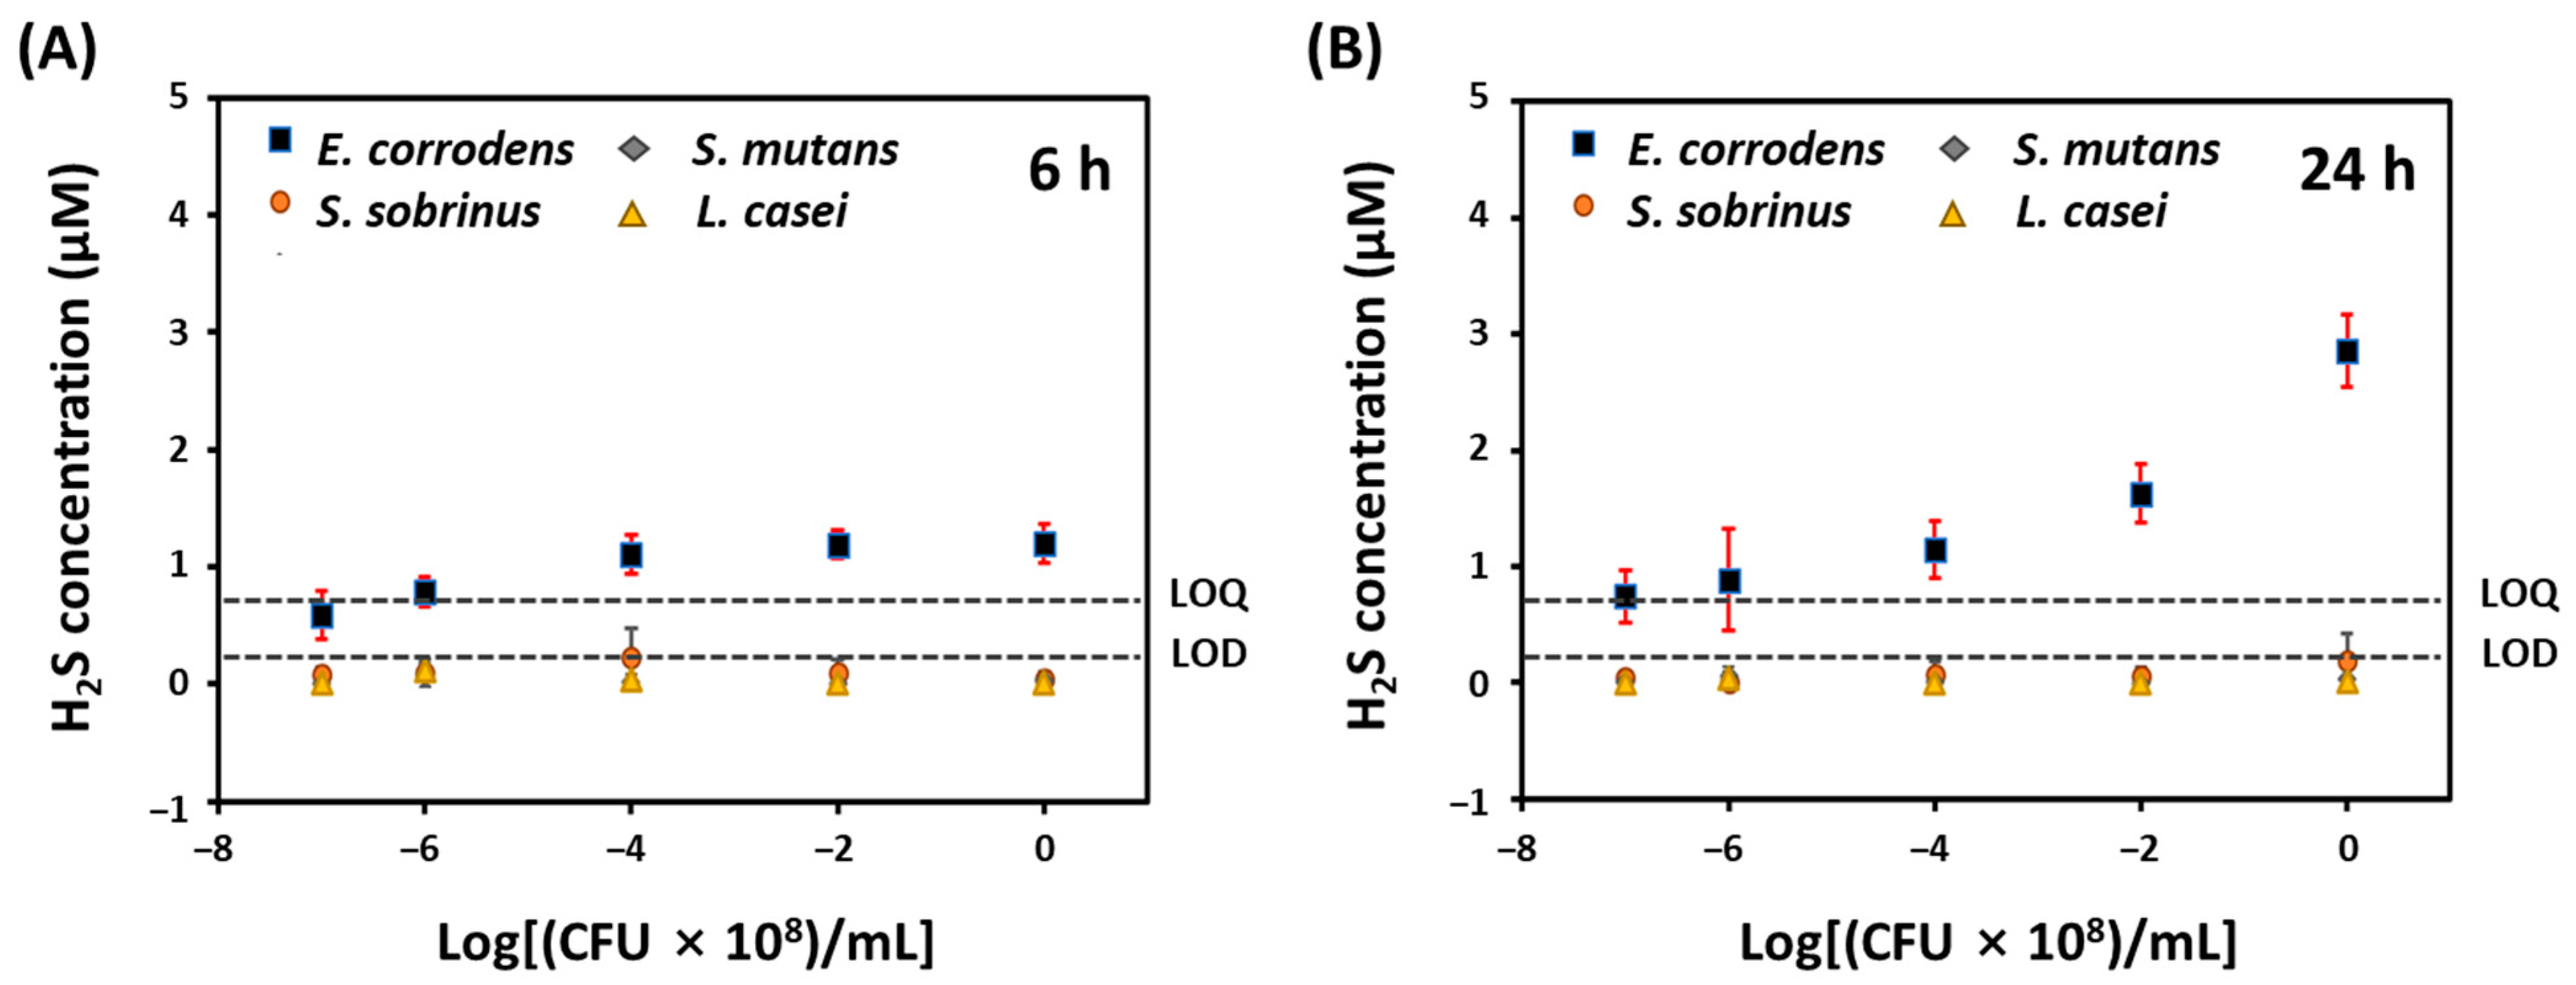
To evaluate the effectiveness of this H2S-sensing paper, we measured endogenous H2S levels in four kinds of bacteria (E. corrodens, S. sobrinus, S. mutans, and L. casei) without any treatment. Figure 4A,B show concentrations of endogenous H2S released from four kinds of bacteria according to the number of bacteria (1 × 101, 1 × 10², 1 × 10⁴, 1 × 10⁶, and 1 × 10⁸ CFU/mL) after 6 and 24 h incubation, respectively, at 37 °C. E. corrodens produced a little more H2S than S. sobrinus, S. mutans, and L. casei after 6 h incubation. However, the H2S concentration produced by E. corrodens was similar even bacteria number increased from 1 × 10⁴ to 1 × 10⁸ CFU/mL (Figure 4A). However, as shown in Figure 4B, the change in blue channel intensity of H2S-sensing paper by E. corrodens after 24 h of incubation increased as bacteria number increased from 1 × 10² to 1 × 10⁸ CFU/mL. As a result, the H2S concentration in 1 × 10⁸ CFU/mL of E. corrodens was 2.86 ± 0.31 μM based on the slope of calibration plot at 37 °C. On contrary, S. sobrinus, S. mutan, and L. casei did not produce H2S or they released very low levels of H2S below the LOD even after 24 h of incubation.
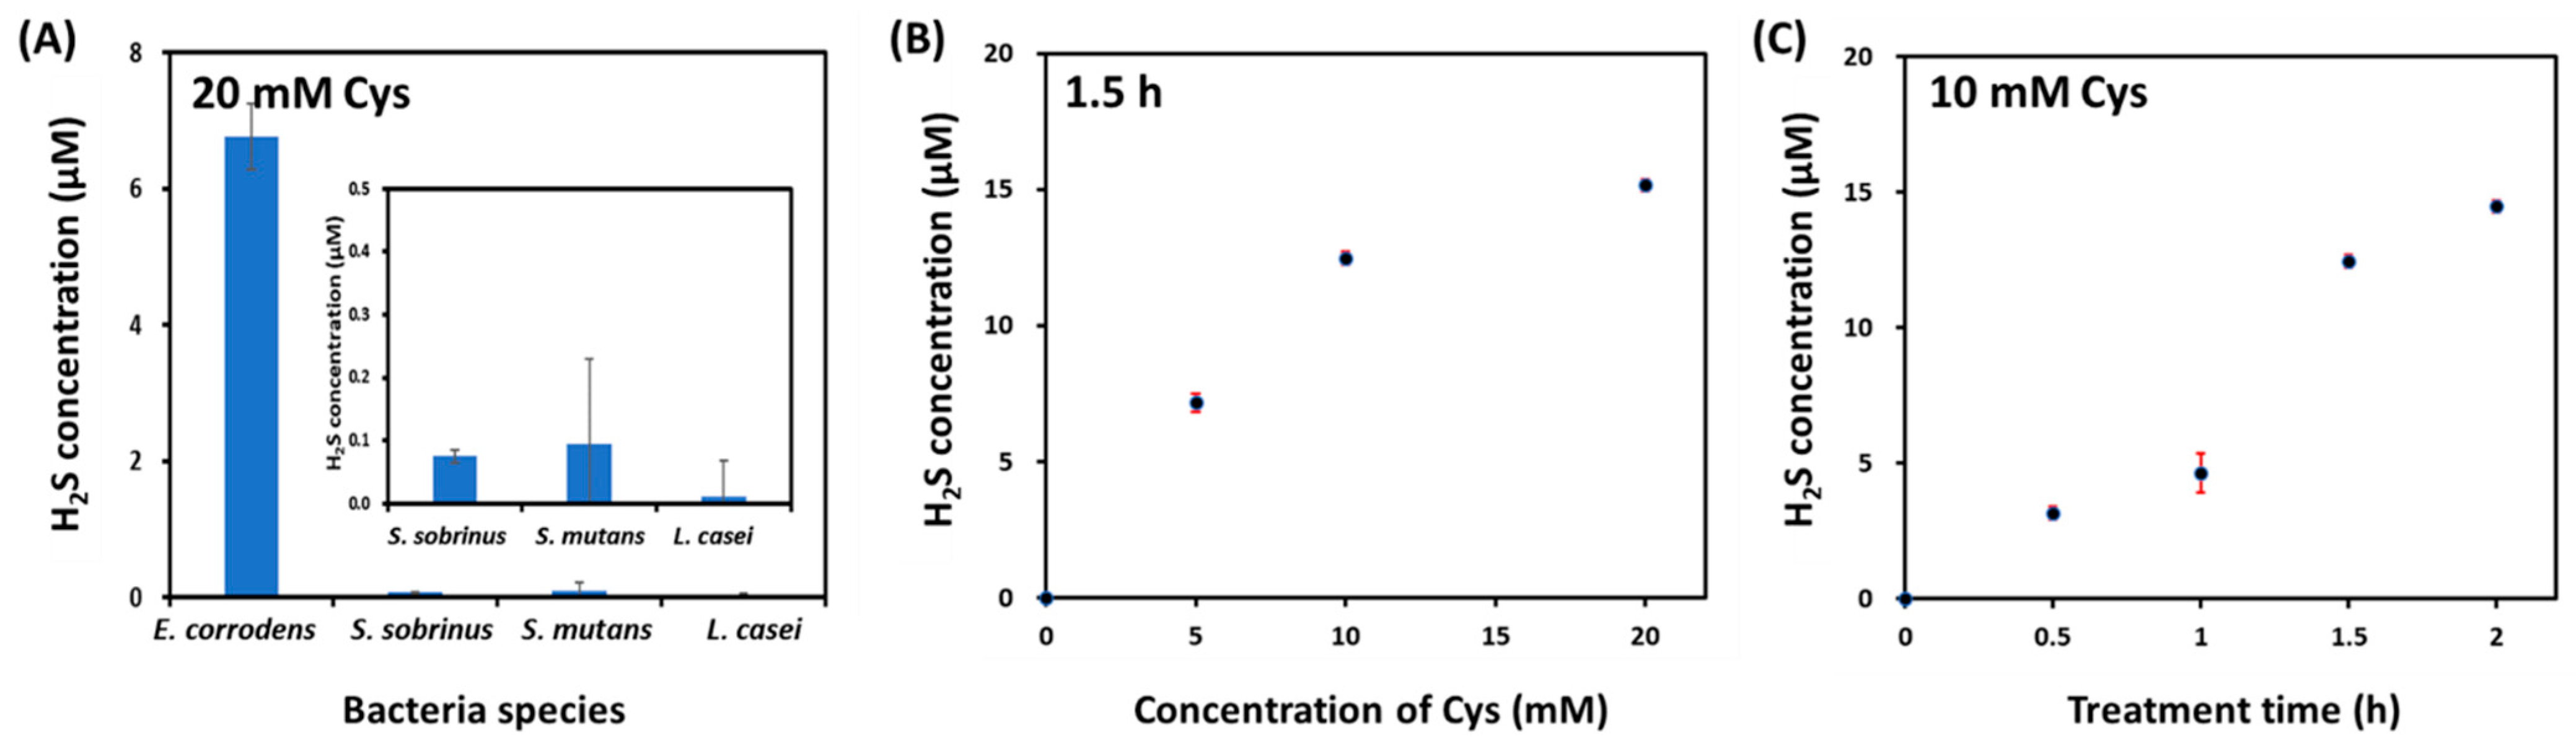
Next, to confirm the difference in H2S production between bacteria, we measured H2S concentrations in four kinds of bacteria (1 × 10⁸ CFU/mL) after treatment with 20 mM Cys as a substrate for H2S production for 1 h. Cys challenge test is commonly used to check H2S production capacity of the mouth. It is based on the fact that oral bacteria act on Cys substrate and release H2S in the oral cavity [30]. Cys-induced H2S concentration largely depends on the Cys activity of oral microbiota as well as Cys concentration [32,33]. As shown in Figure 5A, E. corrodens produced more H2S (6.76 ± 0.48 μM) after treatment with 20 mM Cys. However, S. sobinus, S. mutans, and L. casei did not produce H2S even after treatment with Cys. As a result, only E. corrodens produced H2S without or with treatment with Cys. To quantify the H2S produced in E. corrodens after incubation with Cys, we measured H2S levels in E. corrodens (1 × 10⁸ CFU/mL) according to the concentration of Cys (0, 5, 10, and 20 mM) and treatment time (0.5, 1, 1.5, and 2 h), respectively. As shown in Figure 5B, the production of H2S in E. corrodens increased as the Cys concentration increased at a constant treatment time of 1.5 h (7.16 ± 0.34 μM at 5 mM Cys, 12.46 ± 0.23 μM at 10 mM Cys, and 15.17 ± 0.22 μM at 20 mM Cys). E. corrodens also produced H2S in a time-dependent manner when it was incubated with 10 mM Cys (3.16 ± 0.23 μM at 0.5 h, 4.65 ± 0.72 μM at 1 h, 12.46 ± 0.23 μM at 1.5 h, and 14.48 ± 0.23 μM at 2 h) (Figure 5C). In particular, H2S production from E. corrodens could be analyzed quantitatively even after treatment with 10 mM Cys for only 0.5 h without an additional complex process. E. corrodens is among bacteria frequently isolated from subgingival pockets of patients with severe periodontitis [34]. From our results, we can infer that E. corrodens might be a member of pathogens for halitosis or bad oral breath associated with periodontitis or gingivitis.
4. Conclusions
We introduced a simple and sensitive colorimetric detection of bacterial H2S using Ag/Nafion/PVP coated paper and a 96-well microplate. This H2S-sensing paper showed good sensitivity, selectivity, and reproducibility. In particular, its sensitivity was 1.4 times higher than that of lead acetate paper as a reference. We successfully measured the difference in H2S production from different kinds of bacteria. Our Ag/Nafion/PVP coated H2S sensing paper exhibits some distinct advantages as follows: (1) it is easy to fabricate with a desired form; (2) it can easily and rapidly detect free H2S gas released from bacteria without needing a complex process, expensive instrument, or an additional time for H2S analysis; (3) it can sensitively and selectively detect H2S without needing toxic reagents such as lead acetate; (4) it can achieve the simple and high-throughput detection of H2S from bacteria. Therefore, our Ag/Nafion/PVP coated H2S-seisng paper can be utilized as a simple and an effective tool for detecting H2S from bacteria present in the saliva or oral cavity. Moreover, it can be applied for in vitro screening of H2S-producing ability of many bacteria in human body. Moreover, in the clinical field, it can be used as an auxiliary diagnostic tool with objective measurement of odor in patients with subjective halitosis and for screening oral and systemic diseases related to the increase in H2S level. Although our paper-based assay can partially meet the user acceptance for successful commercialization, we think that it is necessary to further improve the ease of result interpretation, as well as reduce the result readout time for H2S released from bacteria.
Author Contributions
Conceptualization, G.-J.L.; Methodology, B.-K.A., Y.-J.A. and Y.-J.L.; Validation, Y.-H.L. and G.-J.L.; Formal analysis, B.-K.A. and Y.-J.A.; Investigation, Y.-J.A., Y.-J.L., Y.-H.L. and G.-J.L.; Writing—original draft preparation, B.-K.A. and G.-J.L.; Writing—review and editing, Y.-H.L. and G.-J.L.; Visualization, Y.-J.A. and G.-J.L.; Supervision, G.-J.L.; Project administration, G.-J.L. Funding acquisition, G.-J.L. All authors have read and agreed to the published version of the manuscript.
Funding
This research was supported by the Korea Medical Device Development Fund grant funded by the Korea government (the Ministry of Science and ICT, the Ministry of Trade, Industry and Energy, the Ministry of Health & Welfare, the Ministry of Food and Drug Safety) [Project Numbers: KMDF_PR_20200901_0023, 1711137928].
Institutional Review Board Statement
Not applicable.
Informed Consent Statement
Not applicable.
Data Availability Statement
The data are available from the corresponding author upon reasonable request.
Conflicts of Interest
The authors declare no conflict of interest.
References
- Giovinazzo, D.; Bursac, B.; Sbodio, J.I.; Nalluru, S.; Vignane, T.; Snowman, A.M.; Albacarys, L.M.; Sedlak, T.W.; Orregrossa, R.; Whiteman, M.; et al. Hydrogen sulfide is neuroprotective in Alzheimer’s disease by sulfhydrating GSK3β and inhibiting Tau hyperphosphorylation. Proc. Natl. Acad. Sci. USA 2021, 118, e2017225118. [Google Scholar] [CrossRef] [PubMed]
- Cao, X.; Cao, L.; Ding, L.; Bian, J.S. A new hope for a devastating disease: Hydrogen sulfide in Parkinson’s disease. Mol. Neurobiol. 2018, 55, 3789–3799. [Google Scholar] [CrossRef] [PubMed]
- Sun, H.J.; Wu, Z.Y.; Nie, X.W.; Wang, X.Y.; Bian, J.S. Implications of hydrogen sulfide in liver pathophysiology: Mechanistic insights and therapeutic potential. J. Adv. Res. 2021, 27, 127–135. [Google Scholar] [CrossRef]
- Bhatia, M.; Wong, F.L.; Fu, D.; Lau, H.Y.; Moochhala, S.M.; Moore, P.K. Role of hydrogen sulfide in acute pancreatitis and associated lung injury. FASEB J. 2005, 19, 623–625. [Google Scholar] [CrossRef] [PubMed]
- Szabo, C. Roles of hydrogen sulfide in the pathogenesis of diabetes mellitus and its complications. Antioxid. Redox Signal. 2012, 17, 68–80. [Google Scholar] [CrossRef] [PubMed]
- Seerangaiyan, K.; van Winkelhoff, A.J.; Harmsen, H.; Rossen, J.; Winkel, E.G. The tongue microbiome in healthy subjects and patients with intra-oral halitosis. J. Breath Res. 2017, 11, 036010. [Google Scholar] [CrossRef]
- Pavolotskaya, A.; McCombs, G.; Darby, M.; Marinak, K.; Dayanand, N.N. Sulcular sulfide monitoring: An indicator of early dental plaque-induced gingival disease. J. Dent. Hyg. 2006, 80, 1–12. [Google Scholar]
- Wu, D.D.; Ngowi, E.E.; Zhai, Y.K.; Wang, Y.Z.; Khan, N.H.; Kombo, A.F.; Khattak, S.; Li, T.; Ji, X.Y. Role of Hydrogen Sulfide in Oral Disease. Oxid. Med. Cell. Longev. 2022, 2022, 1886277. [Google Scholar] [CrossRef]
- Carrero-Ferrer, I.; Molins-Legua, C.; Campíns-Falcó, P. Plasmonic sensor for hydrogen sulphide in saliva: Multisensor platform and bag format. Talanta 2022, 245, 123449. [Google Scholar] [CrossRef]
- Lee, Y.H.; Chung, S.W.; Auh, Q.S.; Hong, S.J.; Lee, Y.A.; Jung, J.; Lee, G.J.; Park, H.J.; Shin, S.I.; Hong, J.Y. Progress in Oral Microbiome Related to Oral and Systemic Diseases: An Update. Diagnostics 2021, 11, 1283. [Google Scholar] [CrossRef]
- Basic, A.; Blomqvist, S.; Carlén, A.; Dahlén, G. Estimation of bacterial hydrogen sulfide production in vitro. J. Oral Microbiol. 2015, 7, 28166. [Google Scholar] [CrossRef] [Green Version]
- Thompson, R.; Perry, J.D.; Stanforth, S.P.; Dean, J.R. Rapid detection of hydrogen sulfide produced by pathogenic bacteria in focused growth media using SHS-MCC-GC-IMS. Microchem. J. 2018, 140, 232–240. [Google Scholar] [CrossRef] [Green Version]
- Yoshida, A.; Yoshimura, M.; Ohara, N.; Yoshimura, S.; Nagashima, S.; Takehara, T.; Nakayamai, K. Hydrogen Sulfide Production from Cysteine and Homocysteine by Periodontal and Oral Bacteria. J. Periodontol. 2009, 80, 1845–1851. [Google Scholar] [CrossRef] [PubMed]
- Zhu, W.; Chu, W. A sensitive visual method for the detection of hydrogen sulfide producing bacteria. J. Vis. Exp. 2022, 184, e64201. [Google Scholar] [CrossRef] [PubMed]
- Shatalin, K.; Shatalina, E.; Mironov, A.; Nudler, E. H2S: A Universal Defense Against Antibiotics in Bacteria. Science 2011, 334, 986–990. [Google Scholar] [CrossRef]
- Xia, Y.; Lü, C.; Hou, N.; Xin, Y.; Liu, J.; Liu, H.; Xun, L. Sulfide production and oxidation by heterotrophic bacteria under aerobic conditions. ISME J. 2017, 11, 2754–2766. [Google Scholar] [CrossRef] [Green Version]
- Jang, H.; Park, J.H.; Oh, J.; Kim, K.; Kim, M.G. Advanced Colorimetric Paper Sensors Using Color Focusing Effect Based on Asymmetric Flow of Fluid. ACS Sens. 2019, 4, 1103–1108. [Google Scholar] [CrossRef]
- Sher, M.; Zhuang, R.; Demirci, U.; Asghara, W. Paper-based analytical devices for clinical diagnosis: Recent advances in the fabrication techniques and sensing mechanisms. Expert Rev. Mol. Diagn. 2017, 17, 351–366. [Google Scholar] [CrossRef]
- Ham, K.N.; Choi, J.S.; Kwon, J. Three-dimensional paper-based slip device for one-step point-of-care testing. Sci. Rep. 2016, 6, 25710. [Google Scholar]
- Nilghaz, A.; Guan, L.; Tan, W.; Shen, W. Advances of Paper-Based Microfluidics for Diagnostics—The Original Motivation and Current Status. ACS Sens. 2016, 1, 1382–1393. [Google Scholar] [CrossRef]
- Lee, J.; Lee, Y.J.; Ahn, Y.J.; Choi, S.; Lee, G.J. A simple and facile paper-based colorimetric assay for detection of free hydrogen sulfide in prostate cancer cells. Sens. Actuator B Chem. 2018, 256, 828–834. [Google Scholar] [CrossRef]
- Kim, J.H.; Lee, Y.J.; Ahn, Y.J.; Kim, M.; Lee, G.J. In Situ Detection of Hydrogen Sulfide in 3D-Cultured, Live Prostate Cancer Cells Using a Paper-Integrated Analytical Device. Chemosensors 2022, 10, 27. [Google Scholar] [CrossRef]
- Ahn, Y.J.; Lee, Y.J.; Lee, J.; Lee, D.; Park, H.K.; Lee, G.J. Colorimetric detection of endogenous hydrogen sulfide production in living cells utilizing silver-embedded polymer membrane. Spectroc. Acta Part A Mol. Biomol. Spectr. 2017, 177, 118–124. [Google Scholar] [CrossRef]
- Ahn, Y.J.; Gil, Y.G.; Lee, Y.J.; Jang, H.; Lee, G.J. A dual-mode colorimetric and SERS detection of hydrogen sulfide in live prostate cancer cells using a silver nanoplate-coated paper assay. Microchem. J. 2020, 155, 104724. [Google Scholar] [CrossRef]
- Nagy, L.; Filotas, D.; Boros, M.; Pozsgai, G.; Pintér, E.; Nagy, G. Amperometric cell for subcutaneous detection of hydrogen sulfide in anesthetized experimental animals. Physiol. Meas. 2014, 35, 2475–2487. [Google Scholar] [CrossRef] [PubMed]
- Ahn, Y.J.; Han, S.H.; Lee, G.J. Rapid and simple colorimetric detection of hydrogen sulfide using an etching-resistant effect on silver nanoprisms. Microchim. Acta 2021, 188, 129. [Google Scholar] [CrossRef] [PubMed]
- Taverniers, I.; De Loose, M.; Van Bockstaele, E. Trends in quality in the analytical laboratory. II. analytical method validation and quality assurance. Trends Anal. Chem. 2004, 23, 535–552. [Google Scholar] [CrossRef]
- Mironov, A.; Seregina, T.; Nagornykh, M.; Luhachack, L.G.; Korolkova, N.; Lopes, L.E.; Kotova, V.; Zavilgelsky, G.; Shakulov, R.; Shatalin, K.; et al. Mechanism of H2S-mediated protection against oxidative stress in Escherichia coli. Proc. Natl. Acad. Sci. USA 2017, 114, 6022–6027. [Google Scholar] [CrossRef] [Green Version]
- Hampelska, K.; Jaworska, M.M.; Babalska, Z.Ł.; Karpiński, T.M. The Role of Oral Microbiota in Intra-Oral Halitosis. J. Clin. Med. 2020, 9, 2484. [Google Scholar] [CrossRef]
- Aydin, M.; Gunay, I. Cysteine challenge test as a novel diagnostic tool to distinguish oral halitosis. Aust. Dent. J. 2022, 67, 69–75. [Google Scholar] [CrossRef]
- Persson, S.; Edlund, M.B.; Claesson, R.; Carlsson, J. The formation of hydrogen sulfide and methyl mercaptan by oral bacteria. Oral Microbiol. Immunol. 1990, 5, 195–201. [Google Scholar] [CrossRef] [PubMed]
- Kleinberg, I.; Codipilly, D.M. Cystein challenge testing: A powerful tool for examining oral malodour processes and treatments in vivo. Int. Dent. J. 2002, 52, 221–228. [Google Scholar] [CrossRef] [PubMed]
- Codipilly, D.; Kleinberg, I. Generation of indole/skatole during malodor formation in the salivary sediment model system and initial examination of the oral bacteria involved. J. Breath Res. 2008, 2, 17017. [Google Scholar] [CrossRef] [PubMed]
- Puig-Silla, M.; Montiel-Company, J.M.; Dasi-Fernandez, F.; Almerich-Silla, J.M. Prevalence of periodontal pathogens as predictor of the evolution of periodontal status. Odontology 2017, 105, 467–476. [Google Scholar] [CrossRef] [PubMed]
Figure 1.
(A) Schematic illustration of the fabrication process of an Ag/Nafion/PVP based H2S-sensing paper and experimental design for colorimetric detection of bacterial H2S; (B) Photographic images of the paper-based colorimetric assay and the H2S-sensing paper after reaction with H2S.
Figure 1.
(A) Schematic illustration of the fabrication process of an Ag/Nafion/PVP based H2S-sensing paper and experimental design for colorimetric detection of bacterial H2S; (B) Photographic images of the paper-based colorimetric assay and the H2S-sensing paper after reaction with H2S.

Figure 2.
Changes in color intensity of the H2S sensing paper after exposure to Na2S (50 μM) according to (A) the mixing ratio of PVP and Nafion; (B) the concentration of AgNO3 concentration in the coating solution.
Figure 2.
Changes in color intensity of the H2S sensing paper after exposure to Na2S (50 μM) according to (A) the mixing ratio of PVP and Nafion; (B) the concentration of AgNO3 concentration in the coating solution.

Figure 3.
(A) Calibration curve of change in blue channel intensity of Ag/Nafion/PVP based H2S-sensing papers and lead acetate papers versus concentration of H2S at room temperature (RT, n = 4, respectively); (B) Calibration plot of Ag/Nafion/PVP based H2S-sensing papers at 37 °C (n = 4); (C) Color change in Ag/Nafion/PVP coated paper after reaction with H2S from Na2S (50 μM) and other sulfur-containing compounds (10 mM) such as dithiothreitol (DTT), reduced L-glutathione (GSH), L-cysteine (Cys), and L-homocysteine (H-Cys) at RT and 37 °C.
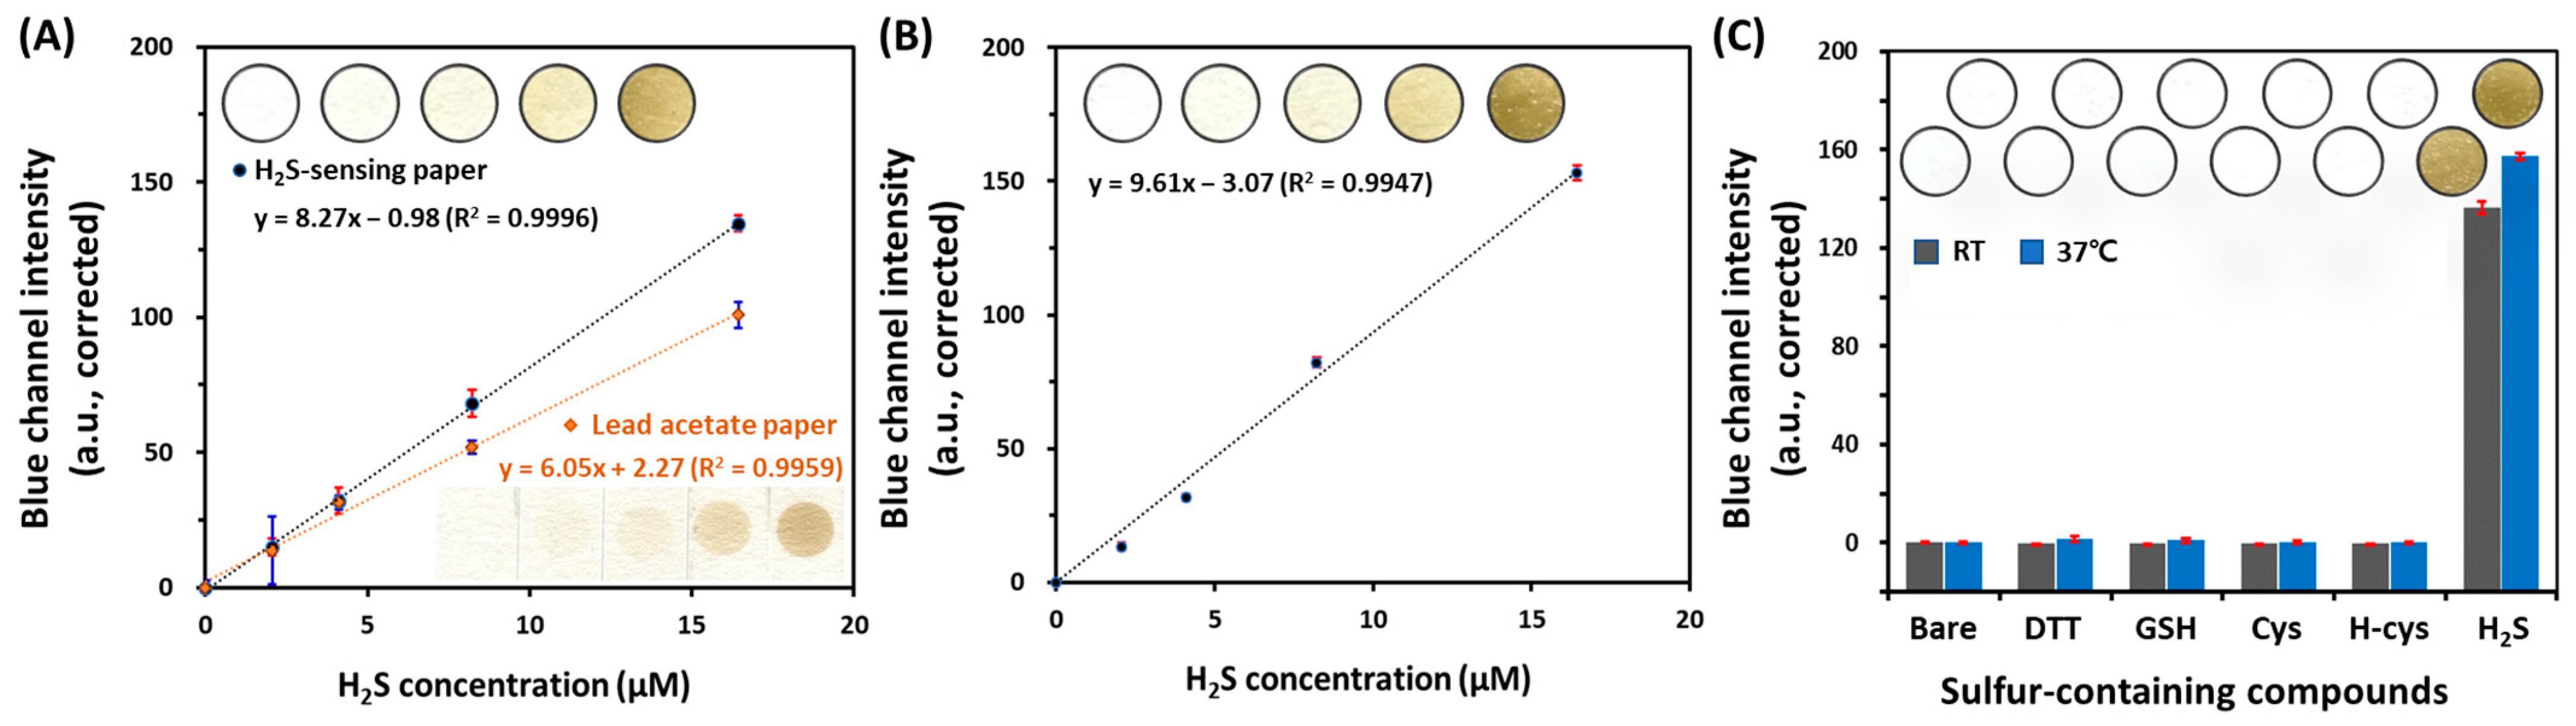
Figure 4.
Quantitative analysis of H2S production from four kinds of oral bacteria such as E. corrodens, S. sobrinus, S. mutans, and L. casei according to the number of bacteria (1 × 101, 1 × 10², 1 × 10⁴, 1 × 10⁶, and 1 × 10⁸ CFU/mL) (A) for 6 h; (B) 24 h incubation at 37 °C.
Figure 4.
Quantitative analysis of H2S production from four kinds of oral bacteria such as E. corrodens, S. sobrinus, S. mutans, and L. casei according to the number of bacteria (1 × 101, 1 × 10², 1 × 10⁴, 1 × 10⁶, and 1 × 10⁸ CFU/mL) (A) for 6 h; (B) 24 h incubation at 37 °C.

Figure 5.
(A) Quantitative analysis of H2S production from four kinds of oral bacteria such as E. corrodens, S. sobrinus, S. mutans, and L. casei (1 × 10⁸ CFU/mL) after treatment with 20 mM Cys for 1 h. Effects of (B) Cys concentration (0, 5, 10, and 10 mM), and (C) treatment time (0, 0.5, 1, 1.5, and 2 h) on H2S production from E. corrodens (1 × 10⁸ CFU/mL) at 37 °C.

Publisher’s Note: MDPI stays neutral with regard to jurisdictional claims in published maps and institutional affiliations. |
© 2022 by the authors. Licensee MDPI, Basel, Switzerland. This article is an open access article distributed under the terms and conditions of the Creative Commons Attribution (CC BY) license (https://creativecommons.org/licenses/by/4.0/).
Share and Cite
MDPI and ACS Style
Ahn, B.-K.; Ahn, Y.-J.; Lee, Y.-J.; Lee, Y.-H.; Lee, G.-J. Simple and Sensitive Detection of Bacterial Hydrogen Sulfide Production Using a Paper-Based Colorimetric Assay. Sensors 2022, 22, 5928. https://doi.org/10.3390/s22155928
AMA Style
Ahn B-K, Ahn Y-J, Lee Y-J, Lee Y-H, Lee G-J. Simple and Sensitive Detection of Bacterial Hydrogen Sulfide Production Using a Paper-Based Colorimetric Assay. Sensors. 2022; 22(15):5928. https://doi.org/10.3390/s22155928
Chicago/Turabian StyleAhn, Byung-Ki, Yong-Jin Ahn, Young-Ju Lee, Yeon-Hee Lee, and Gi-Ja Lee. 2022. "Simple and Sensitive Detection of Bacterial Hydrogen Sulfide Production Using a Paper-Based Colorimetric Assay" Sensors 22, no. 15: 5928. https://doi.org/10.3390/s22155928
Note that from the first issue of 2016, this journal uses article numbers instead of page numbers. See further details here.