
Ultra-High-Sensitivity, Miniaturized Fabry-Perot Interferometric Fiber-Optic Microphone for Weak Acoustic Signals Detection

 ,
,
Abstract
:1. Introduction
2. Sensor Design and Simulation
3. Experimental Sections and Results Analysis
3.1. Experimental Setup
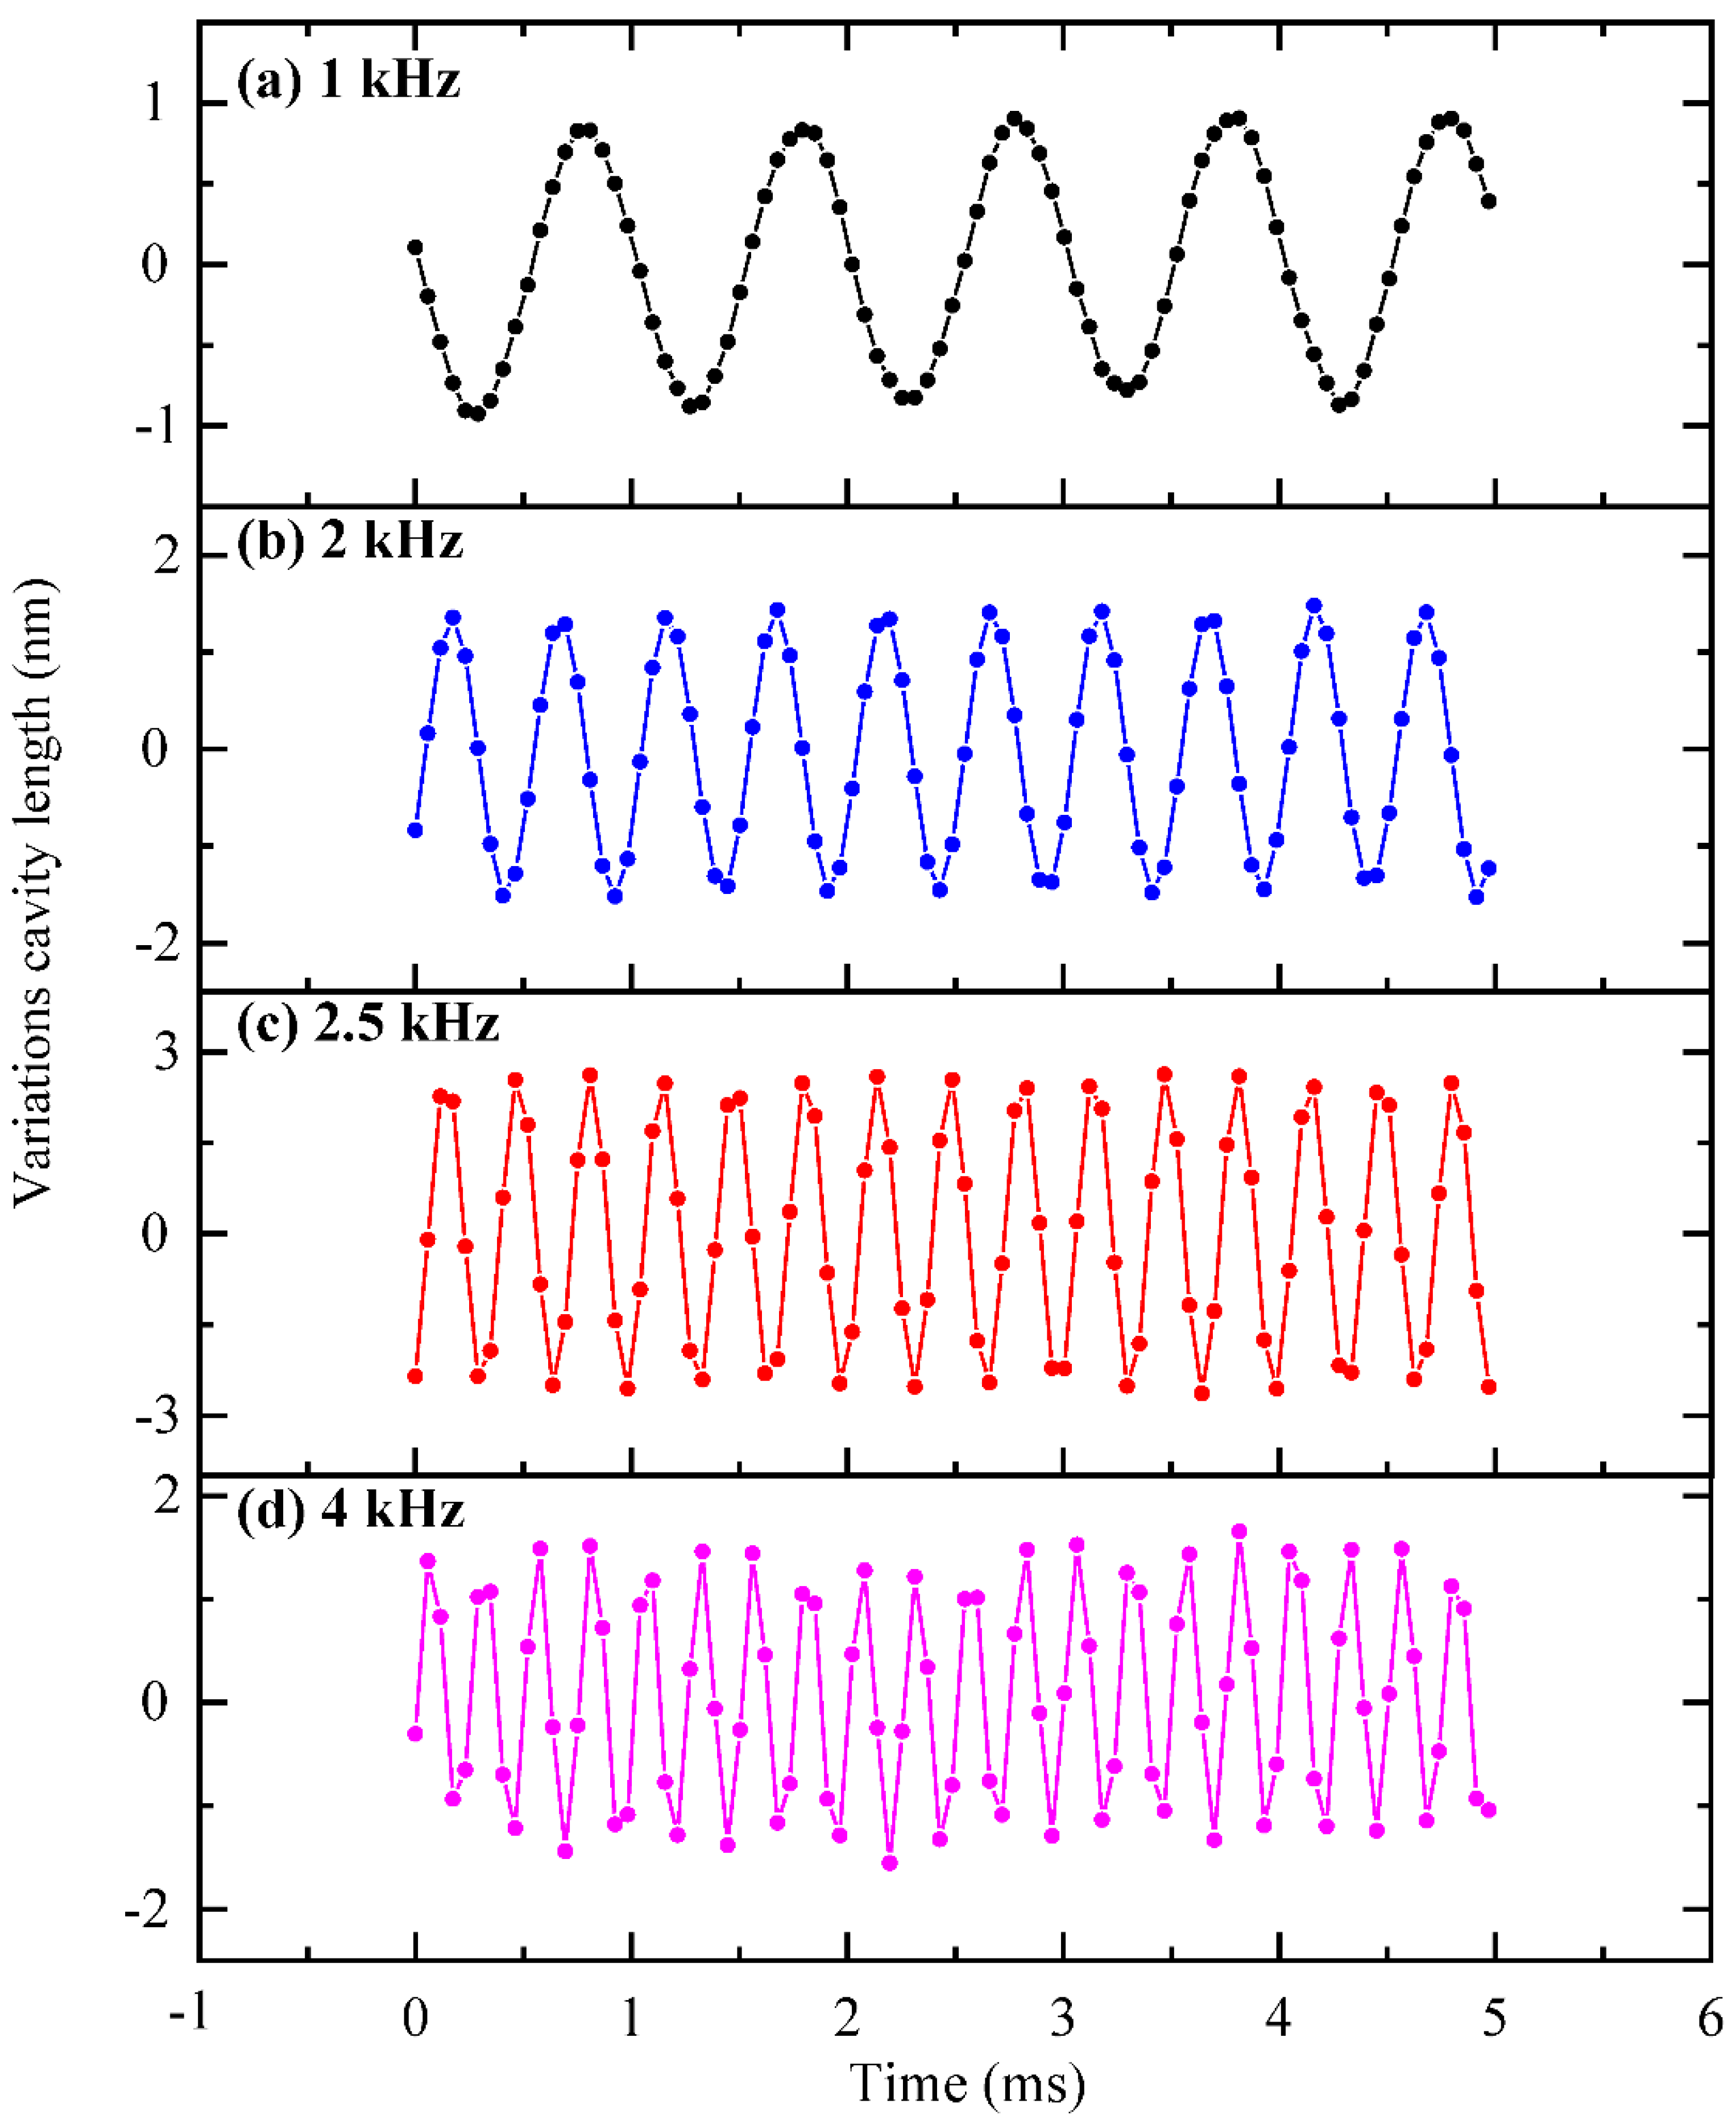
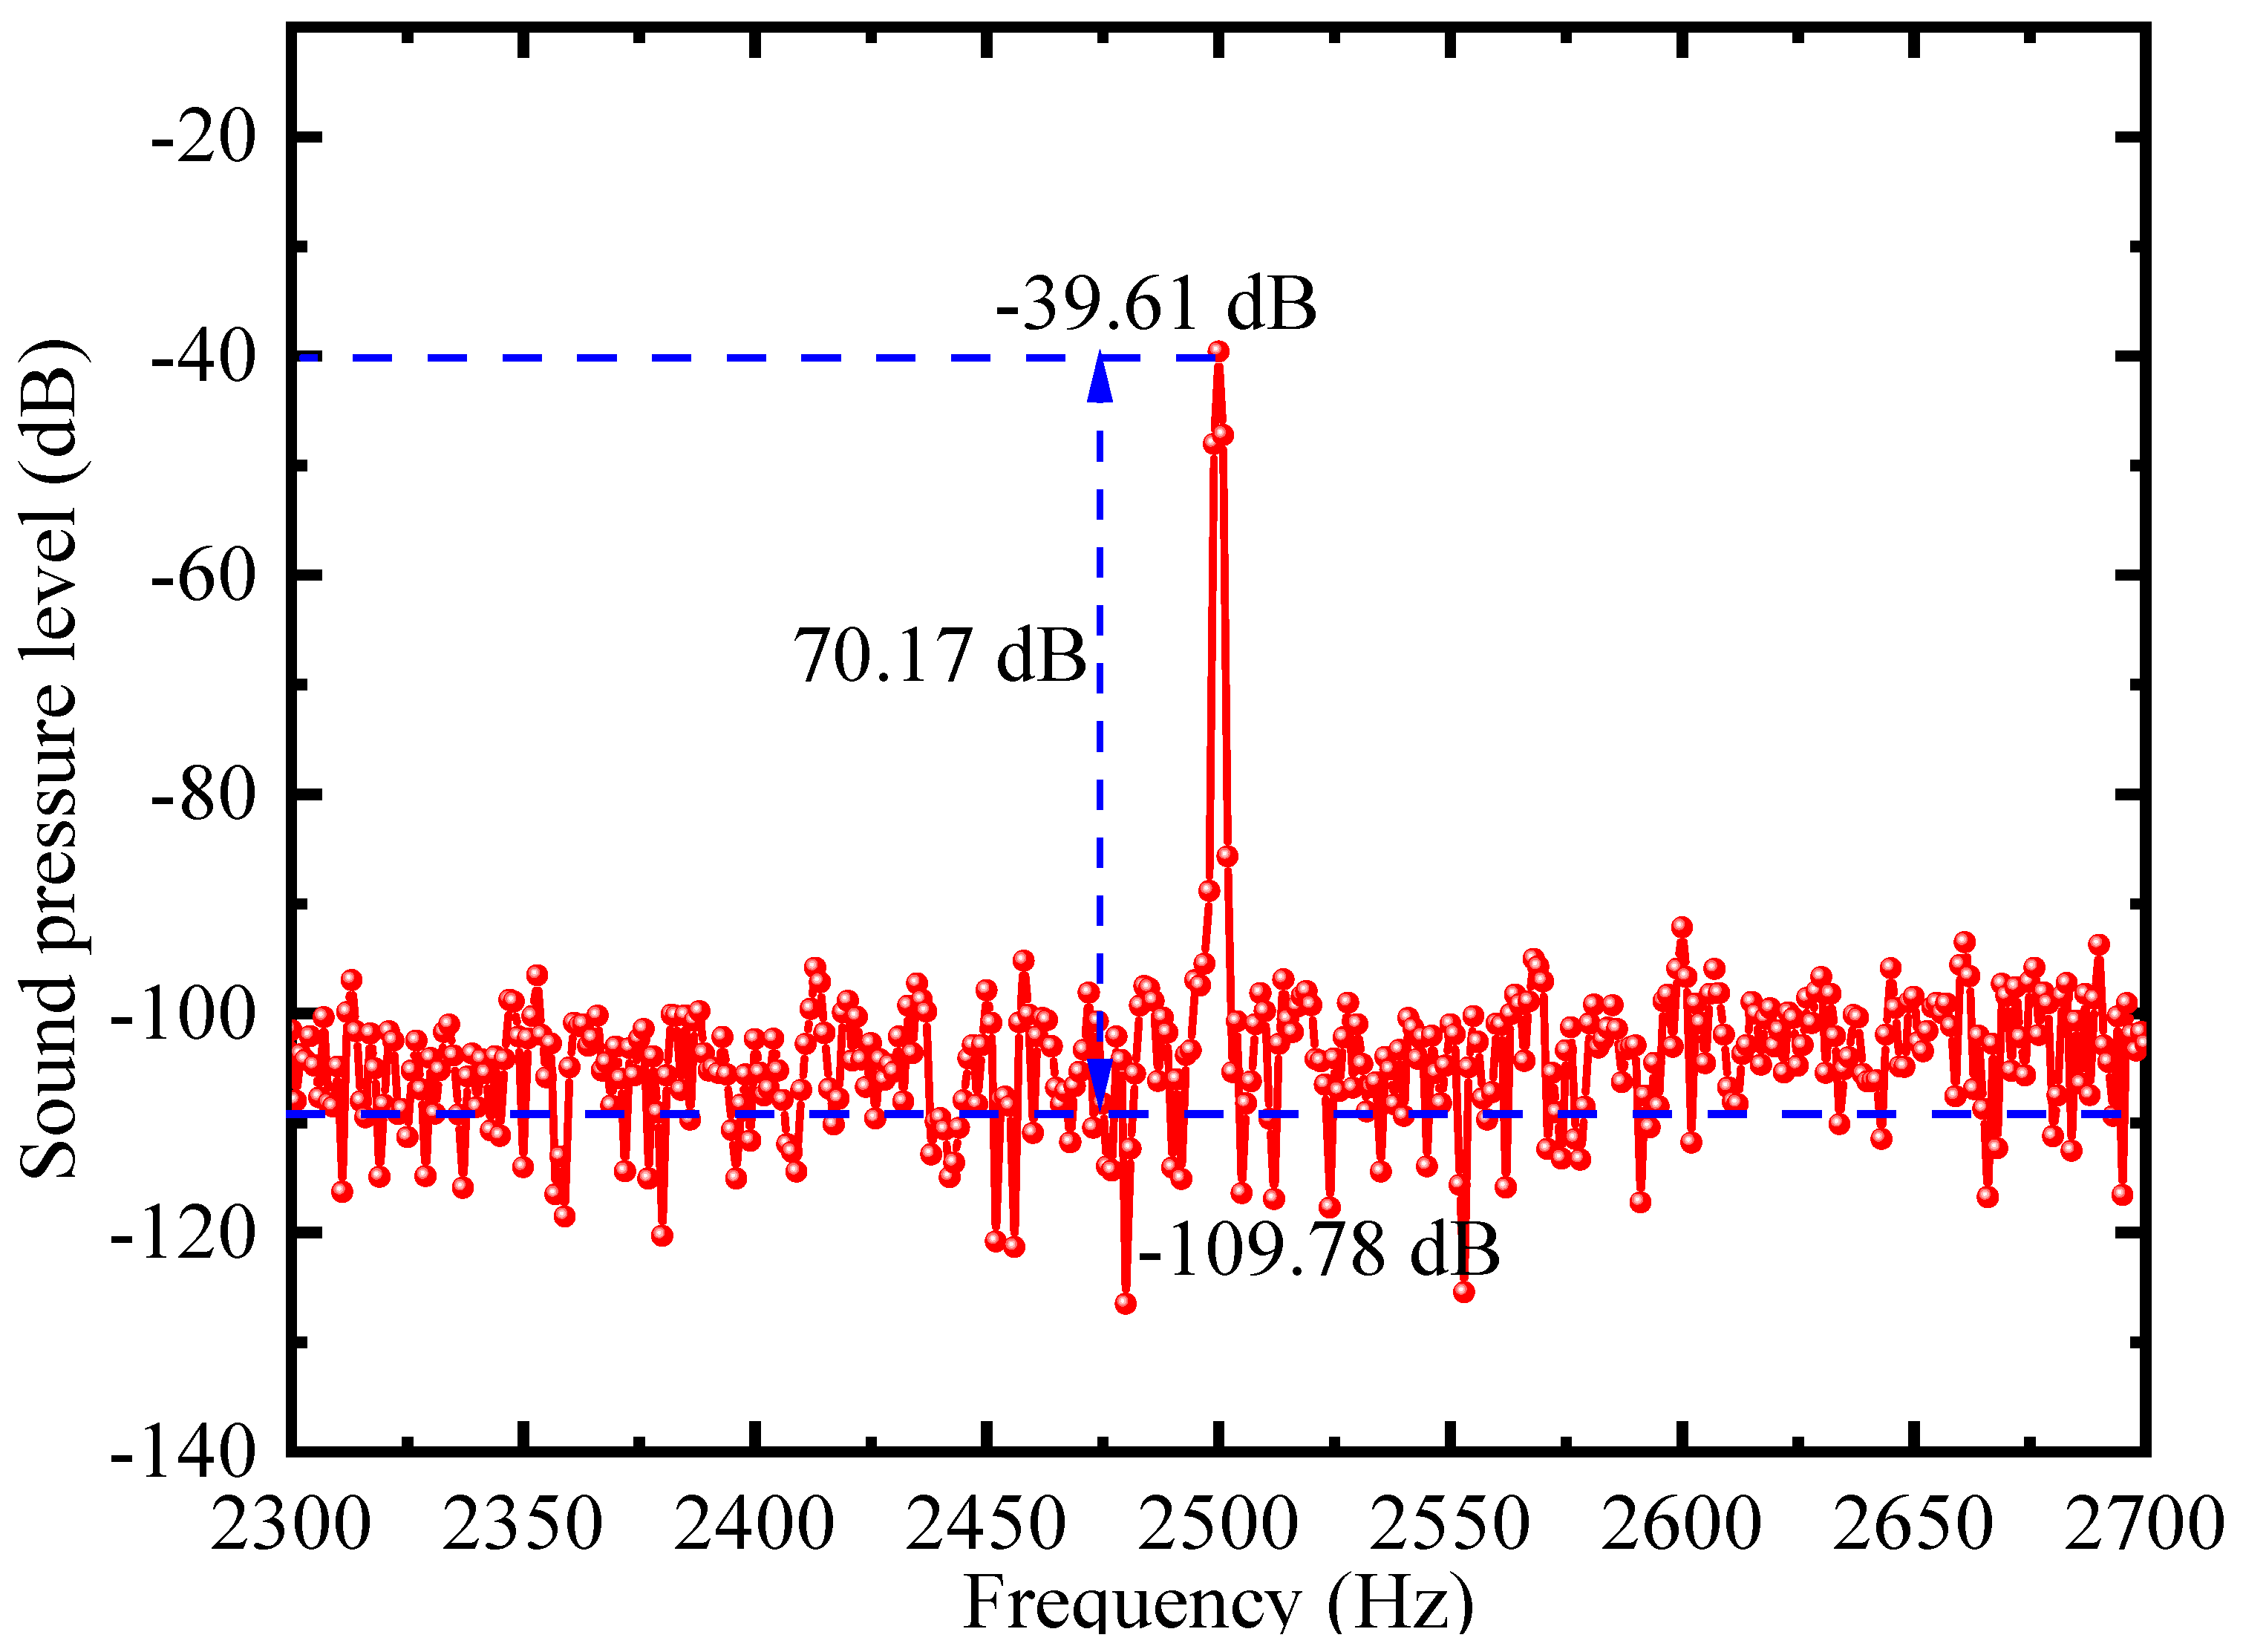
3.2. Experimental Results Analysis
4. Conclusions
Author Contributions
Funding
Institutional Review Board Statement
Informed Consent Statement
Data Availability Statement
Conflicts of Interest
Abbreviations
| PAS | photoacoustic spectroscopy |
| FOM | fiber-optic microphone |
| MZI | Mach-Zehnder interferometer |
| MI | Michelson interferometer |
| FPI | Fabry-Perot interferometric |
| MDP | minimum detectable pressure |
| SNR | signal-to-noise ratio |
| WLI | white light interference |
| SLD | super luminescent diode |
| DAQ | data acquisition |
| Young’s modulus (Gpa) | |
| standard atmospheric pressure (Pa) | |
| wavelength of the light source (nm) | |
| the static cavity length (μm) | |
| the dynamic cavity length variation (μm) |
References
- Wang, Y.; Yuan, H.; Liu, X.; Bai, Q.; Zhang, H.; Gao, Y.; Jin, B. A Comprehensive Study of Optical Fiber Acoustic Sensing. IEEE Access 2019, 7, 85821–85837. [Google Scholar] [CrossRef]
- Zhu, J.; Ren, L.; Ho, S.-C.; Jia, Z.; Song, G. Gas pipeline leakage detection based on PZT sensors. Smart Mater. Struct. 2017, 26, 025022. [Google Scholar] [CrossRef]
- Cao, Y.; Jin, W.; Ho, H.L.; Ma, J. Miniature fiber-tip photoacoustic spectrometer for trace gas detection. Opt. Lett. 2013, 38, 434–436. [Google Scholar] [CrossRef] [PubMed]
- Wu, G.; Gong, Z.; Ma, J.; Li, H.; Guo, M.; Chen, K.; Peng, W.; Yu, Q.; Mei, L. High-sensitivity miniature dual-resonance photoacoustic sensor based on silicon cantilever beam for trace gas sensing. Photoacoustics 2022, 27, 100386. [Google Scholar] [CrossRef]
- Gong, Z.; Wu, G.; Chen, K.; Guo, M.; Ma, J.; Li, H.; Ma, F.; Mei, L.; Peng, W.; Yu, Q. Fiber-tip gas transducer based on all-optical photoacoustic spectroscopy. J. Lightwave Technol. 2022, 40, 5300–5306. [Google Scholar] [CrossRef]
- Wu, G.; Gong, Z.; Li, H.; Ma, J.; Chen, K.; Peng, W.; Yu, Q.; Mei, L. High-Sensitivity Multitrace Gas Simultaneous Detection Based on an All-Optical Miniaturized Photoacoustic Sensor. Anal. Chem. 2022. [Google Scholar] [CrossRef]
- Xu, F.; Shi, J.; Gong, K.; Li, H.; Hui, R.; Yu, B. Fiber-optic acoustic pressure sensor based on large-area nanolayer silver diaghragm. Opt. Lett. 2014, 39, 2838–2840. [Google Scholar] [CrossRef]
- Liu, B.; Zhou, H.; Liu, L.; Wang, X.; Shan, M.; Jin, P.; Zhong, Z. An optical fiber Fabry-Perot microphone based on corrugated silver diaphragm. IEEE Trans. Instrum. Meas. 2018, 67, 1994–2000. [Google Scholar] [CrossRef]
- Gong, Z.; Chen, K.; Yang, Y.; Zhou, X.; Peng, W.; Yu, Q. High-sensitivity fiber-optic acoustic sensor for photoacoustic spectroscopy based traces gas detection. Sens. Actuatator B 2017, 247, 290–295. [Google Scholar] [CrossRef]
- Guo, M.; Chen, K.; Yang, B.; Li, C.; Zhang, B.; Yang, Y.; Wang, Y.; Li, C.; Gong, Z.; Ma, F. Ultrahigh Sensitivity Fiber-Optic Fabry–Perot Interferometric Acoustic Sensor Based on Silicon Cantilever. IEEE Trans. Instrum. Meas. 2021, 70, 1–8. [Google Scholar] [CrossRef]
- Pawar, D.; Rao, C.N.; Choubey, R.K.; Kale, S. Mach-Zehnder interferometric photonic crystal fiber for low acoustic frequency detections. Appl. Phys. Lett. 2016, 108, 041912. [Google Scholar] [CrossRef]
- Wang, J.; Peng, H.; Zhou, P.; Guo, J.; Jia, B.; Wu, H. Sound source localization based on Michelson fiber optic interferometer array. Opt. Fiber Technol. 2019, 51, 112–117. [Google Scholar] [CrossRef]
- Jia, J.; Jiang, Y.; Zhang, L.; Gao, H.; Jiang, L. Fiber optic dual-ring michelson interferometer-based detection scheme for the measurement of dynamic signals. J. Lightwave Technol. 2019, 37, 3750–3755. [Google Scholar] [CrossRef]
- Fan, P.; Yan, W.; Lu, P.; Zhang, W.; Zhang, W.; Fu, X.; Zhang, J. High sensitivity fiber-optic Michelson interferometric low-frequency acoustic sensor based on a gold diaphragm. Opt. Express 2020, 28, 25238–25249. [Google Scholar] [CrossRef] [PubMed]
- Wu, Y.; Yu, C.; Wu, F.; Li, C.; Zhou, J.; Gong, Y.; Rao, Y.; Chen, Y. A highly sensitive fiber-optic microphone based on graphene oxide membrane. J. Lighwave Technol. 2017, 35, 4344–4349. [Google Scholar] [CrossRef]
- Chen, K.; Yang, B.; Guo, M.; Deng, H.; Zhang, B.; Liu, S.; Li, C.; An, R.; Peng, W.; Yu, Q. Fiber-optic photoacoustic gas sensor with temperature self-compensation. Opt. Lett. 2020, 45, 2458–2461. [Google Scholar] [CrossRef] [PubMed]
- Kirkendall, C.K.; Dandridge, A. Overview of high performance fibre-optic sensing. J. Phys. D Appl. Phys. 2004, 37, R197. [Google Scholar] [CrossRef]
- Qi, X.; Wang, S.; Jiang, J.; Liu, K.; Zhang, P.; Li, Z.; Liu, T. Study on the Sensitization Effect of Flywheel-Like Diaphragm on Fiber-Optic Fabry-Perot Acoustic Sensor. IEEE Access 2020, 8, 99286–99293. [Google Scholar] [CrossRef]
- Liu, B.; Lin, J.; Liu, H.; Jin, A.; Jin, P. Extrinsic Fabry-Perot fiber acoustic pressure sensor based on large-area silver diaphragm. Microelectron. Eng. 2016, 166, 50–54. [Google Scholar] [CrossRef]
- Guo, F.; Fink, T.; Han, M.; Koester, L.; Turner, J.; Huang, J. High-sensitivity, high-frequency extrinsic Fabry-Perot interferometric fiber-tip sensor based on a thin silver diaphragm. Opt. Lett. 2012, 37, 1505–1507. [Google Scholar] [CrossRef] [Green Version]
- Li, H.; Wang, X.; Li, D.; Lv, J.; Yu, Y. MEMS-on-fiber sensor combining silicon diaphragm and supporting beams for on-line partial discharges monitoring. Opt. Express 2020, 28, 29368–29376. [Google Scholar] [CrossRef] [PubMed]
- Wang, W.; Wu, N.; Tian, Y.; Niezrecki, C.; Wang, X. Miniature all-silica optical fiber pressure sensor with an ultrathin uniform diaphragm. Opt. Express 2010, 18, 9006–9014. [Google Scholar] [CrossRef] [PubMed]
- Mao, X.; Yuan, S.; Zheng, P.; Wang, X. Stabilized fiber-optic Fabry-Perot acoustic sensor based on improved wavelength tuning technique. J. Lightwave Technol. 2017, 35, 2311–2314. [Google Scholar] [CrossRef]
- Gong, Z.; Chen, K.; Zhou, X.; Yang, Y.; Zhao, Z.; Zou, H.; Yu, Q. High-sensitivity Fabry-Perot interferometric acoustic sensor for low-frequency acoustic pressure detections. J. Lightwave Technol. 2017, 35, 5276–5279. [Google Scholar] [CrossRef]
- Ni, W.; Lu, P.; Fu, X.; Zhang, W.; Shum, P.P.; Sun, H.; Yang, C.; Liu, D.; Zhang, J. Ultrathin graphene diaphragm-based extrinsic Fabry-Perot interferometer for ultra-wideband fiber optic acoustic sensing. Opt. Express 2018, 26, 20758–20767. [Google Scholar] [CrossRef]
- Ma, J.; Xuan, H.; Ho, H.L.; Jin, W.; Yang, Y.; Fan, S. Fiber-optic Fabry-Pérot acoustic sensor with multilayer graphene diaphragm. IEEE Photonics Technol. Lett. 2013, 25, 932–935. [Google Scholar] [CrossRef]
- Li, C.; Gao, X.; Guo, T.; Xiao, J.; Fan, S.; Jin, W. Analyzing the applicability of miniature ultra-high sensitivity Fabry-Perot acoustic sensor using a nanothick graphene diaphragm. Meas. Sci. Technol. 2015, 26, 085101. [Google Scholar] [CrossRef]
- Yao, M.; Zhang, Y.; Ouyang, X.; Zhang, A.P.; Tam, H.-Y.; Wai, P. Ultracompact optical fiber acoustic sensors based on a fiber-top spirally-suspended optomechanical microresonator. Opt. Lett. 2020, 45, 3516–3519. [Google Scholar] [CrossRef]
- Chen, K.; Yu, Z.; Yu, Q.; Guo, M.; Zhao, Z.; Qu, C.; Gong, Z.; Yang, Y. Fast demodulated white-light interferometry-based fiber-optic Fabry–Perot cantilever microphone. Opt. Lett. 2018, 43, 3417–3420. [Google Scholar] [CrossRef]
- Gong, Z.; Li, H.; Jiang, X.; Wu, G.; Gao, T.; Guo, M.; Ma, F.; Chen, K.; Mei, L.; Peng, W. A Miniature Fiber-Optic Silicon Cantilever-Based Acoustic Sensor Using Ultra-High Speed Spectrum Demodulation. IEEE Sens. J. 2021, 21, 20086–20091. [Google Scholar] [CrossRef]
- Chen, K.; Guo, M.; Liu, S.; Zhang, B.; Deng, H.; Zheng, Y.; Chen, Y.; Luo, C.; Tao, L.; Lou, M. Fiber-optic photoacoustic sensor for remote monitoring of gas micro-leakage. Opt. Express 2019, 27, 4648–4659. [Google Scholar] [CrossRef] [PubMed]
- Chen, K.; Gong, Z.; Guo, M.; Yu, S.; Qu, C.; Zhou, X.; Yu, Q. Fiber-optic Fabry-Perot interferometer based high sensitive cantilever microphone. Sens. Actuatator A 2018, 279, 107–112. [Google Scholar] [CrossRef]
- Jo, W.; Akkaya, O.C.; Solgaard, O.; Digonnet, M.J. Miniature fiber acoustic sensors using a photonic-crystal membrane. Opt. Fiber Technol. 2013, 19, 785–792. [Google Scholar] [CrossRef]


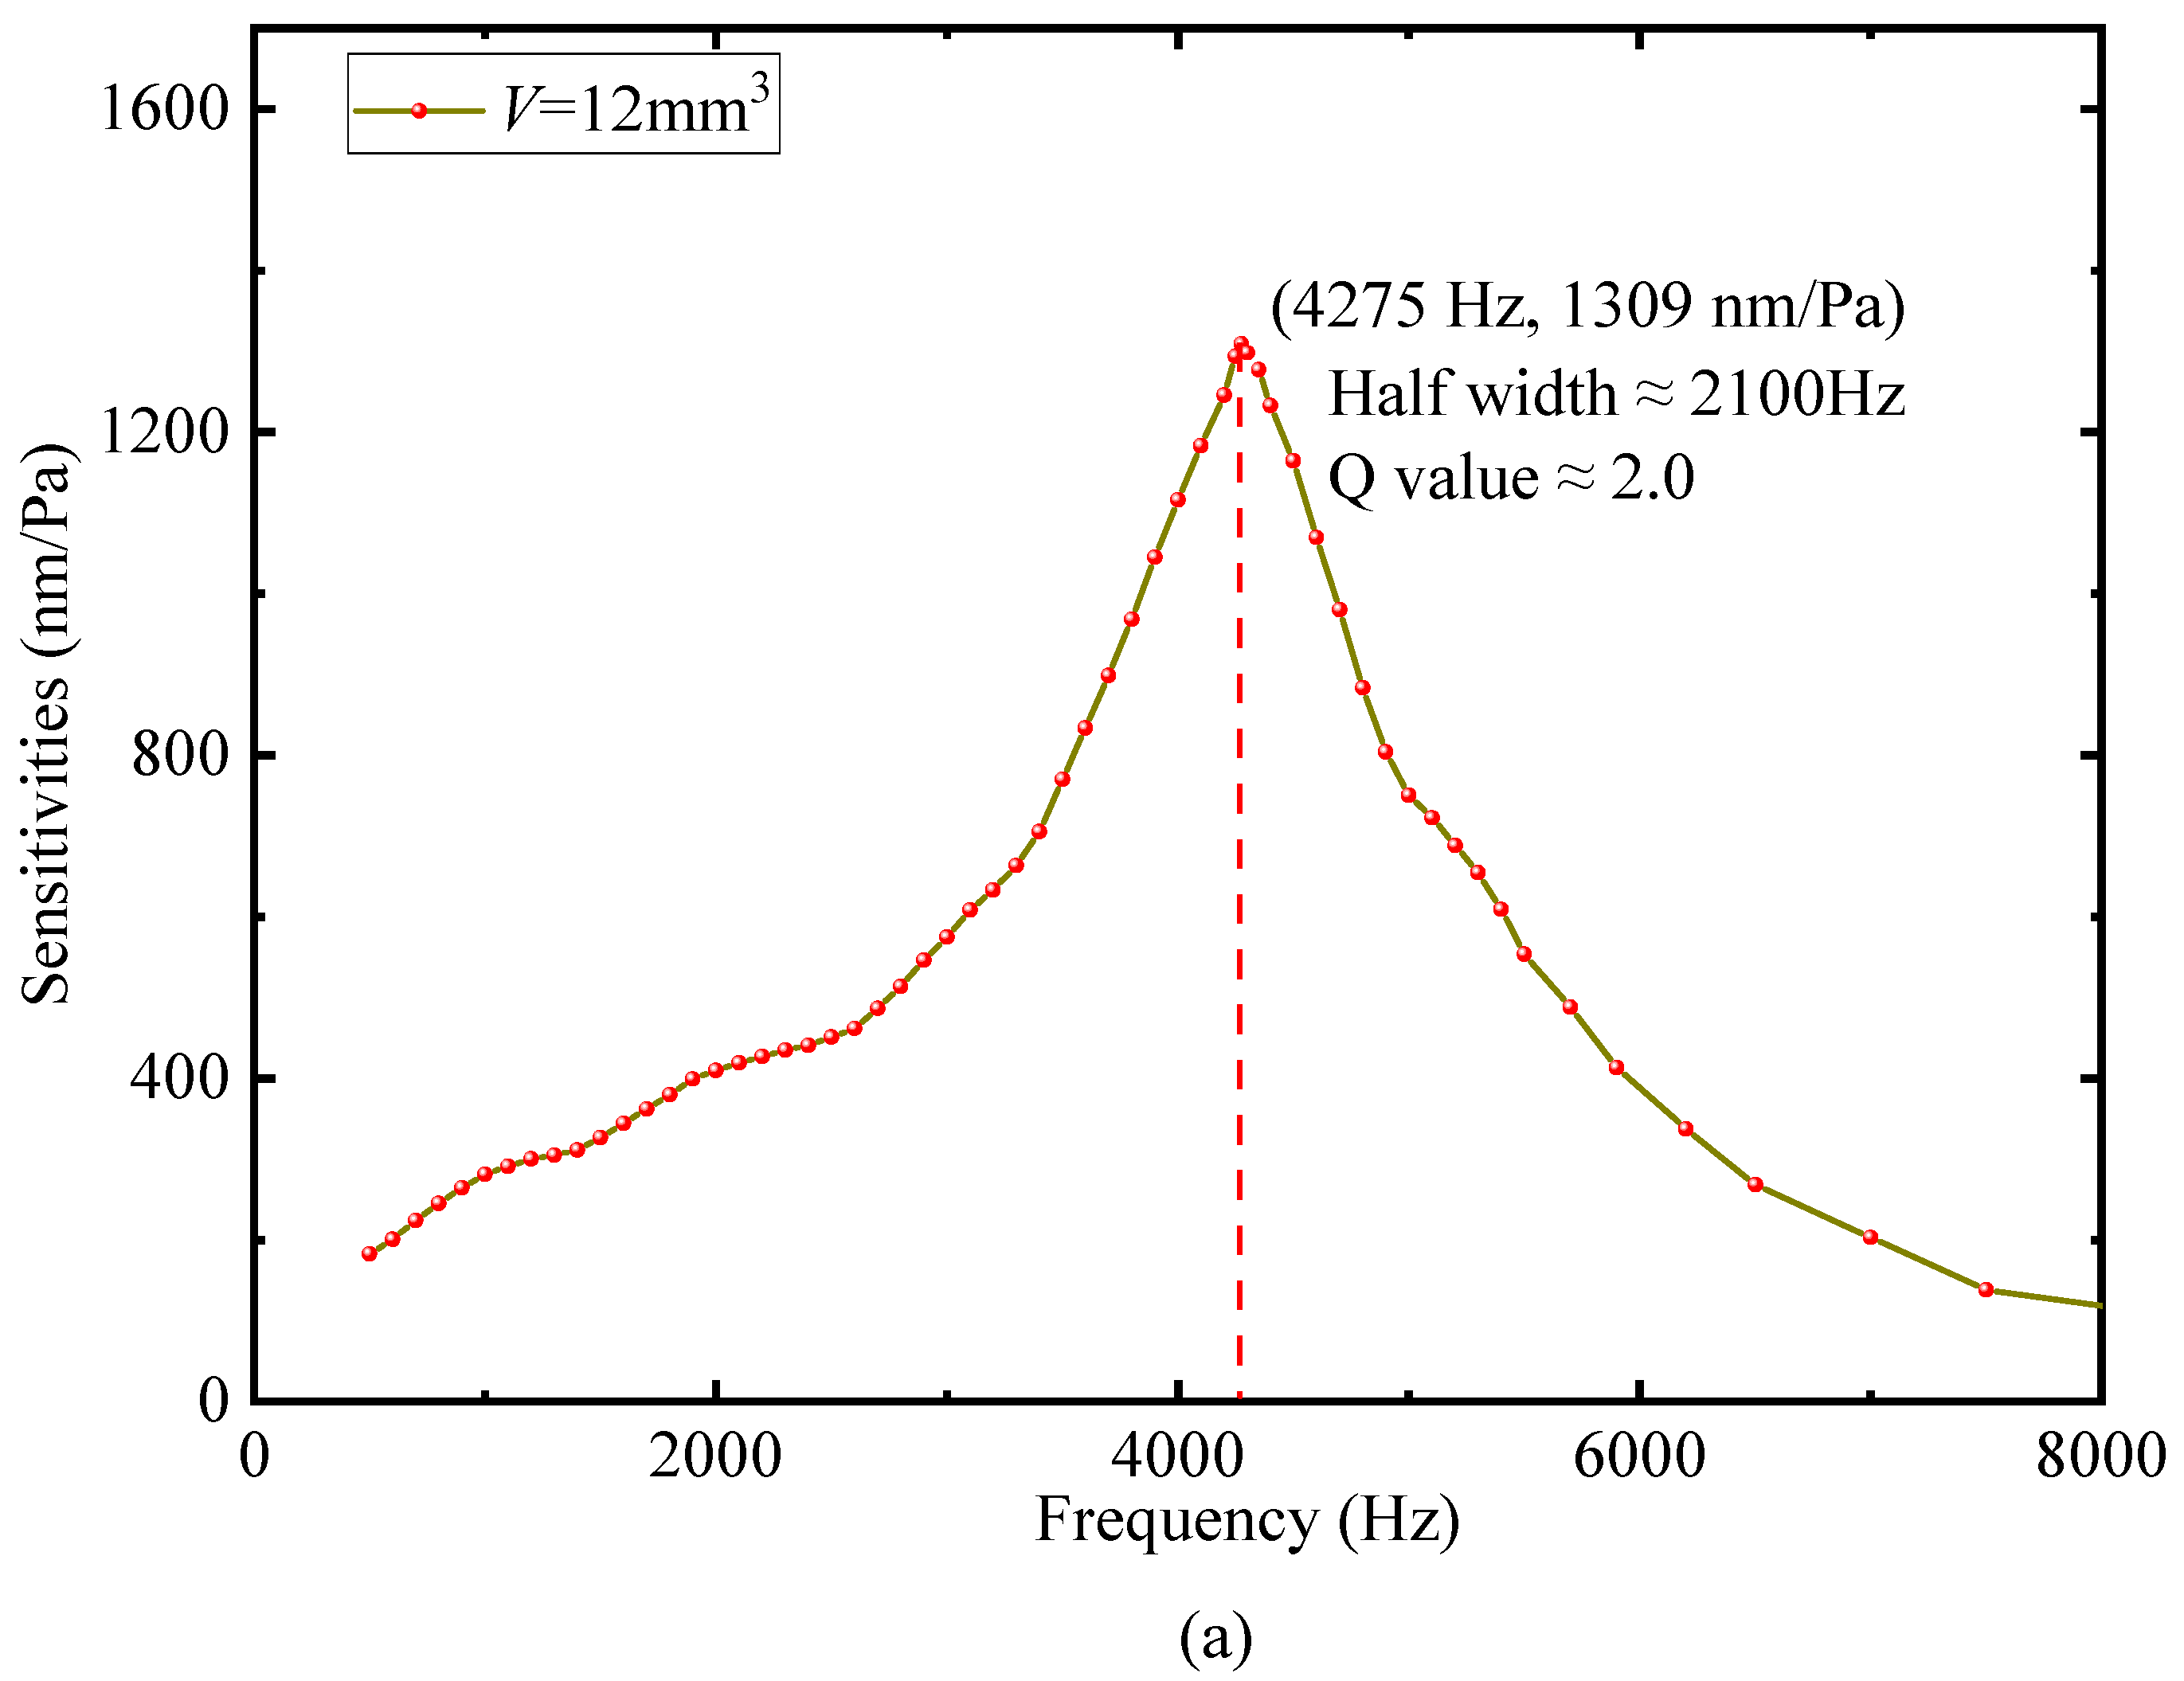
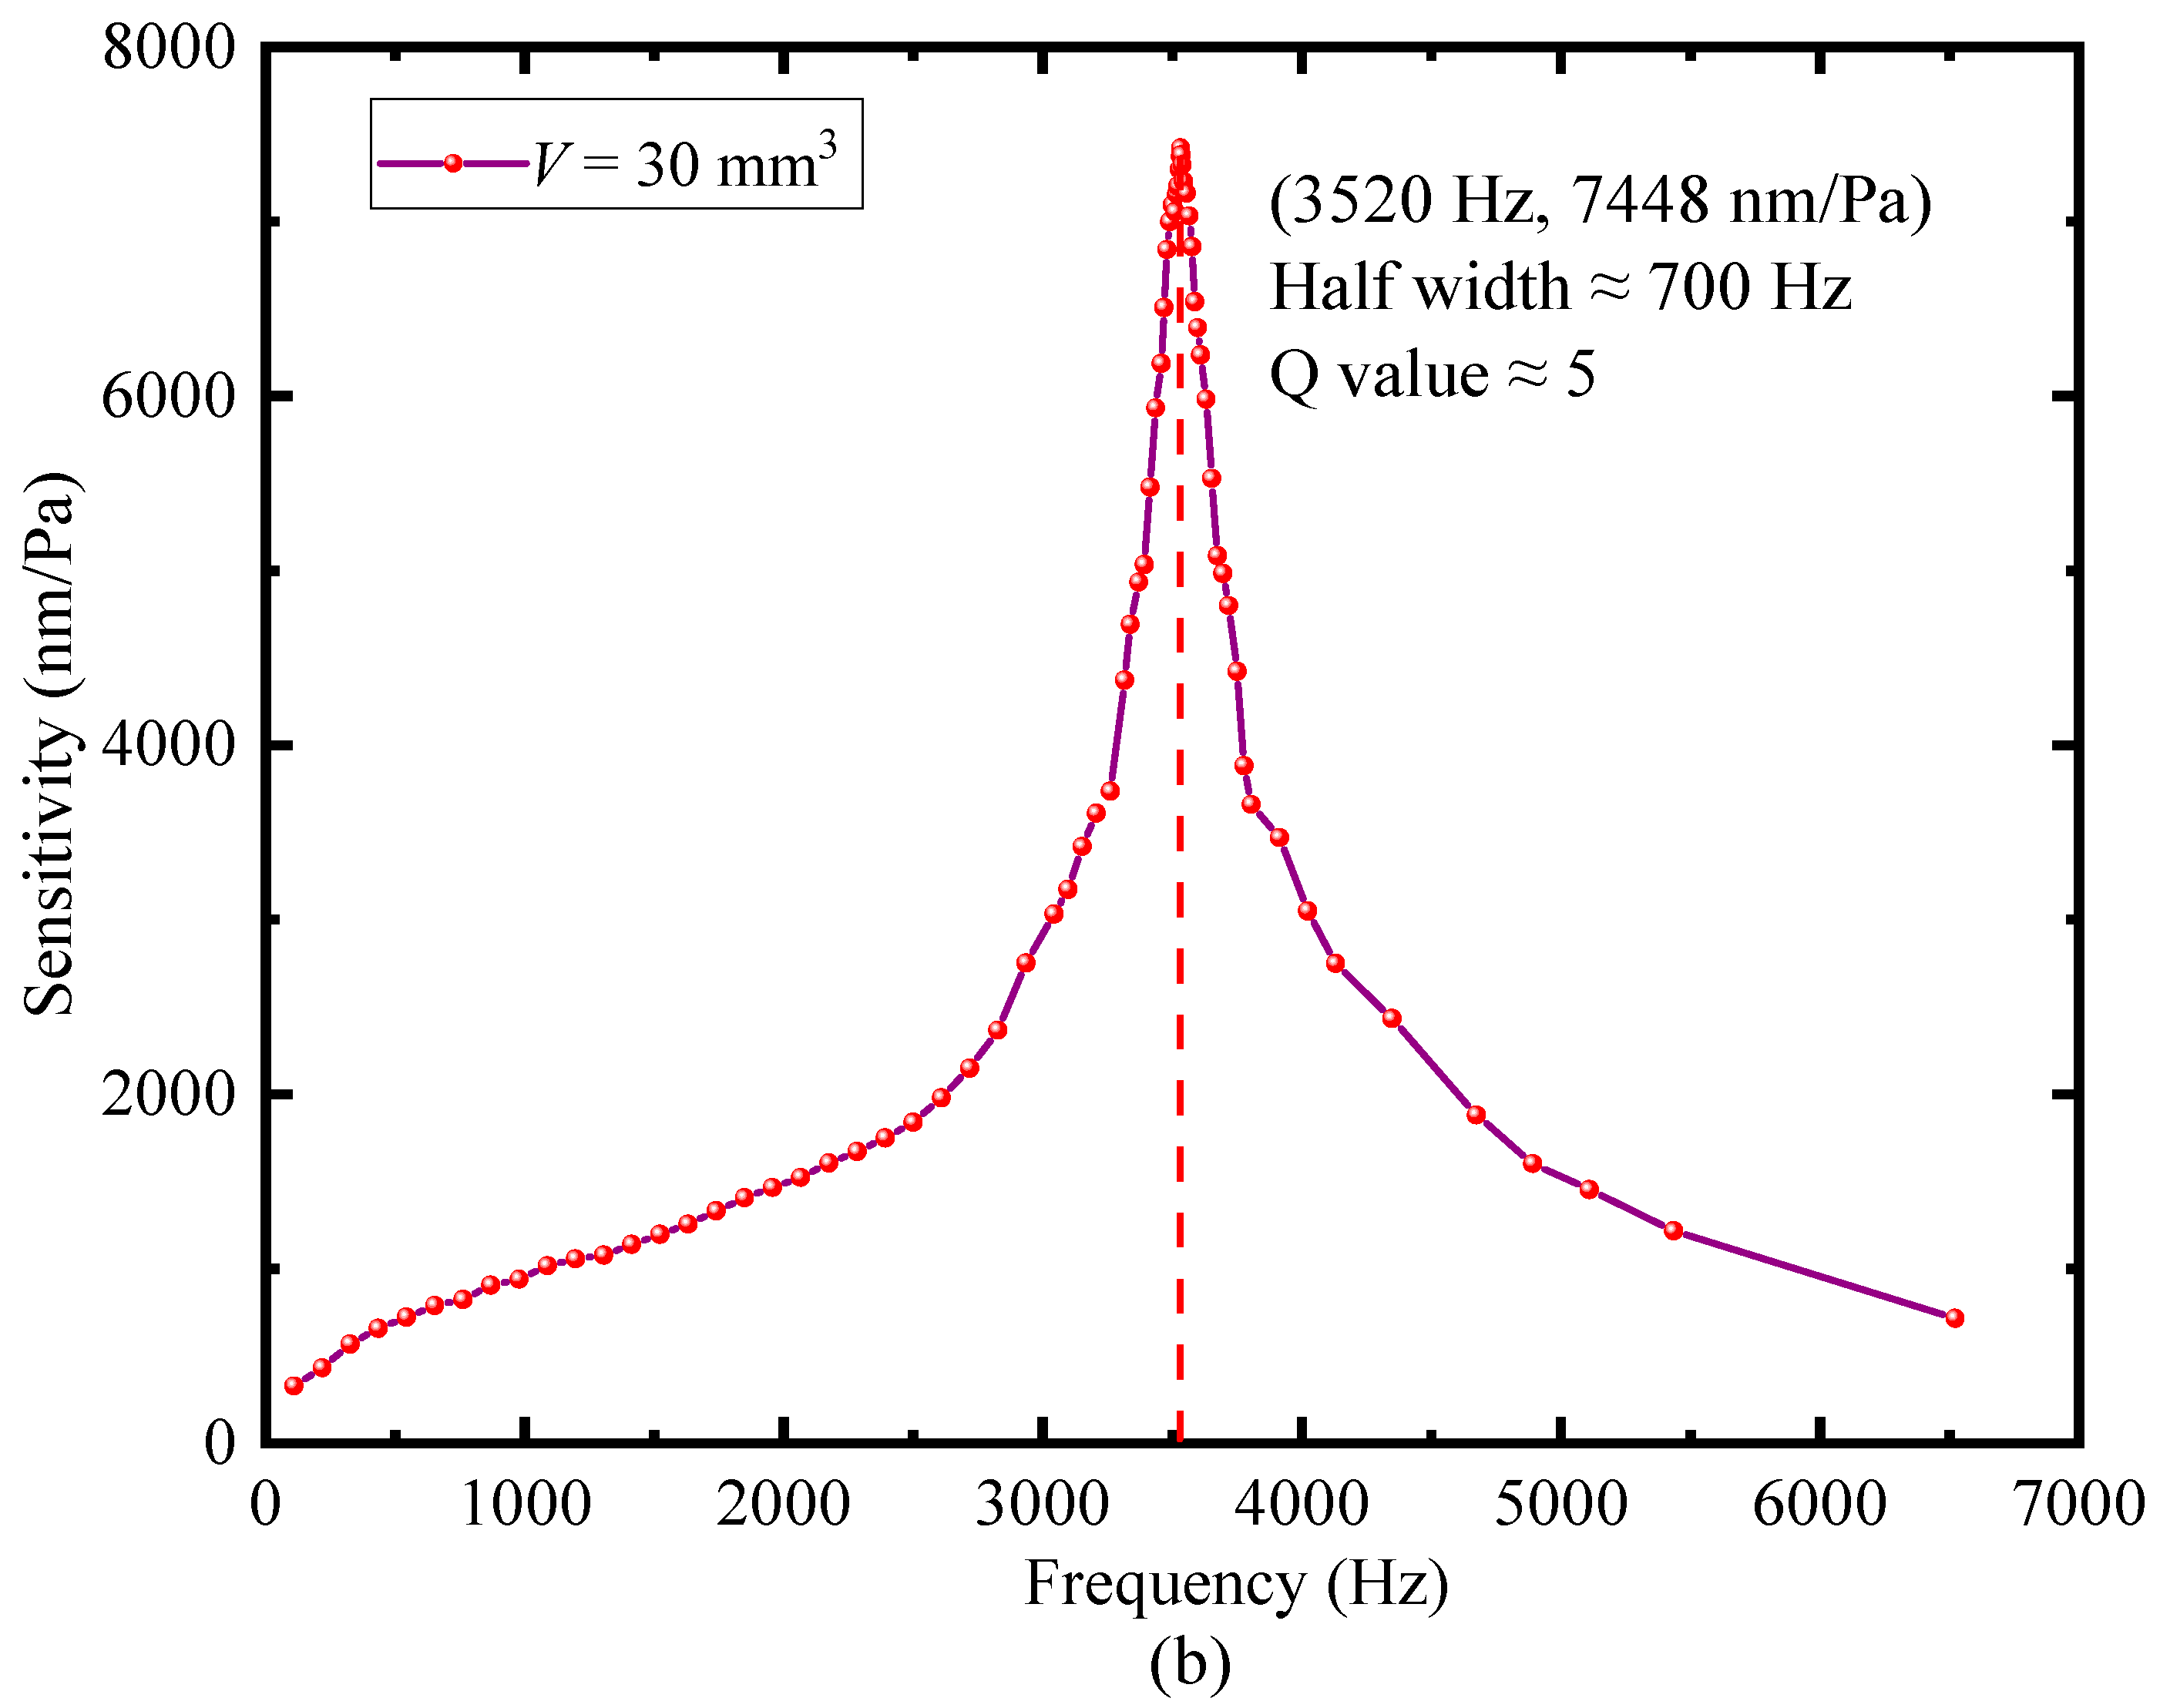
| Cavity Volume (mm3) | First-Order Resonance Frequency (Hz) | Sensitivity (nm/Pa) | Q Value |
|---|---|---|---|
| 12 | 4275 | 1309 | 2 |
| 30 | 3520 | 7448 | 5 |
| 60 | 3233 | 26,773 | 65 |
| Frequency (Hz) | Average Sensitivity Value (nm/Pa) | Deviation |
|---|---|---|
| 1000 | 597.7 | 1.4% |
| 2000 | 925.7 | 1.1% |
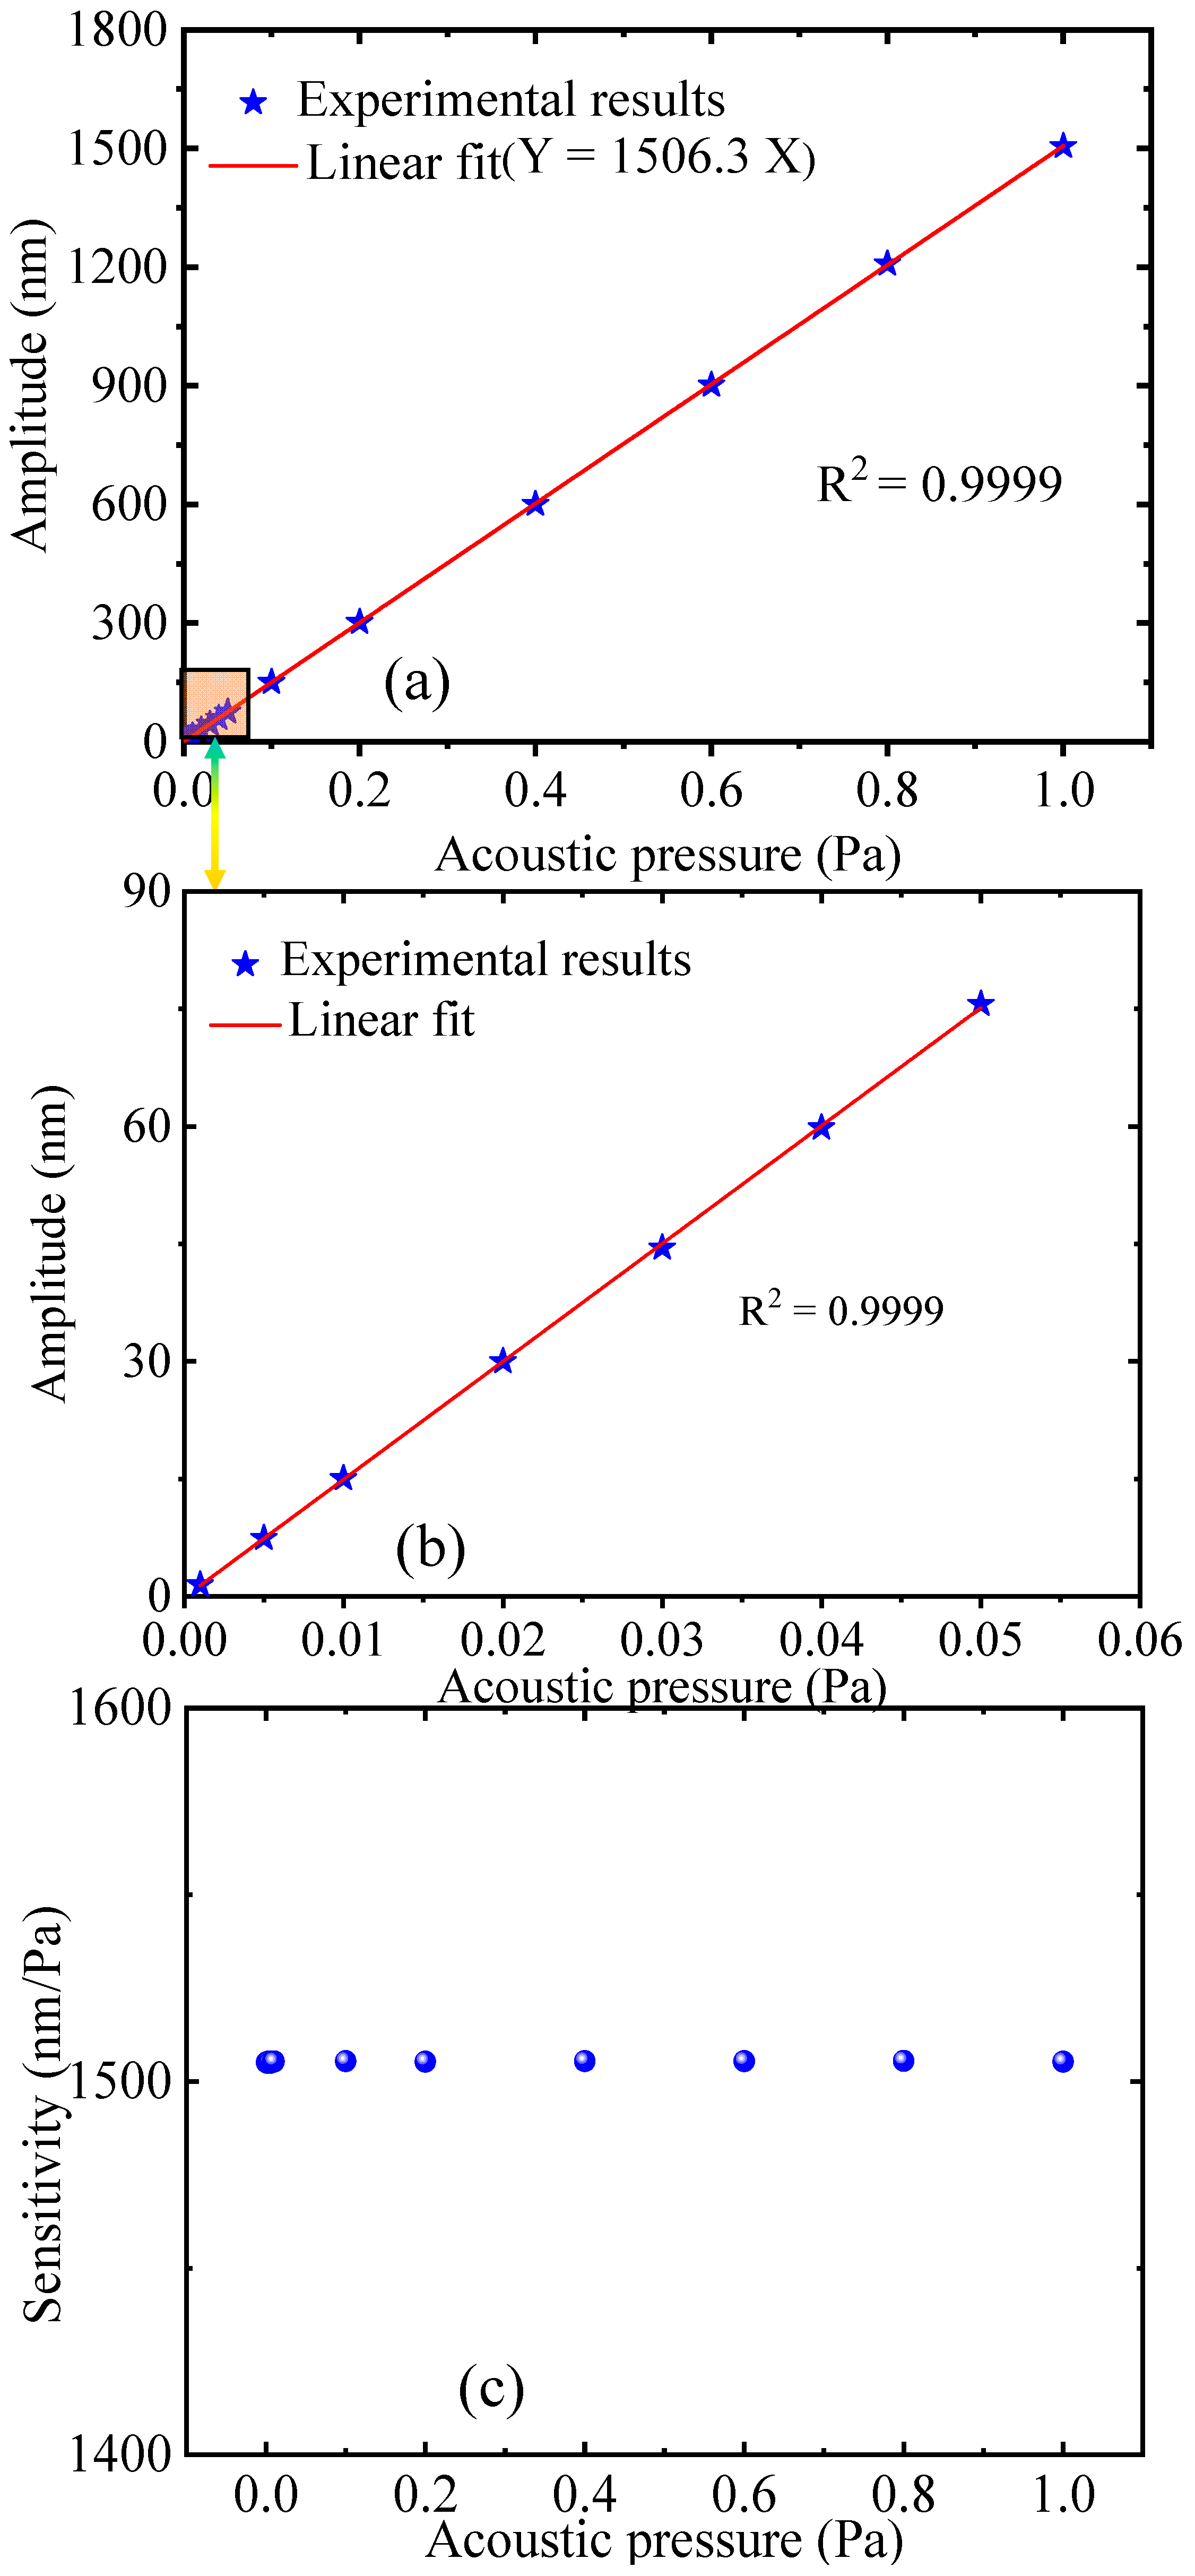
| 2500 | 1506.1 | 1.9% |
| 4000 | 900.6 | 2.3% |
| Type | Volume (mm3) | Sensitivity (nm/Pa) | MDP (μPa/Hz1/2) | Demodulation Algorithm |
|---|---|---|---|---|
| Silver diaphragm-based FOM [7] | -- | 2100 | 14.5 @ 4 kHz | Phase demodulation |
| Graphene diaphragm-based FOM [19] | -- | 28.57 | 83 @ 3 kHz | Phase demodulation |
| Flywheel-like diaphragm-based FOM [18] | 216 | 1.525 | 13.06 @ 4 kHz | Intensity demodulation |
| Parylene-C diaphragm-based FOM [24] | -- | 2239 | 22.1 @ 20 Hz | WLI |
| Photonic-crystal membrane-based FOM [33] | 191 | -- | 1 @ 23 kHz | Phase demodulation |
| Cantilever-based FOM [32] | 2653 | 364 | 8.5 @ 1 kHz | WLI |
| Silicon cantilever-based FOM [6] | 1570 | 28,750 | 0.21 @ 3 kHz | WLI |
| Silicon cantilever-based FOM [30] | 18 | 950 | 25.68 @ 13 kHz | WLI |
| Silicon cantilever-based FOM (this paper) | 102 | 26,773 | 0.93 @ 2.5 kHz | WLI |
Publisher’s Note: MDPI stays neutral with regard to jurisdictional claims in published maps and institutional affiliations. |
© 2022 by the authors. Licensee MDPI, Basel, Switzerland. This article is an open access article distributed under the terms and conditions of the Creative Commons Attribution (CC BY) license (https://creativecommons.org/licenses/by/4.0/).
Share and Cite
Wu, G.; Li, H.; Ye, H.; Gong, Z.; Ma, J.; Guo, M.; Chen, K.; Peng, W.; Yu, Q.; Mei, L. Ultra-High-Sensitivity, Miniaturized Fabry-Perot Interferometric Fiber-Optic Microphone for Weak Acoustic Signals Detection. Sensors 2022, 22, 6948. https://doi.org/10.3390/s22186948
Wu G, Li H, Ye H, Gong Z, Ma J, Guo M, Chen K, Peng W, Yu Q, Mei L. Ultra-High-Sensitivity, Miniaturized Fabry-Perot Interferometric Fiber-Optic Microphone for Weak Acoustic Signals Detection. Sensors. 2022; 22(18):6948. https://doi.org/10.3390/s22186948
Chicago/Turabian StyleWu, Guojie, Haie Li, Hongxin Ye, Zhenfeng Gong, Junsheng Ma, Min Guo, Ke Chen, Wei Peng, Qingxu Yu, and Liang Mei. 2022. "Ultra-High-Sensitivity, Miniaturized Fabry-Perot Interferometric Fiber-Optic Microphone for Weak Acoustic Signals Detection" Sensors 22, no. 18: 6948. https://doi.org/10.3390/s22186948