
Multimodal Finger Pulse Wave Sensing: Comparison of Forcecardiography and Photoplethysmography Sensors

 ,
,  ,
,  ,
,  ,
,  , and
, and 
Abstract
:1. Introduction
2. Materials and Methods
2.1. Forcecardiography Sensors
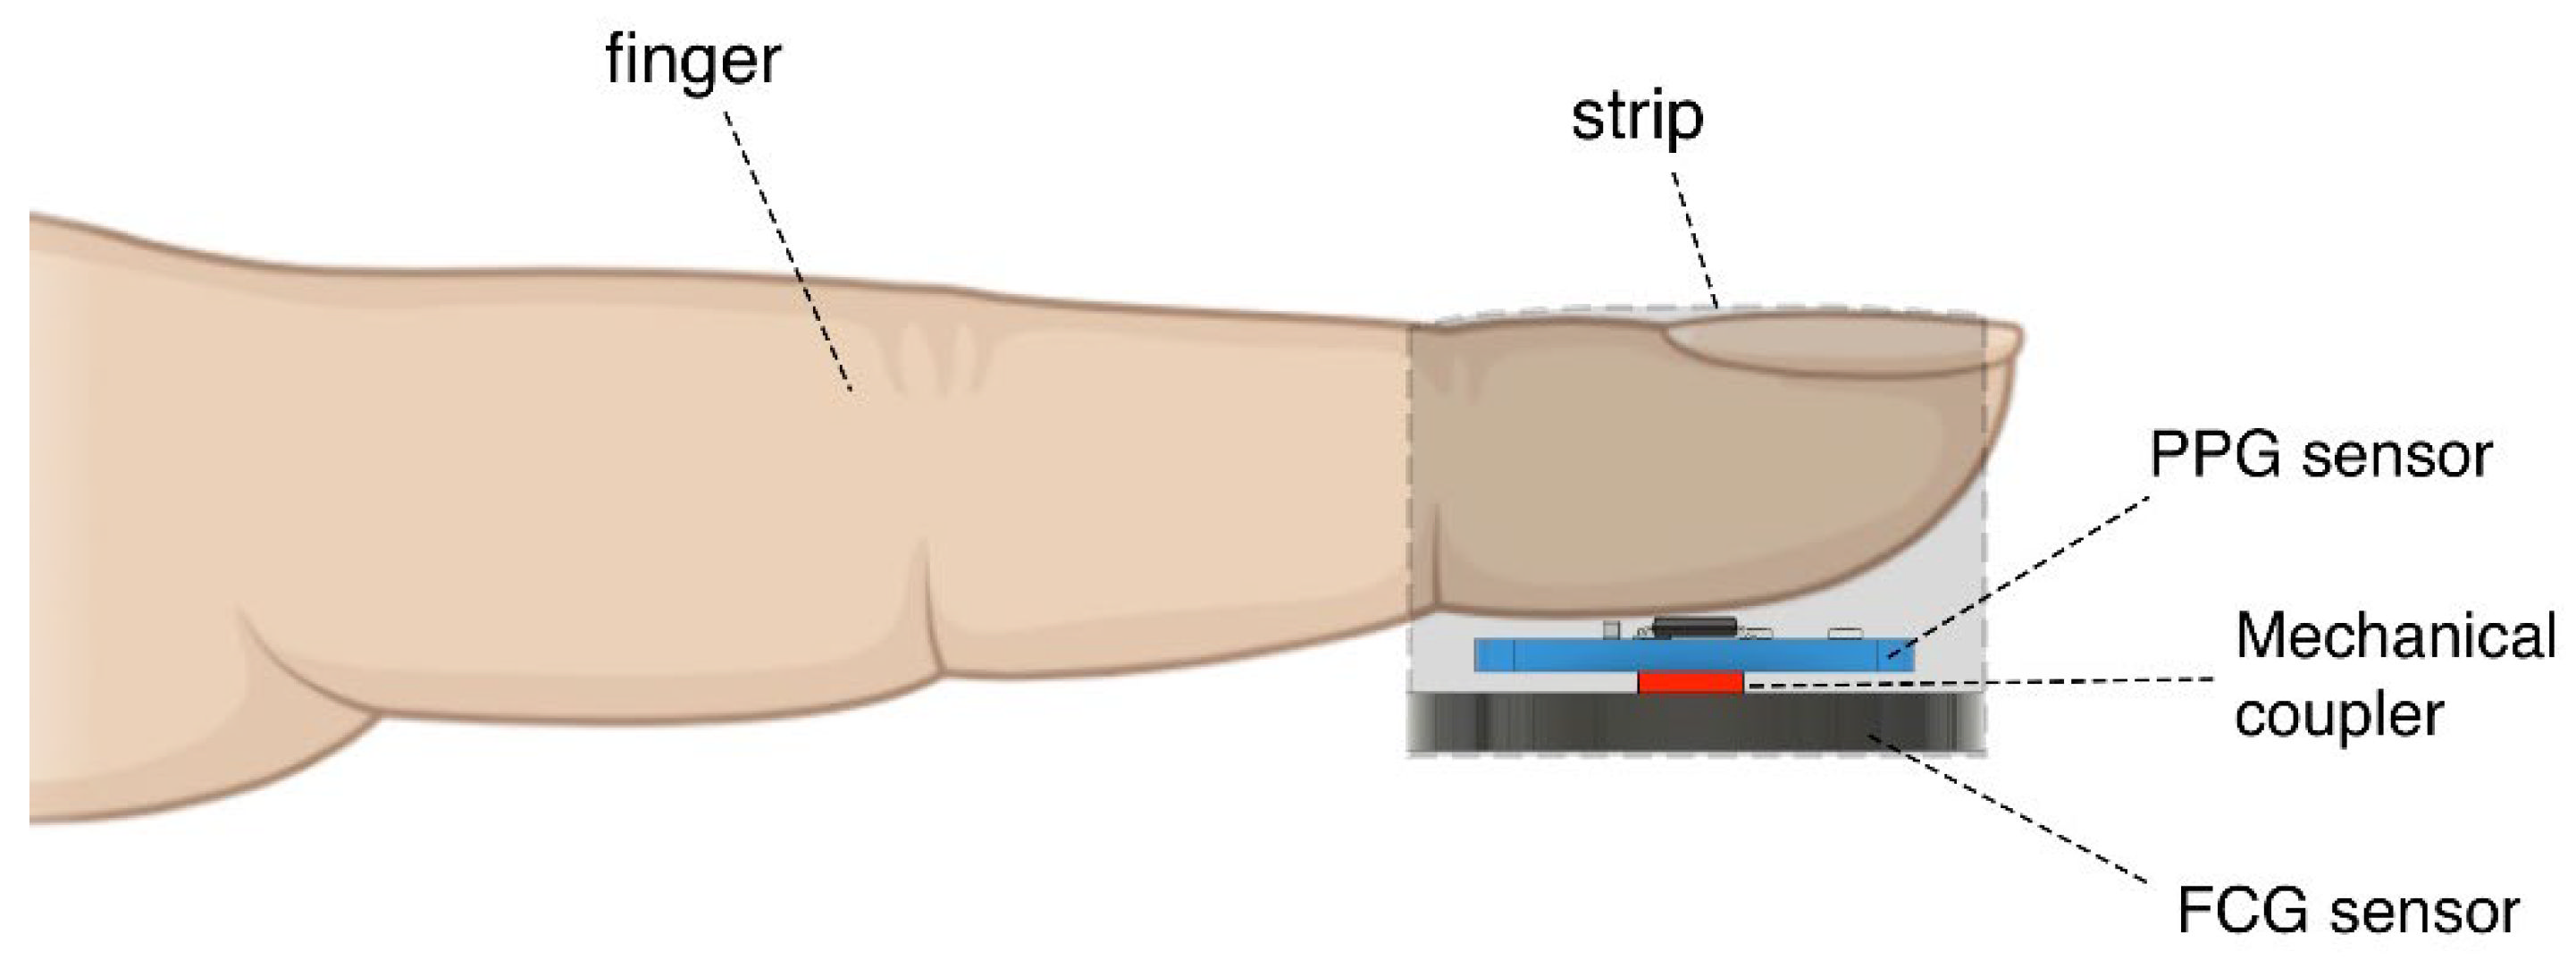
2.2. Multimodal PW Sensor
2.3. Experimental Measurement Setup and Protocol
2.4. Signal Processing and Analysis
2.4.1. Pre-Processing
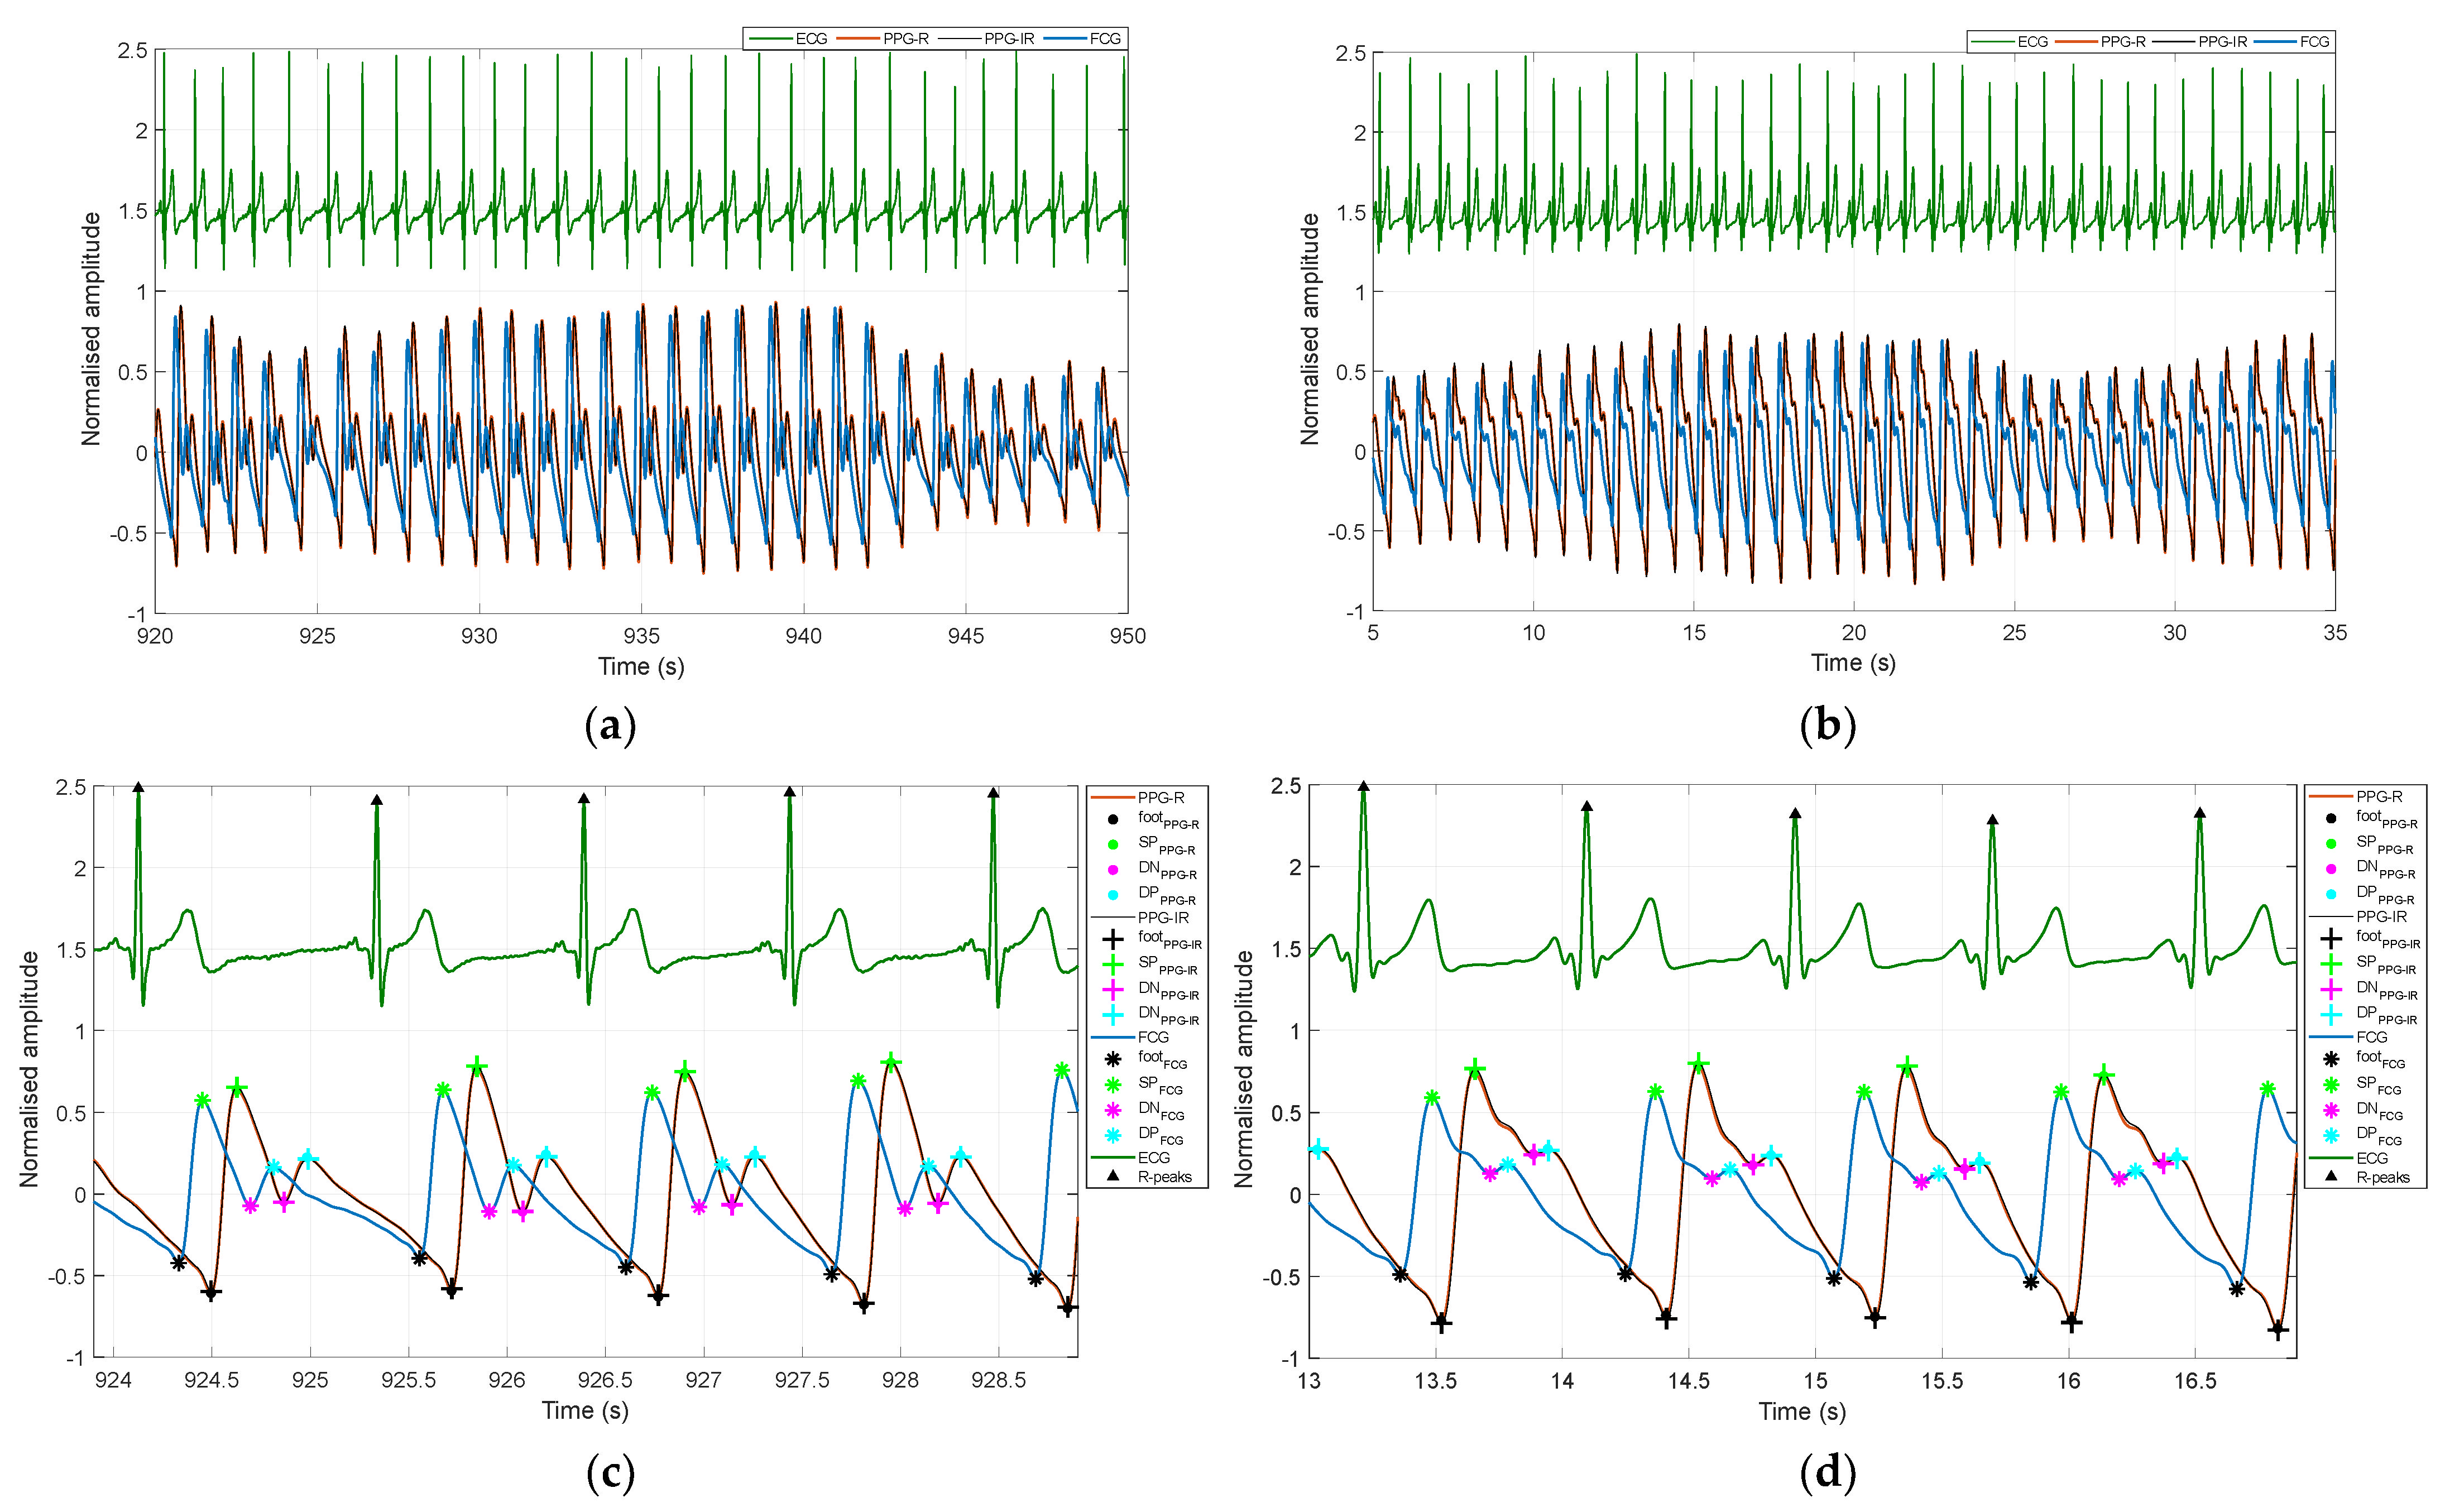
2.4.2. Detection of Fiducial Points
- The foot of the systolic rise (referred to as “foot”);
- Systolic peak;
- Dicrotic notch;
- Diastolic peak.
2.4.3. Extraction of PW Morphological Parameters
- tup: time distance between the foot and the systolic peak;
- ti: time distance between the foot and the dicrotic notch;
- T: time distance between two consecutive feet;
- tup/T: ratio of foot time distances from the systolic peak and from subsequent foot;
- h1: systolic peak height with respect to the foot;
- h2: dicrotic notch height with respect to the foot;
- h3: diastolic peak height with respect to the foot;
- h2/h1: ratio of the dicrotic notch to the systolic peak heights;
- h3/h1: ratio of the diastolic to systolic peaks heights.

2.4.4. Normalized Cross-Correlation
2.4.5. Statistical Analyses
3. Results
3.1. Time Delays between Fiducial Markers
3.2. Normalized Cross-Correlation
3.3. Morphological Parameters of PW
4. Discussion
Author Contributions
Funding
Informed Consent Statement
Data Availability Statement
Conflicts of Interest
References
- Park, J.; Seok, H.S.; Kim, S.S.; Shin, H. Photoplethysmogram Analysis and Applications: An Integrative Review. Front Physiol. 2022, 12, 808451. [Google Scholar] [CrossRef] [PubMed]
- Meng, K.; Xiao, X.; Wei, W.; Chen, G.; Nashalian, A.; Shen, S.; Xiao, X.; Chen, J. Wearable Pressure Sensors for Pulse Wave Monitoring. Adv. Mater. 2022, 34, e2109357. [Google Scholar] [CrossRef] [PubMed]
- Wang, H.; Wang, L.; Sun, N.; Yao, Y.; Hao, L.; Xu, L.; Greenwald, S.E. Quantitative Comparison of the Performance of Piezoresistive, Piezoelectric, Acceleration, and Optical Pulse Wave Sensors. Front. Physiol. 2020, 14, 1563. [Google Scholar] [CrossRef] [PubMed] [Green Version]
- Challoner, A. Photoelectric plethysmography for estimating cutaneous blood flow. Non-Invasive Physiol. Meas. 1979, 1, 125–151. [Google Scholar]
- Lindberg, L.-G.; Oberg, P.A. Optical properties of blood in motion. Opt. Eng. 1993, 32, 253–258. [Google Scholar] [CrossRef]
- Kamal, A.; Harness, J.; Irving, G.; Mearns, A. Skin photoplethysmography—A review. Comput. Methods Programs Biomed. 1989, 28, 257–269. [Google Scholar] [CrossRef]
- De Trafford, J.; Lafferty, K. What does photoplethysmography measure? Med. Biol. Eng. Comput. 1984, 22, 479–480. [Google Scholar] [CrossRef]
- Ruggiero, E.; Alonso-De Castro, S.; Habtemariam, A.; Salassa, L. Upconverting nanoparticles for the near infrared photoactivation of transition metal complexes: New opportunities and challenges in medicinal inorganic photochemistry. Dalton Trans. 2016, 45, 13012–13020. [Google Scholar] [CrossRef] [Green Version]
- Spigulis, J.; Gailite, L.; Lihachev, A.; Erts, R. Simultaneous recording of skin blood pulsations at different vascular depths by multiwavelength photoplethysmography. Appl. Opt. 2007, 46, 1754–1759. [Google Scholar] [CrossRef] [Green Version]
- Liu, J.; Yan, B.P.; Zhang, Y.-T.; Ding, X.-R.; Su, P.; Zhao, N. Multi-wavelength photoplethysmography enabling continuous blood pressure measurement with compact wearable electronics. IEEE Trans. Biomed. Eng. 2018, 66, 1514–1525. [Google Scholar] [CrossRef]
- Liu, J.; Yan, B.P.-Y.; Dai, W.-X.; Ding, X.-R.; Zhang, Y.-T.; Zhao, N. Multi-wavelength photoplethysmography method for skin arterial pulse extraction. Biomed. Opt. Express 2016, 7, 4313–4326. [Google Scholar] [CrossRef] [PubMed]
- Jones, D.P. Medical electro-optics: Measurements in the human microcirculation. Phys. Technol. 1987, 18, 79. [Google Scholar] [CrossRef]
- Li, S.; Liu, L.; Wu, J.; Tang, B.; Li, D. Comparison and noise suppression of the transmitted and reflected photoplethysmography signals. BioMed. Res. Int. 2018, 4523593. [Google Scholar] [CrossRef] [PubMed]
- Millasseau, S.C.; Ritter, J.M.; Takazawa, K.; Chowienczyk, P.J. Contour analysis of the photoplethysmographic pulse measured at the finger. J. Hypertens. 2006, 24, 1449–1456. [Google Scholar] [CrossRef]
- Allen, J.; Murray, A. Age-related changes in peripheral pulse timing characteristics at the ears, fingers and toes. J. Hum. Hypertens. 2002, 16, 711–717. [Google Scholar] [CrossRef] [Green Version]
- Stern, R.M. Ear lobe photoplethysmography. Psychophysiology 1974, 11, 73–75. [Google Scholar] [CrossRef]
- Choi, B.; Park, C.; Lee, Y.; Shin, H.; Lee, S.; Jeong, S.; Noh, G.J.; Lee, B. Development of a new analgesic index using nasal photoplethysmography. Anaesthesia 2018, 73, 1123–1130. [Google Scholar] [CrossRef] [Green Version]
- Sabbadini, R.; Di Tocco, J.; Massaroni, C.; Schena, E.; Carassiti, M. A smart face mask based on photoplethysmography for cardiorespiratory monitoring in occupational settings. In Proceedings of the IEEE International Symposium on Medical Measurements and Applications (MeMeA), Lausanne, Switzerland, 23–25 June 2021; pp. 1–6. [Google Scholar] [CrossRef]
- Kyriacou, P.; Powell, S.; Langford, R.; Jones, D. Investigation of oesophageal photoplethysmographic signals and blood oxygen saturation measurements in cardiothoracic surgery patients. Physiol. Meas. 2002, 23, 533. [Google Scholar] [CrossRef] [Green Version]
- Barnes, R.W.; Clayton, J.M.; Bone, G.E.; Slaymaker, E.E.; Reinertson, J. Supraorbital photoplethysmography. Simple, accurate screening for carotid occlusive disease. J. Surg. Res. 1977, 22, 319–327. [Google Scholar] [CrossRef]
- Stone, K.; Fryer, S.; Faulkner, J.; Meyer, M.L.; Zieff, G.; Paterson, C.; Burnet, K.; Kelsch, E.; Credeur, D.; Lambrick, D.; et al. Acute Changes in Carotid-Femoral Pulse-Wave Velocity Are Tracked by Heart-Femoral Pulse-Wave Velocity. Front. Cardiovasc. Med. 2021, 7, 592834. [Google Scholar] [CrossRef]
- Wannenburg, J.; Malekian, R. Body sensor network for mobile health monitoring, a diagnosis and anticipating system. IEEE Sens. J. 2015, 15, 6839–6852. [Google Scholar] [CrossRef] [Green Version]
- Venema, B.; Blanik, N.; Blazek, V.; Gehring, H.; Opp, A.; Leonhardt, S. Advances in reflective oxygen saturation monitoring with a novel in-ear sensor system: Results of a human hypoxia study. IEEE Trans. Biomed. Eng. 2012, 59, 2003–2010. [Google Scholar] [CrossRef] [PubMed]
- Mahmud, S.; Ibtehaz, N.; Khandakar, A.; Tahir, A.M.; Rahman, T.; Islam, K.R.; Hossain, M.S.; Rahman, M.S.; Musharavati, F.; Ayari, M.A.; et al. A Shallow U-Net Architecture for Reliably Predicting Blood Pressure (BP) from Photoplethysmogram (PPG) and Electrocardiogram (ECG) Signals. Sensors 2022, 22, 919. [Google Scholar] [CrossRef] [PubMed]
- Mousavi, S.S.; Firouzmand, M.; Charmi, M.; Hemmati, M.; Moghadam, M.; Ghorbani, Y. Blood pressure estimation from appropriate and inappropriate PPG signals using A whole-based method. Biomed. Signal Process. Control 2019, 47, 196–206. [Google Scholar] [CrossRef]
- Wang, G.; Atef, M.; Lian, Y. Towards a continuous non-invasive cuffless blood pressure monitoring system using PPG: Systems and circuits review. IEEE Circuits Syst. Mag. 2018, 18, 6–26. [Google Scholar] [CrossRef]
- Nabeel, P.; Jayaraj, J.; Mohanasankar, S. Single-source PPG-based local pulse wave velocity measurement: A potential cuffless blood pressure estimation technique. Physiol. Meas. 2017, 38, 2122. [Google Scholar] [CrossRef]
- He, X.; Goubran, R.A.; Liu, X.P. Secondary peak detection of PPG signal for continuous cuffless arterial blood pressure measurement. IEEE Trans. Instrument. Meas. 2014, 63, 1431–1439. [Google Scholar] [CrossRef]
- Ma, H.T. A blood pressure monitoring method for stroke management. BioMed Res. Int. 2014, 2014, 571623. [Google Scholar] [CrossRef] [Green Version]
- Mase, M.; Mattei, W.; Cucino, R.; Faes, L.; Nollo, G. Feasibility of cuff-free measurement of systolic and diastolic arterial blood pressure. J. Electrocardiol. 2011, 44, 201–207. [Google Scholar] [CrossRef]
- Wong, M.Y.-M.; Poon, C.C.-Y.; Zhang, Y.-T. An evaluation of the cuffless blood pressure estimation based on pulse transit time technique: A half year study on normotensive subjects. Cardiovasc. Eng. 2009, 9, 32–38. [Google Scholar] [CrossRef]
- Baek, H.J.; Kim, K.K.; Kim, J.S.; Lee, B.; Park, K.S. Enhancing the estimation of blood pressure using pulse arrival time and two confounding factors. Physiol. Meas. 2009, 31, 145. [Google Scholar] [CrossRef] [PubMed]
- Chen, W.; Kobayashi, T.; Ichikawa, S.; Takeuchi, Y.; Togawa, T. Continuous estimation of systolic blood pressure using the pulse arrival time and intermittent calibration. Med. Biol. Eng. Comput. 2000, 38, 569–574. [Google Scholar] [CrossRef]
- Korkalainen, H.; Aakko, J.; Duce, B.; Kainulainen, S.; Leino, A.; Nikkonen, S.; Afara, I.O.; Myllymaa, S.; Töyräs, J.; Leppänen, T. Deep learning enables sleep staging from photoplethysmogram for patients with suspected sleep apnea. Sleep 2020, 43, zsaa098. [Google Scholar] [CrossRef]
- Dall’Olio, L.; Curti, N.; Remondini, D.; Harb, Y.S.; Asselbergs, F.W.; Castellani, G.; Uh, H.-W. Prediction of vascular aging based on smartphone acquired PPG signals. Sci. Rep. 2020, 10, 19756. [Google Scholar] [CrossRef]
- Yousef, Q.; Reaz, M.; Ali, M.A.M. The analysis of PPG morphology: Investigating the effects of aging on arterial compliance. Meas. Sci. Rev. 2012, 12, 266–271. [Google Scholar] [CrossRef] [Green Version]
- Millasseau, S.C.; Kelly, R.P.; Ritter, J.M.; Chowienczyk, P.J. The vascular impact of aging andvasoactive drugs: Comparison of two digital volume pulse measurements. Am. J. Hypertens. 2003, 16, 467–472. [Google Scholar] [CrossRef] [Green Version]
- Bortolotto, L.A.; Blacher, J.; Kondo, T.; Takazawa, K.; Safar, M.E. Assessment of vascular aging and atherosclerosis in hypertensive subjects: Second derivative of photoplethysmogram versus pulse wave velocity. Am. J. Hypertens. 2000, 13, 165–171. [Google Scholar] [CrossRef] [Green Version]
- Takazawa, K.; Tanaka, N.; Fujita, M.; Matsuoka, O.; Saiki, T.; Aikawa, M.; Tamura, S.; Ibukiyama, C. Assessment of vasoactive agents and vascular aging by the second derivative of photoplethysmogram waveform. Hypertension 1998, 32, 365–370. [Google Scholar] [CrossRef] [PubMed] [Green Version]
- Allen, J.; Liu, H.; Iqbal, S.; Zheng, D.; Stansby, G. Deep learning-based photoplethysmography classification for peripheral arterial disease detection: A proof-of-concept study. Physiol. Meas. 2021, 42, 054002. [Google Scholar] [CrossRef]
- Bentham, M.; Stansby, G.; Allen, J. Innovative multi-site photoplethysmography analysis for quantifying pulse amplitude and timing variability characteristics in peripheral arterial disease. Diseases 2018, 6, 81. [Google Scholar] [CrossRef]
- Alnaeb, M.E.; Alobaid, N.; Seifalian, A.M.; Mikhailidis, D.P.; Hamilton, G. Optical techniques in the assessment of peripheral arterial disease. Curr. Vasc. Pharmacol. 2007, 5, 53–59. [Google Scholar] [CrossRef] [PubMed]
- Allen, J.; Murray, A. Development of a neural network screening aid for diagnosing lower limb peripheral vascular disease from photoelectric plethysmography pulse waveforms. Physiol. Meas. 1993, 14, 13. [Google Scholar] [CrossRef] [PubMed]
- Cannesson, M.; Besnard, C.; Durand, P.G.; Bohé, J.; Jacques, D. Relation between respiratory variations in pulse oximetry plethysmographic waveform amplitude and arterial pulse pressure in ventilated patients. Crit. Care 2005, 9, R562. [Google Scholar] [CrossRef] [PubMed] [Green Version]
- Monnet, X.; Lamia, B.; Teboul, J.-L. Pulse oximeter as a sensor of fluid responsiveness: Do we have our finger on the best solution? Crit. Care 2005, 9, 429. [Google Scholar] [CrossRef] [PubMed]
- Lazazzera, R.; Deviaene, M.; Varon, C.; Buyse, B.; Testelmans, D.; Laguna, P.; Gil, E.; Carrault, G. Detection and classification of sleep apnea and hypopnea using PPG and SpO2 signals. IEEE Trans. Biomed. Eng. 2020, 68, 1496–1506. [Google Scholar] [CrossRef] [PubMed]
- Hilmisson, H.; Berman, S.; Magnusdottir, S. Sleep apnea diagnosis in children using software-generated apnea-hypopnea index (AHI) derived from data recorded with a single photoplethysmogram sensor (PPG). Sleep Breath. 2020, 24, 1739–1749. [Google Scholar] [CrossRef]
- Park, K.S.; Choi, S.H. Smart technologies toward sleep monitoring at home. Biomed. Eng. Lett. 2019, 9, 73–85. [Google Scholar] [CrossRef]
- Behar, J.; Roebuck, A.; Shahid, M.; Daly, J.; Hallack, A.; Palmius, N.; Stradling, J.; Clifford, G.D. SleepAp: An automated obstructive sleep apnoea screening application for smartphones. IEEE J. Biomed. Health Inform. 2014, 19, 325–331. [Google Scholar] [CrossRef]
- Liu, S.-H.; Li, R.-X.; Wang, J.-J.; Chen, W.; Su, C.-H. Classification of photoplethysmographic signal quality with deep convolution neural networks for accurate measurement of cardiac stroke volume. Appl. Sci. 2020, 10, 4612. [Google Scholar] [CrossRef]
- Liu, S.-H.; Wang, J.-J.; Chen, W.; Pan, K.-L.; Su, C.-H. Classification of photoplethysmographic signal quality with fuzzy neural network for improvement of stroke volume measurement. Appl. Sci. 2020, 10, 1476. [Google Scholar] [CrossRef]
- Lee, Q.Y.; Redmond, S.J.; Chan, G.S.; Middleton, P.M.; Steel, E.; Malouf, P.; Critoph, C.; Flynn, G.; O’Lone, E.; Lovell, N.H. Estimation of cardiac output and systemic vascular resistance using a multivariate regression model with features selected from the finger photoplethysmogram and routine cardiovascular measurements. Biomed. Eng. Online 2013, 12, 19. [Google Scholar] [CrossRef] [PubMed] [Green Version]
- Wang, L.; Poon, C.; Zhang, Y. The non-invasive and continuous estimation of cardiac output using a photoplethysmogram and electrocardiogram during incremental exercise. Physiol. Meas. 2010, 31, 715–726. [Google Scholar] [CrossRef] [PubMed]
- Sabbadini, R.; Riccio, M.; Maresca, L.; Irace, A.; Breglio, G. Atrial Fibrillation Detection by Means of Edge Computing on Wearable Device: A Feasibility Assessment. In Proceedings of the 2022 IEEE International Symposium on Medical Measurements and Applications (MeMeA), Messina, Italy, 22–24 June 2022; pp. 1–6. [Google Scholar] [CrossRef]
- Lee, C.; Shin, H.S.; Lee, M. Relations between ac-dc components and optical path length in photoplethysmography. J. Biomed. Opt. 2011, 16, 077012. [Google Scholar] [CrossRef] [PubMed]
- Yuan, H.; Memon, S.F.; Newe, T.; Lewis, E.; Leen, G. Motion artefact minimization from photoplethysmography based non-invasive hemoglobin sensor based on an envelope filtering algorithm. Measurement 2018, 115, 288–298. [Google Scholar] [CrossRef]
- Lakshmanan, S.; Chatterjee, D.; Muniyandi, M. Noninvasive assistive method to diagnose arterial disease-takayasu’s arteritis. In Computational Vision and Bio Inspired Computing; Hemanth, D.J., Smys, S., Eds.; Springer: Berlin, Germany, 2018; Volume 28, pp. 384–398. [Google Scholar] [CrossRef]
- Pimentel, M.A.; Charlton, P.H.; Clifton, D.A. Probabilistic estimation of respiratory rate from wearable sensors. In Wearable Electronics Sensors; Mukhopadhyay, S.C., Ed.; Springer: Berlin, Germany, 2015; pp. 241–262. [Google Scholar] [CrossRef]
- McKay, N.D.; Griffiths, B.; Di Maria, C.; Hedley, S.; Murray, A.; Allen, J. Novel photoplethysmography cardiovascular assessments in patients with Raynaud’s phenomenon and systemic sclerosis: A pilot study. Rheumatology 2014, 53, 1855–1863. [Google Scholar] [CrossRef] [Green Version]
- Reisner, A.; Shaltis, P.A.; Mccombie, D.; Asada, H.H. Utility of the photoplethysmogram in circulatory monitoring. Anesthesiol. J. Am. Soc. Anesthesiol. 2008, 108, 950–958. [Google Scholar] [CrossRef] [Green Version]
- Shelley, K.H. Photoplethysmography: Beyond the calculation of arterial oxygen saturation and heart rate. Anesth. Analg. 2007, 105, S31–S36. [Google Scholar] [CrossRef]
- Allen, J. Photoplethysmography and its application in clinical physiological measurement. Physiol. Meas. 2007, 28, R1. [Google Scholar] [CrossRef] [Green Version]
- Shelley, K.H.; Jablonka, D.H.; Awad, A.A.; Stout, R.G.; Rezkanna, H.; Silverman, D.G. What is the best site for measuring the effect of ventilation on the pulse oximeter waveform? Anesth. Analg. 2006, 103, 372–377. [Google Scholar] [CrossRef]
- Nitzan, M.; Faib, I.; Friedman, H. Respiration-induced changes in tissue blood volume distal to occluded artery, measured by photoplethysmography. J. Biomed. Opt. 2006, 11, 040506. [Google Scholar] [CrossRef]
- Xu, L.; Cheng, J.; Chen, X. Illumination variation interference suppression in remote PPG using PLS MEMD. Electron. Lett. 2017, 53, 216–218. [Google Scholar] [CrossRef]
- Allen, J.; Murray, A. Similarity in bilateral photoplethysmographic peripheral pulse wave characteristics at the ears, thumbs toes. Physiol. Meas. 2000, 21, 369. [Google Scholar] [CrossRef] [PubMed]
- Senay, L.C., Jr.; Prokop, L.D.; Cronau, L.; Hertzman, A.B. Relation of local skin temperature local sweating to cutaneous blood flow. J. Appl. Physiol. 1963, 18, 781–785. [Google Scholar] [CrossRef] [PubMed]
- Hertzman, A.B.; Roth, L.W. The absence of vasoconstrictor reflexes in the forehead circulation. Effects of cold. Am. J. Physiol.-Leg. Content 1942, 136, 692–697. [Google Scholar] [CrossRef] [Green Version]
- Hertzman, A.B.; Dillon, J.B. Applications of photoelectric plethysmography in peripheral vascular disease. Am. Heart J. 1940, 20, 750–761. [Google Scholar] [CrossRef]
- Krishnaswamy, A.; Baranoski, G.V. A biophysically-based spectral model of light interaction with human skin. Comput. Graph. Forum 2004, 23, 331–340. [Google Scholar] [CrossRef]
- Zhang, Q.; Lindberg, L.-G.; Kadefors, R.; Styf, J. A non-invasive measure of changes in blood flow in the human anterior tibial muscle. Eur. J. Appl. Physiol. 2001, 84, 448–452. [Google Scholar] [CrossRef]
- Cohn, J.N.; Finkelstein, S.; McVeigh, G.; Morgan, D.; LeMay, L.; Robinson, J.; Mock, J. Noninvasive pulse wave analysis for the early detection of vascular disease. Hypertension 1995, 26, 503–508. [Google Scholar] [CrossRef]
- Asmar, R.; Benetos, A.; Topouchian, J.; Laurent, P.; Pannier, B.; Brisac, A.-M.; Target, R.; Levy, B.I. Assessment of Arterial Distensibility by Automatic Pulse Wave Velocity Measurement. Hypertension 1995, 26, 485–490. [Google Scholar] [CrossRef]
- Liu, Z.-D.; Liu, J.-K.; Wen, B.; He, Q.-Y.; Li, Y.; Miao, F. Cuffless Blood Pressure Estimation Using Pressure Pulse Wave Signals. Sensors 2018, 18, 4227. [Google Scholar] [CrossRef] [Green Version]
- Wang, T.-W.; Lin, S.-F. Wearable Piezoelectric-Based System for Continuous Beat-to-Beat Blood Pressure Measurement. Sensors 2020, 20, 851. [Google Scholar] [CrossRef] [PubMed] [Green Version]
- Obeid, H.; Fortier, C.; Garneau, C.A.; Pare, M.; Boutouyrie, P.; Bruno, R.M.; Khettab, H.; Goupil, R.; Agharazii, M. Radial-digital pulse wave velocity: A noninvasive method for assessing stiffness of small conduit arteries. Am. J. Physiol. Heart Circ. Physiol. 2021, 320, H1361–H1369. [Google Scholar] [CrossRef] [PubMed]
- Taranchuk, A.; Pidchenko, S. Quartz Pulse Wave Sensor With a Capacitive Control for Healthcare Solutions. IEEE Sens. J. 2021, 21, 8613–8620. [Google Scholar] [CrossRef]
- Kang, X.; Zhang, J.; Shao, Z.; Wang, G.; Geng, X.; Zhang, Y.; Zhang, H. A Wearable Real-Time Pulse Wave Monitoring System Based on a Flexible Compound Sensor. Biosensors 2022, 12, 133. [Google Scholar] [CrossRef] [PubMed]
- Park, J.-H.; Jang, D.-G.; Park, J.W.; Youm, S.-K. Wearable Sensing of In-Ear Pressure for Heart Rate Monitoring with a Piezoelectric Sensor. Sensors 2015, 15, 23402–23417. [Google Scholar] [CrossRef] [PubMed] [Green Version]
- Dagdeviren, C.; Su, Y.; Joe, P.; Yona, R.; Liu, Y.; Kim, Y.-S.; Huang, Y.; Damadoran, A.R.; Xia, J.; Martin, L.W.; et al. Conformable amplified lead zirconate titanate sensors with enhanced piezoelectric response for cutaneous pressure monitoring. Nat. Commun. 2014, 5, 4496. [Google Scholar] [CrossRef] [PubMed] [Green Version]
- Lozano Montero, K.; Laurila, M.-M.; Peltokangas, M.; Haapala, M.; Verho, J.; Oksala, N.; Vehkaoja, A.; Mäntysalo, M. Self-Powered, Ultrathin, Transparent Printed Pressure Sensor for Biosignal Monitoring. ACS Appl. Electron. Mater. 2021, 3, 4362–4375. [Google Scholar] [CrossRef]
- Guo, C.-Y.; Wang, K.-J.; Hsieh, T.-L. Piezoelectric Sensor for the Monitoring of Arterial Pulse Wave: Detection of Arrhythmia Occurring in PAC/PVC Patients. Sensors 2021, 21, 6915. [Google Scholar] [CrossRef]
- Laurila, M.-M.; Matsui, H.; Shiwaku, R.; Peltokangas, M.; Verho, J.; Montero, K.L.; Sekine, T.; Vehkaoja, A.; Oksala, N.; Tokito, S.; et al. A Fully Printed Ultra-Thin Charge Amplifier for On-Skin Biosignal Measurements. IEEE J. Electron Devices Soc. 2019, 7, 566–574. [Google Scholar] [CrossRef]
- McLaughlin, J.; McNeill, M.; Braun, B.; McCormack, P.D. Piezoelectric sensor determination of arterial pulse wave velocity. Physiol. Meas. 2003, 24, 693–702. [Google Scholar] [CrossRef] [Green Version]
- Ghosh, S.K.; Mandal, D. Bio-assembled, piezoelectric prawn shell made self-powered wearable sensor for non-invasive physiological signal monitoring. Appl. Phys. Lett. 2017, 110, 123701. [Google Scholar] [CrossRef]
- Bongrain, A.; Rousseau, L.; Valbin, L.; Madaoui, N.; Lissorgues, G.; Verjus, F.; Chapon, P.A. A New Technology of Ultrathin AlN Piezoelectric Sensor for Pulse Wave Measurement. Procedia Eng. 2015, 120, 459–463. [Google Scholar] [CrossRef] [Green Version]
- Hou, J.; Zhang, Y.; Zhang, S.; Geng, X.; Wang, Y.; Chen, C.; Zhang, H. Respiration Signal Extraction From Pulse Wave Collected by PVDF Sensor. IEEE Access 2020, 8, 149878–149886. [Google Scholar] [CrossRef]
- Polley, C.; Jayarathna, T.; Gunawardana, U.; Naik, G.; Hamilton, T.; Andreozzi, E.; Bifulco, P.; Esposito, D.; Centracchio, J.; Gargiulo, G. Wearable Bluetooth Triage Healthcare Monitoring System. Sensors 2021, 21, 7586. [Google Scholar] [CrossRef] [PubMed]
- Chen, J.; Sun, K.; Zheng, R.; Sun, Y.; Yang, H.; Zhong, Y.; Li, X. Three-Dimensional Arterial Pulse Signal Acquisition in Time Domain Using Flexible Pressure-Sensor Dense Arrays. Micromachines 2021, 12, 569. [Google Scholar] [CrossRef] [PubMed]
- Nguyen, T.-V.; Mizuki, Y.; Tsukagoshi, T.; Takahata, T.; Ichiki, M.; Shimoyama, I. MEMS-Based Pulse Wave Sensor Utilizing a Piezoresistive Cantilever. Sensors 2020, 20, 1052. [Google Scholar] [CrossRef] [Green Version]
- Wang, J.; Zhu, Y.; Wu, Z.; Zhang, Y.; Lin, J.; Chen, T.; Liu, H.; Wang, F.; Sun, L. Wearable multichannel pulse condition monitoring system based on flexible pressure sensor arrays. Microsyst. Nanoeng. 2022, 8, 16. [Google Scholar] [CrossRef]
- Baek, S.; Lee, Y.; Baek, J.; Kwon, J.; Kim, S.; Lee, S.; Strunk, K.P.; Stehlin, S.; Melzer, C.; Park, S.M.; et al. Spatiotemporal Measurement of Arterial Pulse Waves Enabled by Wearable Active-Matrix Pressure Sensor Arrays. ACS Nano. 2021, 16, 368–377. [Google Scholar] [CrossRef]
- Jun, M.-H.; Jeon, Y.J.; Cho, J.-H.; Kim, Y.-M. Pulse wave response characteristics for thickness hardness of the cover layer in pulse sensors to measure radial artery pulse. Biomed. Eng. OnLine 2018, 17, 118. [Google Scholar] [CrossRef] [Green Version]
- Yao, H.; Yang, W.; Cheng, W.; Tan, Y.J.; See, H.H.; Li, S.; Ali, H.P.A.; Lim, B.Z.H.; Liu, Z.; Tee, B.C.K. Tee Near–hysteresis-free soft tactile electronic skins for wearables reliable machine learning. Proc. Natl. Acad. Sci. USA 2020, 117, 25352–25359. [Google Scholar] [CrossRef]
- Choong, C.-L.; Shim, M.-B.; Lee, B.-S.; Jeon, S.; Ko, D.-S.; Kang, T.-H.; Bae, J.; Lee, S.H.; Byun, K.E.; Im, J.; et al. Highly Stretchable Resistive Pressure Sensors Using a Conductive Elastomeric Composite on a Micropyramid Array. Adv. Mater. 2014, 26, 3451–3458. [Google Scholar] [CrossRef] [PubMed]
- Kim, J.; Chou, E.; Le, J.; Wong, S.; Chu, M.; Khine, M. Soft Wearable Pressure Sensors for Beat-to-Beat Blood Pressure Monitoring. Adv. Healthc. Mater. 2019, 8, 1900109. [Google Scholar] [CrossRef] [PubMed]
- Kaisti, M.; Panula, T.; Leppänen, J.; Punkkinen, R.; Jafari Tadi, M.; Vasankari, T.; Jaakkola, S.; Kiviniemi, T.; Airaksinen, J.; Kostiainen, P.; et al. Clinical assessment of a non-invasive wearable MEMS pressure sensor array for monitoring of arterial pulse waveform, heart rate detection of atrial fibrillation. NPJ Digit Med. 2019, 14, 2–39. [Google Scholar] [CrossRef] [PubMed] [Green Version]
- Sekine, T.; Sugano, R.; Tashiro, T.; Sato, J.; Takeda, Y.; Matsui, H.; Kumaki, D.; Domingues Dos Santos, F.; Miyabo, A.; Tokito, S. Fully Printed Wearable Vital Sensor for Human Pulse Rate Monitoring using Ferroelectric Polymer. Sci. Rep. 2018, 8, 4442. [Google Scholar] [CrossRef] [Green Version]
- Fan, W.; He, Q.; Meng, K.; Tan, X.; Zhou, Z.; Zhang, G.; Yang, J.; Wang, Z.L. Machine-knitted washable sensor array textile for precise epidermal physiological signal monitoring. Sci. Adv. 2020, 6, eaay2840. [Google Scholar] [CrossRef] [Green Version]
- Földi, S.; Horváth, T.; Zieger, F.; Sótonyi, P.; Cserey, G. A novel non-invasive blood pressure waveform measuring system compared to Millar applanation tonometry. J. Clin. Monit. Comput. 2017, 32, 717–727. [Google Scholar] [CrossRef]
- Yoo, S.-Y.; Ahn, J.-E.; Cserey, G.; Lee, H.-Y.; Seo, J.-M. Reliability Validity of Non-invasive Blood Pressure Measurement System Using Three-Axis Tactile Force Sensor. Sensors 2019, 19, 1744. [Google Scholar] [CrossRef]
- Földi, S.; Horváth, T.; Zieger, F.; Sótonyi, P.; Cserey, G. Comparison of a noninvasive 3D force sensor-based method the invasive arterial cannula in postsurgery intensive care patients. Blood Press. Monit. 2019, 24, 310–314. [Google Scholar] [CrossRef]
- Li, Y.; Marais, L.; Khettab, H.; Quan, Z.; Aasmul, S.; Leinders, R.; Schüler, R.; Morrissey, P.E.; Greenwald, S.; Segers, P.; et al. Silicon photonics-based laser Doppler vibrometer array for carotid-femoral pulse wave velocity (PWV) measurement. Biomed. Opt. Express 2020, 11, 3913–3926. [Google Scholar] [CrossRef]
- Zschocke, J.; Leube, J.; Glos, M.; Semyachkina-Glushkovskaya, O.; Penzel, T.; Bartsch, R.; Kantelhardt, J. Reconstruction of Pulse Wave Respiration From Wrist Accelerometer During Sleep. IEEE Trans. Biomed. Eng. 2022, 69, 830–839. [Google Scholar] [CrossRef]
- Tseng, C.-H.; Tseng, T.-J.; Wu, C.-Z. Cuffless Blood Pressure Measurement Using a Microwave Near-Field Self-Injection-Locked Wrist Pulse Sensor. IEEE Trans. Microw. Theory Tech. 2020, 68, 4865–4874. [Google Scholar] [CrossRef]
- Johnson, J.E.; Shay, O.; Kim, C.; Liao, C. Wearable Millimeter-Wave Device for Contactless Measurement of Arterial Pulses. IEEE Trans. Biomed. Circuits Syst. 2019, 13, 1525–1534. [Google Scholar] [CrossRef] [PubMed]
- Chan, G.; Cooper, R.; Hosanee, M.; Welykholowa, K.; Kyriacou, P.A.; Zheng, D.; Allen, J.; Abbott, D.; Lovell, N.H.; Fletcher, R.; et al. Multi-Site Photoplethysmography Technology for Blood Pressure Assessment: Challenges Recommendations. J. Clin. Med. 2019, 8, 1827. [Google Scholar] [CrossRef] [PubMed] [Green Version]
- Sondej, T.; Jannasz, I.; Sieczkowski, K.; Dobrowolski, A.; Obiała, K.; Targowski, T.; Olszewski, R. Validation of a new device for photoplethysmographic measurement of multi-site arterial pulse wave velocity. Biocybern. Biomed. Eng. 2021, 41, 1664–1684. [Google Scholar] [CrossRef]
- Wang, Y.-J.; Chen, C.-H.; Sue, C.-Y.; Lu, W.-H.; Chiou, Y.-H. Estimation of Blood Pressure in the Radial Artery Using Strain-Based Pulse Wave Photoplethysmography Sensors. Micromachines 2018, 9, 556. [Google Scholar] [CrossRef] [Green Version]
- Andreozzi, E.; Gargiulo, G.D.; Esposito, D.; Bifulco, P. A Novel Broadband Forcecardiography Sensor for Simultaneous Monitoring of Respiration, Infrasonic Cardiac Vibrations and Heart Sounds. Front. Physiol. 2021, 12, 1–15. [Google Scholar] [CrossRef]
- Andreozzi, E.; Fratini, A.; Esposito, D.; Naik, G.; Polley, C.; Gargiulo, G.D.; Bifulco, P. Forcecardiography: A Novel Technique to Measure Heart Mechanical Vibrations onto the Chest Wall. Sensors 2020, 20, 3885. [Google Scholar] [CrossRef]
- Centracchio, J.; Andreozzi, E.; Esposito, D.; Gargiulo, G.D.; Bifulco, P. Detection of Aortic Valve Opening and Estimation of Pre-Ejection Period in Forcecardiography Recordings. Bioengineering 2022, 9, 89. [Google Scholar] [CrossRef]
- Andreozzi, E.; Centracchio, J.; Esposito, D.; Bifulco, P. A Comparison of Heart Pulsations Provided by Forcecardiography and Double Integration of Seismocardiogram. Bioengineering 2022, 9, 167. [Google Scholar] [CrossRef]
- Andreozzi, E.; Centracchio, J.; Punzo, V.; Esposito, D.; Polley, C.; Gargiulo, G.D.; Bifulco, P. Respiration Monitoring via Forcecardiography Sensors. Sensors 2021, 21, 3996. [Google Scholar] [CrossRef]
- Centracchio, J.; Andreozzi, E.; Esposito, D.; Gargiulo, G.D. Respiratory-Induced Amplitude Modulation of Forcecardiography Signals. Bioengineering 2022, 9, 444. [Google Scholar] [CrossRef] [PubMed]
- Esposito, D.; Andreozzi, E.; Fratini, A.; Gargiulo, G.; Savino, S.; Niola, V.; Bifulco, P. A Piezoresistive Sensor to Measure Muscle Contraction and Mechanomyography. Sensors 2018, 18, 2553. [Google Scholar] [CrossRef] [PubMed] [Green Version]
- Esposito, D.; Andreozzi, E.; Gargiulo, G.D.; Fratini, A.; D’Addio, G.; Naik, G.R.; Bifulco, P. A Piezoresistive Array Armband with Reduced Number of Sensors for Hand Gesture Recognition. Front. Neurorobot. 2020, 13, 114. [Google Scholar] [CrossRef] [PubMed] [Green Version]
- Esposito, D.; Centracchio, J.; Andreozzi, E.; Gargiulo, G.D.; Naik, G.R.; Bifulco, P. Biosignal-Based Human–Machine Interfaces for Assistance and Rehabilitation: A Survey. Sensors 2021, 21, 6863. [Google Scholar] [CrossRef]
- Esposito, D.; Gargiulo, G.D.; Parajuli, N.; Cesarelli, G.; Andreozzi, E.; Bifulco, P. Measurement of muscle contraction timing for prosthesis control: A comparison between electromyography and force-myography. In Proceedings of the 2020 IEEE Interna-tional Symposium on Medical Measurements and Applications (MeMeA), Bari, Italy, 1 June–1 July 2020. [Google Scholar] [CrossRef]
- Esposito, D.; Savino, S.; Andreozzi, E.; Cosenza, C.; Niola, V.; Bifulco, P. The “Federica” Hand. Bioengineering 2021, 8, 128. [Google Scholar] [CrossRef]
- Esposito, D.; Savino, S.; Cosenza, C.; Andreozzi, E.; Gargiulo, G.D.; Polley, C.; Cesarelli, G.; D’Addio, G.; Bifulco, P. Evaluation of Grip Force and Energy Efficiency of the “Federica” Hand. Machines 2021, 9, 25. [Google Scholar] [CrossRef]
- Esposito, D.; Cosenza, C.; Gargiulo, G.D.; Andreozzi, E.; Niola, V.; Fratini, A.; D’Addio, G.; Bifulco, P. Experimental study to improve “Federica” prosthetic hand and its control system. In Proceedings of the XV Mediterranean Conference on Medical and Biological Engineering and Computing—MEDICON 2019, Coimbra, Portugal, 26–28 September 2019; Henriques, J., Neves, N., de Carvalho, P., Eds.; Springer International Publishing: Coimbra, Portugal, 2020; pp. 586–593. [Google Scholar]
- Esposito, D.; Centracchio, J.; Andreozzi, E.; Savino, S.; Gargiulo, G.D.; Naik, G.R.; Bifulco, P. Design of a 3D-Printed Hand Exoskeleton Based on Force-Myography Control for Assistance and Rehabilitation. Machines 2022, 10, 57. [Google Scholar] [CrossRef]
- Sondej, T.; Sieczkowski, k.; Olszewski, R.; Dobrowolski, A. Simultaneous multi-site measurement system for the assessment of pulse wave delays. Biocybern. Biomed. Eng. 2019, 39, 488–502. [Google Scholar] [CrossRef]
- Savitzky, A.; Golay, M.J.E. Smoothing and Differentiation of Data by Simplified Least Squares Procedures. Anal. Chem. 1964, 36, 1627–1639. [Google Scholar] [CrossRef]
- Sedghamiz, H. BioSigKit: A Matlab Toolbox and Interface for Analysis of BioSignals. J. Open Source Softw. 2018, 3, 671. [Google Scholar] [CrossRef] [Green Version]
- Ran, Klein. Bland-Altman and Correlation Plot, MATLAB Central File Exchange. 2020. Available online: https://www.mathworks.com/matlabcentral/fileexchange/45049-bland-altman-and-correlation-plot (accessed on 28 May 2020).
- Rajala, S.; Ahmaniemi, T.; Lindholm, H.; Taipalus, T. Pulse arrival time (PAT) measurement based on arm ECG and finger PPG signals-comparison of PPG feature detection methods for PAT calculation. In Proceedings of the 2017 39th Annual International Conference of the IEEE Engineering in Medicine and Biology Society (EMBC), Jeju, Korea, 11–15 July 2017. [Google Scholar] [CrossRef]
- Lamotte, G.; Boes, C.J.; Low, P.A.; Coon, E.A. The expanding role of the cold pressor test: A brief history. Clin. Auton. Res. 2021, 31, 153–155. [Google Scholar] [CrossRef] [PubMed]
- Falkner, B.; Onesti, G.; Angelakos, E.T.; Fernandes, M.; Langman, C. Cardiovascular response to mental stress in normal adolescents with hypertensive parents. Hemodynamics and mental stress in adolescents. Hypertension 1979, 1, 23–30. [Google Scholar] [CrossRef] [PubMed] [Green Version]
- Gelfman, D.M. The Valsalva Maneuver, Set in Stone. Am. J. Med. 2021, 134, 823–824. [Google Scholar] [CrossRef] [PubMed]


| Subject | Gender | Age (Years) | Height (cm) | Weight (kg) | BMI |
|---|---|---|---|---|---|
| 1 | Male | 23 | 181 | 75 | 22.89 |
| 2 | Female | 27 | 175 | 63 | 20.57 |
| 3 | Male | 30 | 168 | 82 | 29.05 |
| 4 | Male | 26 | 183 | 133 | 39.71 |
| 5 | Male | 26 | 178 | 77 | 24.30 |
| Subject | Foot | Systolic Peak | Dicrotic Notch | Diastolic Peak | ||||
|---|---|---|---|---|---|---|---|---|
| PPG-R | PPG-IR | PPG-R | PPG-IR | PPG-R | PPG-IR | PPG-R | PPG-IR | |
| 1 | 163 ± 1.12 | 165 ± 1.15 | 168 ± 4.39 | 170 ± 4.77 | 166 ± 1.52 | 168 ± 1.33 | 164 ± 3.66 | 166 ± 3.94 |
| 2 | 162 ± 2.58 | 164 ± 2.18 | 162 ± 8.77 | 166 ± 11.3 | 167 ± 6.27 | 171 ± 6.36 | 167 ± 6.27 | 171 ± 6.36 |
| 3 | 163 ± 4.44 | 165 ± 4.53 | 174 ± 5.38 | 177 ± 6.17 | 178 ± 26.3 | 183 ± 26.3 | 166 ± 8.77 | 168 ± 8.61 |
| 4 | 165 ± 11.3 | 166 ± 15.7 | 170 ± 5.92 | 171 ± 5.72 | 169 ± 3.20 | 171 ± 2.91 | 167 ± 4.30 | 170 ± 4.03 |
| 5 | 164 ± 2.35 | 165 ± 2.42 | 165 ± 6.67 | 165 ± 5.79 | 163 ± 4.94 | 166 ± 4.99 | 162 ± 6.30 | 163 ± 6.47 |
| Subject | Original PW | First Derivative of PW | Second Derivative of PW |
|---|---|---|---|
| 1 | 0.991 ± 0.004 | 0.995 ± 0.003 | 0.995 ± 0.005 |
| 2 | 0.996 ± 0.005 | 0.994 ± 0.004 | 0.990 ± 0.007 |
| 3 | 0.983 ± 0.009 | 0.987 ± 0.007 | 0.991 ± 0.004 |
| 4 | 0.991 ± 0.007 | 0.988 ± 0.009 | 0.981 ± 0.012 |
| 5 | 0.989 ± 0.008 | 0.990 ± 0.007 | 0.984 ± 0.011 |
| Subject | Original PW | First Derivative of PW | Second Derivative of PW | |||
|---|---|---|---|---|---|---|
| NCC | Lag (ms) | NCC | Lag (ms) | NCC | Lag (ms) | |
| 1 | 0.991 | 167 | 0.991 | 163 | 0.991 | 161 |
| 2 | 0.990 | 163 | 0.990 | 161 | 0.986 | 161 |
| 3 | 0.981 | 168 | 0.981 | 162 | 0.984 | 160 |
| 4 | 0.975 | 165 | 0.974 | 165 | 0.970 | 166 |
| 5 | 0.981 | 165 | 0.980 | 161 | 0.975 | 160 |
| Subject | tup (ms) | ti (ms) | T (ms) | tup/T | h2/h1 | h3/h1 | |
|---|---|---|---|---|---|---|---|
| 1 | PPG-R | 136 ± 4.88 | 366 ± 7.47 | 965 ± 106 | 0.143 ± 0.0167 | 0.393 ± 0.0594 | 0.600 ± 0.0482 |
| PPG-IR | 137 ± 5.11 | 367 ± 7.46 | 965 ± 106 | 0.143 ± 0.0168 | 0.390 ± 0.0577 | 0.589 ± 0.0447 | |
| PIEZO | 131 ± 6.18 | 363 ± 7.48 | 965 ± 106 | 0.138 ± 0.0172 | 0.302 ± 0.0545 | 0.525 ± 0.0461 | |
| 2 | PPG-R | 122 ± 6.66 | 374 ± 7.35 | 995 ± 121 | 0.125 ± 0.0165 | 0.631 ± 0.0583 | 0.739 ± 0.0733 |
| PPG-IR | 125 ± 9.05 | 376 ± 7.59 | 995 ± 122 | 0.128 ± 0.0175 | 0.650 ± 0.0592 | 0.751 ± 0.0743 | |
| PIEZO | 123 ± 8.30 | 373 ± 9.09 | 995 ± 121 | 0.126 ± 0.0175 | 0.593 ± 0.0684 | 0.694 ± 0.0787 | |
| 3 | PPG-R | 127 ± 3.34 | 359 ± 8.45 | 894 ± 70.8 | 0.143 ± 0.0099 | 0.671 ± 0.0515 | 0.699 ± 0.0545 |
| PPG-IR | 129 ± 3.26 | 362 ± 8.17 | 894 ± 70.8 | 0.145 ± 0.0100 | 0.666 ± 0.0486 | 0.688 ± 0.0509 | |
| PIEZO | 119 ± 3.79 | 353 ± 9.17 | 894 ± 71.0 | 0.134 ± 0.0109 | 0.546 ± 0.0412 | 0.589 ± 0.0426 | |
| 4 | PPG-R | 121 ± 8.54 | 339 ± 11.4 | 863 ± 81.3 | 0.142 ± 0.0159 | 0.190 ± 0.0787 | 0.490 ± 0.110 |
| PPG-IR | 121 ± 7.96 | 340 ± 11.1 | 863 ± 81.2 | 0.142 ± 0.0158 | 0.185 ± 0.0754 | 0.488 ± 0.104 | |
| PIEZO | 125 ± 10.9 | 335 ± 12.5 | 863 ± 80.7 | 0.146 ± 0.0198 | 0.137 ± 0.0809 | 0.505 ± 0.0549 | |
| 5 | PPG-R | 131 ± 6.60 | 334 ± 8.09 | 903 ± 92.9 | 0.147 ± 0.0165 | 0.531 ± 0.0842 | 0.685 ± 0.0530 |
| PPG-IR | 130 ± 5.28 | 335 ± 7.94 | 903 ± 93.0 | 0.145 ± 0.0156 | 0.510 ± 0.0762 | 0.659 ± 0.0502 | |
| PIEZO | 130 ± 4.39 | 334 ± 8.35 | 903 ± 92.8 | 0.145 ± 0.0153 | 0.434 ± 0.0659 | 0.583 ± 0.0472 |
| Subject | Parameter | tup | ti | T | tup/T | h2/h1 | h3/h1 | ||||||
|---|---|---|---|---|---|---|---|---|---|---|---|---|---|
| R | IR | R | IR | R | IR | R | IR | R | IR | R | IR | ||
| 1 | Slope | 0.910 | 0.820 | 0.975 | 0.980 | 1.000 | 1.000 | 0.996 | 0.980 | 0.868 | 0.879 | 0.905 | 0.945 |
| Intercept | 7.13 | 19.2 | 6.21 | 3.7 | −0.377 | −0.632 | −0.005 | −0.003 | −0.039 | −0.041 | −0.018 | −0.031 | |
| R2 | 0.516 | 0.46 | 0.949 | 0.955 | 1.000 | 1.000 | 0.928 | 0.916 | 0.893 | 0.866 | 0.894 | 0.839 | |
| Bias | −5.18 | −5.39 | −2.90 | −3.63 | NS | NS | −0.005 | −0.006 | −0.091 | −0.088 | −0.075 | −0.064 | |
| p-value | c | c | c | c | 0.885 | 0.890 | c | c | c | c | c | c | |
| LoAs | ±8.47 | ±9.08 | ±3.34 | ±3.13 | ±2.92 | ±3.05 | ±0.009 | ±0.01 | ±0.04 | ±0.04 | ±0.03 | ±0.04 | |
| 2 | Slope | 0.260 | 0.0765 | 1.01 | 0.966 | 0.993 | 0.995 | 0.886 | 0.769 | 0.913 | 0.869 | 0.751 | 0.739 |
| Intercept | 91.3 | 113 | −4.78 | 10.4 | 6.80 | 4.90 | 0.015 | 0.027 | 0.017 | 0.029 | 0.139 | 0.139 | |
| R2 | 0.044 | 0.007 | 0.671 | 0.651 | 1.000 | 1.000 | 0.695 | 0.590 | 0.606 | 0.564 | 0.489 | 0.487 | |
| Bias | 0.774 | −2.24 | −0.415 | −2.45 | NS | NS | 0.001 | −0.002 | −0.037 | −0.056 | −0.045 | −0.057 | |
| p-value | a | c | a | c | 0.955 | 0.964 | a | c | c | c | c | c | |
| LoAs | 18.6 | 23.1 | 10.2 | 10.5 | 4.44 | 4.19 | 0.019 | 0.023 | 0.085 | 0.090 | 0.116 | 0.117 | |
| 3 | Slope | 0.632 | 0.501 | 0.956 | 0.982 | 1.00 | 1.00 | 1.04 | 1.01 | 0.644 | 0.689 | 0.689 | 0.738 |
| Intercept | 38.6 | 54.2 | 9.88 | −2.67 | −2.3 | −2.51 | −0.015 | −0.013 | 0.114 | 0.088 | 0.108 | 0.082 | |
| R2 | 0.31 | 0.186 | 0.778 | 0.767 | 1.000 | 1.000 | 0.897 | 0.867 | 0.65 | 0.661 | 0.78 | 0.779 | |
| Bias | −8.25 | −10.1 | −5.86 | −9.15 | NS | NS | −0.009 | −0.011 | −0.125 | −0.12 | −0.109 | −0.099 | |
| p-value | c | c | c | c | 0.957 | 0.953 | c | c | c | c | c | c | |
| LoAs | 6.62 | 7.42 | 8.5 | 8.68 | 2.62 | 2.44 | 0.007 | 0.008 | 0.060 | 0.056 | 0.051 | 0.047 | |
| 4 | Slope | 0.98 | 1.1 | 1.02 | 1.07 | 0.993 | 0.993 | 1.15 | 1.17 | 0.949 | 1 | 0.465 | 0.493 |
| Intercept | 5.9 | −7.94 | −12.6 | −27.2 | 6.25 | 5.89 | −0.017 | −0.020 | −0.043 | −0.048 | 0.277 | 0.264 | |
| R2 | 0.589 | 0.639 | 0.873 | 0.896 | 0.999 | 0.999 | 0.852 | 0.877 | 0.852 | 0.872 | 0.877 | 0.877 | |
| Bias | 3.48 | 3.61 | −4.38 | −4.95 | 0.0523 | 0.0392 | 0.004 | 0.005 | −0.053 | −0.048 | 0.014 | 0.016 | |
| p-value | c | c | c | c | 0.808 | 0.860 | c | c | c | c | c | c | |
| LoAs | 13.7 | 12.9 | 8.75 | 8.05 | 5.22 | 5.38 | 0.016 | 0.015 | 0.062 | 0.057 | 0.122 | 0.110 | |
| 5 | Slope | 0.248 | 0.302 | 0.835 | 0.845 | 0.998 | 0.997 | 0.836 | 0.905 | 0.74 | 0.815 | 0.794 | 0.822 |
| Intercept | 97.3 | 90.7 | 55.5 | 51.3 | 1.93 | 2.53 | 0.0225 | 0.0142 | 0.0411 | 0.0186 | 0.0387 | 0.041 | |
| R2 | 0.14 | 0.132 | 0.655 | 0.646 | 0.999 | 0.999 | 0.812 | 0.847 | 0.893 | 0.887 | 0.794 | 0.766 | |
| Bias | −1.28 | NS | NS | −0.768 | NS | NS | −0.001 | 0.0004 | −0.097 | −0.076 | −0.103 | −0.076 | |
| p-value | a | 0.247 | 0.190 | a | 0.940 | 0.956 | b | 0.278 | c | c | c | c | |
| LoAs | 12.6 | 10.8 | 9.96 | 10 | 6.26 | 6.45 | 0.014 | 0.012 | 0.060 | 0.051 | 0.047 | 0.048 | |
| Parameter | tup | ti | T | tup/T | h2/h1 | h3/h1 | ||||||
|---|---|---|---|---|---|---|---|---|---|---|---|---|
| R | IR | R | IR | R | IR | R | IR | R | IR | R | IR | |
| Slope | 0.472 | 0.304 | 1.010 | 0.989 | 0.996 | 0.997 | 0.887 | 0.868 | 0.999 | 0.969 | 0.788 | 0.784 |
| Intercept | 65.5 | 86.1 | −5.78 | 0.762 | 4.10 | 3.06 | 0.014 | 0.015 | −0.062 | −0.051 | 0.087 | 0.090 |
| R2 | 0.210 | 0.098 | 0.921 | 0.915 | 1.000 | 1.000 | 0.775 | 0.711 | 0.905 | 0.927 | 0.680 | 0.736 |
| Bias | −0.915 | −2.52 | −1.48 | −3.24 | NS | NS | −0.001 | −0.003 | −0.063 | −0.069 | −0.059 | −0.059 |
| p-value | c | c | c | c | 0.919 | 0.934 | c | c | c | c | c | c |
| LoAs | ±16.8 | ±19.5 | ±10.2 | ±10.5 | ±4.55 | ±4.48 | ±0.018 | ±0.020 | ±0.096 | ±0.085 | ±0.117 | ±0.109 |
Publisher’s Note: MDPI stays neutral with regard to jurisdictional claims in published maps and institutional affiliations. |
© 2022 by the authors. Licensee MDPI, Basel, Switzerland. This article is an open access article distributed under the terms and conditions of the Creative Commons Attribution (CC BY) license (https://creativecommons.org/licenses/by/4.0/).
Share and Cite
Andreozzi, E.; Sabbadini, R.; Centracchio, J.; Bifulco, P.; Irace, A.; Breglio, G.; Riccio, M. Multimodal Finger Pulse Wave Sensing: Comparison of Forcecardiography and Photoplethysmography Sensors. Sensors 2022, 22, 7566. https://doi.org/10.3390/s22197566
Andreozzi E, Sabbadini R, Centracchio J, Bifulco P, Irace A, Breglio G, Riccio M. Multimodal Finger Pulse Wave Sensing: Comparison of Forcecardiography and Photoplethysmography Sensors. Sensors. 2022; 22(19):7566. https://doi.org/10.3390/s22197566
Chicago/Turabian StyleAndreozzi, Emilio, Riccardo Sabbadini, Jessica Centracchio, Paolo Bifulco, Andrea Irace, Giovanni Breglio, and Michele Riccio. 2022. "Multimodal Finger Pulse Wave Sensing: Comparison of Forcecardiography and Photoplethysmography Sensors" Sensors 22, no. 19: 7566. https://doi.org/10.3390/s22197566