
Characterization of Open-Ended Coaxial Probe Sensing Depth with Respect to Aperture Size for Dielectric Property Measurement of Heterogeneous Tissues


Abstract
:1. Introduction
- To define the SDs of OECPs with small radii to enable the selection of appropriate probes during the DP characterization of highly heterogeneous, skin-like tissues composed of multiple thin layers;
- To form an SD definition via the examination of the three different percentage change thresholds in retrieved/measured DPs for different probe dimensions;
- To investigate the significance of tissue layers located immediately at the probe aperture during SD characterization—e.g., how thin and high DP contrast layers positioned on top of the tissue affect the probe SD.
2. Materials and Methods
2.1. Simulation Configuration
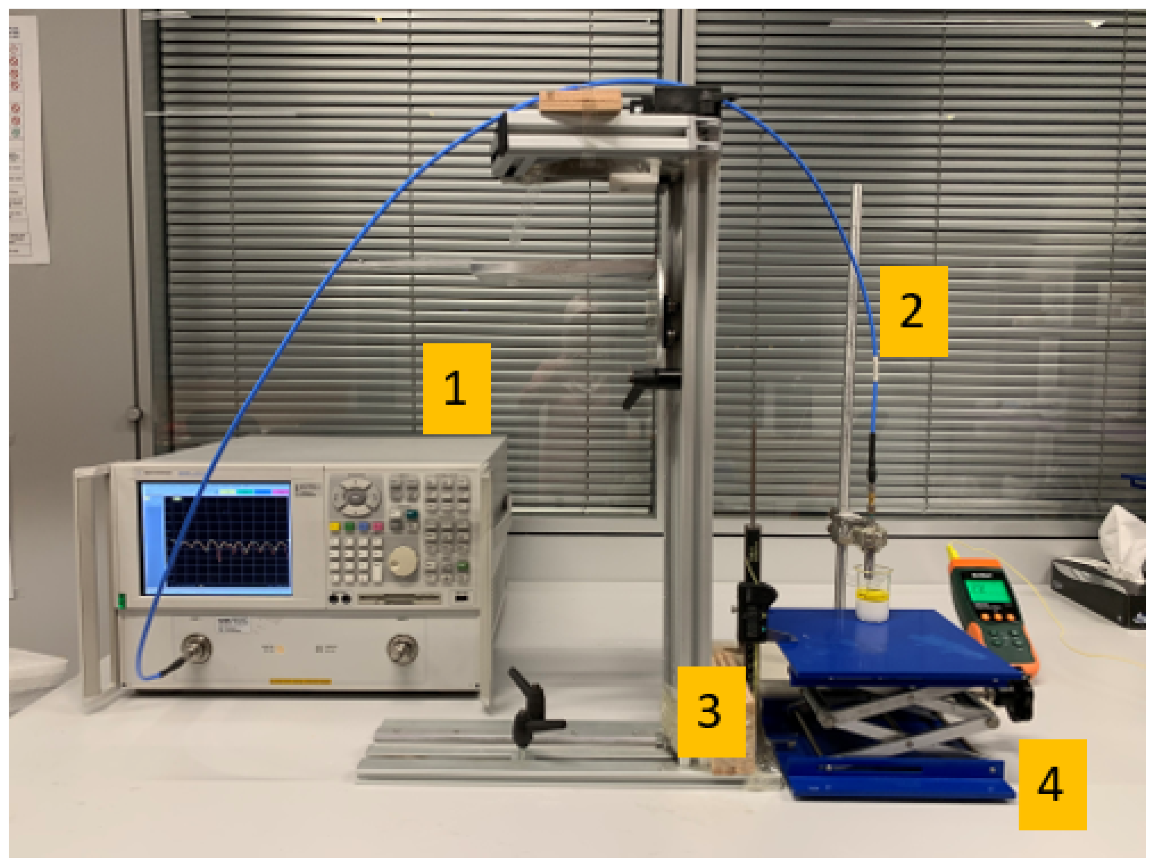
2.2. Experiment Setup
2.3. Measurement Samples and Protocol
3. Results
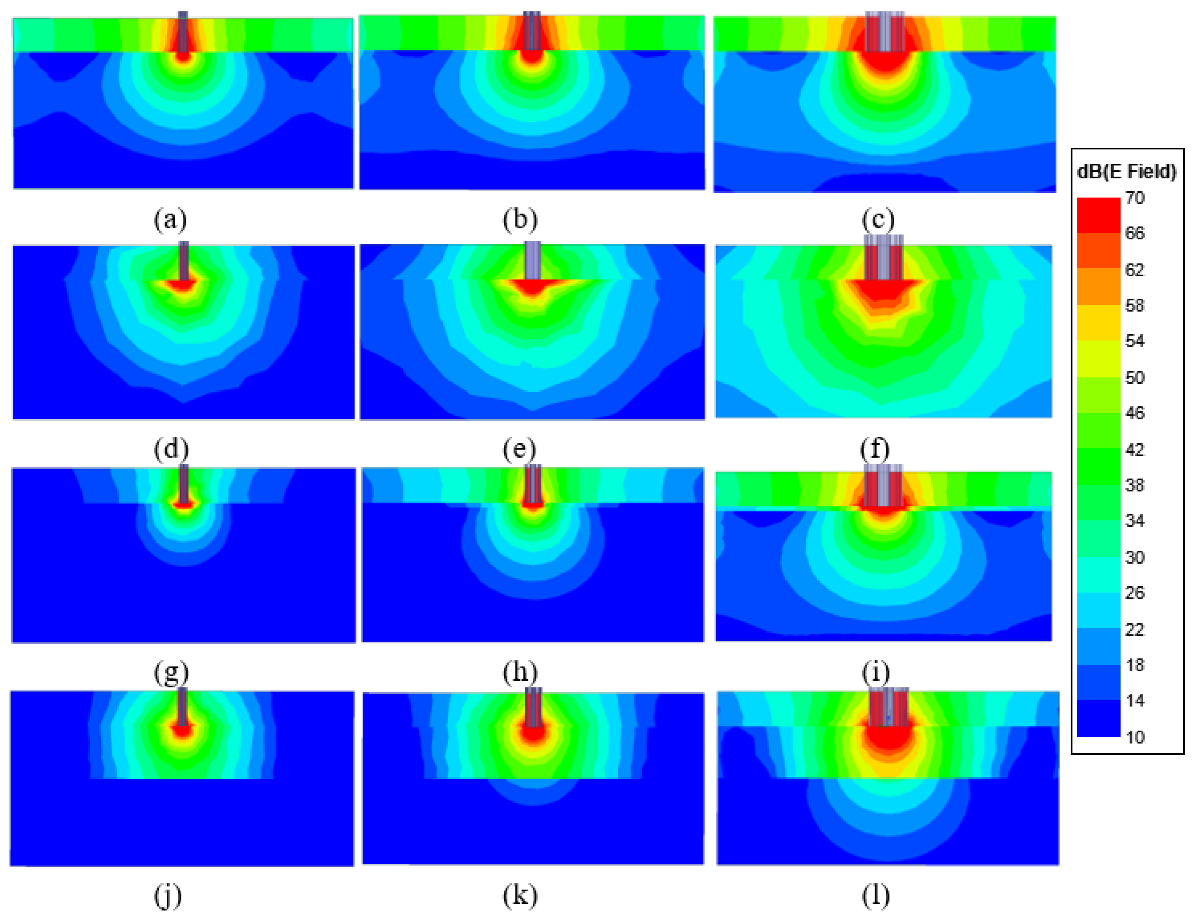
3.1. Electric Field Distribution
3.2. Simulation with 2.2 mm Diameter Probe and Experimental Results
3.3. Simulation Results for 0.9 mm-Diameter Probe
3.4. Simulation Results for 0.5 mm-Diameter Probe
4. Discussion
5. Conclusions
Author Contributions
Funding
Institutional Review Board Statement
Informed Consent Statement
Data Availability Statement
Conflicts of Interest
References
- Gabriel, C.; Gabriel, S.; Corthout, Y.E. The dielectric properties of biological tissues: I. Literature survey. Phys. Med. Biol. 1996, 41, 2231. [Google Scholar] [CrossRef] [PubMed] [Green Version]
- Jafary-Asl, A.; Smith, C. Biological dielectrics in electric and magnetic fields. In Proceedings of the Conference on Electrical Insulation & Dielectric Phenomena-Annual Report 1983, Buck Hill Falls, PA, USA, 1 October 1983; pp. 350–355. [Google Scholar]
- Yilmaz, T.; Ates Alkan, F. In vivo dielectric properties of healthy and benign rat mammary tissues from 500 MHz to 18 GHz. Sensors 2020, 20, 2214. [Google Scholar] [CrossRef] [PubMed] [Green Version]
- Lazebnik, M.; Popovic, D.; McCartney, L.; Watkins, C.B.; Lindstrom, M.J.; Harter, J.; Sewall, S.; Ogilvie, T.; Magliocco, A.; Breslin, T.M.; et al. A large-scale study of the ultrawideband microwave dielectric properties of normal, benign and malignant breast tissues obtained from cancer surgeries. Phys. Med. Biol. 2007, 52, 6093. [Google Scholar] [CrossRef] [PubMed]
- Yilmaz, T.; Kılıç, M.A.; Erdoğan, M.; Çayören, M.; Tunaoğlu, D.; Kurtoğlu, İ.; Yaslan, Y.; Çayören, H.; Arıkan, A.E.; Teksöz, S.; et al. Machine learning aided diagnosis of hepatic malignancies through in vivo dielectric measurements with microwaves. Phys. Med. Biol. 2016, 61, 5089. [Google Scholar] [CrossRef] [PubMed]
- Mirbeik-Sabzevari, A.; Ashinoff, R.; Tavassolian, N. Ultra-wideband millimeter-wave dielectric characteristics of freshly excised normal and malignant human skin tissues. IEEE Trans. Biomed. Eng. 2017, 65, 1320–1329. [Google Scholar] [CrossRef] [PubMed]
- Mohammed, B.; Naqvi, S.; Manoufali, M.; Bialkowski, K.; Abbosh, A. Changes in epidermal dielectric properties due to skin cancer across the band 1 to 50 GHz. In Proceedings of the 2018 Australian Microwave Symposium (AMS), Brisbane, Australia, 6–7 February 2018; pp. 77–78. [Google Scholar]
- Hwang, H.; Yim, J.; Cho, J.W.; Cheon, C.; Kwon, Y. 110 GHz broadband measurement of permittivity on human epidermis using 1 mm coaxial probe. In Proceedings of the IEEE MTT-S International Microwave Symposium Digest, Philadelphia, PA, USA, 8–13 June 2003; Volume 1, pp. 399–402. [Google Scholar]
- La Gioia, A.; Porter, E.; Merunka, I.; Shahzad, A.; Salahuddin, S.; Jones, M.; O’Halloran, M. Open-ended coaxial probe technique for dielectric measurement of biological tissues: Challenges and common practices. Diagnostics 2018, 8, 40. [Google Scholar] [CrossRef] [PubMed] [Green Version]
- Hagl, D.M.; Popovic, D.; Hagness, S.C.; Booske, J.H.; Okoniewski, M. Sensing volume of open-ended coaxial probes for dielectric characterization of breast tissue at microwave frequencies. IEEE Trans. Microw. Theory Tech. 2003, 51, 1194–1206. [Google Scholar] [CrossRef] [Green Version]
- Meaney, P.M.; Gregory, A.P.; Seppälä, J.; Lahtinen, T. Open-ended coaxial dielectric probe effective penetration depth determination. IEEE Trans. Microw. Theory Tech. 2016, 64, 915–923. [Google Scholar] [CrossRef] [PubMed] [Green Version]
- La Gioia, A.; Santorelli, A.; O’Halloran, M.; Porter, E. Predicting the Sensing Radius of a Coaxial Probe Based on the Probe Dimensions. IEEE Trans. Antennas Propag. 2020, 68, 6704–6716. [Google Scholar] [CrossRef]
- Aydinalp, C.; Joof, S.; Yilmaz, T. Towards Non-Invasive Diagnosis of Skin Cancer: Sensing Depth Investigation of Open-Ended Coaxial Probes. Sensors 2021, 21, 1319. [Google Scholar] [CrossRef] [PubMed]
- Aydinalp, C.; Joof, S.; Yilmaz, T. Towards Accurate Microwave Characterization of Tissues: Sensing Depth Analysis of Open-Ended Coaxial Probes with Ex Vivo Rat Breast and Skin Tissues. Diagnostics 2021, 11, 338. [Google Scholar] [CrossRef]
- Alekseev, S.; Ziskin, M. Human skin permittivity determined by millimeter wave reflection measurements. Bioelectromagnetics 2007, 28, 331–339. [Google Scholar] [CrossRef]
- Šegatin, N.; Pajk Žontar, T.; Poklar Ulrih, N. Dielectric Properties and Dipole Moment of Edible Oils Subjected to ‘Frying’Thermal Treatment. Foods 2020, 9, 900. [Google Scholar] [CrossRef] [PubMed]
- Aydinalp, C.; Joof, S.; Yilmaz, T. Sensing depth analysis of open-ended coaxial probe for skin cancer detection. In Proceedings of the 2019 23rd International Conference on Applied Electromagnetics and Communications (ICECOM), Dubrovnik, Croatia, 30 September–2 October 2019; pp. 1–5. [Google Scholar]
- Porter, E.; O’Halloran, M. Investigation of histology region in dielectric measurements of heterogeneous tissues. IEEE Trans. Antennas Propag. 2017, 65, 5541–5552. [Google Scholar] [CrossRef] [Green Version]


| Outer Radius (mm) | Inner Radius (mm) | Dielectric Type | |
|---|---|---|---|
| 0.25 | 0.075 | PTFE | 2.1 |
| 0.45 | 0.134 | ||
| 1.1 | 0.328 |
| Layers | Materials | Relative Permittivity () | Conductivity (S/m) |
|---|---|---|---|
| First layer [15] | Skin | 32.89 | 2.29 |
| Second Layer [16] | Olive oil | 3.00 | 0.04 |
| Materials | Relative Permittivity () | Conductivity (S/m) |
|---|---|---|
| Skin | 34.17 | 4.00 |
| Olive oil | 2.67 | 0.02 |
| Frequency | Thickness for 5% Increase | Thickness for 20% Increase | Thickness for 80% Increase |
|---|---|---|---|
| 0.5 | 1 | 0.86 | 0.36 |
| 2 | 0.76 | 0.56 | 0.26 |
| 4 | 0.71 | 0.46 | 0.21 |
| 10 | 0.66 | 0.41 | 0.21 |
| 20 | 0.66 | 0.36 | 0.16 |
| Frequency | Thickness for 5% Increase | Thickness for 20% Increase | Thickness for 80% Increase |
|---|---|---|---|
| 0.5 | 0.81 | 0.67 | 0.22 |
| 2 | 0.81 | 0.67 | 0.22 |
| 4 | 0.81 | 0.67 | 0.22 |
| 6 | 0.81 | 0.67 | 0.20 |
| 8 | 0.81 | 0.67 | 0.22 |
| Frequency | Thickness for 5% Increase | Thickness for 20% Increase | Thickness for 80% Increase |
|---|---|---|---|
| 0.5 | 0.66 | 0.21 | 0.11 |
| 2 | 0.56 | 0.26 | 0.11 |
| 4 | 0.56 | 0.21 | 0.11 |
| 10 | 0.56 | 0.21 | 0.11 |
| 20 | 0.51 | 0.21 | 0.06 |
| Frequency | Thickness for 5% Increase | Thickness for 20% Increase | Thickness for 80% Increase |
|---|---|---|---|
| 0.5 | 0.31 | 0.11 | 0.06 |
| 2 | 0.31 | 0.16 | 0.06 |
| 4 | 0.31 | 0.11 | 0.06 |
| 10 | 0.31 | 0.11 | 0.06 |
| 20 | 0.31 | 0.11 | 0.06 |
| Study | Definition | Type | Aper. Size (mm) | Sam. Config. | Sample’s | Depth (mm) |
|---|---|---|---|---|---|---|
| [8] | “Proper thickness of target-sample” is the thickness of the target sample where the influence of the non-targeted region is no longer sensed by the probe. | Exp. | 1.0 | Porcine muscle–porcine fat | Porcine muscle = ∼52 porcine fat = ∼8 at 0.5 GHz. | 1.0 |
| 3.0 | 3.0 | |||||
| [10] | “Sensing volume” was defined by monitoring the changes in the between ±0.5–±1.0 error which is ±10% error in terms of the and . | Sim. | 2.2 | Glass–ethanol | Glass = 4.82, ethanol = 9.6, methanol = 24.2, d.water = 79.2 at 3 GHz. Below the glass beaker, there is an epoxy stand = 4.0 at 5 GHz. | 0.5–1.0 |
| Glass–methanol | 1.0–1.5 | |||||
| Glass–d.water | 1.25–1.5 | |||||
| 3.58 | Glass–ethanol | 1.0–1.5 | ||||
| Glass–methanol | ∼1.75 | |||||
| Glass–d.water | ∼2.5 | |||||
| Exp. | 2.2 | Glass–ethanol | 0.75–1.0 | |||
| Glass–methanol | 1.0–1.5 | |||||
| Glass–d.water | ∼1.5 | |||||
| 3.58 | Glass–ethanol | 1.25–1.5 | ||||
| Glass–methanol | ∼2.25 | |||||
| Glass–d.water | ∼2.5–3.0 | |||||
| [11] | “Effective penetration depth” was defined a when 20% error is observed between the measured and expected linearly changing . | Sim | 1.19 | Acrylic–0.9% saline | Acrylic = 3.0 0.9% saline = 78.1 d.water = 78.8 at 2 GHz. | 0.158 |
| 3.58 | 0.483 | |||||
| 6.35 | 0.866 | |||||
| Exp. | 18.0 | Acrylic–d.water | 1.84 | |||
| 21.0 | 2.74 | |||||
| 2.16 | Teflon–d.water | Teflon = 2.1 d.water = 78.8 at 2 GHz. | 0.28 | |||
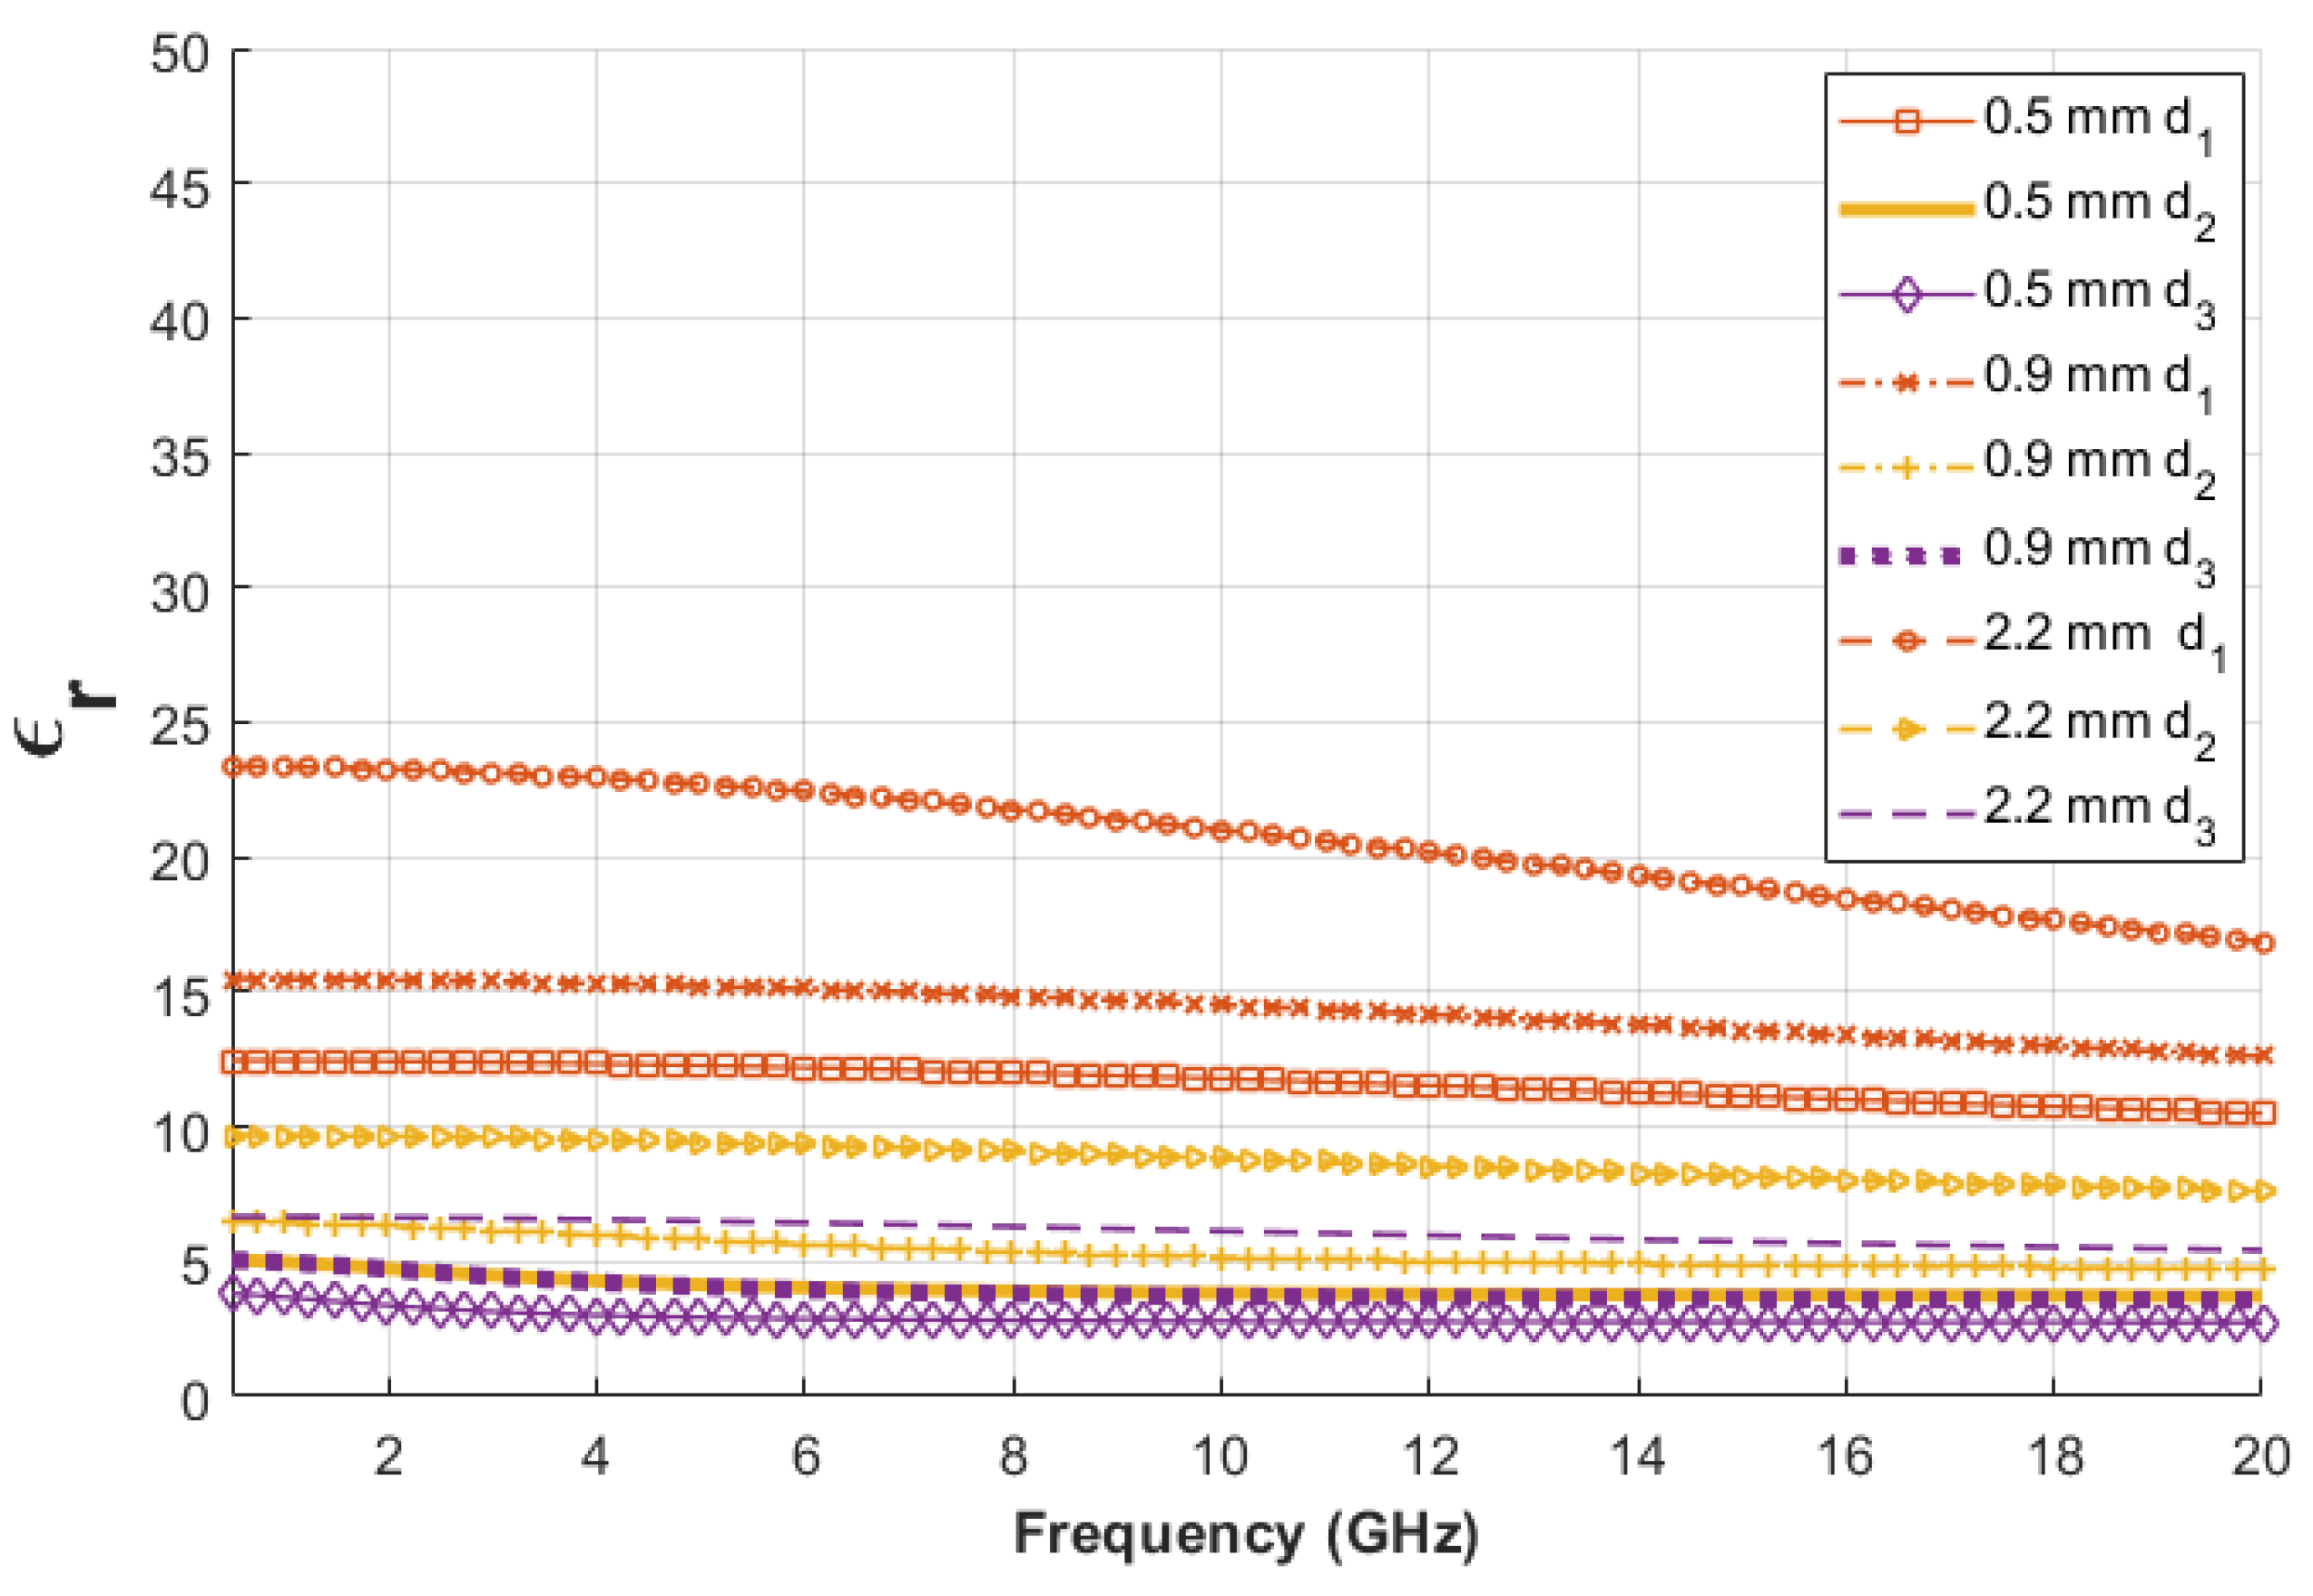
| This work | “Sensing depth” is defined as when 5% change in the targeted is observed. | Sim. | 2.2 | Skin tissue–olive oil | Skin tissue = 32.89, olive oil = 3.0 at 4 GHz | 0.71 |
| 0.9 | 0.56 | |||||
| 0.5 | 0.31 | |||||
| Exp. | 2.2 | Skin-mimicking phantom–olive oil | Skin-mimicking phantom = 34.7, olive oil = 2.67 at 4 GHz | 0.81 |
| Probe Aperture (mm) | Thickness for 5% Increase | Thickness for 20% Increase | Thickness for 80% Increase |
|---|---|---|---|
| 0.5 | 0.31 | 0.11 | 0.06 |
| 0.9 | 0.56 | 0.21 | 0.11 |
| 2.2 | 0.71 | 0.46 | 0.21 |
| Thickness (mm) | Relative Permittivity () | ||
|---|---|---|---|
| 0.5 mm Probe | 0.9 mm Probe | 2.2 mm Probe | |
| 0.01 | 12.34 | 15.32 | 22.95 |
| 0.06 | 4.29 | 5.98 | 9.52 |
| 0.11 | 3.02 | 4.24 | 6.56 |
Publisher’s Note: MDPI stays neutral with regard to jurisdictional claims in published maps and institutional affiliations. |
© 2022 by the authors. Licensee MDPI, Basel, Switzerland. This article is an open access article distributed under the terms and conditions of the Creative Commons Attribution (CC BY) license (https://creativecommons.org/licenses/by/4.0/).
Share and Cite
Aydinalp, C.; Joof, S.; Dilman, I.; Akduman, I.; Yilmaz, T. Characterization of Open-Ended Coaxial Probe Sensing Depth with Respect to Aperture Size for Dielectric Property Measurement of Heterogeneous Tissues. Sensors 2022, 22, 760. https://doi.org/10.3390/s22030760
Aydinalp C, Joof S, Dilman I, Akduman I, Yilmaz T. Characterization of Open-Ended Coaxial Probe Sensing Depth with Respect to Aperture Size for Dielectric Property Measurement of Heterogeneous Tissues. Sensors. 2022; 22(3):760. https://doi.org/10.3390/s22030760
Chicago/Turabian StyleAydinalp, Cemanur, Sulayman Joof, Ismail Dilman, Ibrahim Akduman, and Tuba Yilmaz. 2022. "Characterization of Open-Ended Coaxial Probe Sensing Depth with Respect to Aperture Size for Dielectric Property Measurement of Heterogeneous Tissues" Sensors 22, no. 3: 760. https://doi.org/10.3390/s22030760