Communication

A Three-Reagent “Green” Paper-Based Analytical Device for Solid-Phase Spectrometric and Colorimetric Determination of Dihydroquercetin

by
Vladimir V. Apyari
1,*,
Aleksei A. Furletov
1,
Vyacheslav I. Kalinin
1,
Stanislava G. Dmitrienko
1 and
Yury A. Zolotov
1,2
1
Department of Chemistry, Lomonosov Moscow State University, Leninskie Gory, 1/3, 119991 Moscow, Russia
2
Kurnakov Institute of General and Inorganic Chemistry, Russian Academy of Sciences, Leninsky Avenue, 31, 119991 Moscow, Russia
*
Author to whom correspondence should be addressed.
Sensors 2022, 22(8), 2893; https://doi.org/10.3390/s22082893
Submission received: 1 March 2022 / Revised: 25 March 2022 / Accepted: 7 April 2022 / Published: 9 April 2022
(This article belongs to the Special Issue Sensors and Actuators in Microfluidic Devices for Analysis)

Abstract

:
Microfluidic paper-based analytical devices (µPADs) represent one of the promising green analytical strategies for low-cost and simple determination of various analytes. The actual task is the development of such devices for quantitation of antioxidants, e.g., flavonoids. In this paper, possibilities of a novel three-reagent µPAD including silver nitrate, 4-nitrophenyldiazonium tetrafluoroborate, and iron(III) chloride as reagents are assessed with respect to the determination of dihydroquercetin. It is shown that all the three reagents produce different colorimetric responses that can be detected by a mini-spectrophotometer–monitor calibrator or by a smartphone. The method is applicable to direct measuring high contents of dihydroquercetin (the linearity range is 0.026–1 mg mL−1, and the limit of detection is 7.7 µg mL−1), which is favorable for many dietary supplements. The analysis of a food supplement was possible with the relative standard deviations of 9–26%, which is satisfactory for quantitative and semiquantitative determinations. It was found that plotting a calibration graph in 3D space of the three reagents’ responses allows us to distinguish dihydroquercetin from its close structural analogue, quercetin.

1. Introduction

Microfluidic paper-based analytical devices (µPADs) have attracted a lot of attention due to the wide prospects for their application in many areas of science and technology—in medicine, diagnostics, environmental monitoring, food processing, agriculture, and other fields [1,2,3,4,5,6,7,8,9,10,11]. The most important advantages of µPADs are the absence of any pumps, small sample volume, rapid analysis, an ability of naked eye detection, low cost, ease of use, compactness, and biodegradability. The hydrophilic fibrillar structure of paper not only allows for the solution to move without the use of a pump, but also provides a filtering ability, which, in some cases, makes it possible to use such systems for samples with a complex matrix [12]. Often, µPADs are needed as a screening analytical tool to identify samples that should be subjected to a deeper study.
One of the actual practical applications of µPADs is the determination of biologically active substances. Antioxidants, such as flavonoids, are among them. To date, a number of analytical methods have been developed for the determination of flavonoids, such as HPLC [13,14,15,16,17,18], gas chromatography [19,20], capillary electrophoresis [21,22,23], voltammetry [24,25,26], and spectrophotometry [27,28,29,30,31].
The widespread occurrence and pronounced biological activity of flavonoids make it important to develop simple and inexpensive methods for their determination, suitable for large-scale use. At the same time, the variety of emerging practical problems stimulates the search for options of simple optimization of the analytical system architecture for a specific analysis, which, in our opinion, can be implemented by combining its separate, pre-produced parts. This idea has found its implementation in a concept of composable paper-based analytical devices, which can be assembled in a required architecture using several pre-made paper parts [32].
Within this concept, we present here a novel three-reagent paper-based analytical device for solid-phase spectrometric and colorimetric determination of dihydroquercetin.

2. Materials and Methods

2.1. Reagents

The following reagents were used: silver nitrate (PZTsM-Vtormet, Moscow, Russia, analytical grade), sodium hydroxide (Reachim, Moscow, Russia, reagent grade), iron(III) chloride (Acros Organics, 98%), 4-nitrophenyldiazonium tetrafluoroborate (4-NPD) (synthesized according to [33]), dihydroquercetin (Flamena, Moscow, Russia, analytical grade), and quercetin dihydrate (Sigma-Aldrich, St. Louis, MO, USA, ≥98% (HPLC)). Working solutions of flavonoids were prepared using ethanol (Komponent-Reactive, Moscow, Russia, reagent grade). To check the interfering effect, salts were used: NaCl (reagent grade), KCl (reagent grade), Na2SO4 (reagent grade), and Ca(NO3)2 (reagent grade).
Microfluidic systems were assembled from pre-made paper elements, which were Whatman Grade 1 filters with a diameter of 10 mm, on double-sided tape (Unibob).

2.2. Instruments

Diffuse reflectance spectra in the visible spectral range were recorded on an i1Pro2 mini-spectrophotometer (X-Rite, Grand Rapids, MI, USA). Photographs of the samples were taken using an iPhone 10 smartphone (Apple, Cupertino, CA, USA). Chromatograms of the samples were recorded using a Tsvet Yauza liquid chromatograph (NPO Khimavtomatika, Voronezh, Russia) with an amperometric detector (E = 1.3 V). A chromatographic column Luna C18 (Phenomenex, Torrance, CA, USA) was used. The mobile phase consisted of acetonitrile: 0.1% aqueous solution of H3PO4 (25:75). The sample volume was 20 μL; the sample was injected using a dispenser loop. The flow rate was 0.4 mL min−1. Deionized water was obtained using a Simplicity purification system (Millipore, Burlington, MA, USA). A mechanical shaker was used for mixing. The drying of samples was carried out on a household electric hot plate.

2.3. Procedures

To construct a microfluidic system, double-sided tape was attached to a transparent polymer plate. Then, three paper elements were appropriately placed to prepare the detection zones, and the reagents were applied to them as follows: (1) 40 μL of 20 mM FeCl3 solution in ethanol; (2) 40 μL of 10 mM 4-NPD solution in 80% ethanol; and (3) 40 μL of 10 mM AgNO3 aqueous solution followed by drying on an electric hot plate at ~80 °C and addition of 40 μL of 1 mM NaOH aqueous solution. The microfluidic system was dried at ~80 °C. Then, a loading paper zone was fixed on the scotch tape between all the three detection zones so that the intersection of the loading zone with each detection zone was about 1 mm.
The as-prepared microfluidic system was used for the determination of dihydroquercetin as follows. An 80 µL aliquot of dihydroquercetin solution in ethanol (from 0 to 1.2 mg mL−1) or an analyzed sample was applied to the loading zone. Then, the system was dried in air.
Finally, diffuse reflectance spectra of each colored detection zone were recorded using the mini-spectrophotometer as follows. The microfluidic system was placed on a dense paper sheet, the target of the mini-spectrophotometer, previously calibrated against a standard white sample, was placed on the detection zone, and the reflection coefficients were measured.
The spectra were plotted in coordinates of the Kubelka–Munk function (F) versus wavelength (λ, nm). F values were calculated using the formula F(R) = (1 − R)2/(2R), where R is the diffuse reflection coefficient at a given wavelength. In some cases, normalized diffuse reflectance spectra were calculated dividing the Kubelka–Munk function meanings (F) at each λ by the maximum of them (Fmax); they were designated as F/Fmax. To obtain a function proportional to the concentration of dihydroquercetin, ΔF = F − F0 was calculated; here, F0 is the Kubelka–Munk function measured for the blank.

3. Results and Discussion

The concept of composable µPADs [32] was applied in this study to develop a method for the determination of dihydroquercetin. This concept implies designing a microfluidic system of a certain architecture for solving a particular analytical problem from ready-made elements that are fixed on an adhesive substrate. This approach allows for easy and quick assembling and changing the system architecture, depending on the task. Cut paper parts do not require waxing or 3D printing. Unused items can be saved for later applications, reducing the cost of analysis. For the manufacturing of paper elements, pre-fabricated Whatman Grade 1 disc filters with a diameter of 10 mm were used. Double-sided tape on a polymer plate was used as an adhesive substrate. Paper elements were fixed on it to provide three independent microfluidic branches with a common central loading zone. A slight overlap (about 1 mm) was made between the loading zone and each of the three detection zones to ensure the transition of liquid from one element to another (Figure 1).

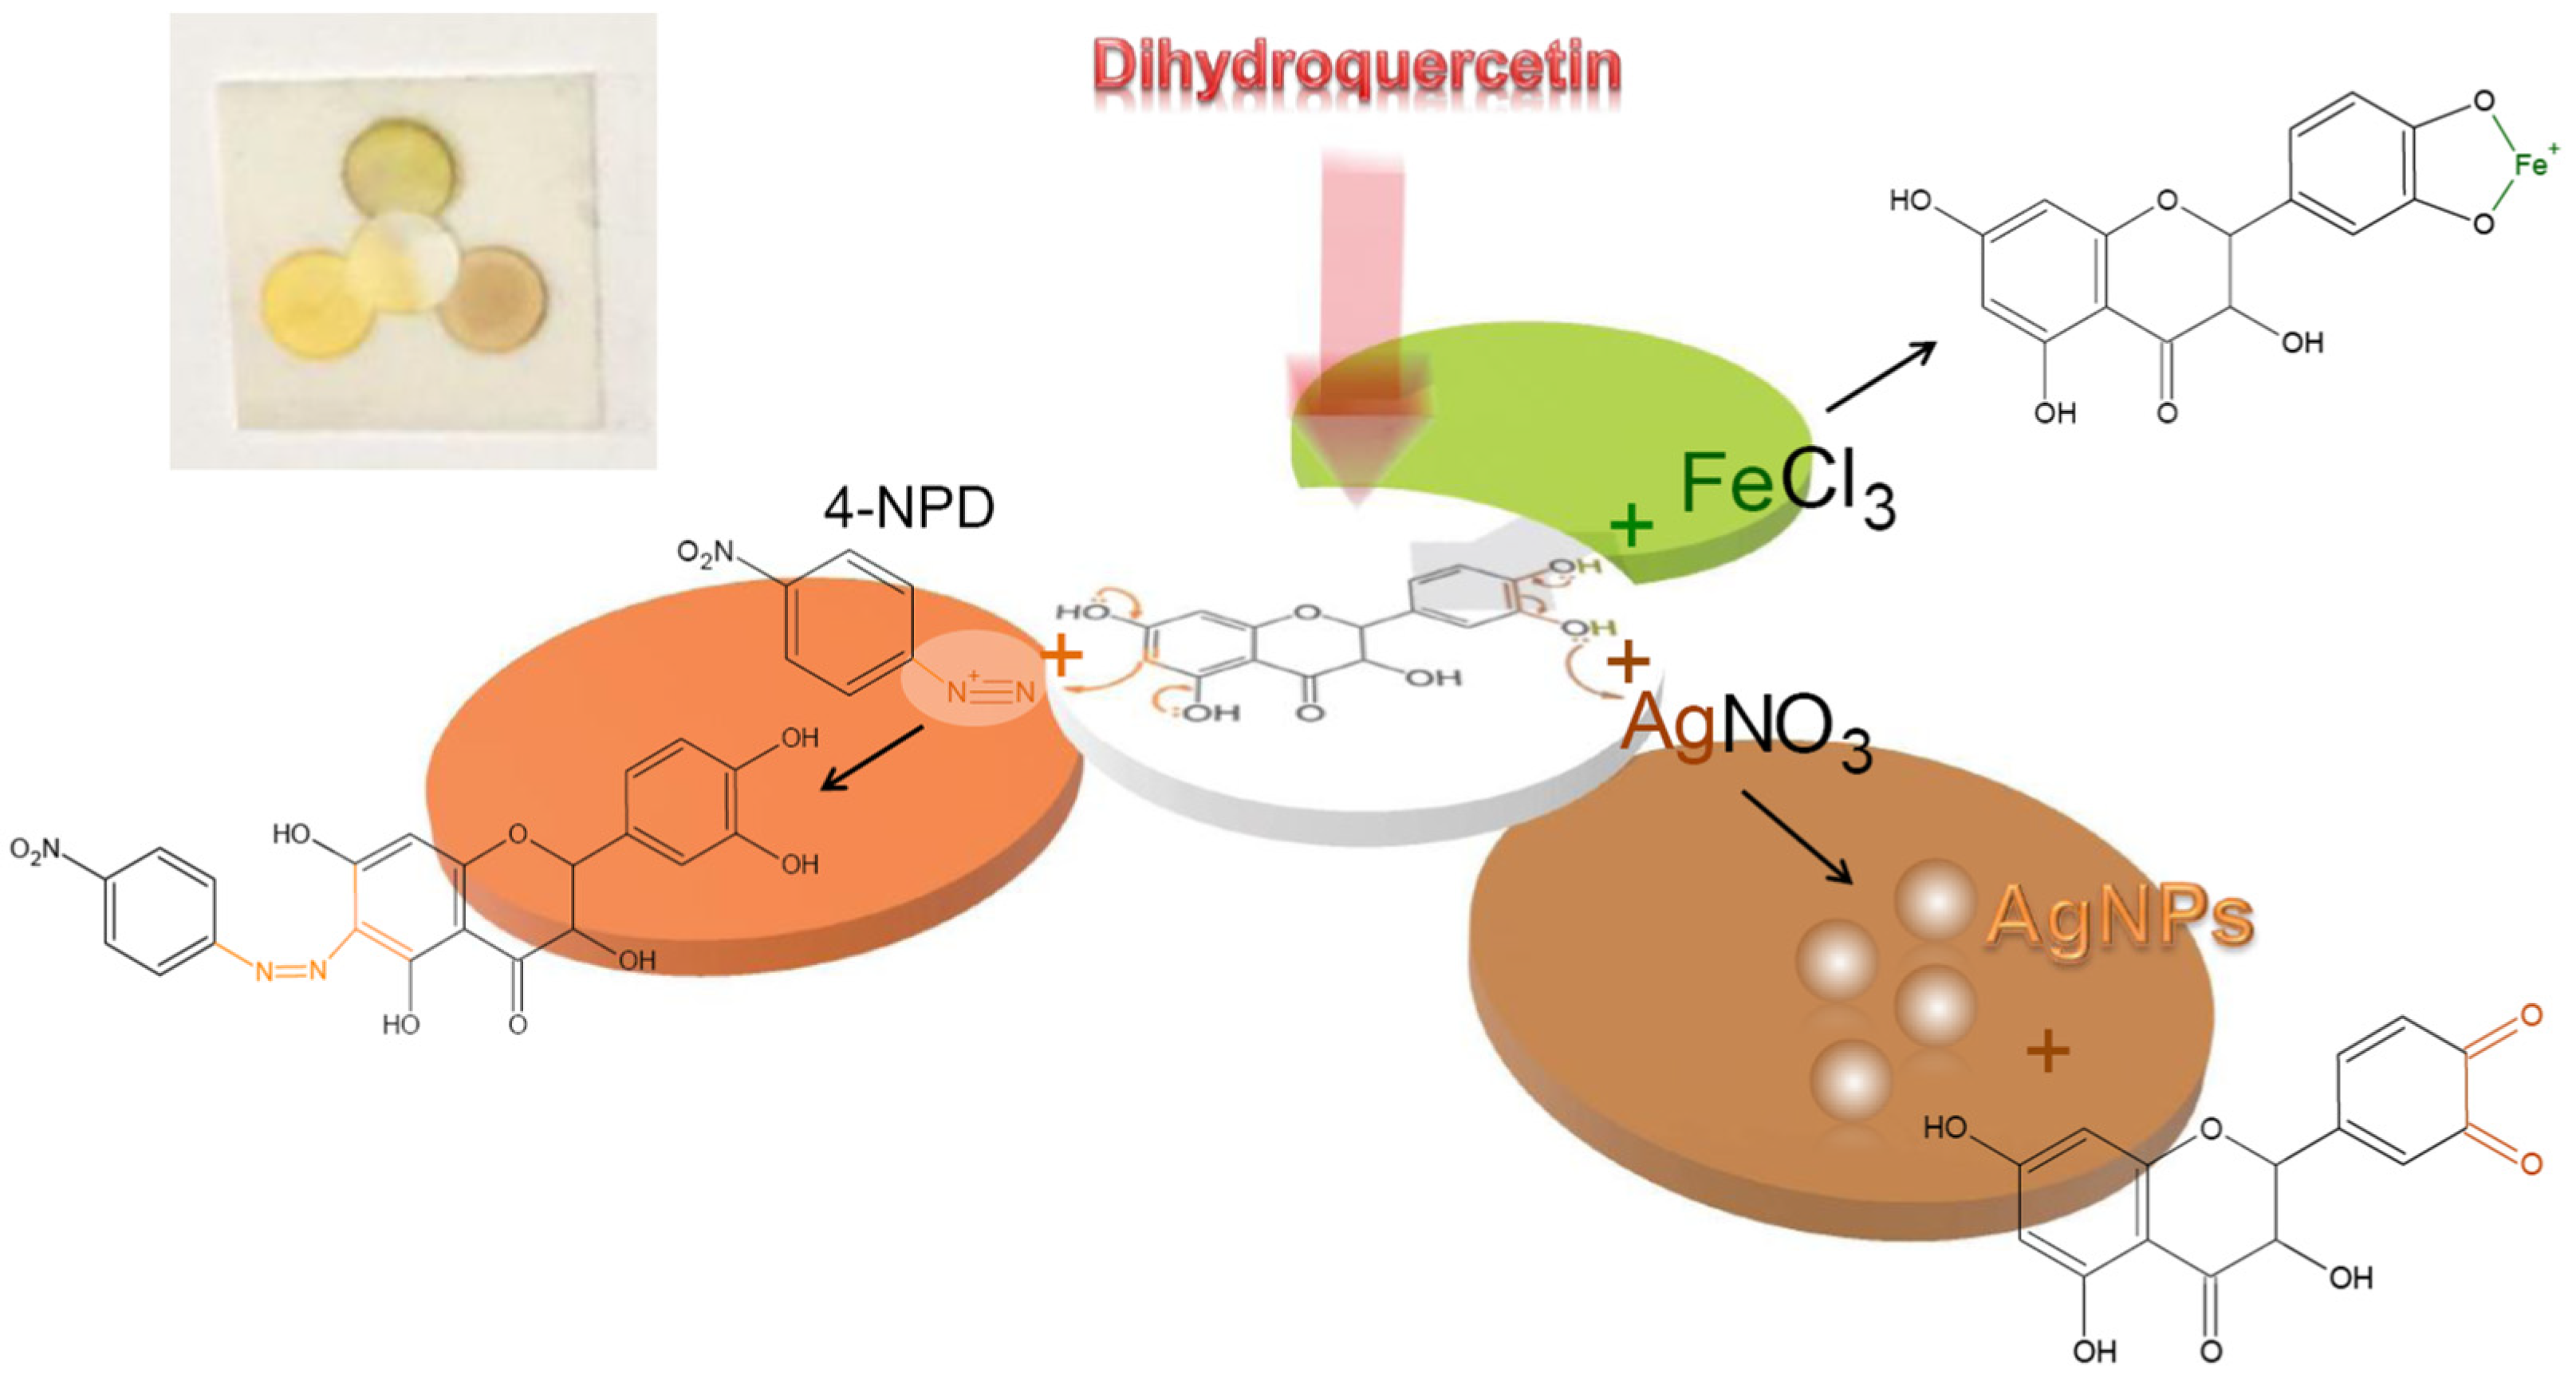
3.1. Choice of the Reagents for Determination of Dihydroquercetin

When choosing reagents for the colorimetric detection of dihydroquercetin using the proposed µPADs, its chemical and structural features were taken into account. They are the presence of acidic phenolic hydroxyls capable to form chelate complexes, an aromatic system with π-donor radicals capable of electrophilic substitution reactions, and the pronounced reducing properties of this compound (Figure 1).
First, due to the polyphenolic nature of dihydroquercetin, iron(III) chloride was chosen as one of the reagents for its colorimetric determination. Iron(III) in the reaction with phenols forms complex compounds colored in violet, blue, or green [33]. The maximums of their absorption band, as a rule, lie in the range of 500–600 nm.
Secondly, phenols easily participate in azo-coupling reactions with aromatic diazonium salts, forming intensely colored products [33,34]. Often, 4-nitrophenyldiazonium, as its tetrafluoroborate ionic associate (4-NPD), is used as a diazo-component during photometric determination of phenols [35,36]. The advantage of 4-NPD is its stability in solid form and relative stability in solutions. The presence of phenolic fragments in the dihydroquercetin molecule also determines its participation in the azo-coupling reaction with 4-NPD, resulting in the extension of the delocalized π-electron system and a bathochromic shift of a spectral band.
Finally, another characteristic feature of dihydroquercetin is its pronounced antioxidant properties. Therefore, silver nitrate, which participates in a redox reaction with dihydroquercetin, was chosen as a third reagent in this µPAD. As reported earlier [37,38], flavonoids reduce silver nitrate to silver nanoparticles with an intense surface plasmon resonance (SPR) band. This property of silver nanoparticles was used to detect dihydroquercetin in this study. In contrast to the absorption bands of the flavonoids themselves, located in the UV spectral range (280–380 nm), the maximum of silver nanoparticles SPR band lies in the visible spectral range (~420 nm), which can be successfully used for the detection using paper microfluidic systems even with a naked eye. Since the reaction with silver nitrate takes place in a basic medium, alkali must be used as an additional reagent in this case.

3.2. Determination of Dihydroquercetin Using the Three-Reagent µPAD and Diffuse Reflectance Spectroscopy

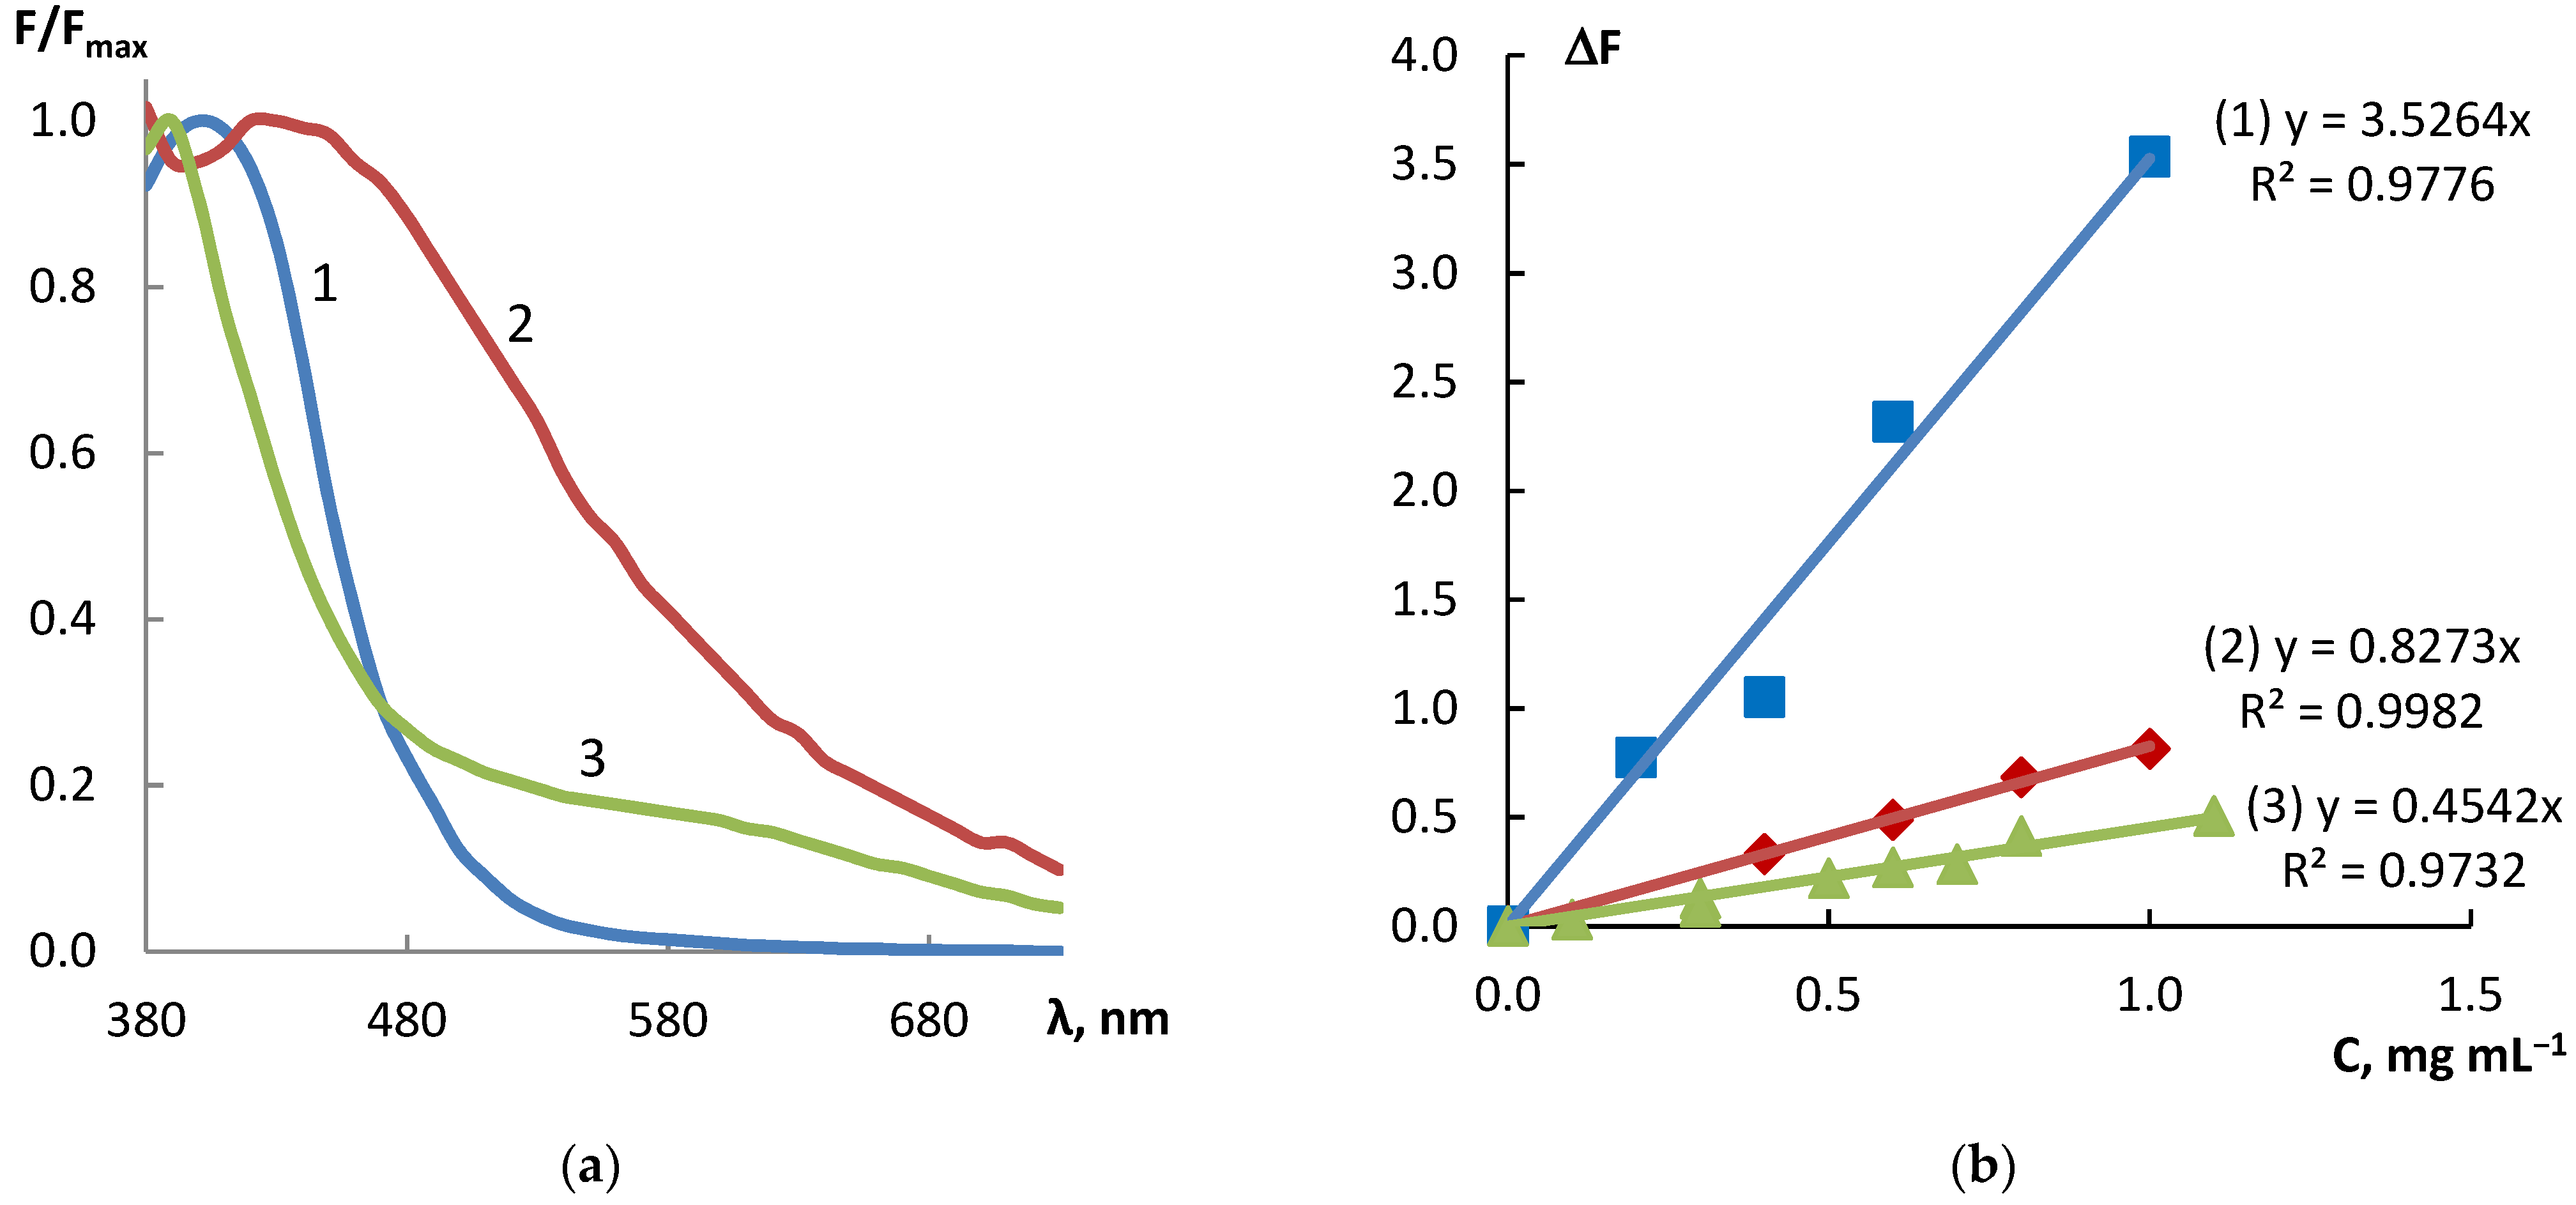
3.2.1. Analytical Responses

The normalized diffuse reflectance spectra of products of interaction between the above-mentioned three reagents and dihydroquercetin recorded on the µPAD detection zones are represented in Figure 2. It can be seen that the products have different spectral characteristics including both the position of the absorption band maximum and its shape. Together with different principles of interaction between these reagents and dihydroquercetin, which was discussed above, it stipulates good prospects of the proposed µPAD in multi-responsive methods of substances identification and determination. To check this supposition, we compared responses of µPAD regarding quercetin, which differs from dihydroquercetin by one more double bond (Figure 3). The corresponding calibration graphs for quercetin are depicted in Figure 3a. A comparison of these graphs with those plotted for dihydroquercetin (Figure 2b) indicates that the sensitivity coefficients of the same reagents and the order of their change are different for these two analytes. In the case of quercetin, the slope of calibration straight line increases in the series of reagents FeCl3 − 4-NPD − AgNO3 + NaOH, whereas in the case of dihydroquercetin, this series is the following: FeCl3 − AgNO3 + NaOH − 4-NPD. This is apparently due to the presence of a double bond, which stabilizes the π,π-conjugated system in the quercetin molecule. It promotes the formation of a complex with silver ion and causes its more efficient reduction, which, in turn, leads to a significant increase in signal associated with formation of silver nanoparticles.
The observations described above can be used to identify a flavonoid by its specific responses of the µPAD detection zones. This can be visualized as a 3D chart represented in Figure 3b. In this 3D chart, the coordinates of data points are the responses for three different reagents (AgNO3 + NaOH, 4-NPD, FeCl3), and the trends correspond to an increase in the flavonoid concentration. It can be seen from the figure that the straight lines diverge strongly in the 3D space. It allows for identifying flavonoids by considering which of the straight lines an experimental point measured for an analyzed sample belongs to. However, it should be emphasized that such identification is possible if only single analyte is present in the sample.

3.2.2. Features of Merit

The analytical features of merit for the proposed µPAD are presented in Table 1. The limits of detection (LODs), which were calculated from 3s0 value, where s0 is standard deviation of a blank, lie in the range of 7.7–39 µg mL−1. FeCl3 (LOD = 39 μg mL−1) has the lowest sensitivity, and 4-NPD (LOD = 7.7 μg mL−1) has the highest one. The linearity ranges, with lower boundaries calculated from 10s0, are totally within an interval from 0.026 to 1.1 mg mL−1. Based on these data, it can be concluded that this µPAD is suitable for the determination of sufficiently high concentrations of flavonoids, which may be present, for example, in certain plant extracts or pharmaceutical preparations. In samples where the content of flavonoids is high, the µPAD may have some advantages over highly sensitive methods. The latter would require preliminary preparation and multiple dilution of the sample before the determination, which complicates the analysis procedure and may lead to significant systematic errors. At the same time, the absolute detection limits calculated for the µPAD (Table 1) are quite low, which is a consequence of its miniaturized design. It indicates the possibility of analyzing small amounts of samples, being another advantage of µPAD.

3.3. Determination of Dihydroquercetin Using the Three-Reagent µPAD and Digital Colorimetry

In addition to diffuse reflectance spectroscopy, the color change of samples can be recorded and quantified by digital colorimetry using a smartphone. However, the method of digital colorimetry often results in nonlinear calibration dependences described by an exponential equation [39,40]. An example of a calibration graph for the case of detecting dihydroquercetin by the reaction with 4-NPD (as a reagent providing the highest slope of a calibration curve) for all three color channels (R, G, and B) is shown in Figure S1 in the Supplementary Materials. The calibration curves can be successfully described by an exponential equation. These equations as well as features of merit for the determination of dihydroquercetin using digital colorimetry are given in Table 2. It can be seen that the sensitivity coefficients for various reagents for colorimetry change in a similar way to that for diffuse reflectance spectroscopy. For each detection zone, the most sensitive color coordinate can be found, which provides the lowest LOD. It is blue for the 4-NPD zone, red for the AgNO3 + NaOH zone, and red or green for the FeCl3 zone. However, generally, LODs achieved with a smartphone (ranging from 0.03 to 0.13 mg mL−1) appear higher than those calculated from the spectral measurements.

3.4. Selectivity and Analysis of Samples

Flavonoids are often determined in biologically active additives, pharmaceuticals, and vegetable raw materials; therefore, selectivity of the analysis relative to inorganic ions, mono- and polysaccharides, and ascorbic acid should be estimated. It was found that at least 1:100 excess of common inorganic ions (Na+, K+, Ca2+, SO42−, NO3, and Cl) does not interfere with the determination of 0.25 mg mL−1 dihydroquercetin; the only exception is detection with AgNO3 + NaOH, which is affected by Cl already at 1:1 ratio. It is probably connected with the formation of AgCl on this detection zone, preventing the reduction of Ag+ to silver nanoparticles. This is an obvious limitation of using this sensing zone in the analysis of real samples. However, it should be noted that two other detection zones in the proposed three-reagent µPAD still can be applied in such cases.
Since the detection zone containing AgNO3 and NaOH is supposed to be the most subjected to interferences, additional effects of some organic interferents were assessed using this zone. It was shown that the determination is not affected by 1:100 excess of glucose and 1:1 amount of starch. However, it is affected by ascorbic acid already at 1:1 ratio because of the reduction of silver ions with this compound. As it was shown above, quercetin, which also belongs to the flavonoids class and possesses similar chemical properties, also provides responses of the µPAD test zones. This indicates certain limitation of selectivity inherent to methods of optical spectroscopy and colorimetry. However, a principle of multiple signal processing, illustrated above by the example of Figure 3b, together with big data mathematical analysis, can improve selectivity of the determination.
To check the accuracy of the determination using µPAD, the analysis of a food supplement “Digidrokvercetin” (Evalar) was performed. A tablet of the food supplement was carefully ground, and then dihydroquercetin was extracted with 50 mL of 100% ethanol in an ultrasonic bath for 30 min. Part of the extract was filtered, diluted 25 times with 100% ethanol, and used for the analysis. Reverse-phase HPLC was used as an alternative method for the determination of dihydroquercetin. The results are represented in Table 3. It can be seen that the determination with µPAD has acceptable accuracy and reproducibility.

3.5. Comparison with Other Methods

Comparison of the µPAD features of merit with published data is represented in Table 4. It indicates that the proposed method has reasonable LOD and broad linearity range. However, despite moderate sensitivity, the µPAD possesses improved selectivity due to the presence of three independent reagents in its composition. Another advantage of the proposed µPAD is ability to be easily redesigned in a required architecture, which stems from the concept of composable paper-based analytical devices discussed in this paper.

4. Conclusions

A three-reagent paper-based analytical device has been developed and proposed for the determination of dihydroquercetin. All the reagents, AgNO3 + NaOH, 4-NPD, and FeCl3, react with dihydroquercetin, utilizing different chemical principles, and produce colored products with different spectral characteristics. This is prospective for discriminating dihydroquercetin from other flavonoids. Both diffuse reflectance spectroscopy and digital colorimetry can be applied to detect analytical responses of the µPAD detection zones; however, the former method provides higher sensitivity. The proposed µPAD is applicable to analyze samples where the content of dihydroquercetin is quite high with their minimal dilution. The advantages of µPAD are the application of compact and inexpensive detection devices and low consumption of samples, reagents, and materials, which allows us to consider it a “green” method.

Supplementary Materials

The following supporting information can be downloaded at: https://www.mdpi.com/article/10.3390/s22082893/s1, Figure S1: Colorimetric calibration graphs based on the interaction between 4-NPD and dihydroquercetin.

Author Contributions

Conceptualization, A.A.F. and V.V.A.; methodology, V.I.K.; validation, V.I.K.; resources, A.A.F. and V.V.A.; writing—original draft preparation, V.V.A.; writing—review and editing, V.V.A., S.G.D. and Y.A.Z.; visualization, V.V.A. and V.I.K.; supervision, V.V.A., S.G.D. and Y.A.Z.; project administration, S.G.D., V.V.A. and Y.A.Z.; funding acquisition, V.V.A. All authors have read and agreed to the published version of the manuscript.

Funding

This study was supported by the Russian Science Foundation, grant N 18-73-10001, https://rscf.ru/en/project/18-73-10001/ (accessed on 25 March 2022).

Conflicts of Interest

The authors declare no conflict of interest. The funders had no role in the design of the study; in the collection, analyses, or interpretation of data; in the writing of the manuscript, or in the decision to publish the results.

References

  1. Sriram, G.; Bhat, M.P.; Patil, P.; Uthappa, U.T.; Jung, H.Y.; Altalhi, T.; Kumeria, T.; Aminabhavi, T.M.; Pai, R.K.; Kurkuri, M.D. Paper-based microfluidic analytical devices for colorimetric detection of toxic ions: A review. Trends Anal. Chem. 2017, 93, 212–227. [Google Scholar] [CrossRef]
  2. Kung, C.-T.; Hou, C.-Y.; Wang, Y.-N.; Fu, L.-M. Microfluidic paper-based analytical devices for environmental analysis of soil, air, ecology and river water. Sens. Actuators B 2019, 301, 126855. [Google Scholar] [CrossRef]
  3. Xu, Y.; Liu, M.; Kong, N.; Liu, J. Lab-on-paper micro- and nano-analytical devices: Fabrication, modification, detection and emerging applications. Microchim. Acta 2016, 183, 1521–1542. [Google Scholar] [CrossRef]
  4. Singhal, H.R.; Prabhu, A.; Giri Nandagopal, M.S.; Dheivasigamani, T.; Mani, N.K. One-dollar microfluidic paper-based analytical devices: Do-it-yourself approaches. Microchem. J. 2021, 165, 106126. [Google Scholar] [CrossRef]
  5. Murray, L.P.; Mace, C.R. Usability as a guiding principle for the design of paper-based, point-of-care devices–A review. Anal. Chim. Acta 2020, 1140, 236–249. [Google Scholar] [CrossRef]
  6. Bendicho, C.; Lavilla, I.; Pena-Pereira, F.; de la Calle, I.; Romero, V. Paper-based analytical devices for colorimetric and luminescent detection of mercury in waters: An overview. Sensors 2021, 21, 7571. [Google Scholar] [CrossRef]
  7. Alahmad, W.; Sahragard, A.; Varanusupakul, P. Online and offline preconcentration techniques on paper-based analytical devices for ultrasensitive chemical and biochemical analysis: A review. Biosens. Bioelectron. 2021, 194, 113574. [Google Scholar] [CrossRef]
  8. Giannoulas, G.; Tsogas, G.Z.; Giokas, D.L. Single-point calibration and standard addition assays on calibrant-loaded paper-based analytical devices. Talanta 2019, 201, 149–155. [Google Scholar] [CrossRef]
  9. Kappi, F.A.; Tsogas, G.Z.; Routsi, A.-M.; Christodouleas, D.C.; Giokas, D.L. Paper-based devices for biothiols sensing using the photochemical reduction of silver halides. Anal. Chim. Acta 2018, 1036, 89–96. [Google Scholar] [CrossRef]
  10. Duangdeewong, C.; Sitanurak, J.; Wilairat, P.; Nacapricha, D.; Teerasong, S. Microfluidic paper-based analytical device for convenient use in measurement of iodate in table salt and irrigation water. Microchem. J. 2020, 152, 104447. [Google Scholar] [CrossRef]
  11. Ungor, D.; Szilágyi, I.; Csapó, E. Yellow-emitting Au/Ag bimetallic nanoclusters with high photostability for detection of folic acid. J. Mol. Liq. 2021, 338, 116695. [Google Scholar] [CrossRef]
  12. Lee, W.-C.; Ng, H.-Y.; Hou, C.-Y.; Lee, C.-T.; Fu, L.-M. Recent advances in lab-on-paper diagnostic devices using blood samples. Lab A Chip 2021, 21, 1433–1453. [Google Scholar] [CrossRef] [PubMed]
  13. Subhi Sammani, M.; Clavijo, S.; Figuerola, A.; Cerdà, V. 3D printed structure coated with C18 particles in an online flow system coupled to HPLC-DAD for the determination of flavonoids in citrus external peel. Microchem. J. 2021, 168, 106421. [Google Scholar] [CrossRef]
  14. Campillo, N.; Viñas, P.; Férez-Melgarejo, G.; Hernández-Córdoba, M. Dispersive liquid–liquid microextraction for the determination of flavonoid aglycone compounds in honey using liquid chromatography with diode array detection and time-of-flight mass spectrometry. Talanta 2015, 131, 185–191. [Google Scholar] [CrossRef] [PubMed]
  15. Zhao, Y.; Lu, H.; Wang, Q.; Liu, H.; Shen, H.; Xu, W.; Ge, J.; He, D. Rapid qualitative profiling and quantitative analysis of phenolics in Ribes meyeri leaves and their antioxidant and antidiabetic activities by HPLC-QTOF-MS/MS and UHPLC-MS/MS. J. Sep. Sci. 2021, 44, 1404–1420. [Google Scholar] [CrossRef] [PubMed]
  16. Di Masi, S.; De Benedetto, G.E.; Malitesta, C.; Saponari, M.; Citti, C.; Cannazza, G.; Ciccarella, G. HPLC-MS/MS method applied to an untargeted metabolomics approach for the diagnosis of “olive quick decline syndrome”. Anal. Bioanal. Chem. 2022, 414, 465–473. [Google Scholar] [CrossRef] [PubMed]
  17. Alipour, F.; Raoof, J.B.; Ghani, M. Determination of quercetin: Via thin film microextraction using the in situ growth of Co-Al-layered double hydroxide nanosheets on an electrochemically anodized aluminum substrate followed by HPLC. Anal. Methods 2020, 12, 799–806. [Google Scholar] [CrossRef]
  18. Santos, W.N.L.D.; da Silva Sauthier, M.C.; dos Santos, A.M.P.; de Andrade Santana, D.; Almeida Azevedo, R.S.; da Cruz Caldas, J. Simultaneous determination of 13 phenolic bioactive compounds in guava (Psidium guajava L.) by HPLC-PAD with evaluation using PCA and Neural Network Analysis (NNA). Microchem. J. 2017, 133, 583–592. [Google Scholar] [CrossRef]
  19. Willie, P.; Uyoh, E.A.; Aikpokpodion, P.O. Gas chromatography-mass spectrometry (GC-MS) assay of bio-active compounds and phytochemical analyses in three species of apocynaceae. Pharmacogn. J. 2021, 13, 383–392. [Google Scholar] [CrossRef]
  20. Adeoye-Isijola, M.O.; Jonathan, S.G.; Coopoosamy, R.M.; Olajuyigbe, O.O. Molecular characterization, gas chromatography mass spectrometry analysis, phytochemical screening and insecticidal activities of ethanol extract of Lentinus squarrosulus against Aedes aegypti (Linnaeus). Mol. Biol. Rep. 2021, 48, 41–55. [Google Scholar] [CrossRef]
  21. Wu, Z.-Y.; Zhang, H.; Li, F.; Yang, F.-Q. Evaluation of xanthine oxidase inhibitory activity of flavonoids by an online capillary electrophoresis-based immobilized enzyme microreactor. Electrophoresis 2020, 41, 1326–1332. [Google Scholar] [CrossRef] [PubMed]
  22. Yang, Y.; Fu, H.; Qian, C.; Li, H.; Chen, D.D.Y. Characterization of interaction between Bcl-2 oncogene promoter I-Motif DNA and flavonoids using electrospray ionization mass spectrometry and pressure-assisted capillary electrophoresis frontal analysis. Talanta 2020, 215, 120885. [Google Scholar] [CrossRef] [PubMed]
  23. Memon, A.F.; Palabiyik, I.M.; Solangi, A.R.; Memon, S.Q.; Mallah, A.B. Large volume sample stacking (LVSS) in capillary electrophoresis (CE) with response surface methodology (RSM) for the determination of phenolics in food samples. Anal. Lett. 2019, 52, 2853–2867. [Google Scholar] [CrossRef]
  24. Abdullah, A.A.; Yardım, Y.; Şentürk, Z. The performance of cathodically pretreated boron-doped diamond electrode in cationic surfactant media for enhancing the adsorptive stripping voltammetric determination of catechol-containing flavonoid quercetin in apple juice. Talanta 2018, 187, 156–164. [Google Scholar] [CrossRef]
  25. Ibrahim, M.; Ibrahim, H.; Almandil, N.B.; Sayed, M.A.; Kawde, A.-N. A new hybrid nanocomposite electrode based on Au/CeO2-decorated functionalized glassy carbon microspheres for the voltammetric sensing of quercetin and its interaction with DNA. Anal. Methods 2020, 12, 2846–2857. [Google Scholar] [CrossRef]
  26. Sebastian, N.; Yu, W.-C.; Balram, D. Synthesis of amine-functionalized multi-walled carbon nanotube/3D rose flower-like zinc oxide nanocomposite for sensitive electrochemical detection of flavonoid morin. Anal. Chim. Acta 2020, 1095, 71–81. [Google Scholar] [CrossRef]
  27. Furletov, A.A.; Apyari, V.V.; Garshev, A.V.; Dmitrienko, S.G.; Zolotov, Y.A. Fast and sensitive determination of bioflavonoids using a new analytical system based on label-free silver triangular nanoplates. Sensors 2022, 22, 843. [Google Scholar] [CrossRef]
  28. Kurdyukov, E.E.; Vodop’yanova, O.A.; Moiseeva, I.Y.; Semenova, E.F. A method for the quantitative determination of the total flavonoid content of moringa leaves (Moringa oleifera). Mosc. Univ. Chem. Bull. 2021, 76, 224–226. [Google Scholar] [CrossRef]
  29. Khani, R.; Sheykhi, R.; Bagherzade, G. An environmentally friendly method based on micro-cloud point extraction for determination of trace amount of quercetin in food and fruit juice samples. Food Chem. 2019, 293, 220–225. [Google Scholar] [CrossRef]
  30. Paradiso, V.M.; Clemente, A.; Summo, C.; Pasqualone, A.; Caponio, F. Towards green analysis of virgin olive oil phenolic compounds: Extraction by a natural deep eutectic solvent and direct spectrophotometric detection. Food Chem. 2016, 212, 43–47. [Google Scholar] [CrossRef]
  31. Dmitrienko, S.G.; Apyari, V.V.; Kudrinskaya, V.A.; Stepanova, A.V. Preconcentration of flavonoids on polyurethane foam and their direct determination by diffuse reflectance spectroscopy. Talanta 2012, 102, 132–136. [Google Scholar] [CrossRef] [PubMed]
  32. Gutorova, S.V.; Apyari, V.V.; Kalinin, V.I.; Furletov, A.A.; Tolmacheva, V.V.; Gorbunova, M.V.; Dmitrienko, S.G. Composable paper-based analytical devices for determination of flavonoids. Sens. Actuators B 2021, 331, 129398. [Google Scholar] [CrossRef]
  33. Korenman, I.M. Photometric Analysis; Methods for the Determination of Organic Compounds (Fotometricheskii Analiz. Metody Opredeleniya Organicheskikh Soedinenii); Khimiya: Moscow, Russia, 1975. (In Russian) [Google Scholar]
  34. Kyei, S.K.; Akaranta, O.; Darko, G. Synthesis, characterization and antimicrobial activity of peanut skin extract-azo-compounds. Sci. Afr. 2020, 8, e00406. [Google Scholar] [CrossRef]
  35. Kudrinskaya, V.A.; Dmitrienko, S.G.; Zolotov, Y.A. Spectrophotometric determination of flavonoids using their diazotization with (4-nitrophenyl)diazonium tetrafluoroborate. Mosc. Univ. Chem. Bull. 2010, 65, 244–248. [Google Scholar] [CrossRef]
  36. Chernysh, V.V.; Proskurnin, M.A.; Kuznetsova, V.V.; Pakhomova, S.V. Determination of microamounts of phenols by thermal lens spectrometry. Anal. Commun. 1997, 34, 291–294. [Google Scholar] [CrossRef]
  37. Terenteva, E.A.; Apyari, V.V.; Dmitrienko, S.G.; Zolotov, Y.A. Formation of plasmonic silver nanoparticles by flavonoid reduction: A comparative study and application for determination of these substances. Spectrochim. Acta A 2015, 151, 89–95. [Google Scholar] [CrossRef] [PubMed]
  38. Osonga, F.J.; Akgul, A.; Yazgan, I.; Akgul, A.; Ontman, R.; Kariuki, V.M.; Eshuna, G.B.; Sadik, O.A. Flavonoid-derived anisotropic silver nanoparticles inhibit growth and change the expression of virulence genes in Escherichia coli SM10. RSC Adv. 2018, 8, 4649–4661. [Google Scholar] [CrossRef] [Green Version]
  39. Apyari, V.V.; Dmitrienko, S.G. Using a digital camera and computer data processing for the determination of organic substances with diazotized polyurethane foams. J. Anal. Chem. 2008, 63, 530–537. [Google Scholar] [CrossRef]
  40. Monogarova, O.V.; Oskolok, K.V.; Apyari, V.V. Colorimetry in chemical analysis. J. Anal. Chem. 2018, 73, 1076–1084. [Google Scholar] [CrossRef]
  41. Al Lawati, H.A.J.; Hassanzadeh, J.; Bagheri, N.; Al Lawati, I. On paper synthesis of metal-organic framework as a chemiluminescence enhancer for estimating the total phenolic content of food samples using a smartphone readout. Talanta 2021, 234, 122648. [Google Scholar] [CrossRef]
  42. Scroccarello, A.; Della Pelle, F.; Rojas, D.; Ferraro, G.; Fratini, E.; Gaggiotti, S.; Cichelli, A.; Compagnone, D. Metal nanoparticles based lab-on-paper for phenolic compounds evaluation with no sample pretreatment. Application to extra virgin olive oil samples. Anal. Chim. Acta 2021, 1183, 338971. [Google Scholar] [CrossRef] [PubMed]
  43. Álvarez-Diduk, R.; Orozco, J.; Merkoçi, A. Paper strip-embedded graphene quantum dots: A screening device with a smartphone readout. Sci. Rep. 2017, 7, 976. [Google Scholar] [CrossRef] [PubMed] [Green Version]
  44. Sarza, R.M.O.; Villarino, C.B.J.; Gregorio, C.G.C. Paper-based device for the detection and quantification of total polyphenols in plant-based beverages for potential use in quality assurance purposes. Philipp. J. Sci. 2022, 151, 193–204. [Google Scholar]
  45. Calabria, D.; Mirasoli, M.; Guardigli, M.; Simoni, P.; Zangheri, M.; Severi, P.; Caliceti, C.; Roda, A. Paper-based smartphone chemosensor for reflectometric on-site total polyphenols quantification in olive oil. Sens. Actuators B 2020, 305, 127522. [Google Scholar] [CrossRef]
Figure 1. Schematic representation of the experimental µPAD design for the determination of dihydroquercetin and supposed colorimetric reactions within it. The insert is a photo of the µPAD after application of dihydroquercetin.
Sensors 22 02893 g001
Figure 2. (a) Normalized diffuse reflectance spectra of products of interaction between 4-NPD (1), AgNO3 + NaOH (2), FeCl3 (3), and dihydroquercetin recorded on the µPAD detection zones; (b) corresponding calibration graphs plotted at 400, 420, and 500 nm, respectively, with their equations and squared correlation coefficients.
Sensors 22 02893 g002
Figure 3. (a) Calibration graphs based on the interaction between 4-NPD (1), AgNO3 + NaOH (2), FeCl3 (3), and quercetin recorded on the µPAD detection zones (with their equations and squared correlation coefficients); (b) 3D chart of the corresponding detection zones responses regarding quercetin (a■) and dihydroquercetin (b□).
Sensors 22 02893 g003
Table 1. Analytical features of merit and calibration graphs equations for the determination of dihydroquercetin using the proposed µPAD and diffuse reflectance spectroscopy.
Detection ZoneCalibration Graph EquationR2Linearity Range, mg mL−1LOD, mg mL−1LOD, µg
4-NPDΔF = 3.53·C0.9780.026–10.00770.62
AgNO3 + NaOHΔF = 0.83·C0.9980.05–10.0151.20
FeCl3ΔF = 0.45·C0.9730.13–1.10.0393.12
Table 2. Analytical features of merit and calibration graphs equations for the determination of dihydroquercetin using the proposed µPAD and digital colorimetry.
Detection ZoneColor CoordinateCalibration Graph EquationR2Linearity Range,
mg mL−1
LOD,
mg mL−1
LOD, µg
4-NPDRedR = 190.3 + 35.4·exp(−c/0.27)0.9780.43–10.1310
GreenG = 163.8 + 47.5·exp(−c/0.32)0.9910.34–10.18.0
BlueB = 80.6 + 86·exp(−c/0.28)0.9990.11–10.032.4
AgNO3 + NaOHRedR = 153 + 45.4·exp(−c/0.19)0.9860.22–10.075.2
BlueB = 73.1 + 71.1·exp(−c/0.37)0.9710.34–10.18.0
FeCl3RedR = 160.3 + 70.3·exp(−c/0.44)0.9870.43–10.1310
GreenG = 140.1 + 78.2·exp(−c/0.60)0.9960.44–10.1310
Table 3. Determination of dihydroquercetin using the proposed µPAD in a food supplement (detection with i1Pro2 mini-spectrophotometer, n = 3, p = 0.95).
Labeled Content, mgµPADHPLC
Detection ZoneFound ± tP,f∙s/√n, mgRSD, %Found ± tP,f∙s/√n, mgRSD, %
25AgNO317 ± 112629 ± 23
4-NPD37 ± 1112
FeCl338 ± 89
Table 4. Features of merit of µPAD-based methods for the determination of flavonoids and other polyphenols.
µPADAnalytical
Instrument
AnalyteLinearity Range,
µg mL−1
LOD,
µg mL−1
Reference
µPAD based on chemiluminescence of luminol/H2O2 system enhanced with cobalt-imidazole metal-organic frameworkSmartphoneGallic acid
Quercetin
Catechin
Kaempferol
Caffeic acid
0.5–50
1–100
1–100
2–100
2–120
0.12
0.28
0.46
0.85
1.23
[41]
µPAD based on producing silver nanoparticlesMini-spectrophotometerQuercetin
Morin
Dihydroquercetin
7–100
16–100
43–100
2.3
5.2
14
[32]
µPAD based on growth of gold and silver nanoparticlesDigital cameraTotal polyphenol (hydroxytyrosol)25–5005 (Au)
6 (Ag)
[42]
µPAD based on luminescent graphene quantum dots embedded into nitrocellulose matrixSmartphoneQuercetin5–757.1; 20[43]
Three reagent µPADMini-spectro-
photometer
Dihydroquercetin26–10007.7; 15; 39This study
µPAD based on iron tartrateTable-top scannerTotal polyphenol (gallic acid)0–120020[44]
µPAD based on the Folin–Ciocalteu reagentSmartphoneTotal polyphenol0–80030
(µg g−1)
[45]
Publisher’s Note: MDPI stays neutral with regard to jurisdictional claims in published maps and institutional affiliations.

