
Assessment of Finger Fat Pad Effect on CSRR-Based Sensor Scattering Parameters for Non-Invasive Blood Glucose Level Detection

1
Institut Matériaux Microélectronique Nanosciences de Provence (IM2NP), UMR CNRS 7334, Aix-Marseille Université, 5 Rue Enrico Fermi, 13453 Marseille, France
2
Laboratoire Génie Électrique et Électronique de Paris (GeePs), UMR 8507 CNRS, Sorbonne Université, 4 Place Jussieu, 75005 Paris, France
*
Author to whom correspondence should be addressed.
Sensors 2023, 23(1), 473; https://doi.org/10.3390/s23010473
Submission received: 27 November 2022
/
Revised: 24 December 2022
/
Accepted: 29 December 2022
/
Published: 2 January 2023
(This article belongs to the Special Issue Microwave Technologies for Biomedical Applications: from Sensing to Therapy)
Abstract
:This paper examines the effect of finger fat pad thickness on the accuracy performance of complementary split-ring resonator (CSRR)-based microwave sensors for non-invasive blood glucose level detection. For this purpose, a simplified four-layer Cole–Cole model along with a CSRR-based microwave sensor have been comprehensively analyzed and validated through experimentation. Computed scattering parameter (S-parameter) responses to different fat layer thicknesses are employed to verify the concordance of the studied model with the measurement results. In this respect, a figure of merit (FM) based on the normalized squared difference is introduced to assess the accuracy of the considered Cole–Cole model. We have demonstrated that the analyzed model agrees closely with the experimental validation. In fact, the maximum error difference for all five fingertips does not exceed 1.73 dB over the entire frequency range of interest, from 1 GHz to 4 GHz.
Keywords:
blood; CSRR; Cole–Cole; error; finger fat-pad; glucose; microwave sensors; glucose; scattering parameters1. Introduction
Recent years have seen a considerable growth of interest in developing several glucose-monitoring techniques for diabetes diagnosis. One of the most popular devices is a blood glucose meter based upon a minimal-invasive finger stick test [1,2,3,4]. However, the recent trend is shifting towards microwave planar resonant sensors due to their many interesting features, including low profile, reduced sensing area, and ease of integration with the other conventional planar microwave components [5,6,7,8]. In addition, microwave sensors are preferred due to their capability to measure non-invasively biological samples by emitting an electromagnetic wave that passes through the skin and subcutaneous fat to measure blood [9,10,11,12,13,14,15,16,17,18]. This is thanks to a change in the electrical property of the biological tissue, resulting in a shift to the resonant frequency of the microwave sensor.
Complementary split-ring resonator (CSRR)-based sensors are one of the most widely used devices in several potential applications of microwave sensing, including the characterization of electromagnetic properties of materials, characterization of liquids, and, more particularly, biological material testing [19,20,21,22].
The development of high-sensitivity CSRR microwave planar sensors is required for highly accurate permittivity measurements to monitor the small variations among different biological samples. The sensitivity to variations in glucose levels could be enhanced by increasing the dependency of the minimum transmission resonant frequency on the loaded sample. However, the resonant transmission coefficient could be estimated through the CSRR scattering parameters (S-parameters), which are key for extracting the necessary information for blood glucose concentration measurement [17].
In the context of monitoring glucose levels through the CSRR sensor, the scattering parameter responses are mainly affected by the composition of the characterized fingertip tissue. There are, in fact, several factors affecting the development of fingerprints towards a regular shape (e.g., size, the thickness of subcutaneous fat, degree of stoutness, the growth rate of bone, etc.), which may result in a diversity of fingerprints. Overall, it is thought that the dermatoglyphic pattern of a human fingertip is controlled mainly by genetic factors and mixture permittivity [23,24].
Moreover, tissue composition is generally influenced by the way in which the body distributes excess fat. For instance, in overweight and obese people, some extra fat goes right to their fingers, resulting in non-uniform fat accumulation in the fingertips [25]. Additionally, the fingertip fat pad thicknesses may be differentially modified when pressing on the sensitive region of the non-invasive CSRR-based microwave sensors, contrary to minimal-invasive blood glucose meters where blood glucose levels are measured directly. These scenarios led to discrepancies in the measurement of scattering parameters, which significantly affected the accuracy and the permittivity estimation of the CSRR-based microwave sensor.
Most studies in the literature have been focused on the enhancement of CSRR planar sensors’ sensitivity by improving the accuracy at the permittivity level. However, the proposed approaches do not consider the errors occurring over a wide frequency band since the permittivity is only determined at a given resonant frequency [26]. To ensure a comprehensive assessment of errors, an alternative solution consists of using scattering parameters for identifying and quantifying possible errors related to non-uniform biological tissues over a large frequency band.
In this paper, we employ the CSRR-based microwave non-invasive blood glucose sensors’ scattering parameters to investigate the effect of finger fat pad thickness. It focuses particularly on the change of transmission coefficient responses as key terms for estimating the error due to the variation of fat layer thickness in finger tissues. In this regard, a figure of merit (FM) built upon a theoretical four-layer Cole–Cole fingertip model is introduced for effects analysis purposes. It is described as the squared difference between the computed scattering parameter data at different fat thicknesses and the in-vivo measurement-based scattering parameters of a participant’s fingers. This study aims to provide more flexibility for tolerances compensation and accuracy enhancement of CSRR-based non-invasive microwave sensors for blood glucose level detection.
2. Fingertip Tissue Model
This section deals with the issue of human fingertip electromagnetic modeling. Human tissues are composed of several layers of a complex inhomogeneous mixture of bio-organic materials with different electromagnetic properties, contrary to homogeneous dielectric materials. The anatomy of the human finger is shown in Figure 1a; it typically includes skin, fat, veins/arteries, bone, and nail/nail matrix [27,28].
Voxel-based electromagnetic modeling of human tissues is often employed in the field of computational bio-electromagnetics. Its approach may provide excellent three-dimensional geometric models of the human fingertip. However, that model does not consider the dependency between the complex permittivity of blood and glucose concentration. This dependency is indeed a key factor for non-invasive glucose detection using CSRR sensors. It allows real-time detection of any change in human blood permittivity as a function of glucose concentration. Therefore, an associated Cole–Cole tissue model is introduced to meet analysis requirements since it is widely employed in the electromagnetic modeling of human tissue materials to fit the frequency dependence of the dielectric permittivity [29,30,31,32,33].
According to the Cole–Cole model, the dependency between the complex permittivity () of blood and the frequency can be expressed by Equation (1):
where ω is the angular frequency, and σi is conductivity.
In order to establish a relationship between blood permittivity and glucose concentration, the blood has been defined as a single pole Cole–Cole material (n = 1). Therefore, the corresponding finger tissue model is built using Ansys HFSS 3D electromagnetic simulation software while considering the appropriate parameters of high-frequency permittivity (εꝏ), the magnitude of the dispersion (Δεn), relaxation time constant (τn), and dispersion-broadening parameter (αn = 0.1).
Under the Cole–Cole considerations, the electromagnetic (EM) model of the human fingertip consists of four layers (skin, fat, blood, and bone) having approximately comparable fingertip layer thicknesses of an adult. The thickness of each layer with the associate permittivity (εr) is summarized in Table 1 [34], and the considered 3D fingertip electromagnetic model is shown in Figure 1b.
3. CSRR-Based Sensor Design and Analysis
The proposed CSRR circuit design is shown in Figure 2a. It was designed to operate at 2.4 GHz on a low-cost FR-4 substrate (εr = 4.4, tanδ = 0.025) [35]. The operating frequency of 2.4 GHz was chosen to match the Industrial, Scientific, and Medical (ISM) band 2.4–2.5 GHz for ISM-band biomedical applications. The circuit prototype was fabricated using a Laser-based PCB Prototyping machine (LPKF ProtoLaser S4), as shown in Figure 2b. The overall size of the CSRR circuit is compatible with the fingertip dimension; its geometrical parameters are as follows: L = 60, LR = WR = 9.079, W = 15, W0 = 1.349, g = e = 0.500, h = 0.730, all units being millimeters. A fixture structure suitable for finger placement was also manufactured to ensure repeatable measurement to incorporate the fabricated CSRR sensor, as shown in Figure 2c. It provides a firm contact of the finger with the CSRR sensing area to perturb the electromagnetic fields and induce noticeable changes in the sensor transmission response.
The fixture design and the selected material were professionally chosen to enable both portability and accuracy throughout the testing process on the sensor. The body of the fixture was made of transparent and rigid plastic material poly (methyl methacrylate) (PMMA). The thickness of the structure used to construct the overall body was 9 mm. The base of the fixture consists of 6 mm PMMA that was cut through an Epilog Fusion M2 40″ 75 W CO2 (carbon) laser cutter.
The measured S-parameters of the unloaded CSRR sensor circuit, compared with the simulated one, over the frequency range, from 1 GHz to 4 GHz, are shown in Figure 2d. As can be seen, a very good agreement is achieved, especially across the frequency band of interest (2.4 GHz ISM band). However, between the simulated and measured results, a slight resonant frequency shift, not exceeding 100 MHz (about 4.1% of the resonant frequency), has occurred. This shift in resonant frequency is probably due to the fabrication tolerance and uncertainties in substrate parameters. It should be noted that the accuracy of the proposed finger fat pad thickness effect analysis highly depends on the good correlation between the measured and simulated S-parameters of the unloaded CSRR circuit.
The simulated reflection and transmission coefficients for different fat layer thicknesses (hf = 0.1 mm, hf = 0.3 mm, hf = 0.5 mm, hf = 0.7 mm, and hf = 0.9 mm) are shown in Figure 3a,b. A change in the resonant frequency as well as in the magnitude of S21 (dB) is observed, as shown in Figure 3b. This is due to the variation of the fat layer thickness without considering changes in blood glucose levels.
The resonant frequencies and the associated S21 (dB) magnitudes, as well as the computed permittivity, are given in Table 2.
The sensor circuit consists of a pair of microstrip transmission lines loaded with a circular CSRR unit cell at the center. The entire CSRR circuit can be modeled by an inductance L and capacitance C that are related to the microstrip transmission lines. However, the CSRR unit cell could be modeled by a capacitance Cc and the inductance Lc, which are the two key parameters required to determine the sensor’s resonant frequency. The lumped circuit model of the CSRR circuit is presented in Figure 4, and the associated resonant frequency is given by Equation (2):
It should be noted that the total capacitance Cc is significantly influenced by the electrical characteristics near the CSRR unit cell. By introducing the effects of fingertip loading (termed as superstrate), so the Equation (2) becomes:
where C0 reports the capacitance between the conductive plates and the circuit dielectric, and L0 is the inductance of the conductive plates. However, the term εSupCe is related to the capacitive effect of the environment due to the superstrate placed on the CSRR sensor.
Figure 5a–c show respectively the analyzed four-layer Cole–Cole model using Ansys HFSS, the electric field distribution on a CSRR, as well as the electric vector fields and intensity distributions across the four-layer fingertip model when loaded on the CSRR sensor at 2.3 GHz. As can be seen, the highest electric field intensity is located at the skin layer and then drastically decreases in the fat layer. The electric vector field becomes maximal at the edge of the CSRR sensor, thus enabling the induction of the blood layer. It is noteworthy that the main consideration in designing the CSRR sensor is to maximize the amount of energy coupled into and back out of tissues. For this purpose, transmission between tissue layers needs to be maximized. Therefore, signal passing between two mediums of different dielectric constant is managed by the transmission coefficient. It is also important to note that the maximum power density occurs at the skin, and the transmitted power decreases nearly exponentially in the skin as a function of depth [36].
4. Experimental Analysis of Fat Pad Thickness Effect
The systematic differences in fat pad size between the fingers lead to discrepancies in the scattering parameter measurements, which severely affects the dielectric constant estimation and the accuracy of the CSRR sensor. In this section, the effects of fat layer thickness on the S-parameter responses are analyzed using the four-layer fingertip model in Figure 1b above. In this respect, measured S-parameter data and several simulated sets of S-parameters at different fat pad thicknesses have been extracted from HFSS so that they are treated through Keysight’s Advanced Design System (ADS) software 2020.1.1.
Two-port scattering parameter measurements of the CSRR sensor, when loaded with the fingertips of a healthy participant (fasting blood glucose level: 70–99 mg/dL) at an adult age, were performed using a Rohde & Schwarz ZNB20 vector network analyzer (VNA), as shown in Figure 6. For this purpose, a pair of 50 Ω SMA coaxial connectors were soldered to both ends of the microstrip feed line to enable the measurements when connecting to the VNA. It should be noted that to remove any undesired effects on the measurements and achieve accurate producible measurements, a full two-port calibration was performed using the standard Open-Short-Load technique. The S-parameters data were recorded at an ambient temperature of +25 °C, IF BW (intermediate frequency bandwidth) at 50 Hz, and −10 dB input power for the testing port. The in vivo measurements have been performed by placing each fingertip over the whole sensing region of the sensor and then collecting the S-Parameter results from the vector network analyzer (VNA). The extracted results were correlated with the model-based computed data (the Cole–Cole relaxation model).
The measured reflection and transmission coefficients for all five fingertips under similar blood glucose concentration conditions are shown in Figure 7a,b. It should also be noted that during the S-parameter measurement process, a repeatability test is performed over a short period of time and under identical conditions (without changing anything). Moreover, several arrangements have also been taken to ensure improved scattering parameters measurement process.
These include the use of an alcohol wipe before each measurement trial to completely remove dust and humidity on the fingertip and the sensitive area of the CSRR sensor. This leads to resetting the reference resonance at S21 before reloading a new fingertip, guaranteeing accurate and repeatable measurements. Thanks to all this, a similar agreement between the results of successive measurements has been achieved.
As can be observed, a change in the resonant frequency as well as in the magnitude of S21 (dB) occurred due to the non-uniformity of tissue composition, especially the fat accumulation in the fingertips.
The analysis process consists of using two S-parameter sets having the same number of frequencies and comparing them in order, point by point. The first data set corresponds to the simulated S-parameter of the four-layer fingertip model at different resolutions of the fat layer. However, the second one is the measured S-parameter data from a participant’s fingertips. In both cases, the whole sensing area of the CSRR should be covered in order to minimize modeling errors.
In this perspective, the normalized squared difference between the computed S-parameters data at different fat thicknesses and the measurement-based S-parameters is introduced as an error function (EdB). It aims to assess the accuracy of the employed model and the impact of a change in fat layer thickness. Its general formula is given by Equation (4):
where SijA are the computed S-parameters of the four-layer fingertip model, at different fat layer thicknesses (hf = 0.1 mm, hf = 0.3 mm, hf = 0.5 mm, hf = 0.7 mm, and hf = 0.9 mm). However, SijB is the measured S-parameter data of a participant’s fingertips.
In the case of a reciprocal two-port network, as is the case with the CSRR sensor circuit, Equation (4) becomes:
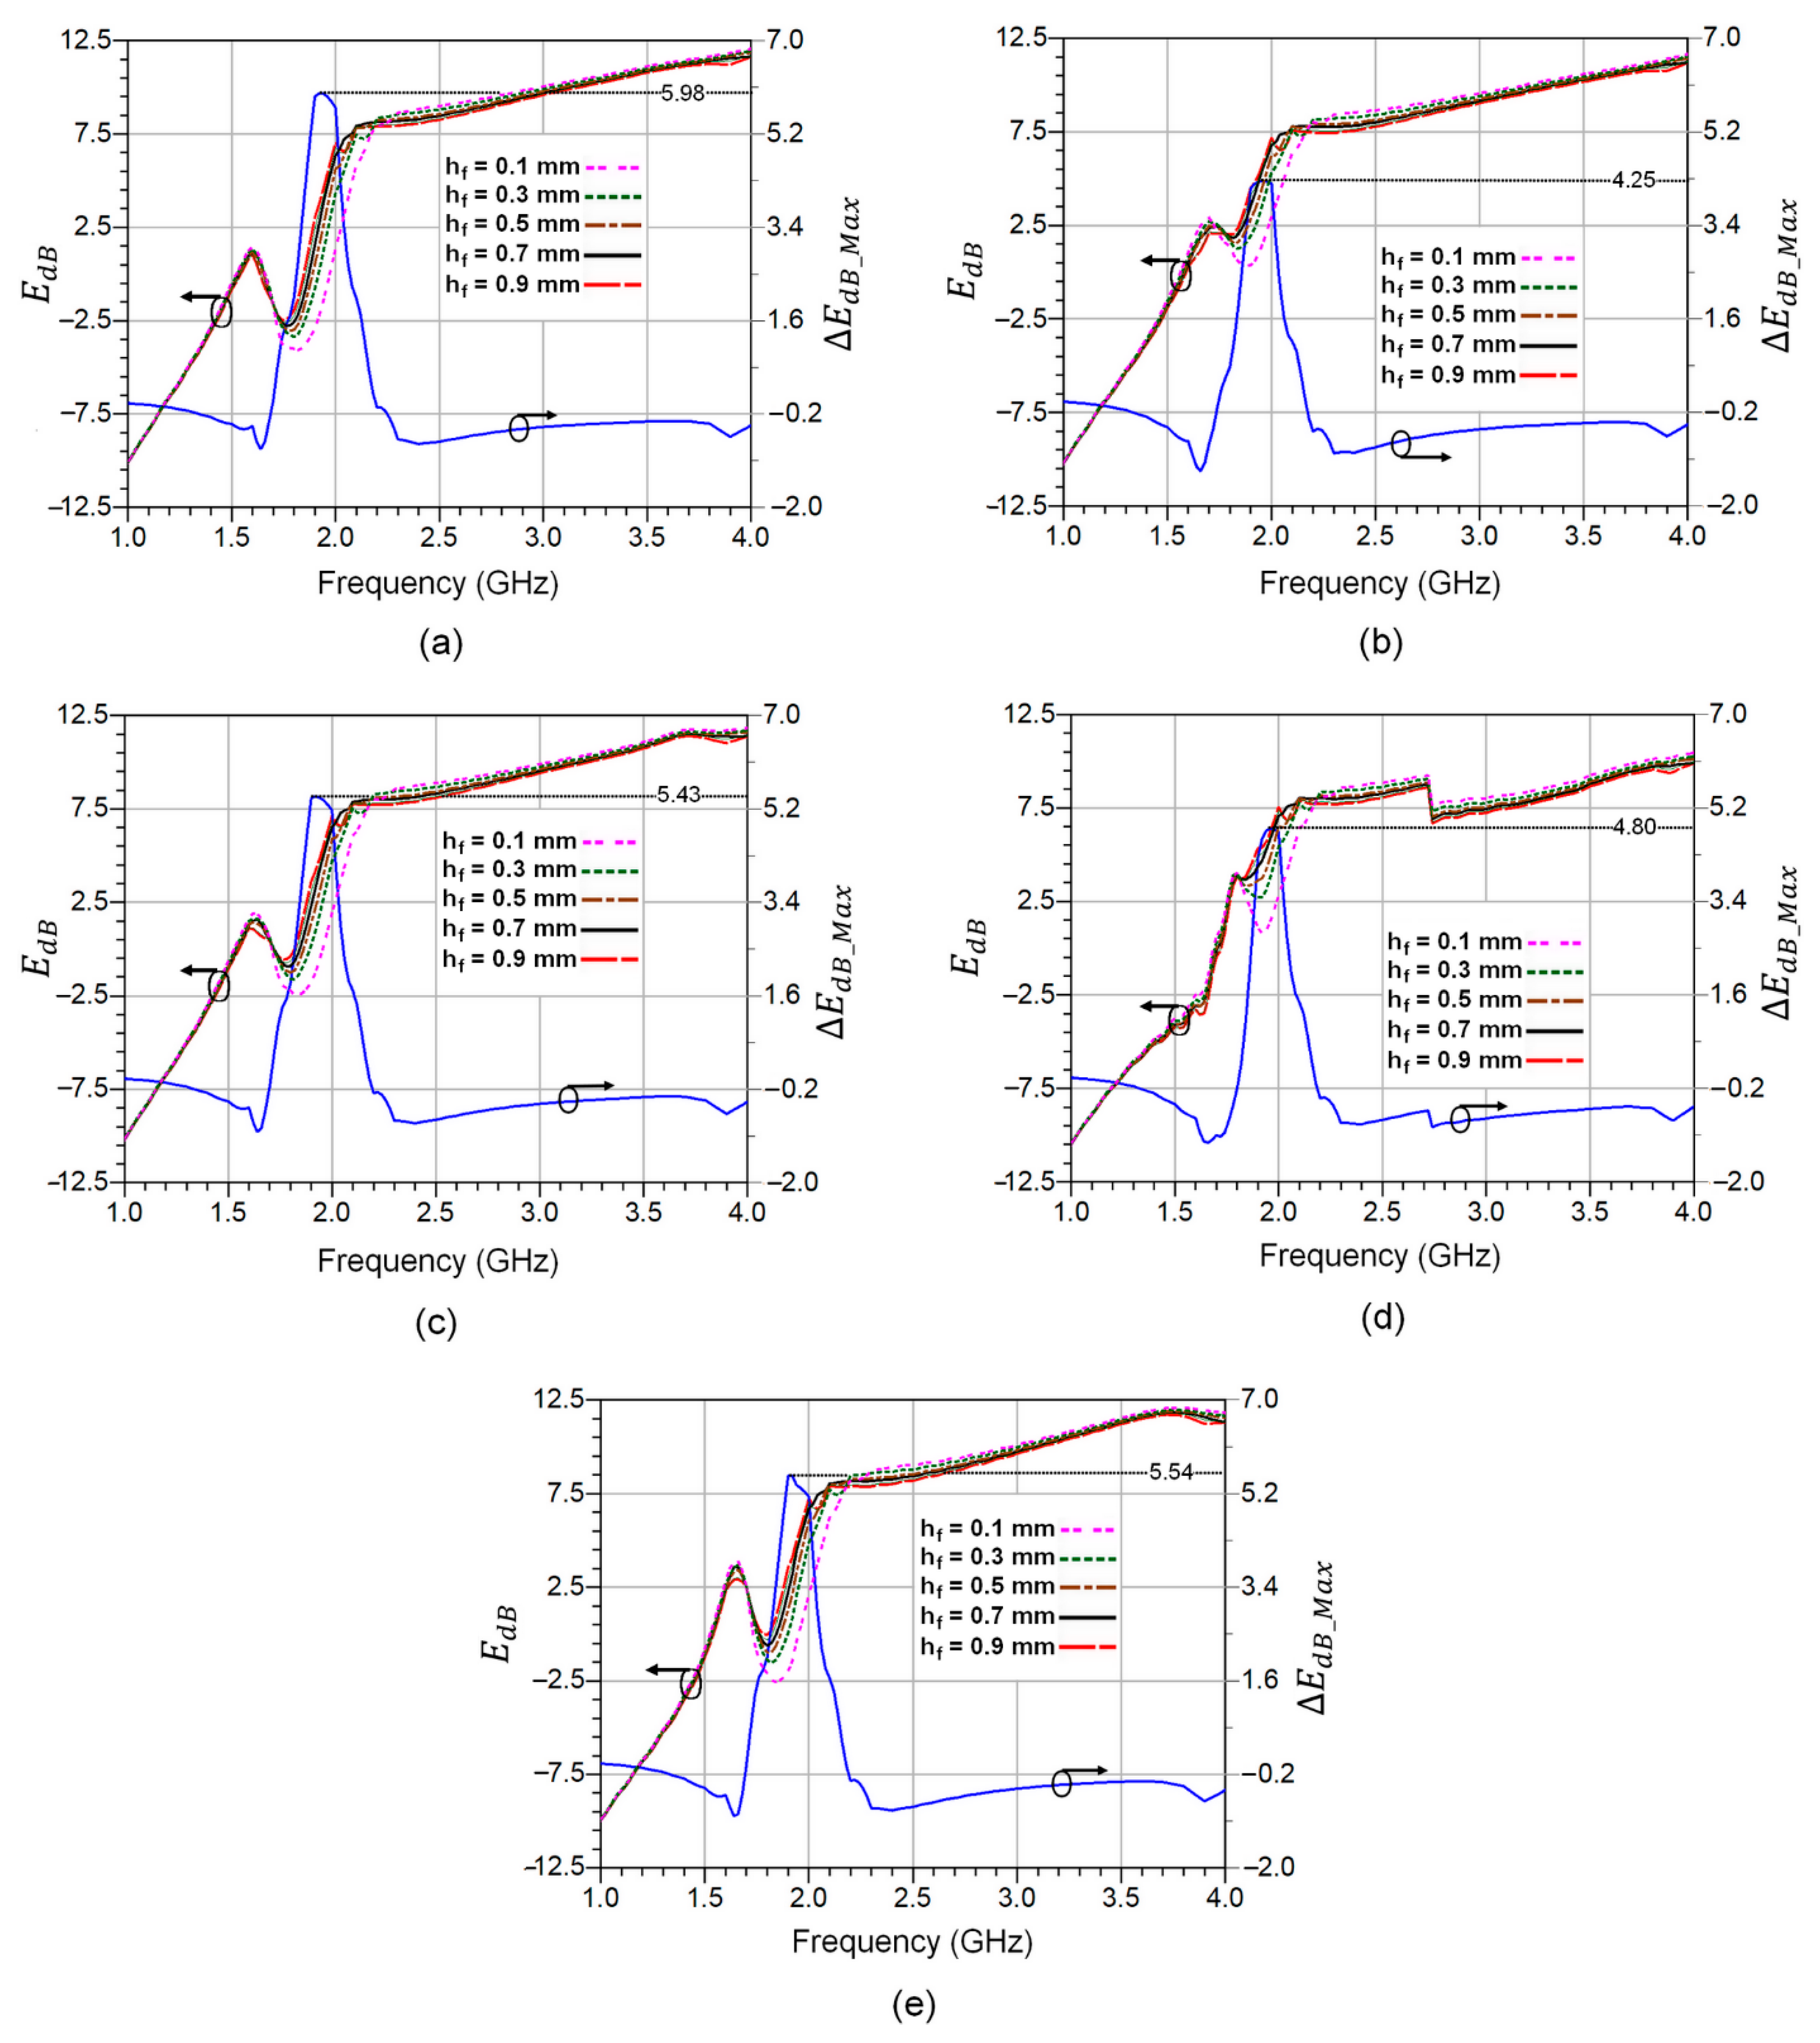
The error EdB as a function of frequency at different fat thicknesses, as well as the maximum error ∆EdB_Max, is shown in Figure 8a–e, respectively. The range of fat thickness is selected to cover different categories of individuals (lean and obese), which enables determining the maximum error deviation between these two varieties of people. It should be noted that the typical fat thickness value for normal healthy people is 0.5 mm according to the Cole–Cole relaxation model. So, the maximum error resulting from the total variation in fat thickness (∆hf = 0.8 mm) can be expressed by:
where EdB(h = 0.9mm) refers to the error at hf = 0.9 mm and EdB(h = 0.1mm) is the error at hf = 0.1 mm.
As can be seen, the change in fat thickness does not significantly affect the scattering parameters in both frequency ranges, from 1 to 1.7 GHz and from 2.3 to 4 GHz. However, the deviation between the errors becomes remarkably high within the 1.7 GHz to 2.3 GHz frequency range.
The maximum error peak achieved is 5.98 dB, corresponding to the thumb finger testing. Whereas, the minimum peak is around 4.25 dB for the index finger. Thus, the error difference for all five fingertips does not exceed 1.73 dB over the whole frequency range of interest, from 1 GHz to 4 GHz. The obtained results show that measurements performed through the index fingertip exhibit low error sensitivity compared to the rest of the fingertips, which confirms the closest agreement with the adopted Cole–Cole-based four-layers model.
5. Conclusions
Recent advances in the field of microwave planar sensors have led to a rekindled interest in biological and medical applications enabling real-time and non-invasive measurement of human tissue properties. However, the development of high-sensitivity microwave planar sensors is required for highly accurate complex permittivity measurements to monitor the small variations in various biological tissue samples. In this perspective, uncertainties in the S-parameter measurements of planar CSRR microwave sensors for non-invasive monitoring of blood glucose levels have been investigated. Especially the effect of finger fat pad thickness on scattering parameter responses as a key element in determining dielectric constant for glucose concentrations. The study was carried out based on the computed scattering parameters data of a four-layer finger tissue Cole–Cole model and measured ones from a healthy participant at an adult age. The normalized squared difference was introduced as a figure of merit (FM) for error estimation and accuracy assessment. The achieved results show that the maximum reached additional error is 5.98 dB from the thumb finger, and the minimum additional error is around 4.25 dB from the index finger. However, the maximum error difference for all five fingertips does not exceed 1.73 dB over the entire frequency range of interest, from 1 GHz to 4 GHz. This study provides key inputs for the improvement of the accuracy measurement and error compensation in planar CSRR-based microwave sensors for blood glucose level detection.
Author Contributions
C.H. contributed to the idea, simulation, analysis, measurements, and paper writing. F.D. contributed to the data analysis, measurements, and revision of the manuscript, and G.A. contributed to the analysis and revision of the manuscript. H.K. supervised the work and regularly advised until the completion of the project. All authors have read and agreed to the published version of the manuscript.
Funding
This research received no external funding.
Institutional Review Board Statement
Not applicable.
Informed Consent Statement
Informed consent was obtained from all subjects involved in the study.
Data Availability Statement
Data generated during the study are contained within the article.
Acknowledgments
The authors are grateful to Yves Chatelon for his technical assistance and his investment in the production of the Plexiglas structures.
Conflicts of Interest
The authors declare no conflict of interest.
References
- Bruen, D.; Delaney, C.; Florea, L.; Diamond, D. Glucose Sensing for Diabetes Monitoring: Recent Developments. Sensors 2017, 17, 1866. [Google Scholar] [CrossRef] [PubMed] [Green Version]
- Li, J.; Koinkar, P.; Fuchiwaki, Y.; Yasuzawa, M. A fine pointed glucose oxidase immobilized electrode for low-invasive amperometric glucose monitoring. Biosens. Bioelectron. 2016, 86, 90–94. [Google Scholar] [CrossRef] [PubMed]
- Lin, T.; Gu, S.; Lasri, T. Highly Sensitive Characterization of Glucose Aqueous Solution with Low Concentration: Application to Broadband Dielectric Spectroscopy. Sens. Actuators A Phys. 2017, 267, 318–326. [Google Scholar] [CrossRef]
- Yi, S.W.; Park, S.; Lee, Y.h.; Balkau, B.; Yi, J.J. Fasting Glucose and All-Cause Mortality by Age in Diabetes: A Prospective Cohort Study. Diabetes Care 2018, 41, 623–626. [Google Scholar] [CrossRef] [Green Version]
- Polivka, J. An Overview of Microwave Sensor Technology. High Freq. Electron. 2007, 1, 32–42. [Google Scholar]
- Hensley, S.; Farr, T. Microwave Remote Sensing and Surface Characterization; Elsevier Ltd.: San Diego, CA, USA, 2013; Volume 3, ISBN 9780080885223. [Google Scholar]
- Kayal, S.; Shaw, T.; Mitra, D. Design of Metamaterial-Based Compact and Highly Sensitive Microwave Liquid Sensor. Appl. Phys. A Mater. Sci. Process. 2020, 126, 13. [Google Scholar] [CrossRef]
- Liu, W.; Sun, H.; Xu, L. A Microwave Method for Dielectric Characterization Measurement of Small Liquids Using a Metamaterial-Based Sensor. Sensors 2018, 18, 1438. [Google Scholar] [CrossRef] [Green Version]
- Shafi, K.M.; Jha, A.K.; Akhtar, M.J. Improved planar resonant RF sensor for retrieval of permittivity and permeability of materials. IEEE Sens. J. 2017, 17, 5479–5486. [Google Scholar] [CrossRef]
- Haq, T.; Ruan, C.; Zhang, X.; Ullah, S. Complementary metamaterial sensor for non-destructive evaluation of dielectric substrates. Sensors 2019, 19, 2100. [Google Scholar] [CrossRef] [Green Version]
- Qiang, T.; Wang, C.; Kim, N.Y. Quantitative detection of glucose level based on radiofrequency patch biosensor combined with volume-fixed structures. Biosens. Bioelectron. 2017, 98, 357–363. [Google Scholar] [CrossRef]
- Ji, J.h.; Shin, K.s.; Kang, S.; Lee, S.H.; Kang, J.Y.; Kim, S.; Jun, S.C. Fundamental monomeric biomaterial diagnostics by radio frequency signal analysis. Biosens. Bioelectron. 2016, 82, 255–261. [Google Scholar] [CrossRef] [PubMed]
- Yeo, J.; Lee, J.I. High-sensitivity microwave sensor based on an interdigital-capacitor-shaped defected ground structure for permittivity characterization. Sensors 2019, 19, 498. [Google Scholar] [CrossRef] [Green Version]
- Hao, H.; Wang, D.; Wang, Z. Design of Substrate-Integrated Waveguide Loading Multiple Complementary Open Resonant Rings (CSRRs) for Dielectric Constant Measurement. Sensors 2020, 20, 857. [Google Scholar] [CrossRef] [PubMed] [Green Version]
- Martín, F.; Vélez, P.; Gil, M. Microwave Sensors Based on Resonant Elements. Sensors 2020, 20, 3375. [Google Scholar] [CrossRef] [PubMed]
- Albishi, A.M.; Badawe, M.K.E.; Nayyeri, V.; Ramahi, O.M. Enhancing the Sensitivity of Dielectric Sensors with Multiple Coupled Complementary Split-Ring Resonators. IEEE Trans. Microw. Theory Tech. 2020, 68, 4340–4347. [Google Scholar] [CrossRef]
- Jang, C.; Park, J.; Lee, H.; Yun, G.; Yook, J. Non-Invasive Fluidic Glucose Detection Based on Dual Microwave Complementary Split Ring Resonators with a Switching Circuit for Environmental Effect Elimination. IEEE Sens. J. 2020, 20, 8520–8527. [Google Scholar] [CrossRef]
- Ebrahimi, A.; Scott, J.; Ghorbani, K. Ultrahigh-sensitivity microwave sensor for microfluidic complex permittivity measurement. IEEE Trans. Microw. Theory Tech. 2019, 67, 4269–4277. [Google Scholar] [CrossRef]
- Guerchouche, K.; Herth, E.; Calvet, L.E.; Roland, N.; Loyez, C. Dielectric Characterization Based on A Printable Resonant Stub in Air and A Liquid Environment. Phys. Status Solidi Appl. Mater. Sci. 2017, 214, 1700138. [Google Scholar] [CrossRef]
- Dinh, T.H.N.; Serfaty, S.; Joubert, P.Y. Non-contact radiofrequency inductive sensor for the dielectric characterization of burn depth in organic tissues. Sensors 2019, 19, 1220. [Google Scholar] [CrossRef] [Green Version]
- Puentes, M.; Weiss, C.; Schüßler, M.; Jakoby, R. Sensor array based on split ring resonators for analysis of organic tissues. In Proceedings of the IEEEMTT-S International Microwave Symposium Digest, Baltimore, MD, USA, 5–10 June 2011. [Google Scholar]
- Abdolrazzaghi, M.; Katchinskiy, N.; Elezzabi, A.Y.; Light, P.E.; Daneshmand, M. Noninvasive Glucose Sensing in Aqueous Solutions Using an Active Split-Ring Resonator. IEEE Sens. J. 2021, 21, 18742–18755. [Google Scholar] [CrossRef]
- Yang, X.; Xiaojun, J.; Yixuan, Z.; Hui, L. Genetic rules for the dermatoglyphics of human fingertips and their role in spouse selection: A preliminary study. Springer Plus 2016, 5, 1396. [Google Scholar] [CrossRef]
- Huber, P. Inaccurate input on touch devices relating to the fingertip (Proseminar). In Media Informatics Proseminar on Interactive Surfaces; 2015; Available online: https://www.medien.ifi.lmu.de/lehre/ss15/ps/papers/Huber-InputOnTouchDevices.pdf (accessed on 20 November 2022).
- Nicholls, M.E.; Orr, C.A.; Yates, M.J.; Loftus, A.M. A new means of measuring index/ring finger (2D:4D) ratio and its association with gender and hand preference. Laterality 2008, 13, 71–91. [Google Scholar] [CrossRef] [PubMed]
- Alahnomi, R.A.; Zakaria, Z.; Yussof, Z.M.; Althuwayb, A.A.; Alhegazi, A.; Alsariera, H.; Rahman, N.A. Review of Recent Microwave Planar Resonator-Based Sensors: Techniques of Complex Permittivity Extraction, Applications, Open Challenges and Future Research Directions. Sensors 2021, 21, 2267. [Google Scholar] [CrossRef] [PubMed]
- Craig, S.M. Anatomy of the joints of the fingers. Hand Clin. 1992, 8, 693–700. [Google Scholar] [CrossRef]
- Shores, J.T. Anatomy and physiology of the fingertip. In Fingertip Injuries: Diagnosis, Management and Reconstruction; Springer International Publishing: Cham, Switzerland, 2015; pp. 1–9. [Google Scholar]
- Gabriel, S.; Lau, R.W.; Gabriel, C. The dielectric properties of biological tissues: III. Parametric models for the dielectric spectrum of tissues. Phys. Med. Biol. 1996, 41, 2271–2293. [Google Scholar] [CrossRef] [PubMed] [Green Version]
- Cole, K.; Cole, R. Dispersion and Absorption in Dielectrics I. Alternating Current Characteristics. J. Chem. Phys. 1941, 4, 341. [Google Scholar] [CrossRef] [Green Version]
- Jensen, P.D.; Meaney, P.M.; Epstien, N.R.; Paulsen, K.D. Cole–Cole Parameter Characterization of Urea and Potassium for Improving Dialysis Treatment Assessment. IEEE Antennas Wirel. Propag. Lett. 2012, 11, 1598–1601. [Google Scholar] [CrossRef]
- Dima, R.; Buonanno, G.; Costanzo, S.; Solimene, R. Robustness for the Starting Point of Two Iterative Methods for Fitting Debye or Cole–Cole Models to a Dielectric Permittivity Spectrum. Appl. Sci. 2022, 12, 5698. [Google Scholar] [CrossRef]
- Karacolak, T.; Moreland, E.C.; Topsakal, E. Cole–Cole model for glucose-dependent dielectric properties of blood plasma for continuous glucose monitoring. Microw. Opt. Technol. Lett. 2013, 55, 1160–1164. [Google Scholar] [CrossRef]
- Turgul, V.; Kale, I. Influence of fingerprints and finger positioning on accuracy of RF blood glucose measurement from fingertips. IET Electron. Lett. 2016, 53, 218–220. [Google Scholar] [CrossRef]
- Moko Technology. Available online: https://www.mokotechnology.com/fr4-pcb/ (accessed on 15 November 2022).
- Masini, J.; Shahbaz, R.; Deshours, F.; Alquié, G.; El bastami, C.; Kokabi, H. Penetration Depth in Multilayered Biological Tissues using a Compact Microwave Biosensor. In Proceedings of the 52nd European Microwave Conference (EuMC), Milan, Italy, 25–30 September 2022. [Google Scholar]
Figure 1.
Anatomy of a human fingertip in (a) and the adopted Cole–Cole-based four-layers fingertip model in (b).
Figure 1.
Anatomy of a human fingertip in (a) and the adopted Cole–Cole-based four-layers fingertip model in (b).

Figure 2.
The designed CSRR circuit: (a) the geometrical parameters, (b) the photograph of the fabricated circuit prototype, (c) the geometrical dimensions of the fixture, and (d) the measured and simulated S-parameters of the CSRR sensor circuit prior to loading.
Figure 2.
The designed CSRR circuit: (a) the geometrical parameters, (b) the photograph of the fabricated circuit prototype, (c) the geometrical dimensions of the fixture, and (d) the measured and simulated S-parameters of the CSRR sensor circuit prior to loading.

Figure 3.
The simulated S-parameters of the CSRR sensor circuit at various fat layer thicknesses: the reflection coefficients in (a) and transmission coefficients in (b).
Figure 3.
The simulated S-parameters of the CSRR sensor circuit at various fat layer thicknesses: the reflection coefficients in (a) and transmission coefficients in (b).
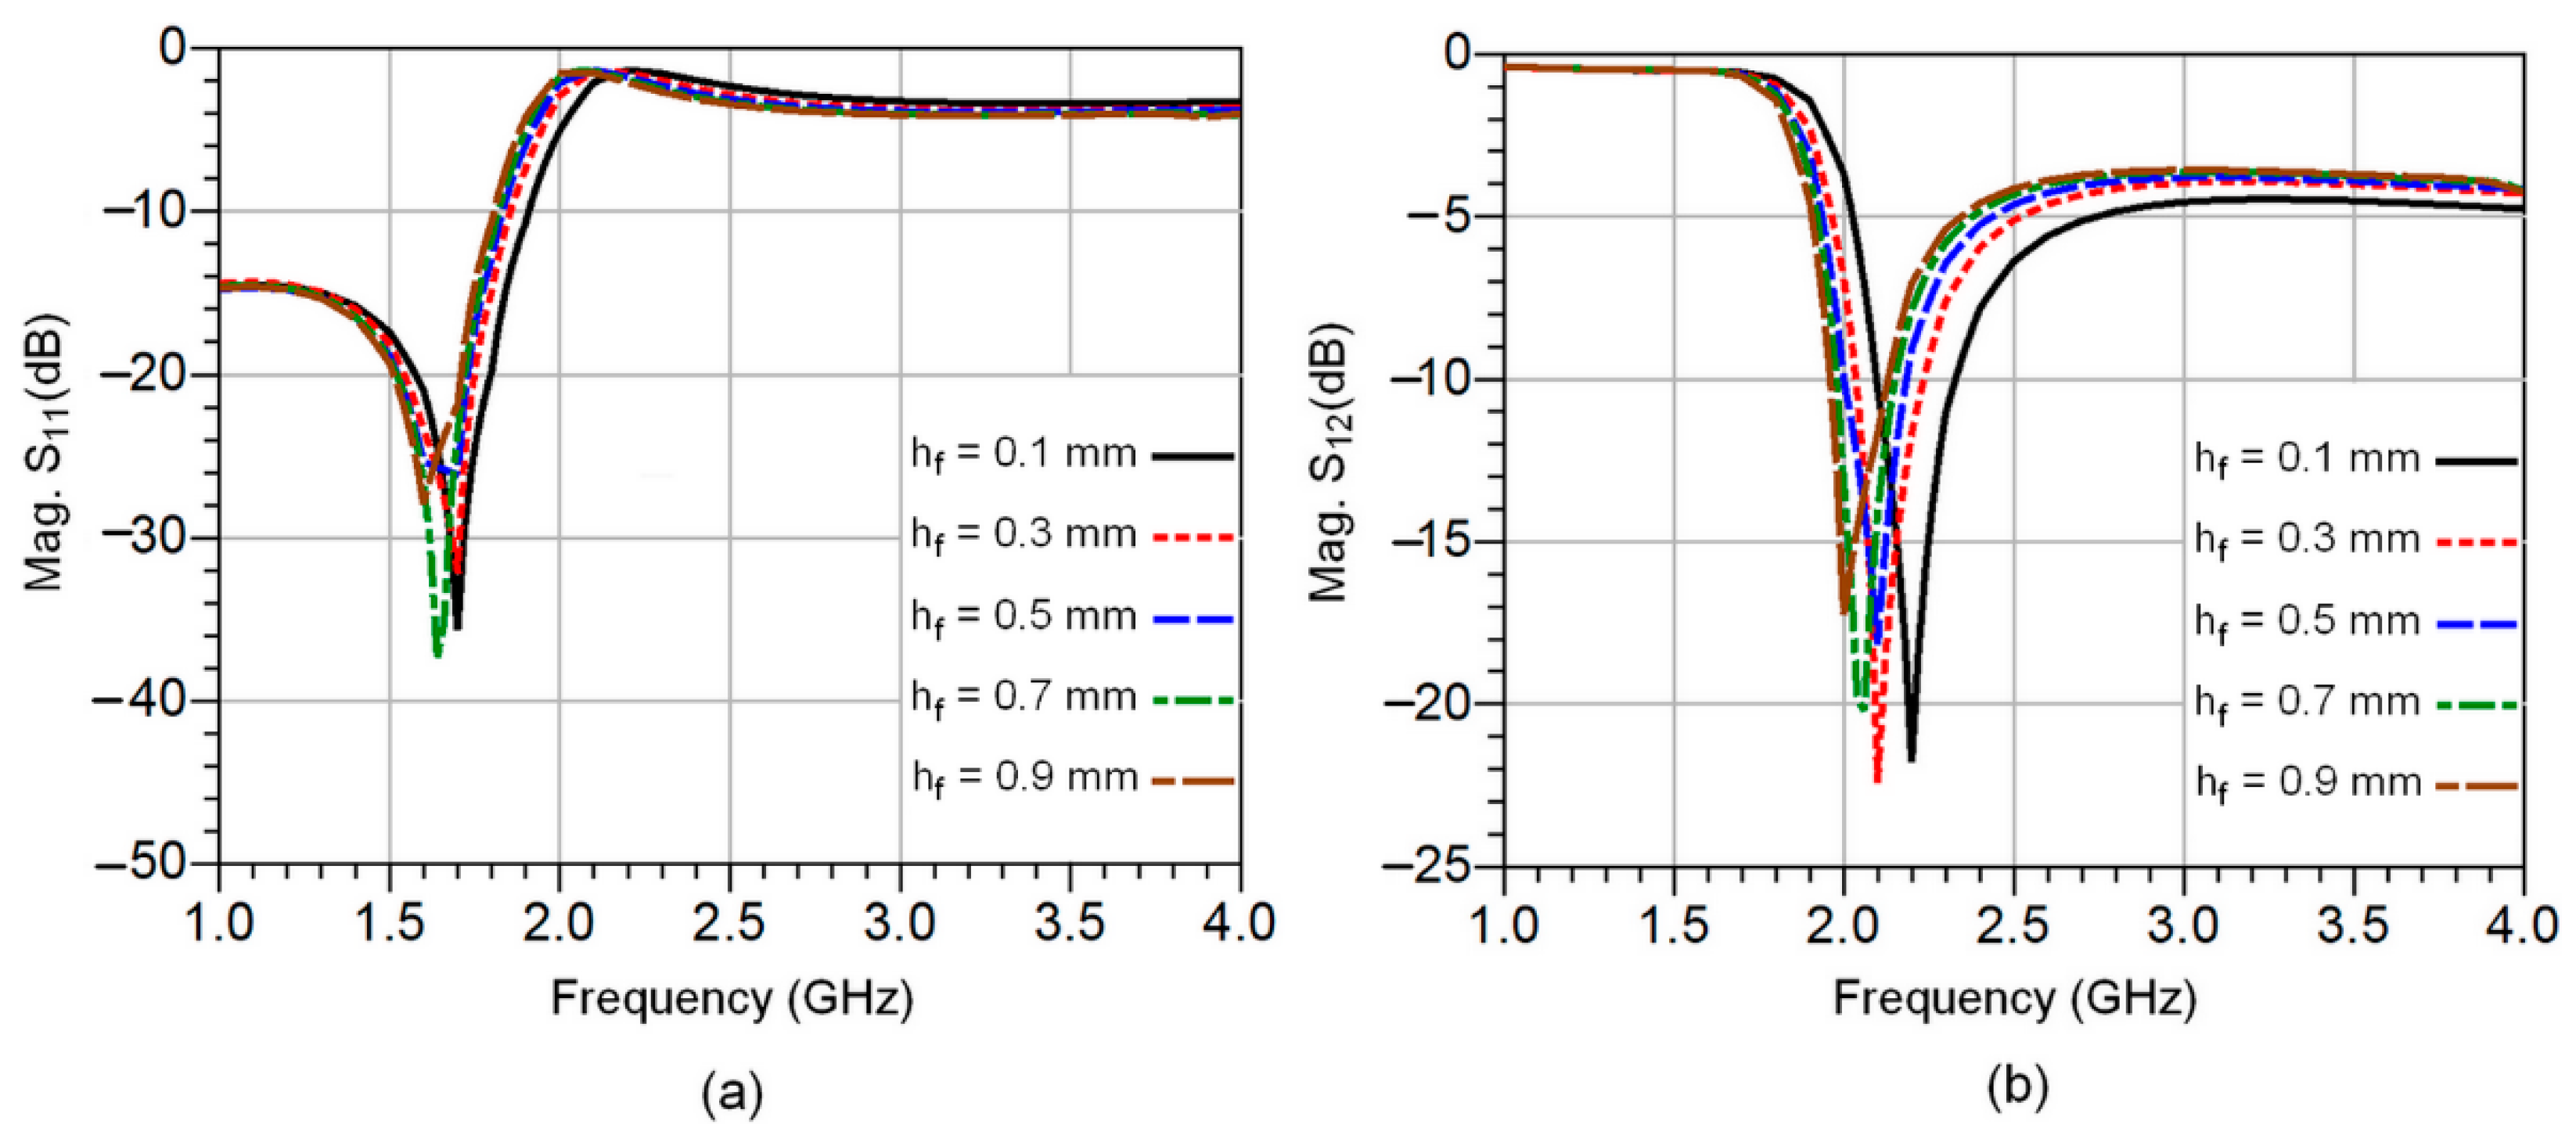
Figure 4.
Equivalent circuit model of the proposed sensor in (a) and capacitive effects associated with the fingertip placement on the CSRR-sensitive area in (b).
Figure 4.
Equivalent circuit model of the proposed sensor in (a) and capacitive effects associated with the fingertip placement on the CSRR-sensitive area in (b).
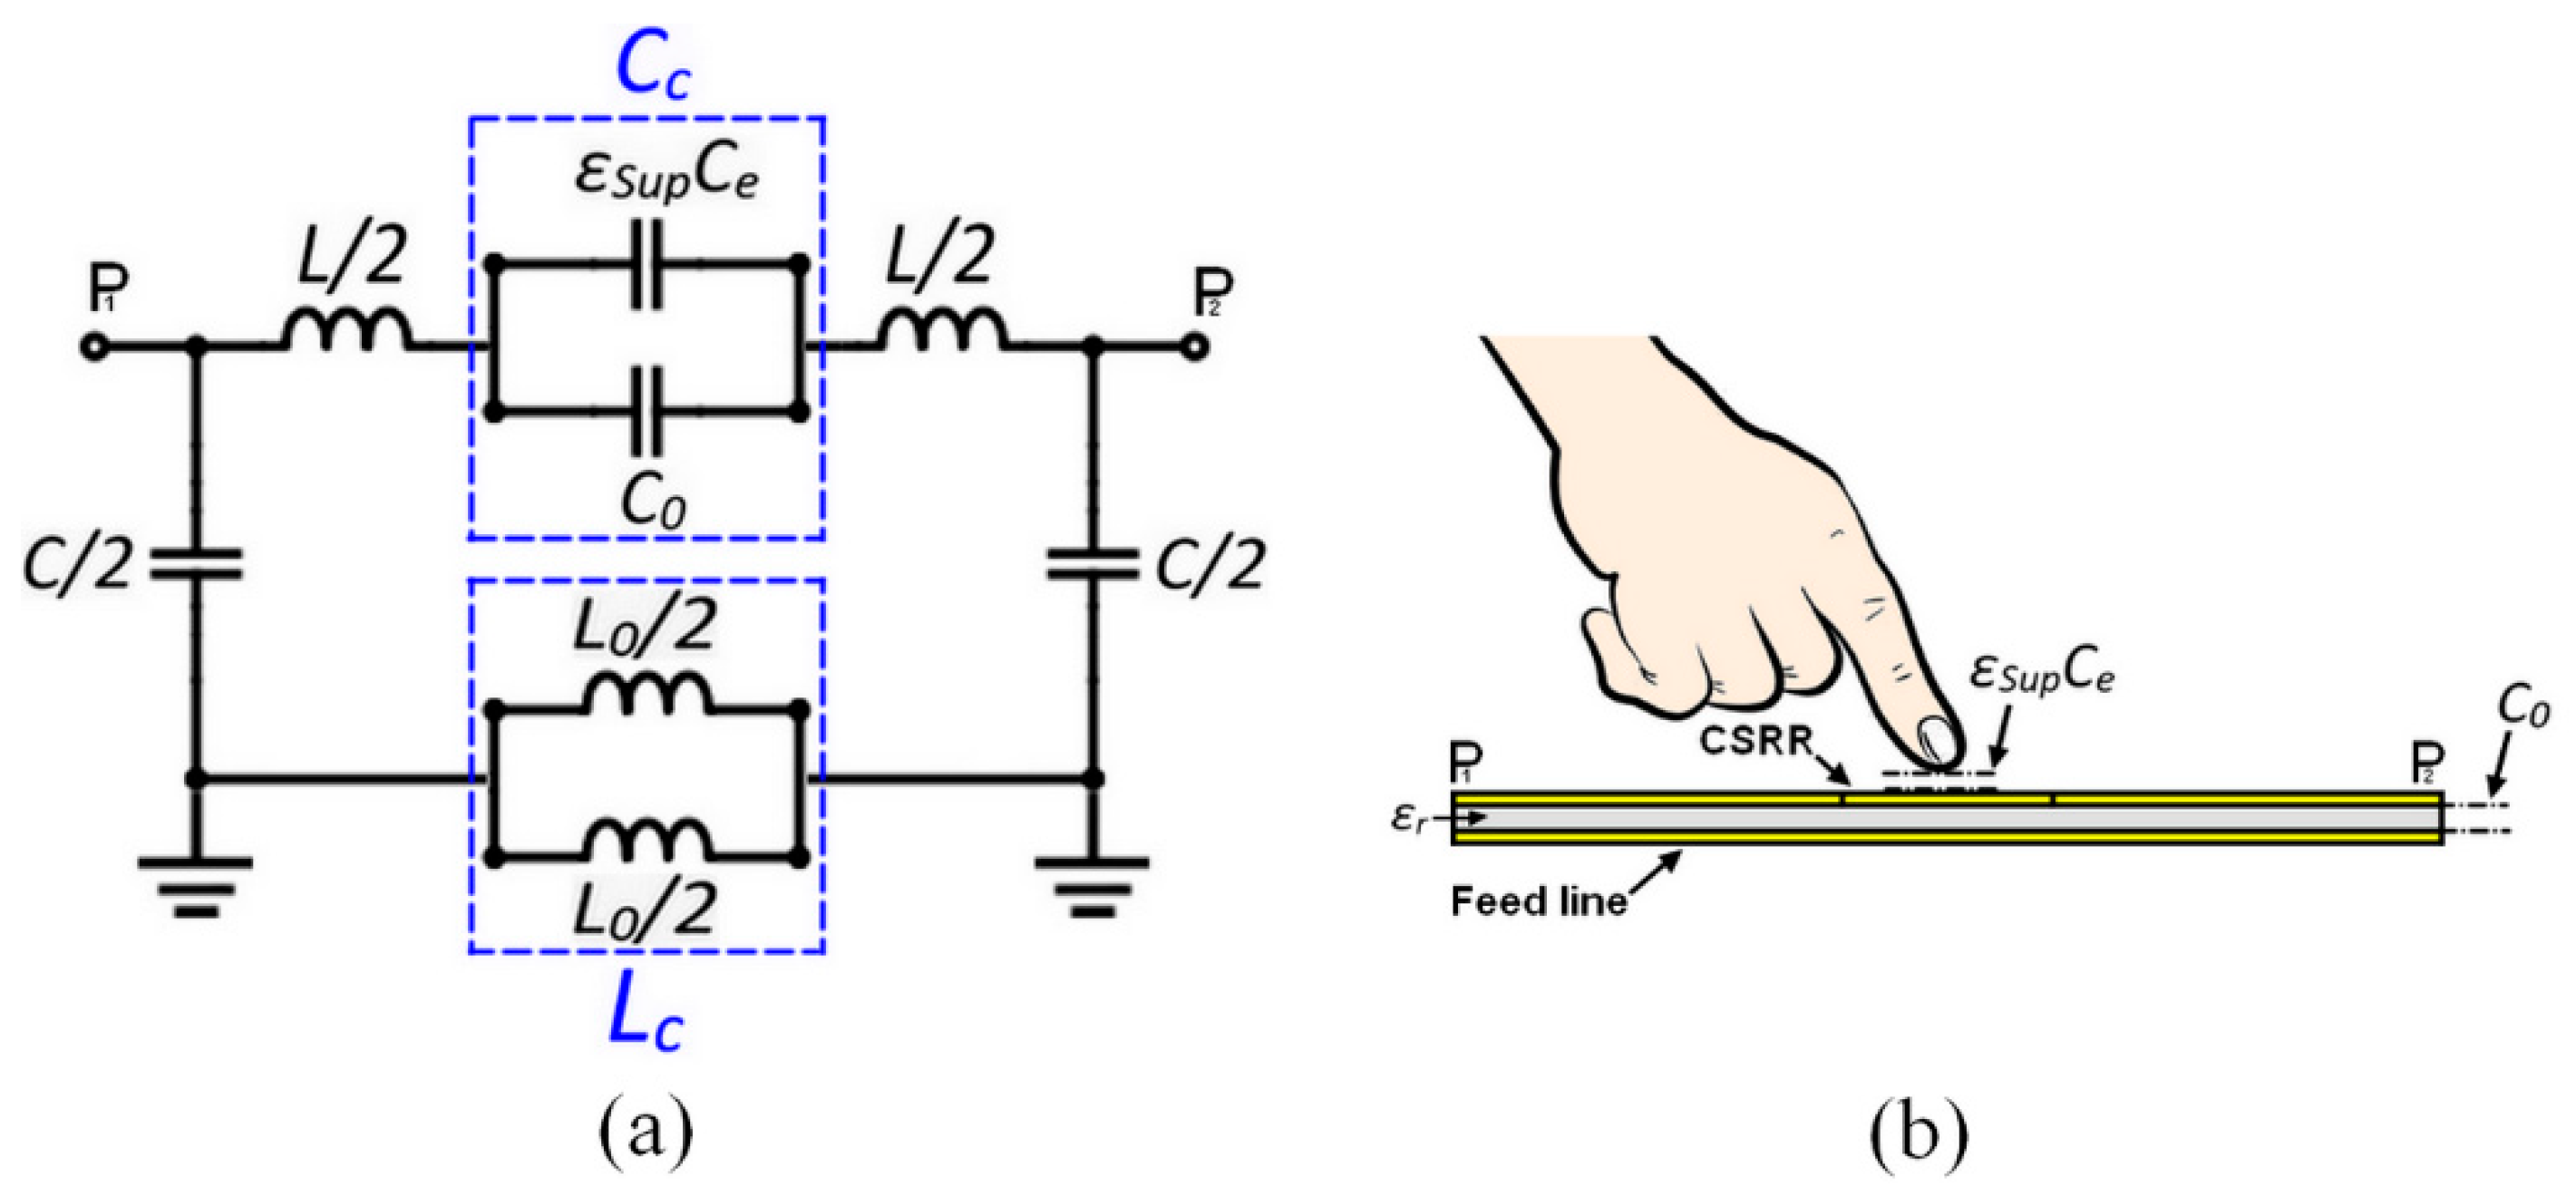
Figure 5.
The analyzed four-layers Cole–Cole finger model along with the CSRR sensor using HFSS in (a) the electric field distribution on the CSRR at the resonance frequency of 2.3 GHz in (b) the distribution of electric vector fields and intensity across the four-layers fingertip model in (c).
Figure 5.
The analyzed four-layers Cole–Cole finger model along with the CSRR sensor using HFSS in (a) the electric field distribution on the CSRR at the resonance frequency of 2.3 GHz in (b) the distribution of electric vector fields and intensity across the four-layers fingertip model in (c).

Figure 6.
Setup for S-parameter measurement of the manufactured CSRR sensor when loaded with the fingertips of a healthy participant in adult age.
Figure 6.
Setup for S-parameter measurement of the manufactured CSRR sensor when loaded with the fingertips of a healthy participant in adult age.
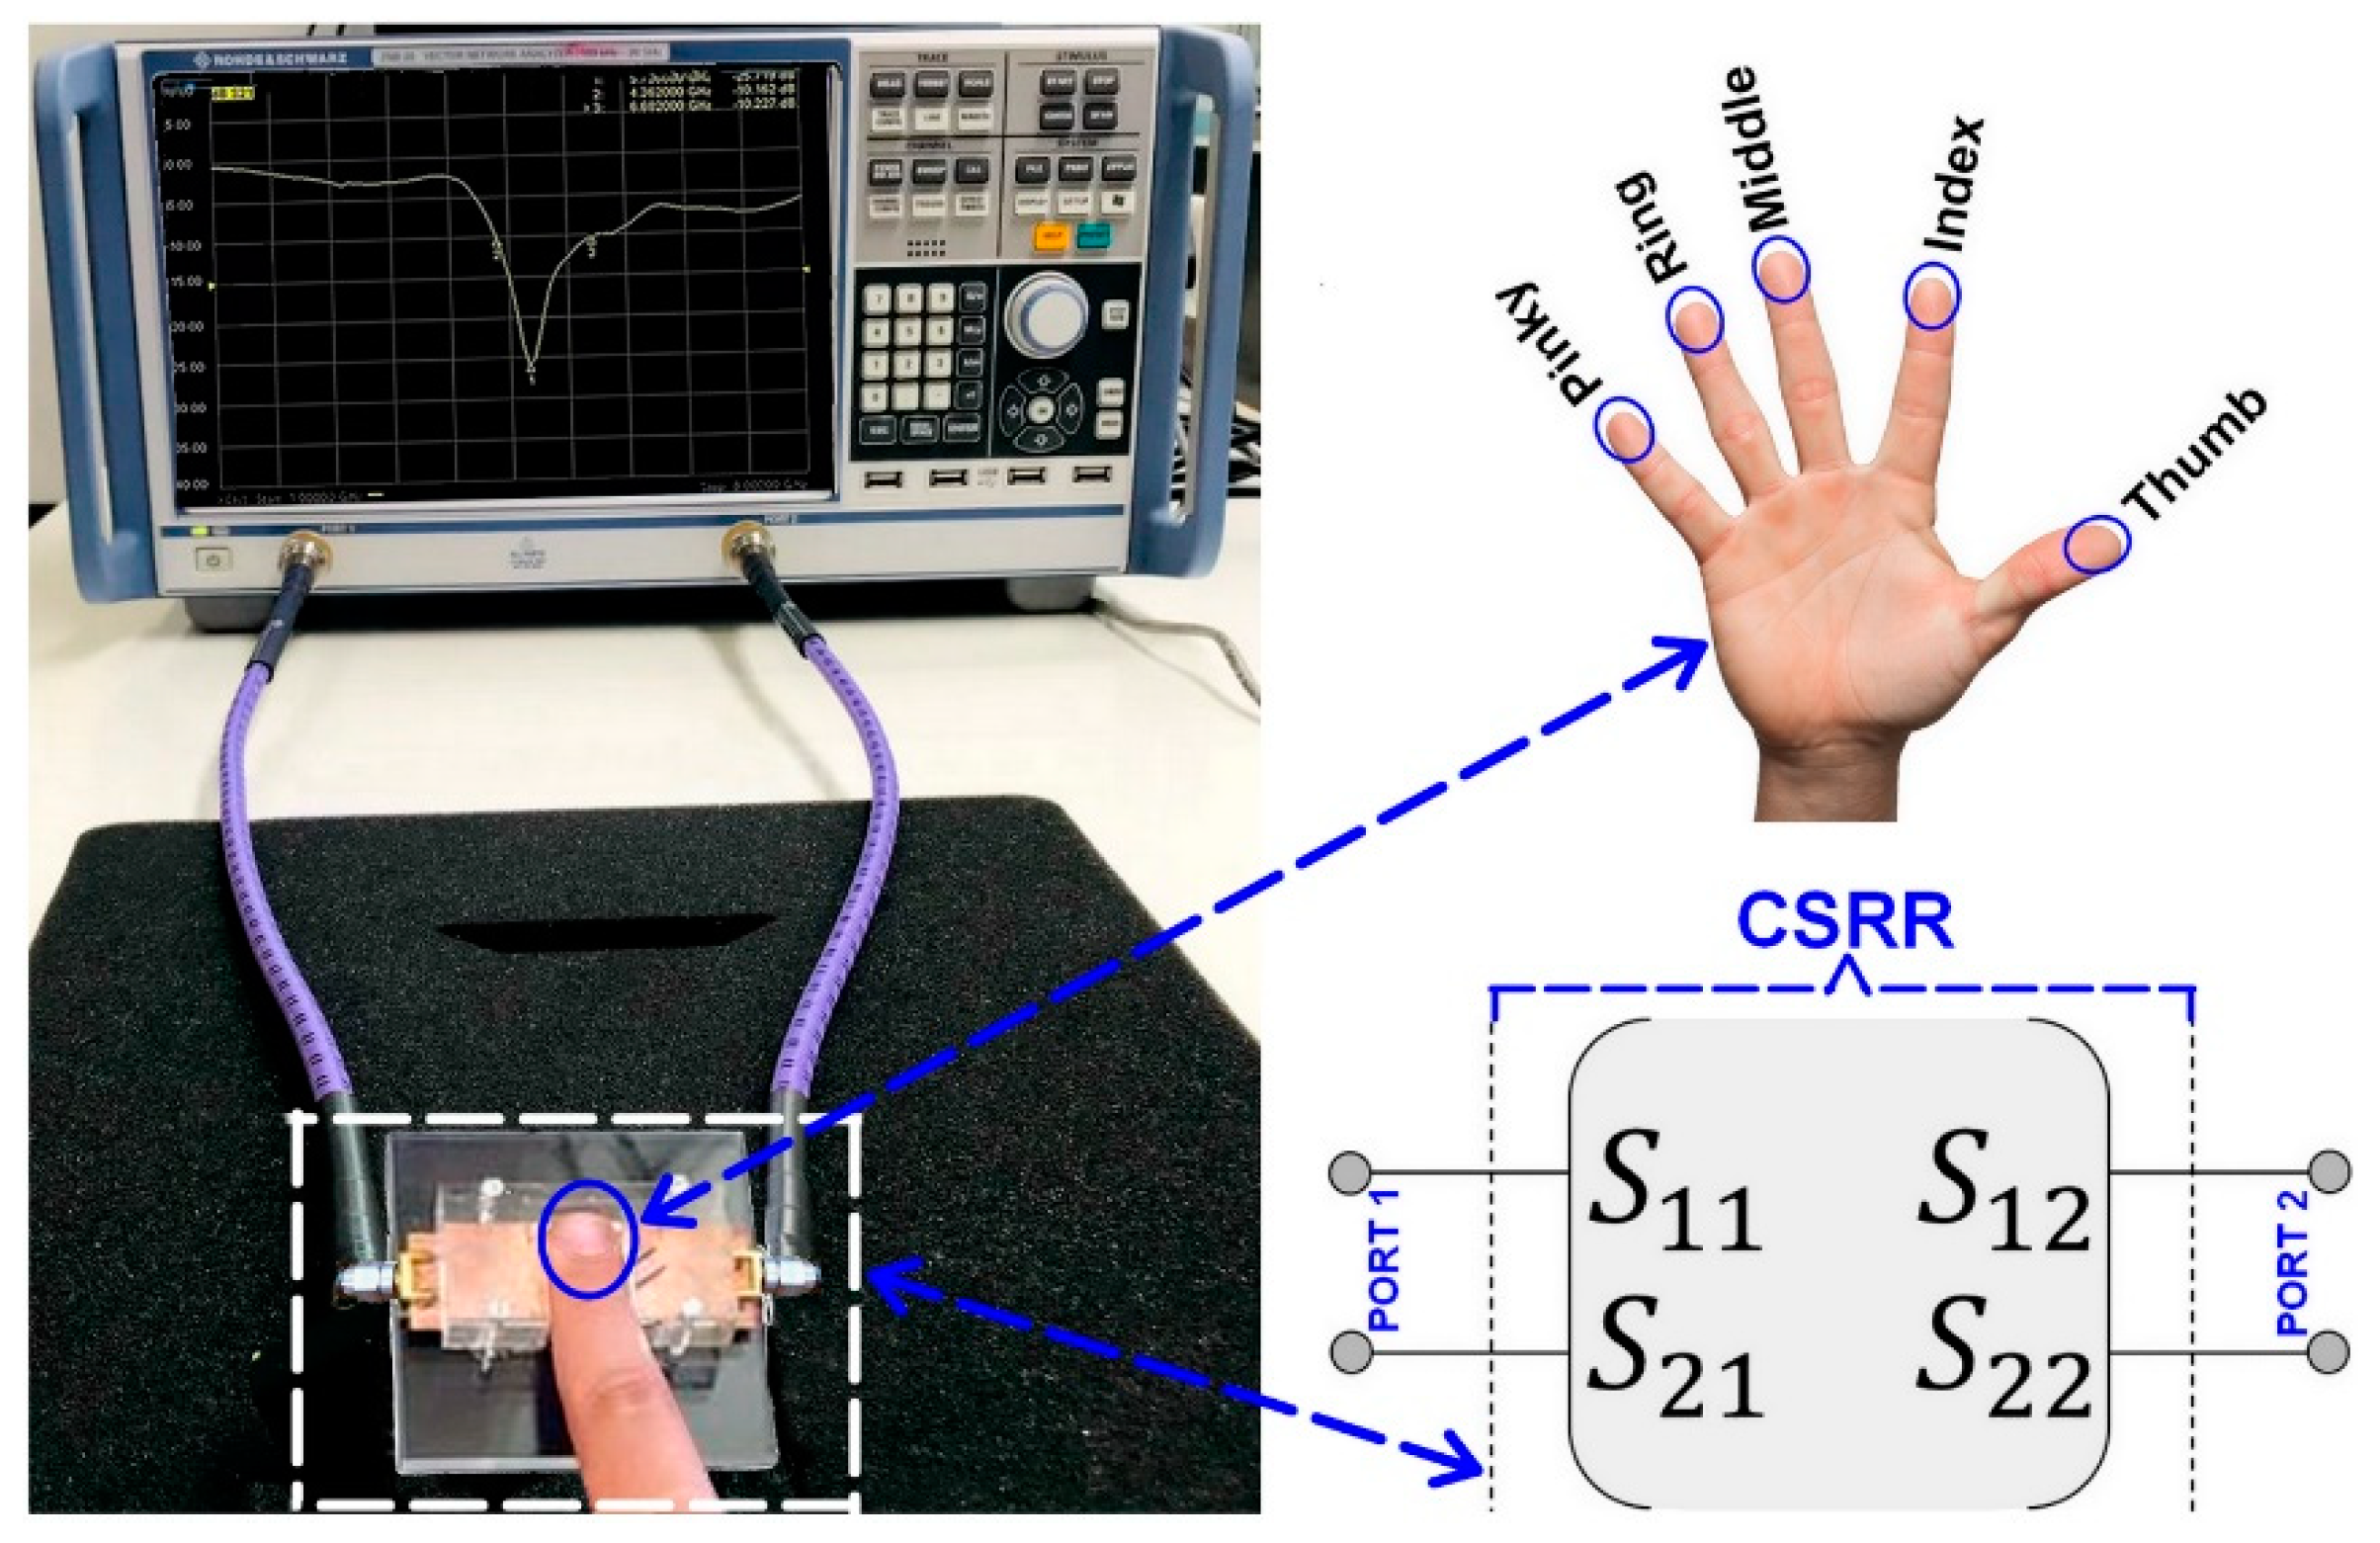
Figure 7.
The simulated S-parameters of the CSRR sensor circuit for all five fingertips: the reflection coefficients in (a) and transmission coefficients in (b).
Figure 7.
The simulated S-parameters of the CSRR sensor circuit for all five fingertips: the reflection coefficients in (a) and transmission coefficients in (b).

Figure 8.
The error EdB and the maximum error ∆EdB_Max for all five fingertips at different fat thicknesses as a function of frequency: (a) Thumb finger; (b) Index finger; (c) Middle finger; (d) Ring finger; and (e) Pinky finger.
Figure 8.
The error EdB and the maximum error ∆EdB_Max for all five fingertips at different fat thicknesses as a function of frequency: (a) Thumb finger; (b) Index finger; (c) Middle finger; (d) Ring finger; and (e) Pinky finger.

Table 1.
Parameters of the studied Cole–Cole-based four-layers fingertip model.
| Parameter | Skin | Fat | Blood | Bone |
|---|---|---|---|---|
| Thickness | hs = 1 mm | hf = 0.5 mm | hb = 5 mm | hB = 4 mm |
| Permittivity | 35 | 5.5 | 59 | 20 |
Table 2.
Resonant frequencies, S21 (dB) magnitudes, and dielectric constants for different fat layer thicknesses.
Table 2.
Resonant frequencies, S21 (dB) magnitudes, and dielectric constants for different fat layer thicknesses.
| Fat Thick. hf (mm) | 0.1 | 0.3 | 0.5 | 0.7 | 0.9 |
| Res. Freq. fr (GHz) | 2.2 | 2.1 | 2.08 | 2.05 | 2 |
| Δfr (GHz) | 0.1 | 0.2 | 0.22 | 0.25 | 0.3 |
| S12 (dB) | −21.78 | −22.34 | −18.16 | −22.76 | −17.27 |
| Permittivity | 4.97 | 6.47 | 6.98 | 7.33 | 8.83 |
Disclaimer/Publisher’s Note: The statements, opinions and data contained in all publications are solely those of the individual author(s) and contributor(s) and not of MDPI and/or the editor(s). MDPI and/or the editor(s) disclaim responsibility for any injury to people or property resulting from any ideas, methods, instructions or products referred to in the content. |
© 2023 by the authors. Licensee MDPI, Basel, Switzerland. This article is an open access article distributed under the terms and conditions of the Creative Commons Attribution (CC BY) license (https://creativecommons.org/licenses/by/4.0/).
Share and Cite
MDPI and ACS Style
Hannachi, C.; Deshours, F.; Alquie, G.; Kokabi, H. Assessment of Finger Fat Pad Effect on CSRR-Based Sensor Scattering Parameters for Non-Invasive Blood Glucose Level Detection. Sensors 2023, 23, 473. https://doi.org/10.3390/s23010473
AMA Style
Hannachi C, Deshours F, Alquie G, Kokabi H. Assessment of Finger Fat Pad Effect on CSRR-Based Sensor Scattering Parameters for Non-Invasive Blood Glucose Level Detection. Sensors. 2023; 23(1):473. https://doi.org/10.3390/s23010473
Chicago/Turabian StyleHannachi, Chaouki, Frédérique Deshours, George Alquie, and Hamid Kokabi. 2023. "Assessment of Finger Fat Pad Effect on CSRR-Based Sensor Scattering Parameters for Non-Invasive Blood Glucose Level Detection" Sensors 23, no. 1: 473. https://doi.org/10.3390/s23010473
Note that from the first issue of 2016, this journal uses article numbers instead of page numbers. See further details here.