
Exploiting the PIR Sensor Analog Behavior as Thermoreceptor: Movement Direction Classification Based on Spiking Neurons
 ,
,  ,
,
Abstract
:1. Introduction
A Bioinspired Focus of the PIR Sensors Application
- Analog use of sensor without Fresnel lens;
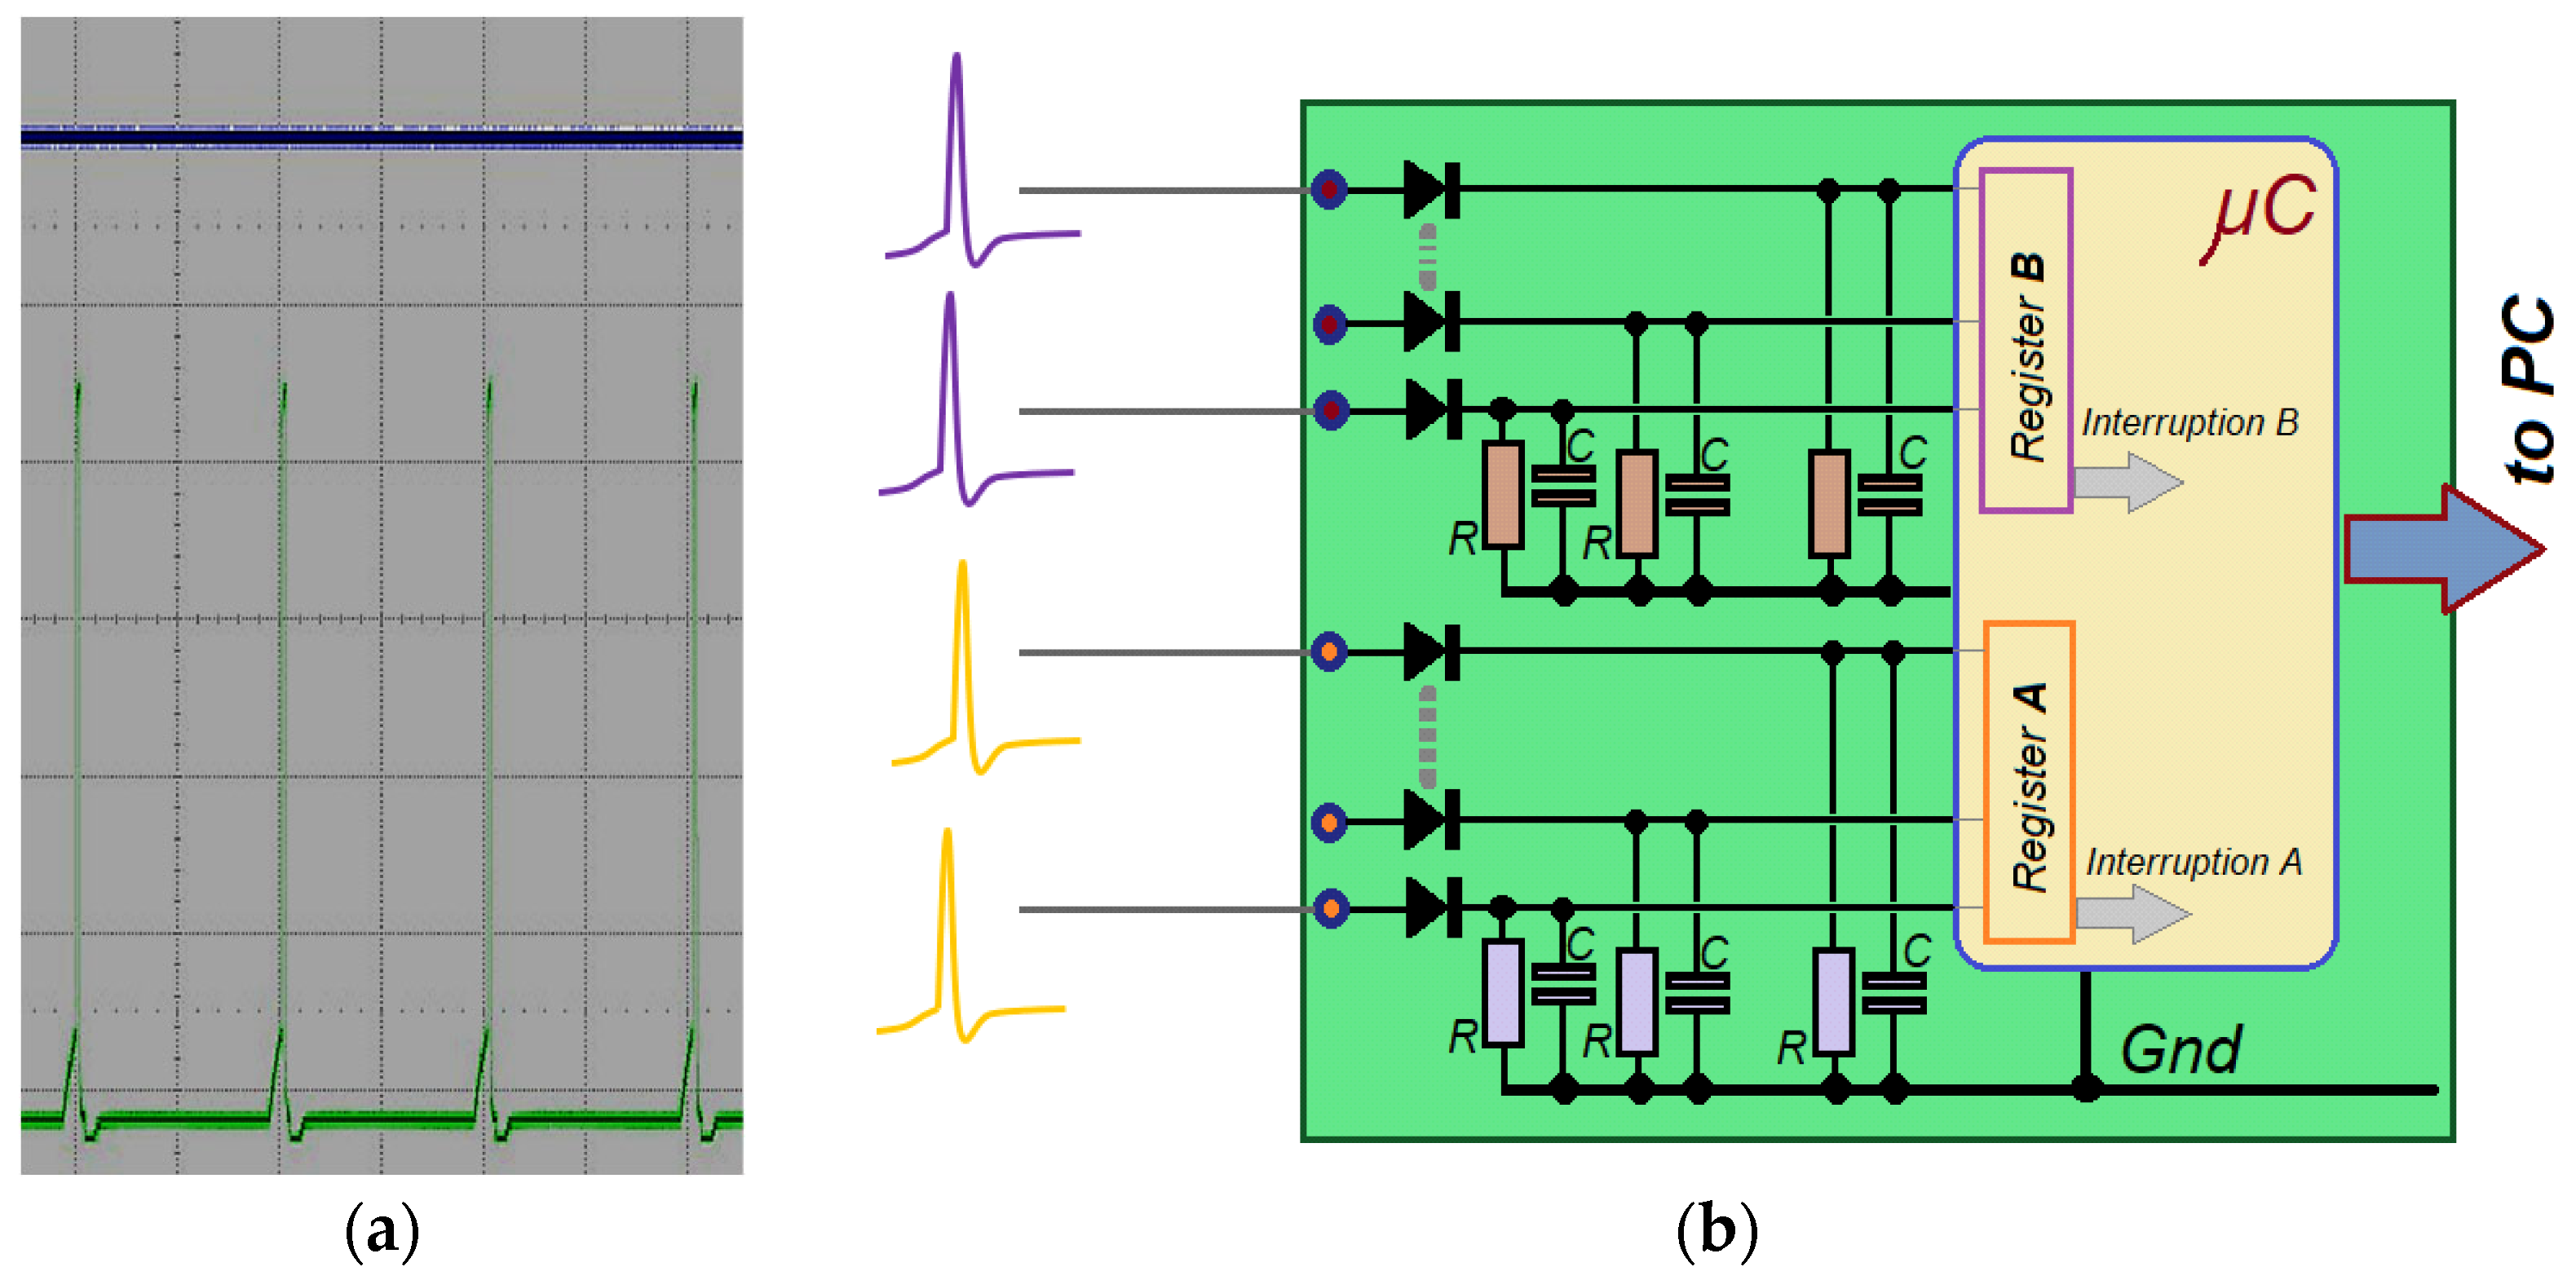
- The design and development of a circuit to process the PIR detector as a sensitive spiking cell;
- A procedure based on digital signal processing techniques, using digital filter implementation to obtain fast algorithms;
- An arrangement of array-type sensors to convert them into very low-resolution image sensors, but with the ability to process optical flow.
2. Materials and Methods
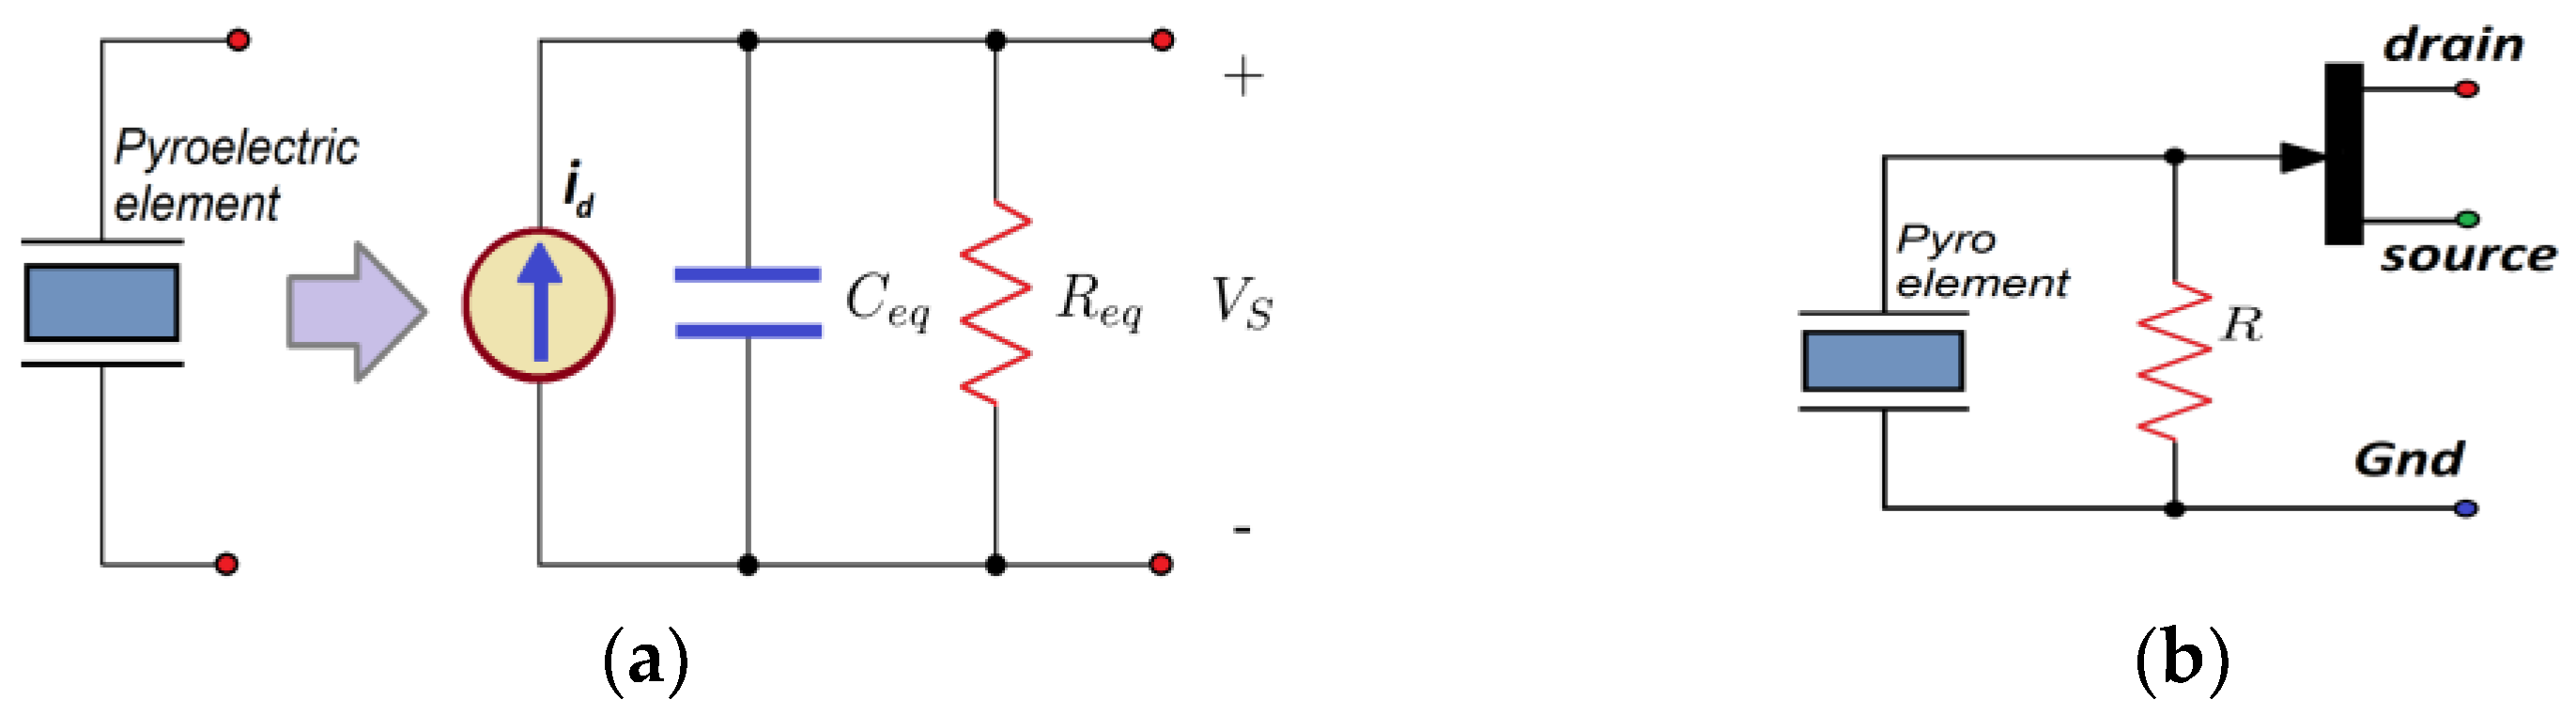
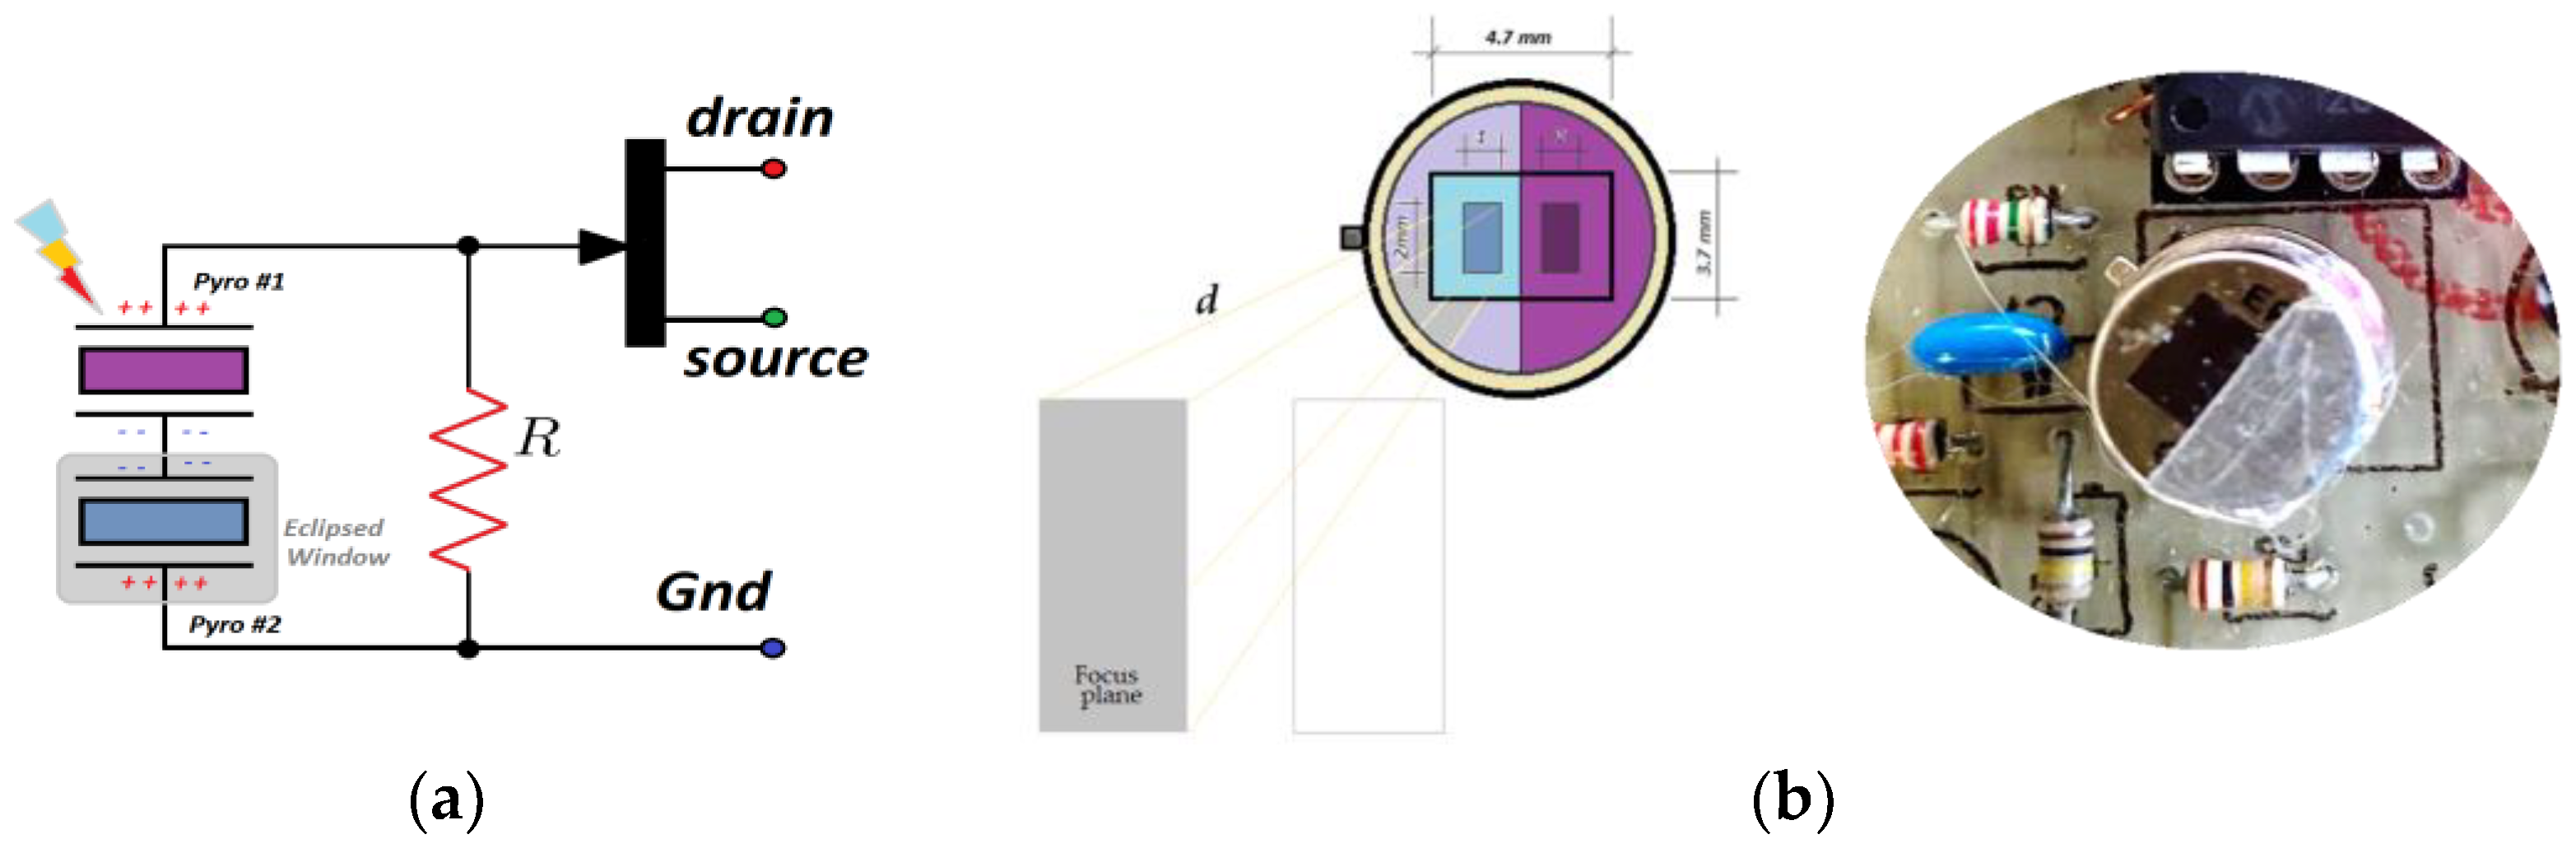
2.1. The PIR Sensors and Spiking Sensory Cell Emulation
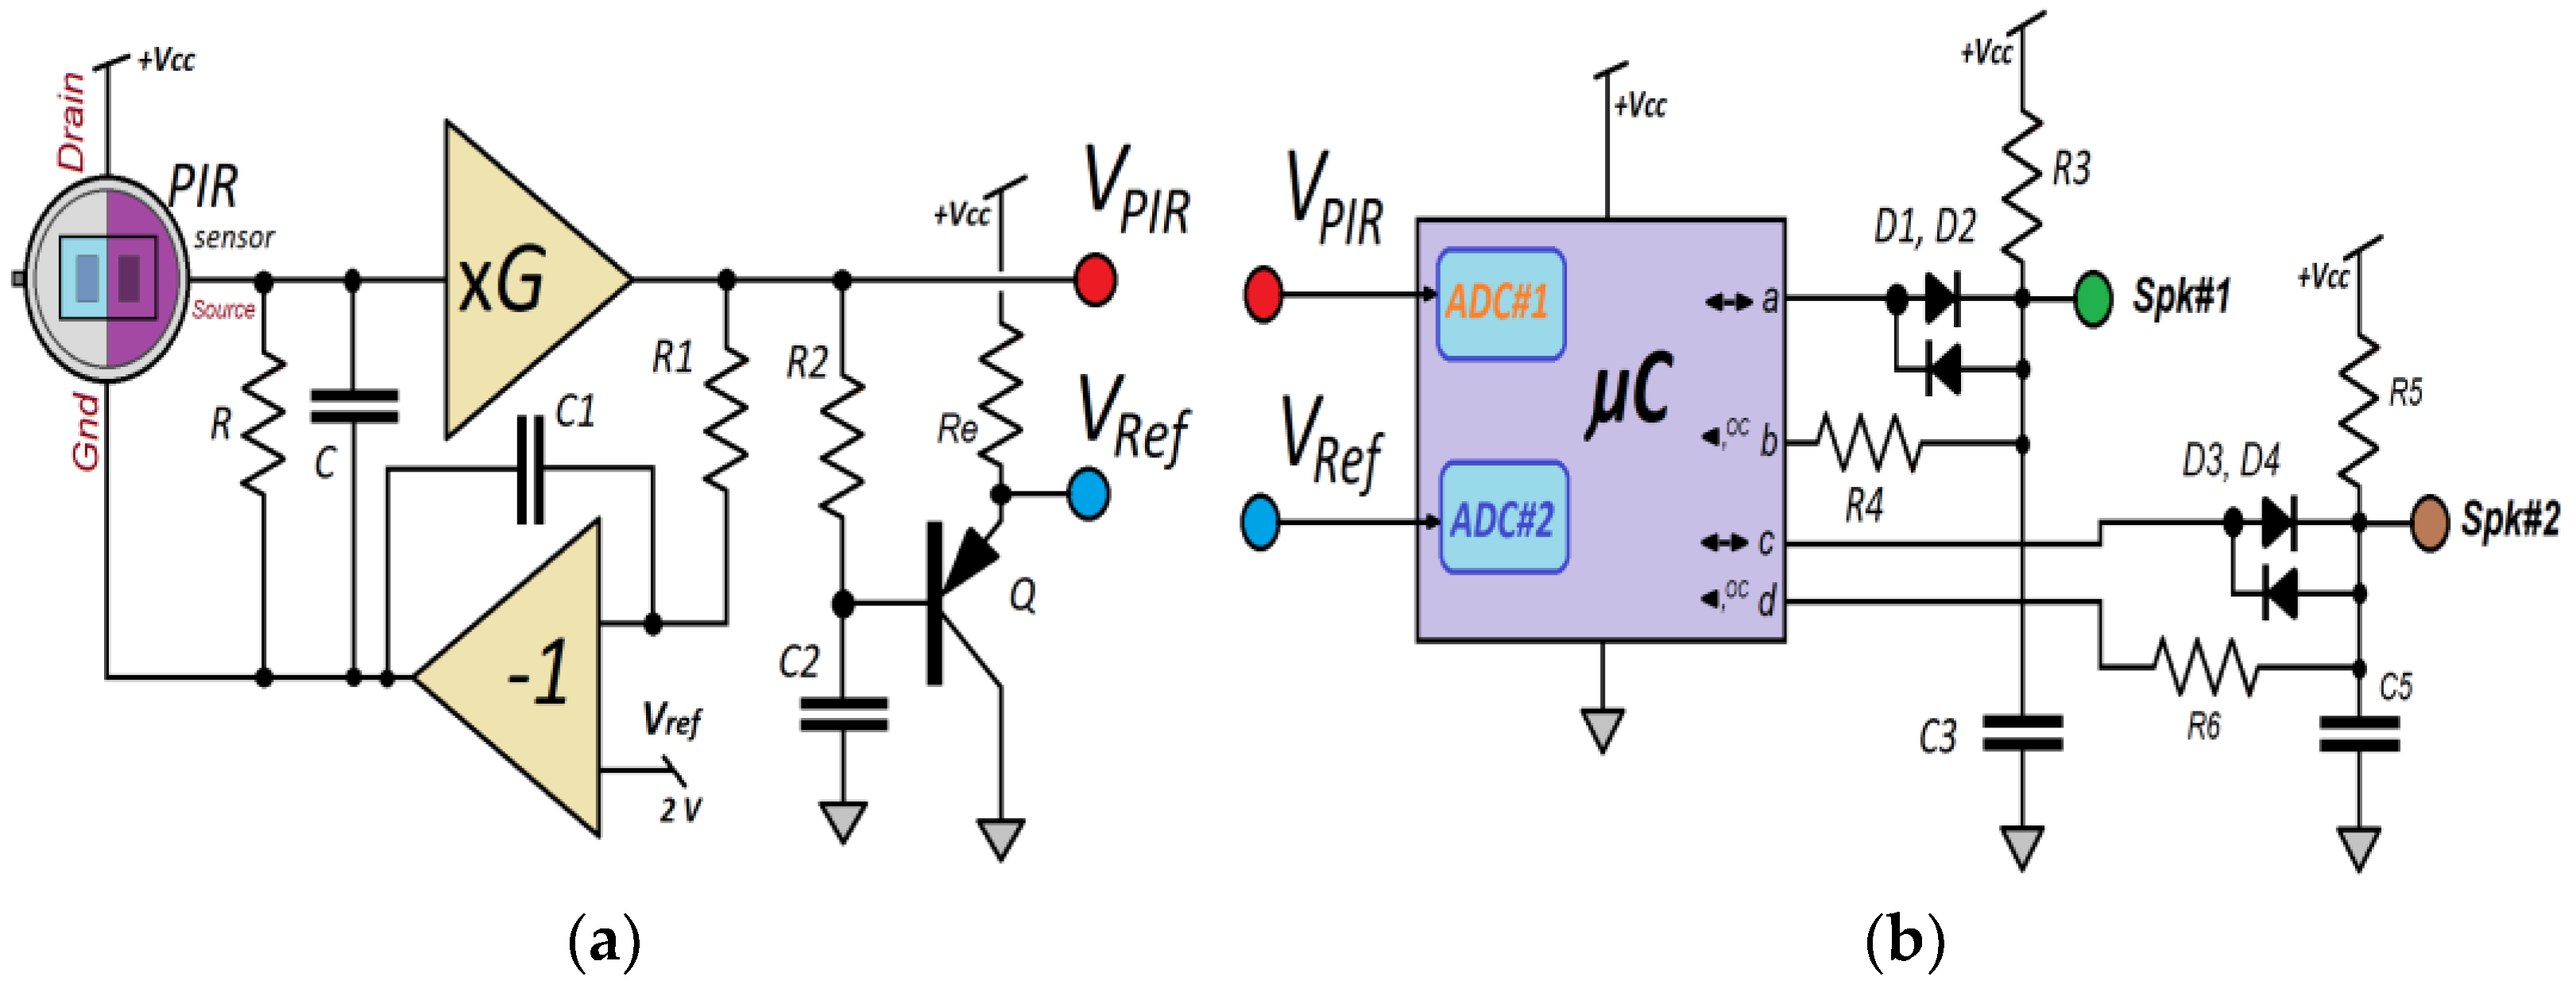
- The voltage generated by the PIR sensor is amplified through one operational amplifier (non-inverting). This output is again filtered using a passive RC network (R2 and C2, Figure 5a);
- The filtered output after R2 and C2 now increments the offset level (due to emitter follower topology around transistor Q) about 0.6 V. This voltage, VRef, higher than the quiescent VPIR, is the reference actual value of the VPIR − VRef conversion;
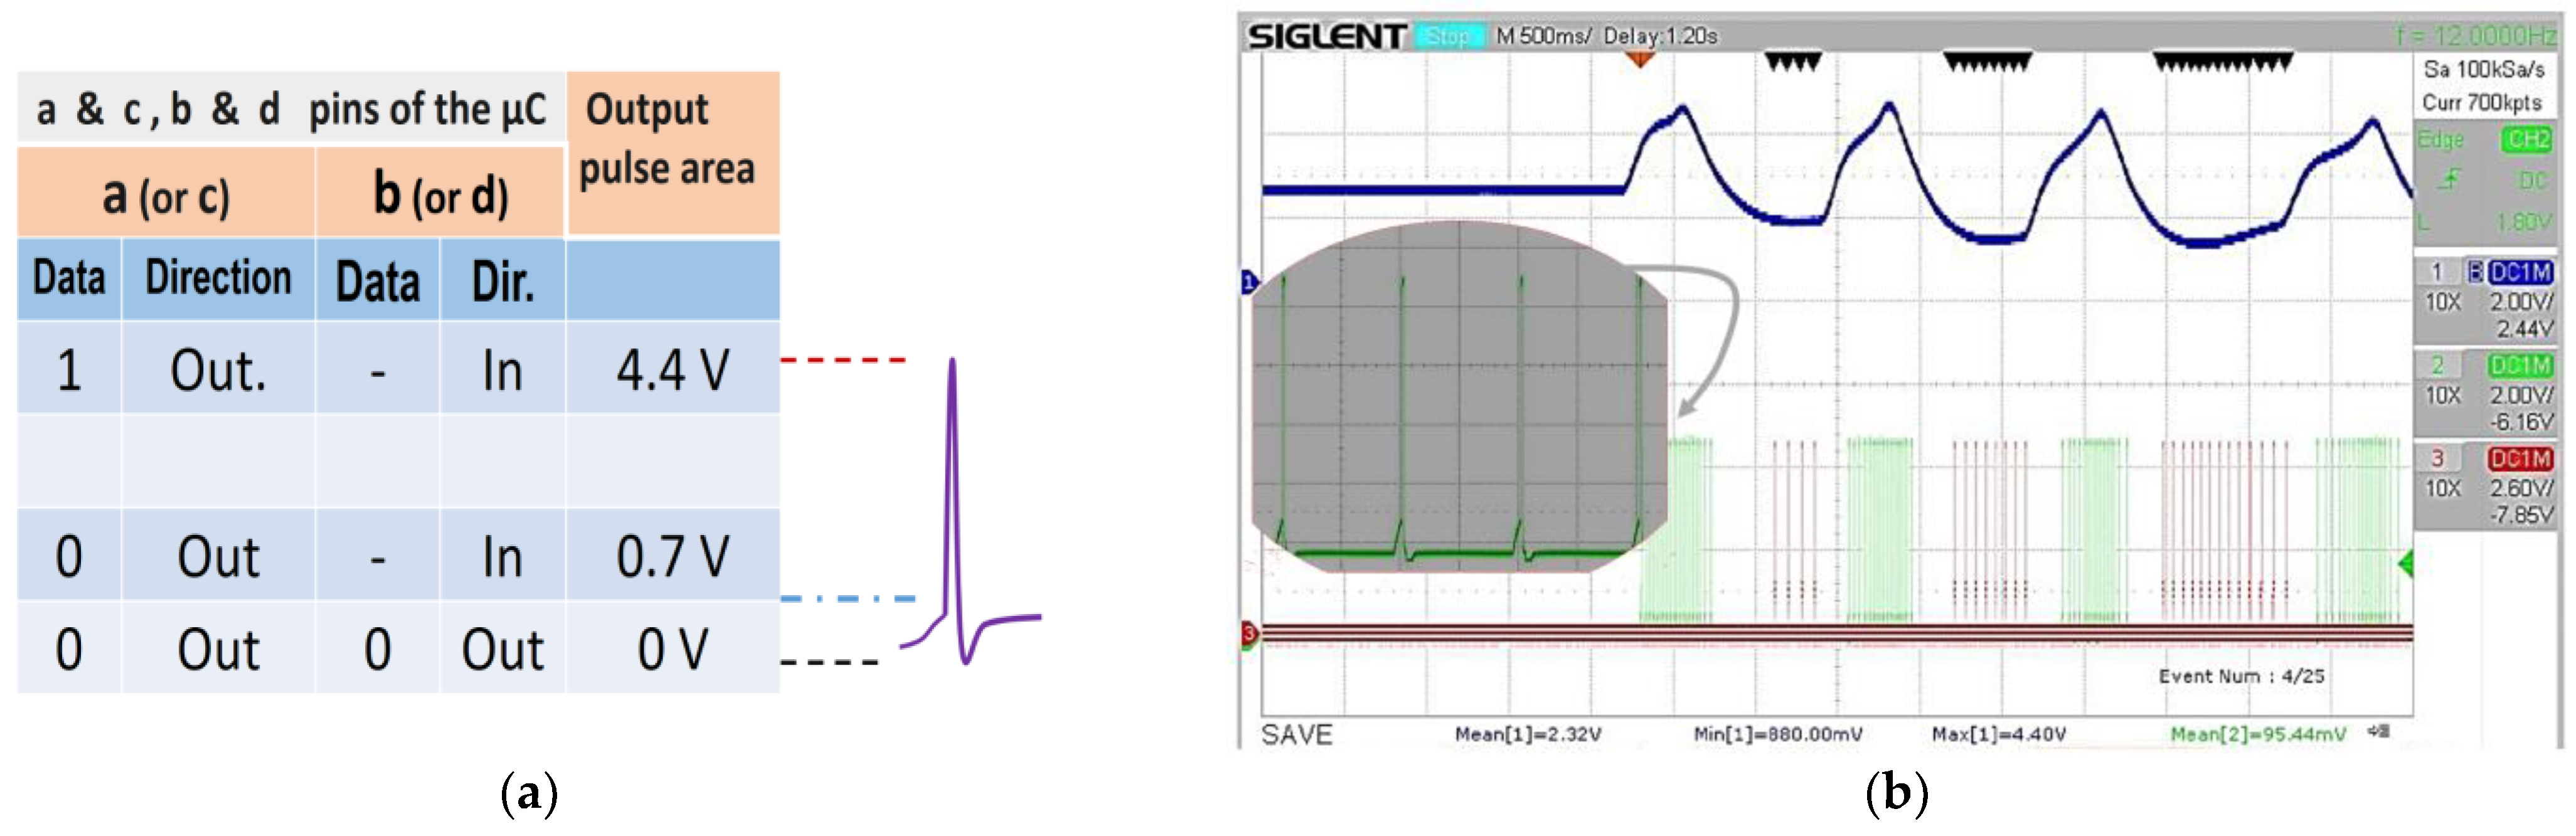
- It is necessary to synthesize the pulse sequence from the difference (VPIR − VRef). For this purpose, a difference equation characteristic of an IIR-type digital filter is established.
2.2. Summation Neuron Board
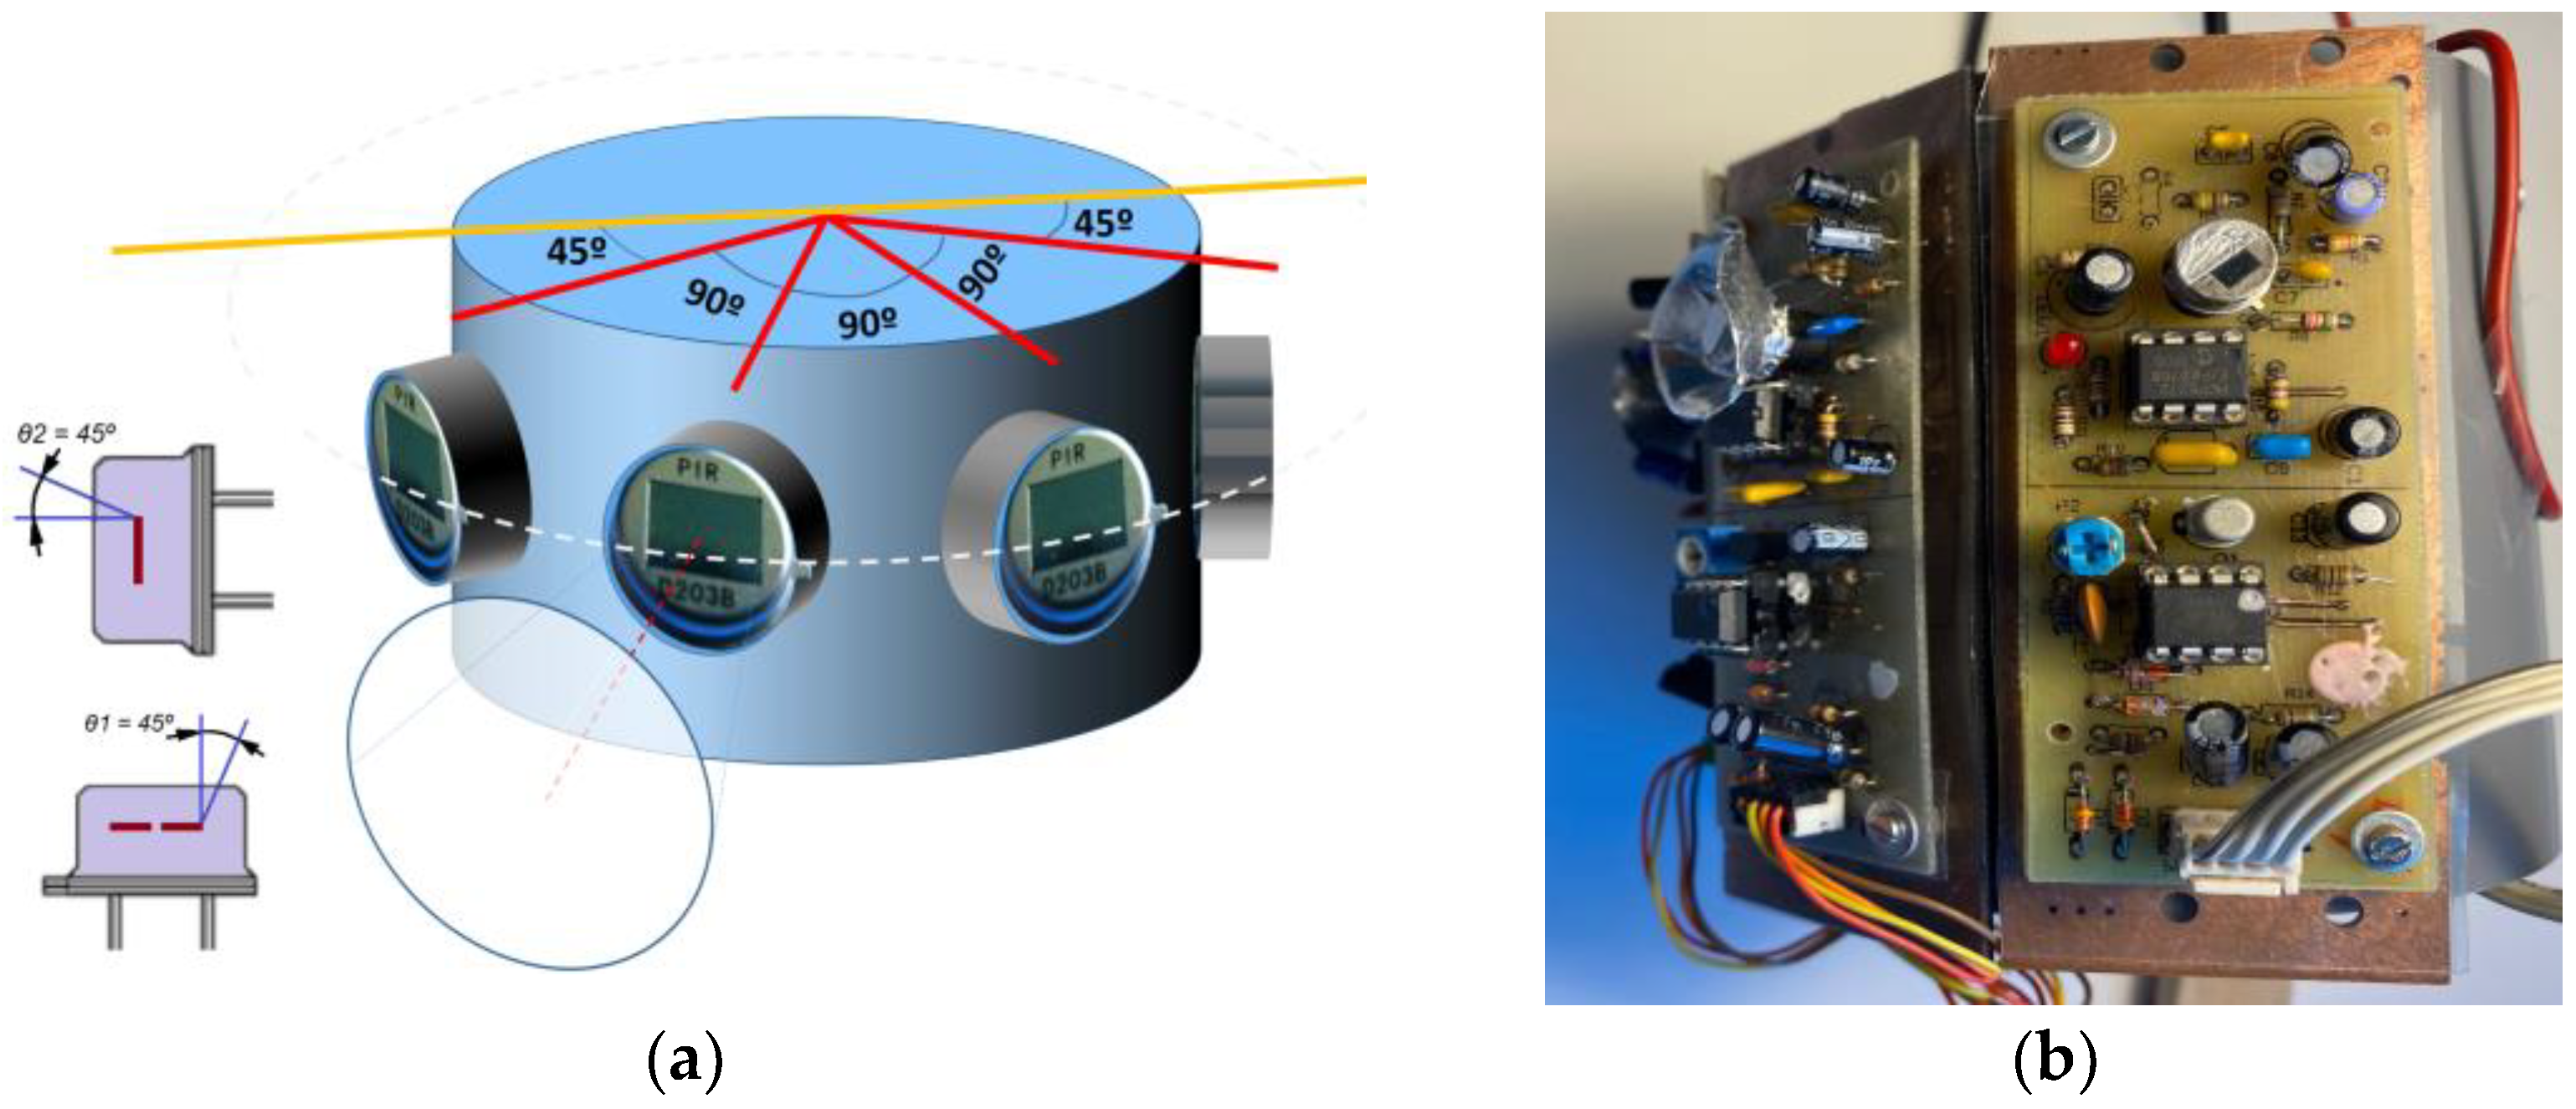
2.3. PIR Sensors Array Structure: Design and Construction
2.4. IR Radiometry for Optical Flow Detection
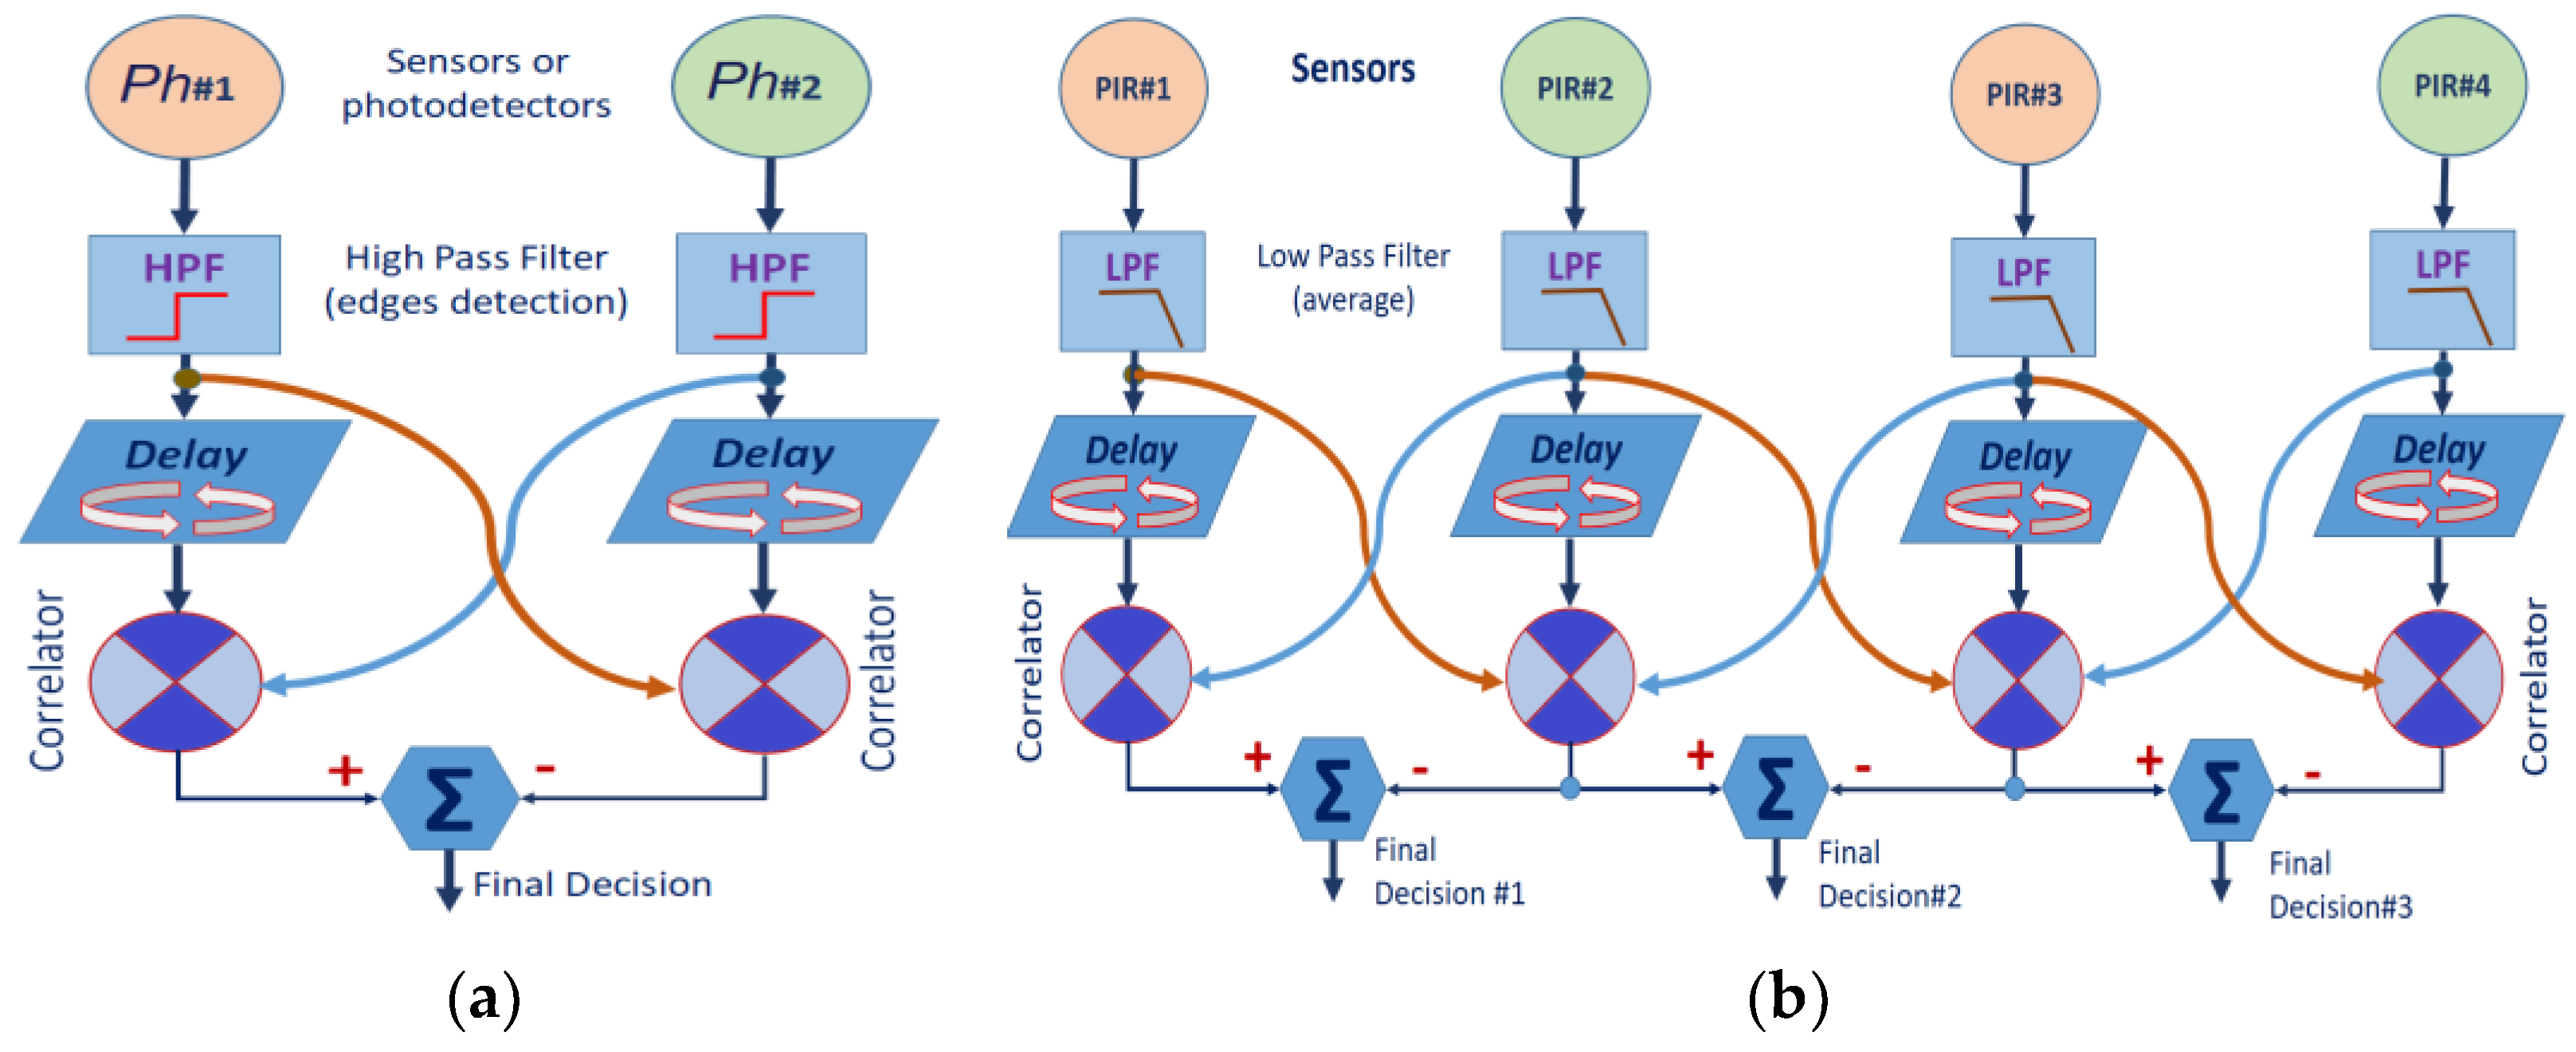
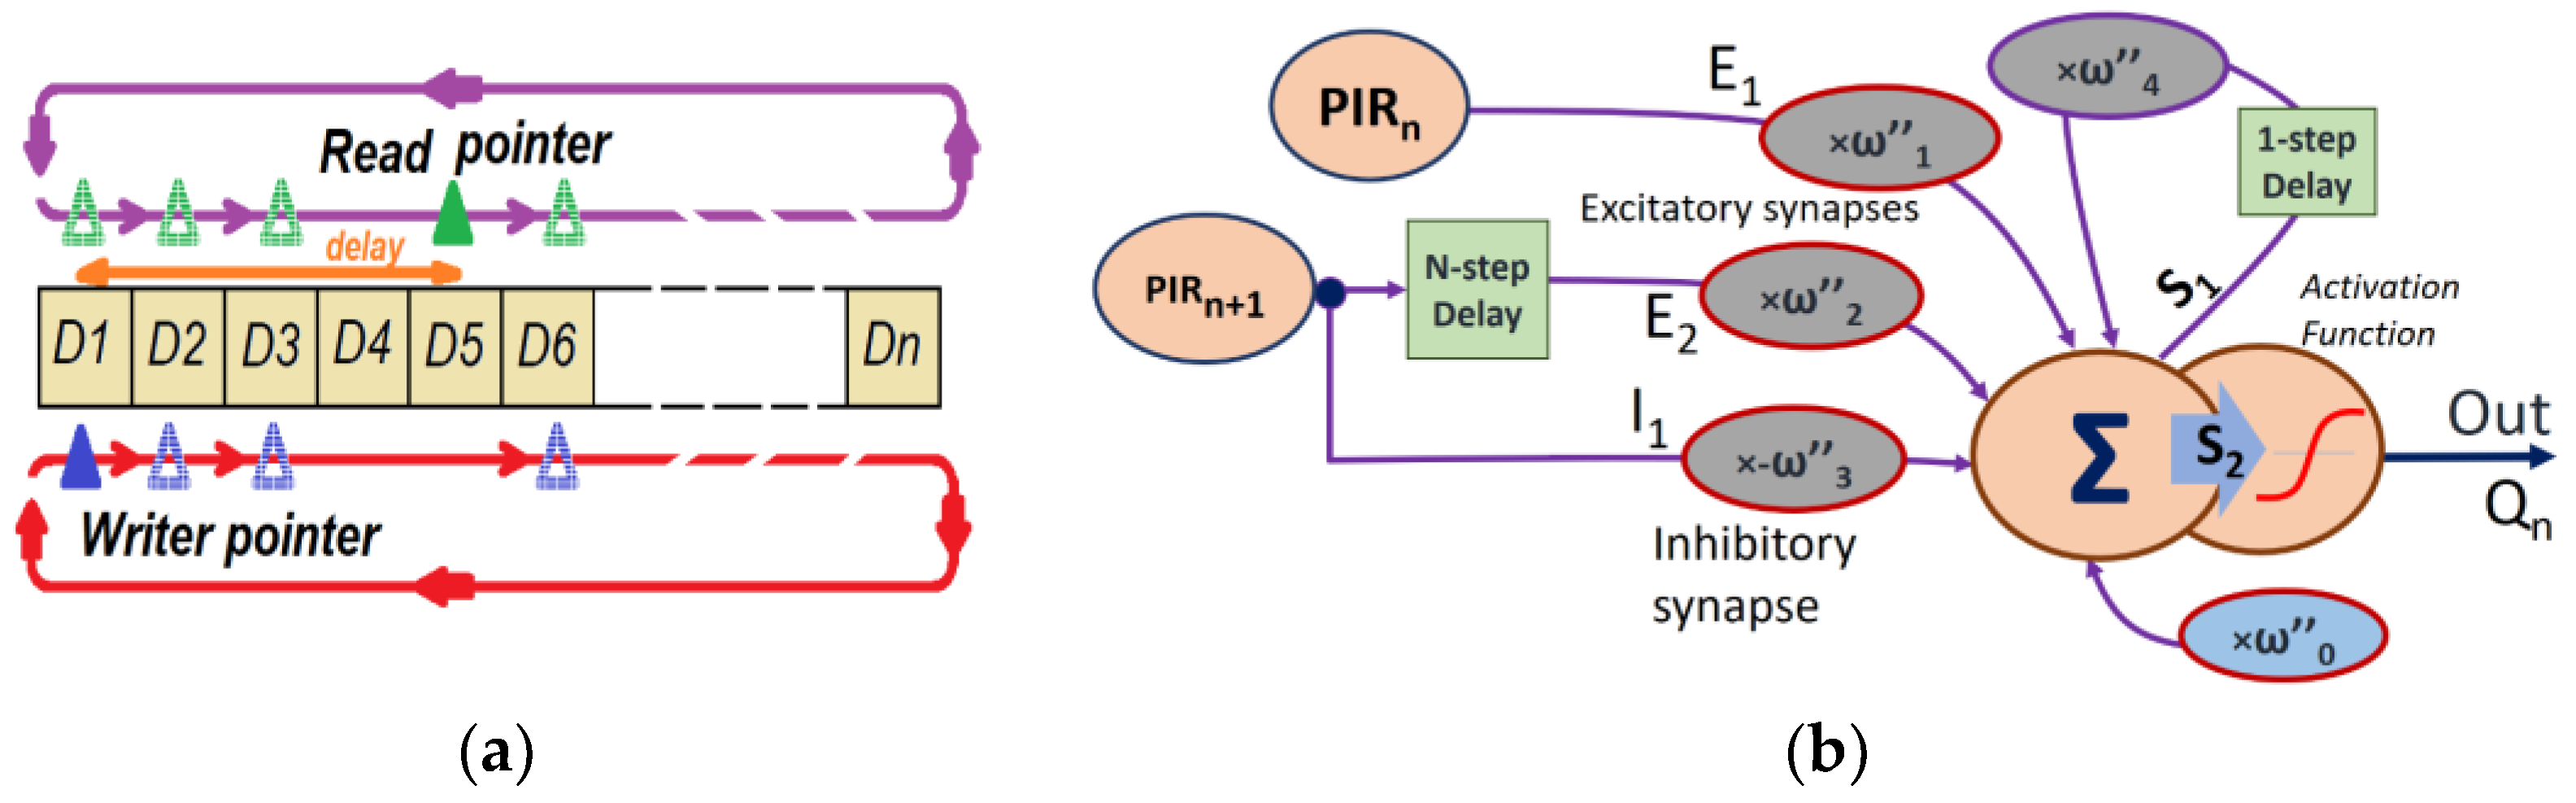
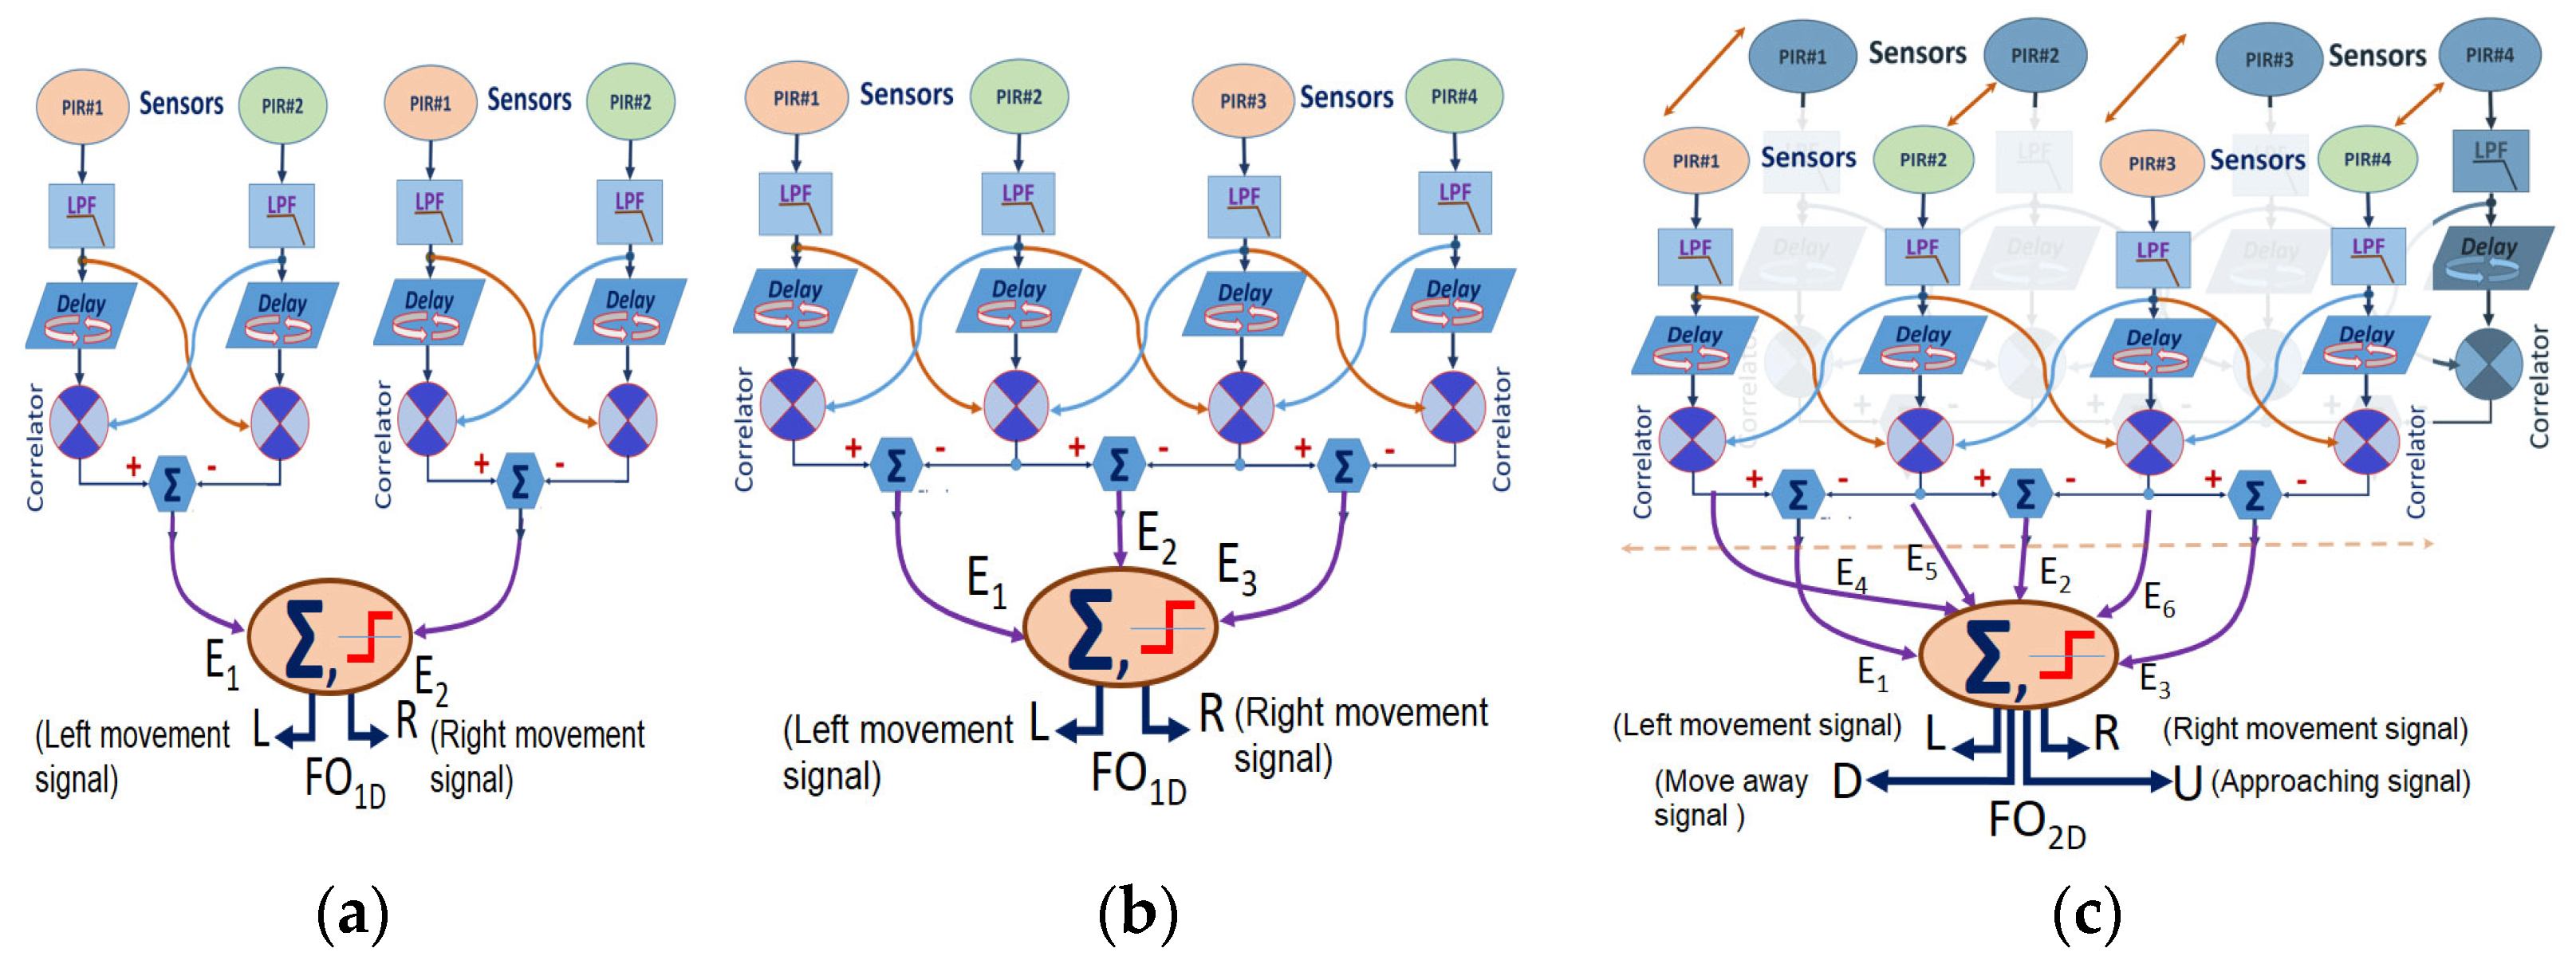
2.5. Optical Flow Processing
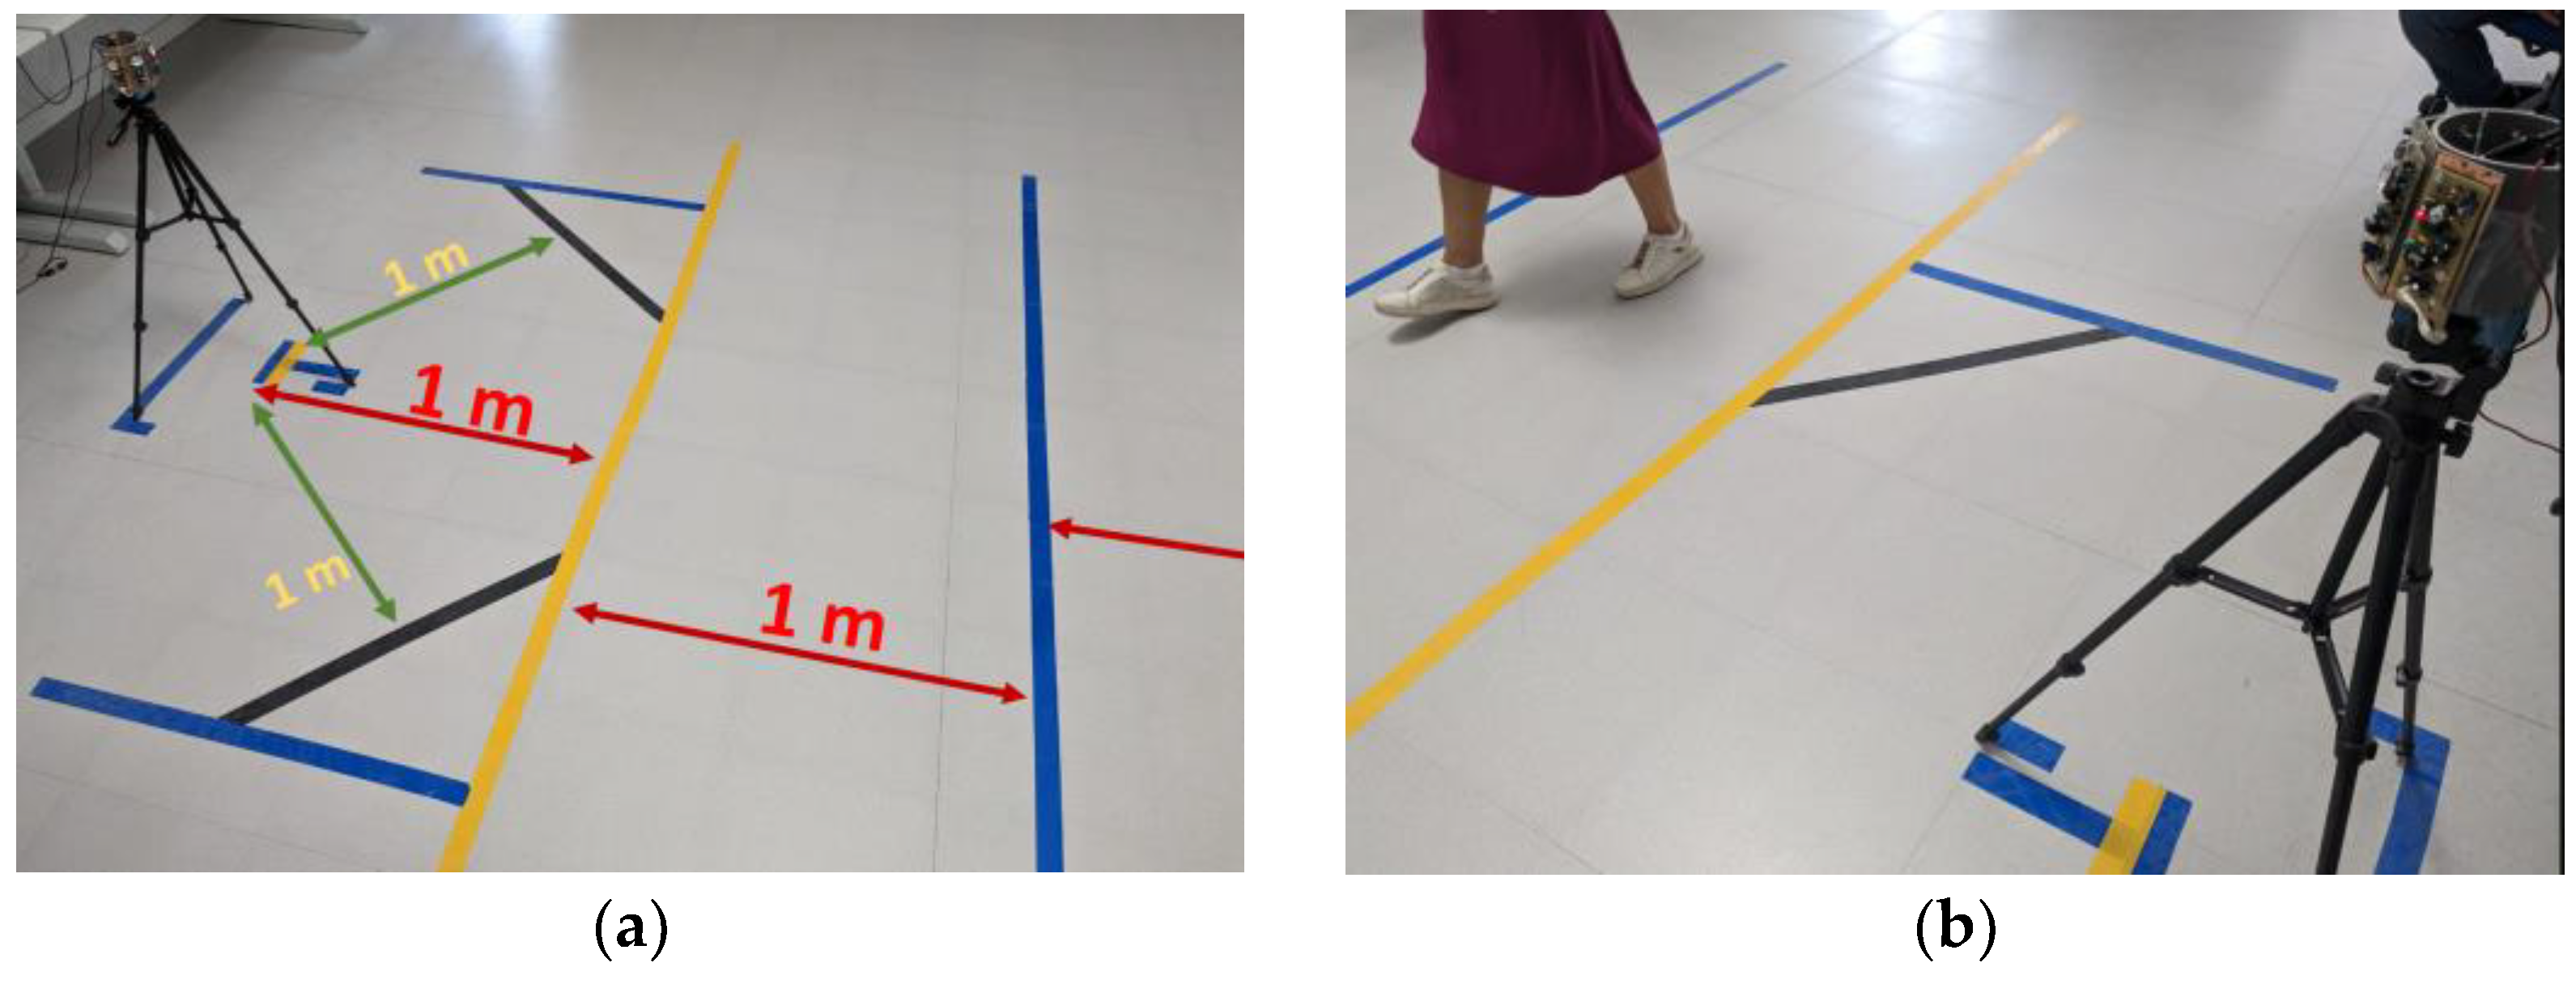
3. Case of Study
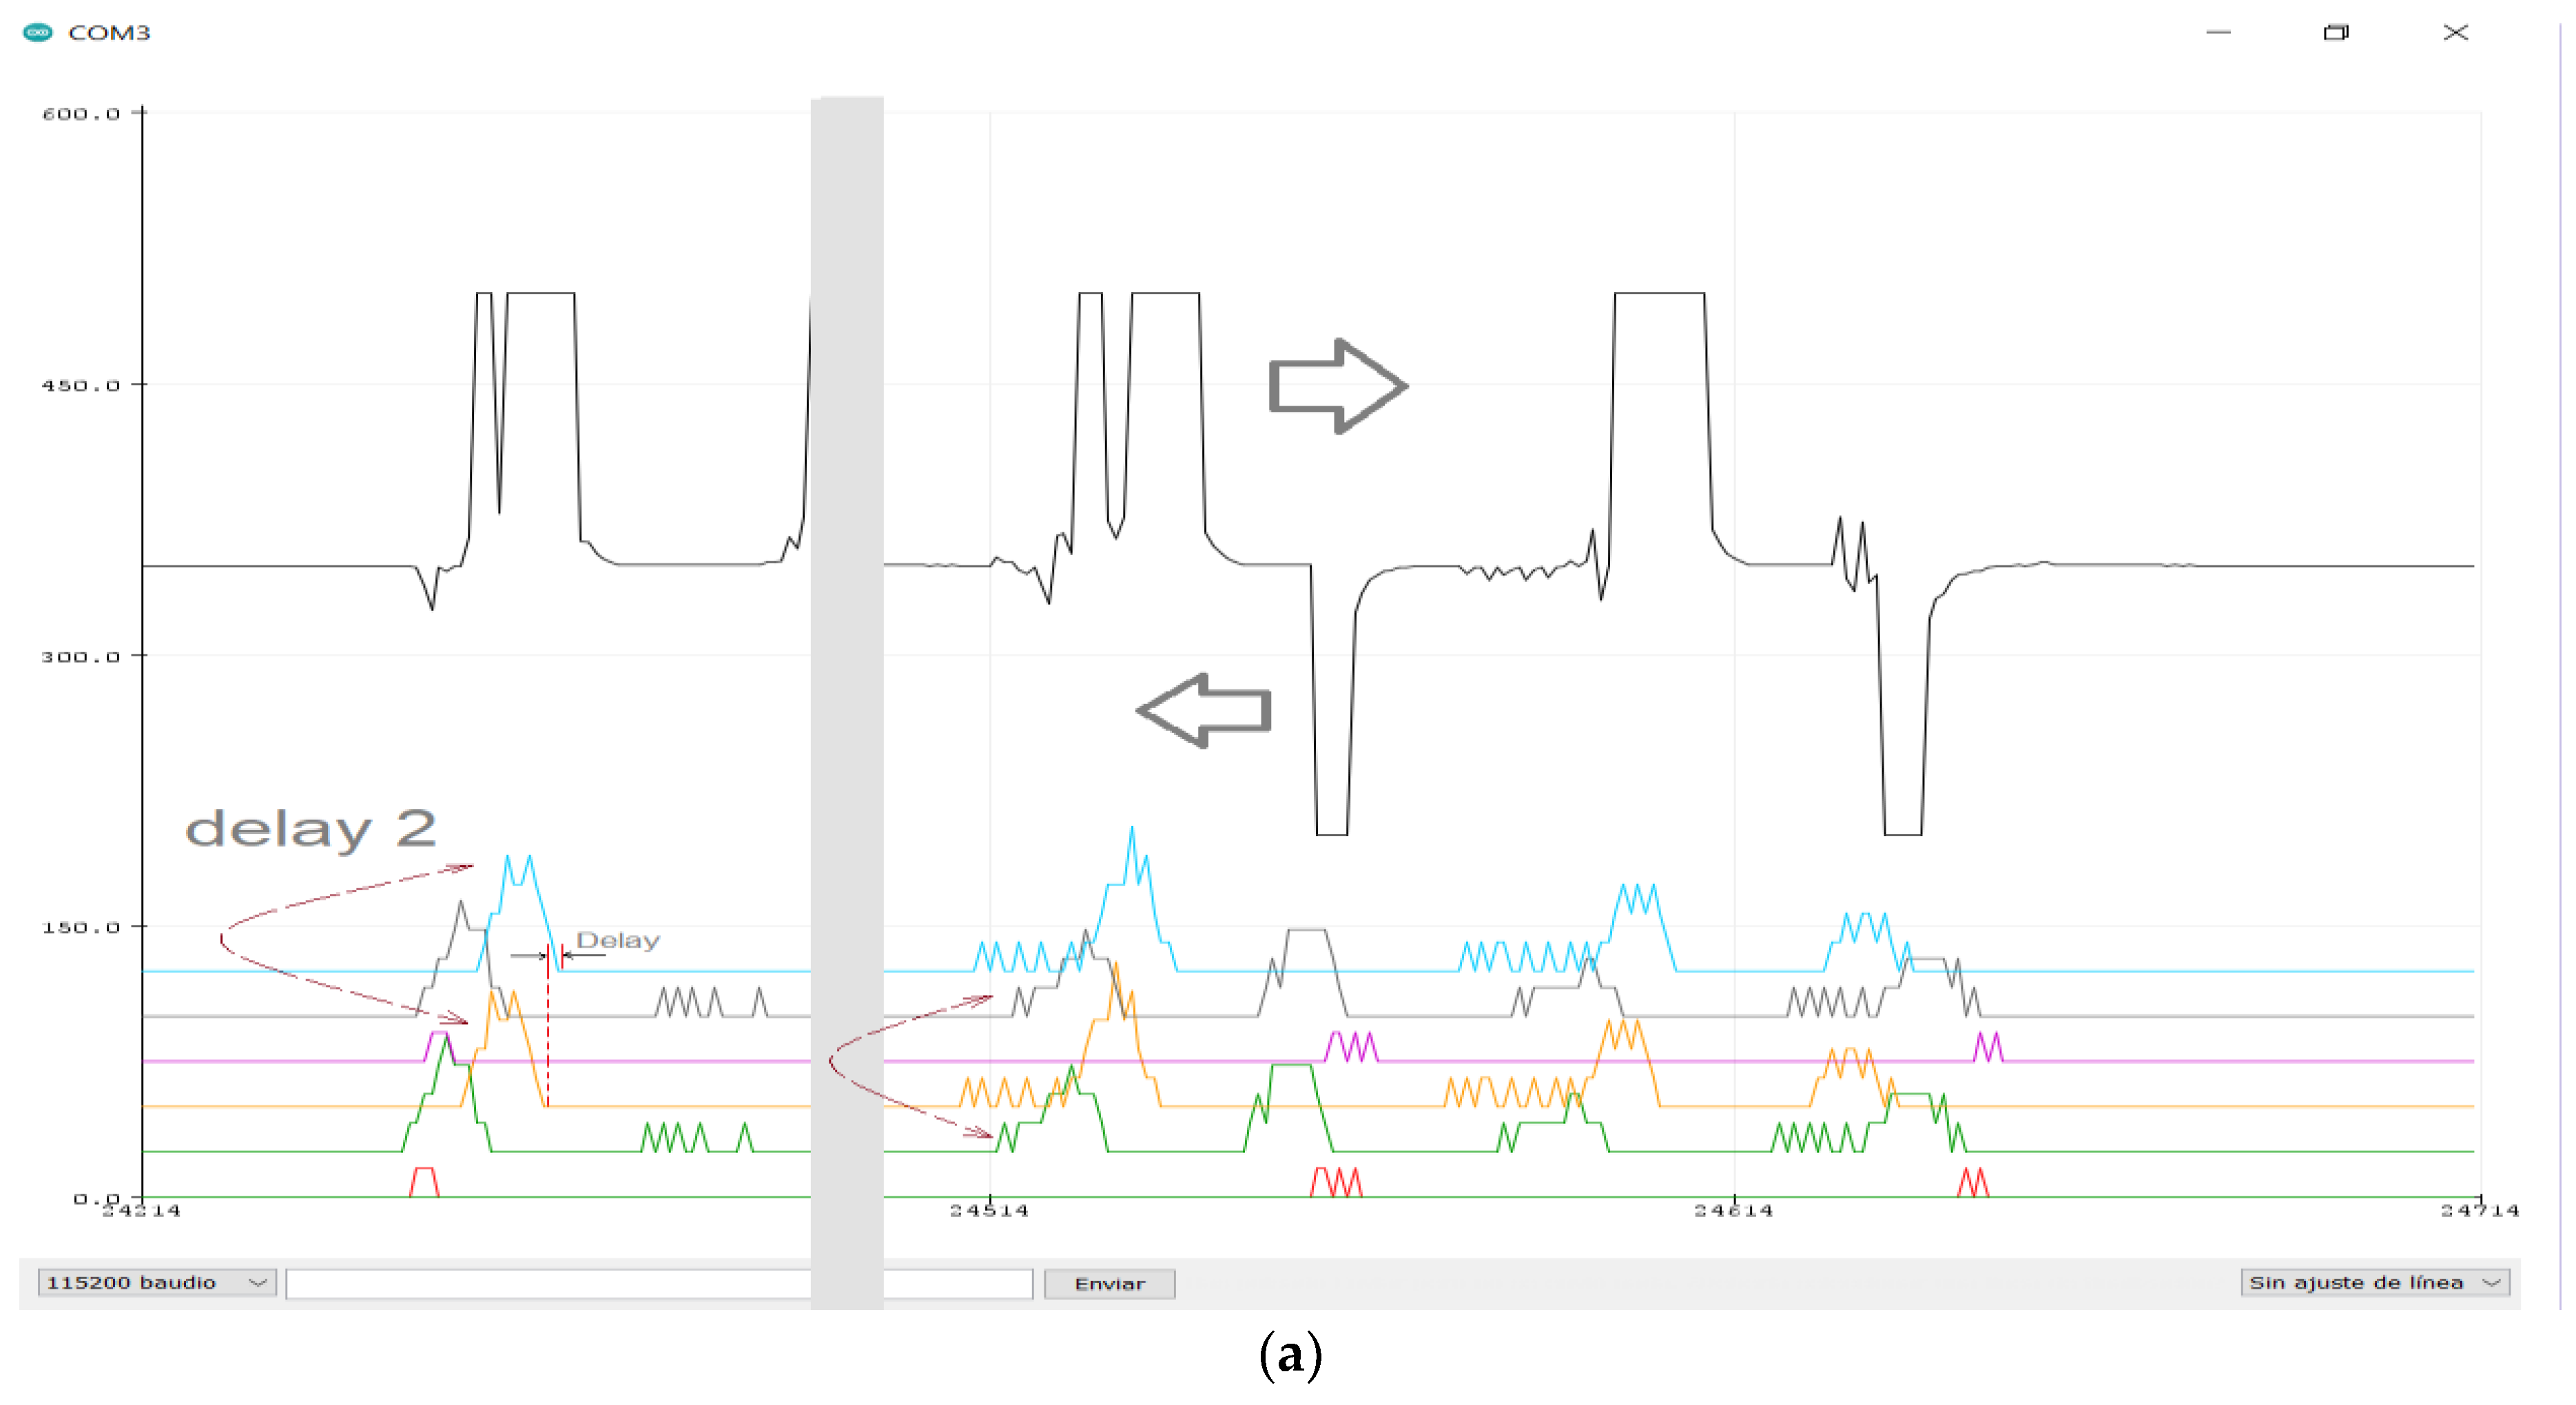
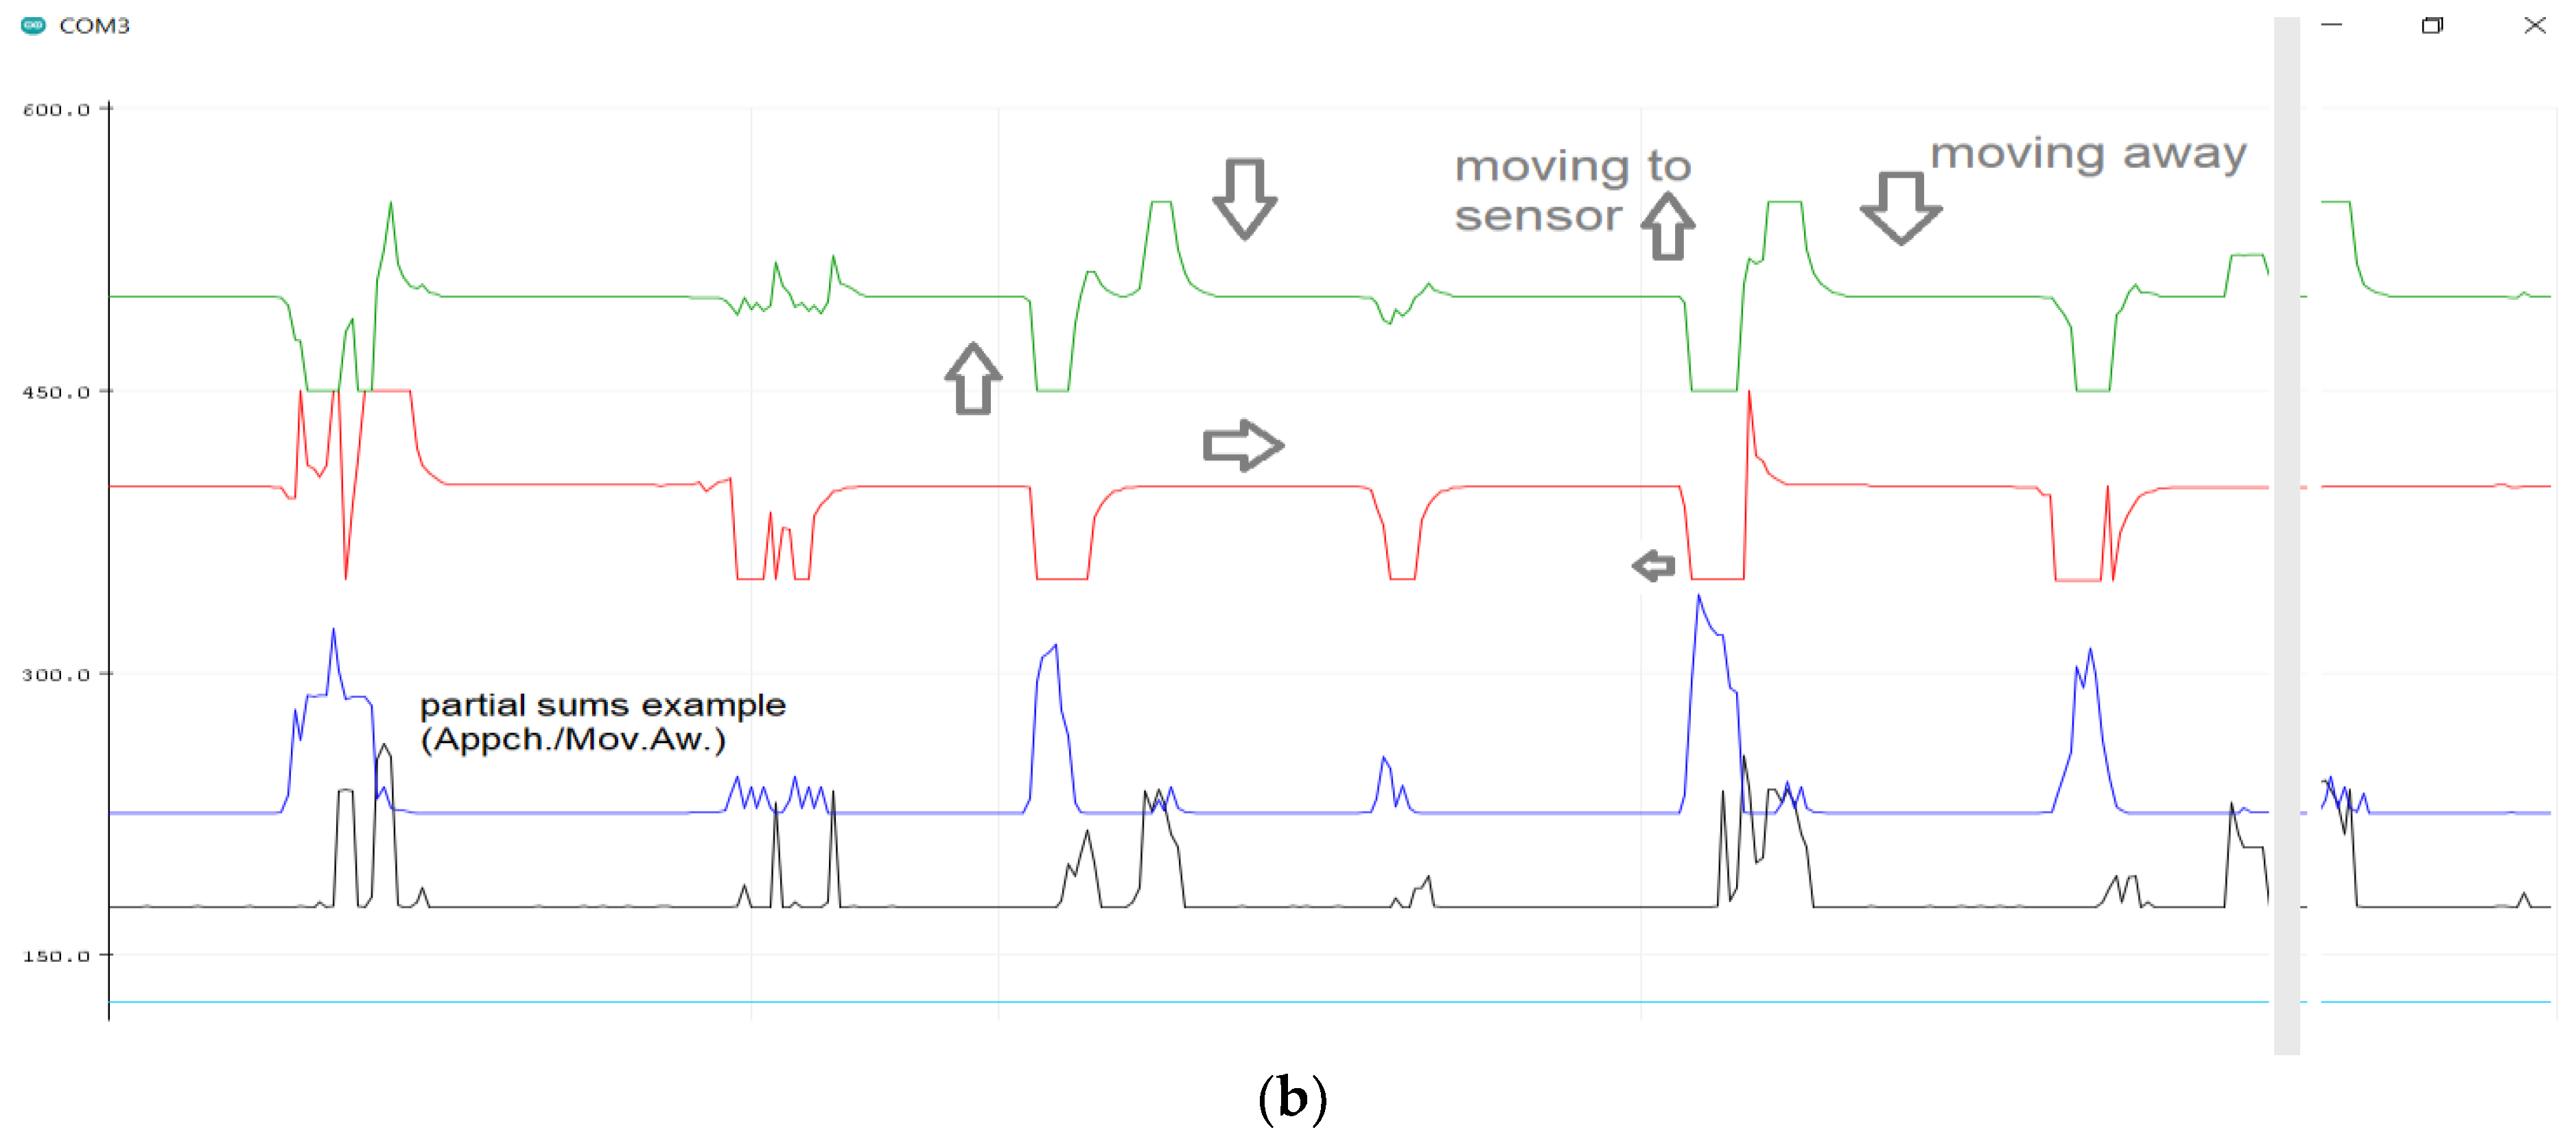
4. Results
5. Discussion
6. Conclusions
Author Contributions
Funding
Institutional Review Board Statement
Informed Consent Statement
Data Availability Statement
Conflicts of Interest
References
- Tekler, Z.D.; Low, R.; Gunay, H.B.; Andersen, R.K.; Blessing, L. A scalable Bluetooth Low Energy approach to identify occupancy patterns and profiles in office spaces. Build. Environ. 2020, 171, 106681. [Google Scholar] [CrossRef]
- Liu, F.; Liu, J.; Yin, Y.; Wang, W.; Hu, D.; Chen, P.; Niu, Q. Survey on WiFi-based indoor positioning techniques. IET Commun. 2020, 14, 1372–1383. [Google Scholar] [CrossRef]
- Li, N.; Calis, G.; Becerik-Gerber, B. Measuring and monitoring occupancy with an RFID based system for demand-driven HVAC operations. Autom. Constr. 2012, 24, 89–99. [Google Scholar] [CrossRef]
- Tekler, Z.D.; Chong, A. Occupancy prediction using deep learning approaches across multiple space types: A minimum sensing strategy. Build. Environ. 2022, 226, 109689. [Google Scholar] [CrossRef]
- Low, R.; Tekler, Z.D.; Cheah, L. An End-to-End Point of Interest (POI) Conflation Framework. ISPRS Int. J. Geo-Inf. 2021, 10, 779. [Google Scholar] [CrossRef]
- Moisello, E.; Malcovati, P.; Bonizzoni, E. Thermal Sensors for Contactless Temperature Measurements, Occupancy Detection, and Automatic Operation of Appliances during the COVID-19 Pandemic: A Review. Micromachines 2021, 12, 148. [Google Scholar] [CrossRef]
- Zhao, L.; Li, Y.; Liang, R.; Wang, P. A State of Art Review on Methodologies of Occupancy Estimating in Buildings from 2011 to 2021. Electronics 2022, 11, 3173. [Google Scholar] [CrossRef]
- Gami, H. Movement Direction and Distance Classification Using a Single PIR Sensor. IEEE Sens. Lett. 2018, 2, 1–4. [Google Scholar] [CrossRef]
- Yan, J.; Lou, P.; Li, R.; Hu, J.; Xiong, J. Research on the Multiple Factors Influencing Human Identification Based on Pyroelectric Infrared Sensors. Sensors 2018, 18, 604. [Google Scholar] [CrossRef] [Green Version]
- Gong, J.; Zhang, Y.; Zhou, X.; Yang, X.D. Pyro: Thumb-Tip Gesture Recognition Using Pyroelectric Infrared Sensing. In Proceedings of the 30th Annual ACM Symposium on User Interface Software and Technology (UIST’17), Québec City, QC, Canada, 22–25 October 2017; Association for Computing Machinery: New York, NY, USA, 2017; pp. 553–563. [Google Scholar] [CrossRef]
- Wojtczuk, P.; Armitage, A.; Binnie, T.D.; Chamberlain, T. Recognition of simple gestures using a PIR sensor array. Sens. Transducers 2012, 14, 83–94. [Google Scholar]
- Naser, A.; Lotfi, A.; Mwanje, M.D.; Zhong, J. Privacy-Preserving, Thermal Vision Whith Human in the Loop Fall Detection Alert System. IEEE Trans. Hum. Mach. Syst. 2023, 53, 164–175. [Google Scholar] [CrossRef]
- Sirmacek, B.; Riveiro, M. Occupancy Prediction Using Low-Cost and Low-Resolution Heat Sensors for Smart Offices. Sensors 2020, 20, 5497. [Google Scholar] [CrossRef] [PubMed]
- Narayana, S.; Venkatesha, R.; Rao, V.S.; Prabhakar, T.V.; Sripad, S.; Kowshik, S.S.; Sheethala, M. PIR sensors: Characterization and novel localization technique. In Proceedings of the 14th International Conference on Information Processing in Sensor Networks (IPSN’15), Seattle, WA, USA, 14–16 April 2015; Association for Computing Machinery: New York, NY, USA, 2015; pp. 142–153. [Google Scholar] [CrossRef]
- Salzmann, T.; Magno, M. A Low Power Infrared Sensor for Direction, Speed, Distance Finding for Contextual Intelligence. IEEE Sens. J. 2022, 1–4. [Google Scholar] [CrossRef]
- Fang, J.S.; Hao, Q.; Brady, D.J.; Guenther, B.D.; Hsu, K.Y. Real-time human identification using a pyroelectric infrared detector array and hidden Markov models. Opt. Express 2006, 14, 6643–6658. [Google Scholar] [CrossRef]
- Yun, J.; Lee, S.-S. Human Movement Detection and Identification Using Pyroelectric Infrared Sensors. Sensors 2014, 14, 8057–8081. [Google Scholar] [CrossRef]
- Luo, X.; Tan, H.; Guan, Q.; Liu, T.; Zhuo, H.H.; Shen, B. Abnormal Activity Detection Using Pyroelectric Infrared Sensors. Sensors 2016, 16, 822. [Google Scholar] [CrossRef] [Green Version]
- Yuan, Y.; Li, X.; Liu, Z.; Guan, X. Occupancy Estimation in Buildings Based on Infrared Array Sensors Detection. IEEE Sens. J. 2020, 20, 1043–1053. [Google Scholar] [CrossRef]
- Yang, T.; Guo, P.; Liu, W.; Liu, X.; Hao, T. Enhancing PIR-Based Multi-Person Localization Through Combining Deep Learning with Domain Knowledge. IEEE Sens. J. 2021, 21, 4874–4886. [Google Scholar] [CrossRef]
- Petrova, G.; Spasov, G.; Iliev, I. A Review on Applications of Low-resolution IR Array Sensors in Ambient-Assisted Living. In Proceedings of the XXX International Scientific Confere;nce Ele;ctronics—ET2021, Sozopol, Bulgaria, 15–17 September 2021; IEEE: Sozopol, Bulgaria, 2021. [Google Scholar] [CrossRef]
- Xiong, J.; Li, F.; Liu, J. Fusion of Different Height Pyroelectric Infrared Sensors for Person Identification. IEEE Sens. J. 2016, 16, 436–446. [Google Scholar] [CrossRef]
- Ngamakeur, K.; Yongchareon, S.; Yu, J.; Islam, S. Passive infrared sensor dataset and deep learning models for device-free indoor localization and tracking. Pervasive Mob. Comput. 2023, 88, 101721. [Google Scholar] [CrossRef]
- Shankar, M.; Burchett, J.B.; Hao, Q.; Guenther, B.D. Human-tracking systems using pyroelectric infrared detectors. Opt. Eng. 2006, 45, 106401–1064010. [Google Scholar] [CrossRef] [Green Version]
- Feng, G.; Guo, X.; Wang, G. Infrared motion sensing system for human-following robots. Sens. Actuator A Phys. 2012, 85, 1–7. [Google Scholar] [CrossRef]
- Wu, L.; Wang, Y.; Liu, H. Occupancy Detection and Localization by Monitoring Nonlinear Energy Flow of a Shuttered Passive Infrared Sensor. IEEE Sens. J. 2018, 18, 8656–8666. [Google Scholar] [CrossRef]
- Faulkner, N.; Konings, D.; Alam, F.; Legg, M.; Demidenko, S. Machine Learning Techniques for Device-Free Localization Using Low-Resolution Thermopiles. IEEE Internet Things J. 2022, 9, 18681–18694. [Google Scholar] [CrossRef]
- Shirsat, K.P.; Bhole, G.P. Occupancy Detection Using Optimization Based SVNN Classifier. In Proceedings of the 12th International Conference on Computing Communication and Networking Technologies (ICCCNT), Kharagpur, India, 6–8 July 2021; pp. 1–6. [Google Scholar] [CrossRef]
- Andrews, J.; Vakil, A.; Li, J. Biometric Authentication and Stationary Detection of Human Subjects by Deep Learning of Passive Infrared (PIR) Sensor Data. In Proceedings of the IEEE Signal Processing in Medicine and Biology Symposium (SPMB), Philadelphia, PA, USA, 5 December 2020; pp. 1–6. [Google Scholar] [CrossRef]
- Ngamakeur, K.; Yongchareon, S.; Yu, J.; Sheng, Q.Z. Deep CNN-LSTM Network for Indoor Location Estimation Using Analog Signals of Passive Infrared Sensors. IEEE Internet Things J. 2022, 9, 22582–22594. [Google Scholar] [CrossRef]
- Wu, C.M.; Chen, X.Y.; Wen, C.Y.; Sethares, W.A. Cooperative Networked PIR Detection System for Indoor Human Localization. Sensors 2021, 21, 6180. [Google Scholar] [CrossRef]
- Campbell, A.L.; Naik, R.R.; Sowards, L.; Stone, M.O. Biological infrared imaging and sensing. Micron 2002, 33, 211–225. [Google Scholar] [CrossRef] [Green Version]
- Shen, Q.; Luo, Z.; Ma, S.; Tao, P.; Song, C.; Wu, J.; Shang, W.; Deng, T. Bioinspired Infrared Sensing Materials and Systems. Adv. Mater. 2018, 30, 1707632. [Google Scholar] [CrossRef]
- Darbaniyan, F.; Mozaffari, K.; Liu, L.; Sharma, P. Soft Matter Mechanics and the Mechanisms Underpinning the Infrared Vision of Snakes. Matter 2021, 14, 241–252. [Google Scholar] [CrossRef]
- Clark, R.L.; Bakken, G.; Reed, S.B.; Soni, A. Pit viper thermography: The pit organ used by crotaline snakes to detect thermal contrast has poor spatial resolution. J. Exp. Biol. 2022, 225, 1–9. [Google Scholar] [CrossRef]
- Maass, W.; Bishop, C.M. Pulsed Neural Networks; The MIT Press: Cambridge, MA, USA, 2001. [Google Scholar]
- Murata: IRA-E700 Sensor. Available online: https://www.murata.com/en-global/products/productdetail?partno=IRA-E700ST0 (accessed on 19 June 2023).
- Hossain, A.; Rashid, M.H. Pyroelectric detectors and their applications. IEEE Trans. Ind. Appl. 1991, 27, 824–829. [Google Scholar] [CrossRef]
- Budzier, H.; Gerlach, G. Responsivity and Detectivity of Thermal Sensors and Photon Sensors’ and ‘Radiance of a Blackbody. In Thermal Infrared Sensors: Theory, Optimisation and Practice; Wiley: Hoboken, NJ, USA, 2011. [Google Scholar]
- Mukhopadhyay, B.; Srirangarajan, S.; Kar, S. Modeling the analog response of passive infrared sensor. Sens. Actuator A Phys. 2018, 279, 65–74. [Google Scholar] [CrossRef]
- ELTEC. Introduction to Infrared Pyroelectric Detectors. ELTEC Instruments: Daytona Beach, FL, USA. Available online: http://www.eltecinstruments.com/PDF/Dn/ELTECdata%20100.pdf (accessed on 19 June 2023).
- INFRATEC. Application_Detector_Basics, Infratec GmbH; Infrarotsensorik und Messtechnik, Gostritzer Str. 61–63, 01217 Dresden GERMANY. Available online: https://www.infratec.de/downloads/en/sensor-division/application-notes/application_detector_basics.pdf (accessed on 19 June 2023).
- Al-Jazzar, S.O.; Aldalahmeh, S.A.; McLernon, D.; Zaidi, S.A.R. Intruder Localization and Tracking Using Two Pyroelectric Infrared Sensors. IEEE Sens. J. 2020, 20, 6075–6082. [Google Scholar] [CrossRef]
- Thang, V.T.; Quang, V.V.; Bui, N.T. A Setup for Measuring the Centering Error of a Dual-Element Pyroelectric Infrared Sensor Module. Sensors 2021, 21, 6684. [Google Scholar] [CrossRef] [PubMed]
- AT-Tiny-85 Low Power Microcontroller. Microchip. Available online: https://www.microchip.com/en-us/product/ATtiny85 (accessed on 19 June 2023).
- Hodgking, A.L.; Huxley, A.F. A quantitative description of membrane current and its application to conduction and excitation in nerve. J. Physiol. 1952, 117, 500–544. [Google Scholar] [CrossRef] [PubMed]
- Dutta, S.; Kumar, V.; Shukla, A.; Mohapatra, N.R.; Ganguly, U. Leaky Integrate and Fire Neuron by Charge-Discharge Dynamics in Floating-Body MOSFET. Sci. Rep. 2017, 7, 8257. [Google Scholar] [CrossRef] [PubMed] [Green Version]
- Valadez-Godínez, S.; Sossa, H.; Santiago-Montero, R. The step size impact on the computational cost of spiking neuron simulation. In Proceedings of the Computing Conference, London, UK, 18–20 July 2017; pp. 722–728. [Google Scholar] [CrossRef]
- Izhikevich, E.M. Simple Model of Spiking Neurons. IEEE Trans. Neural Netw. 2003, 14, 1569–1572. [Google Scholar] [CrossRef] [PubMed] [Green Version]
- Pérez, J.; Alcázar, M.; Velasco, J.M.; Cabrera, J.A.; Castillo, J.J. A biological-like controller using improved spiking neural networks. Neurocomputing 2021, 463, 237–250. [Google Scholar] [CrossRef]
- Han, J.K.; Yun, S.Y.; Lee, S.W.; Yu, J.M.; Choi, Y.K. A Review of Artificial Spiking Neuron Devices for Neural Processing and Sensing. Adv. Funct. Mater. 2022, 32, 2204102. [Google Scholar] [CrossRef]
- Nguyen, D.A.; Xuan-Tu Tran, X.T.; Iacopi, F. A Review of Algorithms and Hardware Implementations for Spiking Neural Networks. Power Electron. Appl. 2021, 11, 23. [Google Scholar] [CrossRef]
- Stoliar, P.; Akita, I.; Schneegans, O.; Hioki1, M.; Rozenberg, M.J. A spiking neuron implemented in VLSI. J. Phys. Commun. 2022, 6, 1001. [Google Scholar] [CrossRef]
- Zheng, N.; Mazumder, P. Hardware Implementations of Spiking Neural Networks. In Learning in Energy-Efficient Neuromorphic Computing: Algorithm and Architecture Co-Design, 1st ed.; Wiley-IEEE Press: New York, NY, USA, 2020; pp. 173–246. ISBN 9781119507383. [Google Scholar] [CrossRef]
- Bensimon, M.; Greenberg, S.; Yehuda Ben-Shimol, Y.; Haiut, M. A New Digital Low Power Spiking Neuron. Int. J. Future Comput. Commun. 2019, 8, 24–28. [Google Scholar] [CrossRef]
- Lee, Y.-J.; Berkay On, M.; Xiao, X.; Proietti, R.; Ben Yoo, S.J. Photonic spiking neural networks with event-driven femtojoule optoelectronic neurons based on Izhikevich-inspired model. Opt. Express 2022, 30, 19360–19389. [Google Scholar] [CrossRef] [PubMed]
- Maass, W.; Bishop, C.M. Ch. 9: Digital Simulation of Spiking Neural Networks. In Pulsed Neural Networks; The MIT Press: Cambridge, MA, USA, 2001; pp. 237–257. [Google Scholar]
- Schoenauer, T.; Atasoy, S.; Mehrtash, N.; Klar, H. NeuroPipe-Chip: A digital neuro-processor for spiking neural networks. IEEE Trans. Neural Netw. 2002, 13, 205–213. [Google Scholar] [CrossRef] [PubMed]
- Hassenstein, B.; Reichardt, W. Structure of a mechanism of perception of optical movement. In Proceedings of the 1st International Conference on Cybernetics, Namur, Belgium, 26–29 June 1956; pp. 797–801. [Google Scholar]
- Egelhaaf, M.; Borst, A.; Reichardt, W. Computational structure of a biological motion-detection system as revealed by local detector analysis in the fly’s nervous system. J. Opt. Soc. Am. 1989, 6, 1070–1087. [Google Scholar] [CrossRef]
- Buchner, E. Elementary movement detectors in an insect visual system. Biol. Cybern. 1976, 24, 85–101. [Google Scholar] [CrossRef]
- Yan, C.; Todo, Y.; Tang, Z. The Mechanism of Motion Direction Detection Based on Hassenstein-Reichardt Model, 2021. In Proceeding of the 6th International Conference on Computational Intelligence and Applications (ICCIA), Xiamen, China, 11–13 June 2021; pp. 180–184. [Google Scholar] [CrossRef]
- Lei, F.; Peng, Z.; Liu, M.; Peng, J.; Cutsuridis, V.; Yue, S. A Robust Visual System for Looming Cue Detection Against Translating Motion. IEEE Trans Neural Netw. Learn Syst. 2022, 1–8. [Google Scholar] [CrossRef] [PubMed]
- Escobar-Alvarez, H.D.; Ohradzansky, M.; Keshavan, J.; Ranganathan, B.N.; Humbert, J.S. Bioinspired Approaches for Autonomous Small-Object Detection and Avoidance. IEEE Trans. Robot. 2019, 35, 1220–1232. [Google Scholar] [CrossRef]
- Patrick, A.; Shoemaker, P.A. Neural Network Model for Detection of Edges Defined by Image Dynamics. Front. Comput. Neurosci. 2019, 13, 76. [Google Scholar] [CrossRef] [Green Version]
- Yan, C.; Todo, Y.; Kobayashi, Y.; Tang, Z.; Li, B. An Artificial Visual System for Motion Direction Detection Based on the Hassenstein–Reichardt Correlator Model. Electronics 2022, 11, 1423. [Google Scholar] [CrossRef]
- Zhao, J.; Xi, S.; Li, Y.; Guo, A.; Wu, Z. A fly inspired solution to looming detection for collision avoidance. IScience 2023, 26, 106337. [Google Scholar] [CrossRef] [PubMed]
- Borst, A.; Egelhaaf, M. Detecting Visual Motion: Theory and Models. Visual Motion and Role in the Stabilization of Gaze; Miles, F.A., Walkman, J., Eds.; Elsevier Science Publishers, B.V.: Amsterdam, The Netherlands, 1993; pp. 3–27. ISBN 0-444-81195-8. [Google Scholar]
- Milde, M.B.; Bertrand, O.J.N.; Ramachandran, H.; Egelhaaf, M.; Chicca, E. Spiking Elementary Motion Detector in Neuromorphic Systems. Neural Comput. 2018, 30, 2384–2417. [Google Scholar] [CrossRef] [PubMed]
- Widrow, B.; Sterns, S.D. Adaptive Signal Processing; Prentice-Hall: New York, NY, USA, 1985. [Google Scholar]


| 16 MHz Processor Routine | 4 Sensors | 8 Sensors |
|---|---|---|
| Spiking detection (Interruptions) | 9 μs | 9–12 μs |
| Circular buffer | 18.2 μs | 18.6 μs |
| EMD (double pairing) | 57.2 μs | -- |
| EMD (lattice) | 71.6 μs | 100.4 μs |
Disclaimer/Publisher’s Note: The statements, opinions and data contained in all publications are solely those of the individual author(s) and contributor(s) and not of MDPI and/or the editor(s). MDPI and/or the editor(s) disclaim responsibility for any injury to people or property resulting from any ideas, methods, instructions or products referred to in the content. |
© 2023 by the authors. Licensee MDPI, Basel, Switzerland. This article is an open access article distributed under the terms and conditions of the Creative Commons Attribution (CC BY) license (https://creativecommons.org/licenses/by/4.0/).
Share and Cite
Guerrero-Rodriguez, J.-M.; Cifredo-Chacon, M.-A.; Cobos Sánchez, C.; Perez-Peña, F. Exploiting the PIR Sensor Analog Behavior as Thermoreceptor: Movement Direction Classification Based on Spiking Neurons. Sensors 2023, 23, 5816. https://doi.org/10.3390/s23135816
Guerrero-Rodriguez J-M, Cifredo-Chacon M-A, Cobos Sánchez C, Perez-Peña F. Exploiting the PIR Sensor Analog Behavior as Thermoreceptor: Movement Direction Classification Based on Spiking Neurons. Sensors. 2023; 23(13):5816. https://doi.org/10.3390/s23135816
Chicago/Turabian StyleGuerrero-Rodriguez, Jose-Maria, Maria-Angeles Cifredo-Chacon, Clemente Cobos Sánchez, and Fernando Perez-Peña. 2023. "Exploiting the PIR Sensor Analog Behavior as Thermoreceptor: Movement Direction Classification Based on Spiking Neurons" Sensors 23, no. 13: 5816. https://doi.org/10.3390/s23135816