
Exploring Biomarkers of Mental Flexibility in Healthy Aging: A Computational Psychometric Study

 , , , , and
Abstract
:1. Introduction
2. Materials and Methods
2.1. Participants
2.2. Inclusion Criteria
2.3. Procedure
2.3.1. First Phase: Assessing Cognitive Flexibility through Neuropsychological Tests
2.3.2. Second Phase: Assessing Affective Flexibility through Psychophysiological Signals
2.4. Recording of Psychophysiological Signals
2.5. Psychophysiological Signal Processing
2.6. Statistical Analyses
2.7. Computational Analyses
3. Results
4. Discussion
5. Conclusions
6. Limitations
Author Contributions
Funding
Institutional Review Board Statement
Informed Consent Statement
Data Availability Statement
Conflicts of Interest
References
- Estebsari, F.; Dastoorpoor, M.; Khalifehkandi, Z.R.; Nouri, A.; Mostafaei, D.; Hosseini, M.; Esmaeili, R.; Aghababaeian, H. The Concept of Successful Aging: A Review Article. Curr. Aging Sci. 2020, 13, 4–10. [Google Scholar] [CrossRef] [PubMed]
- Plys, E.; Jacobs, M.L.; Allen, R.S.; Arch, J.J. Psychological flexibility in older adulthood: A scoping review. Aging Ment. Health 2023, 27, 453–465. [Google Scholar] [CrossRef] [PubMed]
- Audet, J.N.; Lefebvre, L. What’s flexible in behavioral flexibility? Behav. Ecol. 2017, 28, 943–947. [Google Scholar] [CrossRef]
- Uddin, L.Q. Cognitive and behavioural flexibility: Neural mechanisms and clinical considerations. Nat. Rev. Neurosci. 2021, 22, 167–179. [Google Scholar] [CrossRef] [PubMed]
- Dajani, D.R.; Uddin, L.Q. Demystifying cognitive flexibility: Implications for clinical and developmental neuroscience. Trends Neurosci. 2015, 38, 571–578. [Google Scholar] [CrossRef] [Green Version]
- Müller, V.I.; Langner, R.; Cieslik, E.C.; Rottschy, C.; Eickhoff, S.B. Interindividual differences in cognitive flexibility: Influence of gray matter volume, functional connectivity and trait impulsivity. Brain Struct. Funct. 2014, 220, 2401–2414. [Google Scholar] [CrossRef] [PubMed] [Green Version]
- Badre, D.; Wagner, A.D. Computational and neurobiological mechanisms underlying cognitive flexibility. Proc. Natl. Acad. Sci. USA 2006, 103, 7186–7191. [Google Scholar] [CrossRef] [PubMed]
- Cools, R.; Barker, R.A.; Sahakian, B.J.; Robbins, T.W. Mechanisms of cognitive set flexibility in Parkinson’s disease. Brain 2001, 124, 2503–2512. [Google Scholar] [CrossRef] [Green Version]
- Knížková, K.; Siroňová, A.; Večeřová, M.; Keřková, B.; Šustová, P.; Jonáš, J.; Hrubý, A.; Rodriguez, M. Cognitive flexibility in schizophrenia: A confirmatory factor analysis of neuropsychological measures. Appl. Neuropsychol. Adult 2023. [Google Scholar] [CrossRef]
- Miles, S.; Gnatt, I.; Phillipou, A.; Nedeljkovic, M. Cognitive flexibility in acute anorexia nervosa and after recovery: A systematic review. Clin. Psychol. Rev. 2020, 81, 101905. [Google Scholar] [CrossRef]
- Pantelis, C.; Andrewes, D.G. Cognitive flexibility and complex integration in Parkinson’s disease, Huntington’s disease, and Schizophrenia. J. Int. Neuropsychol. Soc. 1995, 1, 545–553. [Google Scholar]
- Southwick, S.M.; Charney, D.S. Cognitive and emotional flexibility. In Resilience: The Science of Mastering Life’s Greatest Challenges; Cambridge University Press: Cambridge, UK, 2012; pp. 165–183. [Google Scholar] [CrossRef]
- Malooly, A.M.; Genet, J.J.; Siemer, M. Individual differences in reappraisal effectiveness: The role of affective flexibility. Emotion 2013, 13, 302–313. [Google Scholar] [CrossRef] [PubMed]
- Grol, M.; De Raedt, R. The link between resting heart rate variability and affective flexibility. Cogn. Affect. Behav. Neurosci. 2020, 20, 746–756. [Google Scholar] [CrossRef] [PubMed]
- Barbey, A.K.; Colom, R.; Grafman, J. Architecture of cognitive flexibility revealed by lesion mapping. Neuroimage 2013, 82, 547–554. [Google Scholar] [CrossRef] [PubMed] [Green Version]
- Kuppens, P. Exploring the nature of cognitive flexibility. New Ideas Psychol. 2012, 30, 190–200. Available online: https://record/2012-03306-005 (accessed on 24 September 2022).
- Chan, R.C.K.; Shum, D.; Toulopoulou, T.; Chen, E.Y. Assessment of executive functions: Review of instruments and identification of critical issues. Arch. Clin. Neuropsychol. 2008, 23, 201–216. [Google Scholar] [CrossRef] [Green Version]
- Baudier, L.; Gros, H.; Clément, E. Cognitive Flexibility or Flexibilities? New Insights from a Classroom Study. In Proceedings of the 45th Annual Conference of the Cognitive Science Society, Sydney, Australia, 26–29 July 2023; Available online: https://hal-cyu.archives-ouvertes.fr/hal-04070133 (accessed on 22 April 2023).
- Cañas, J. Cognitive Flexibility. Definitions 2020, 623. [Google Scholar]
- Barulli, D.; Habeck, C.; Stern, Y. Assessing Flexibility of Solution Strategy: Strategy Shifting as a Measure of Cognitive Reserve. J. Gerontol. Ser. B 2023, 78, 977–986. [Google Scholar] [CrossRef] [PubMed]
- Kortte, K.B.; Horner, M.D.; Windham, W.K. The trail making test, part B: Cognitive flexibility or ability to maintain set? Appl. Neuropsychol. 2002, 9, 106–109. Available online: https://pubmed.ncbi.nlm.nih.gov/12214820/ (accessed on 9 March 2023). [CrossRef]
- Genet, J.J.; Siemer, M. Flexible control in processing affective and non-affective material predicts individual differences in trait resilience. Cogn. Emot. 2011, 25, 380–388. [Google Scholar] [CrossRef]
- Cañas, J.J.; Fajardo, I.; Salmerón, L. Cognitive Flexibility. 2006. Available online: https://www.researchgate.net/publication/272022148_Cognitive_Flexibility (accessed on 3 September 2022).
- Howlett, C.A.; Miles, S.; Berryman, C.; Phillipou, A.; Moseley, G.L. Conflation between self-report and neurocognitive assessments of cognitive flexibility: A critical review of the Jingle Fallacy. Aust. J. Psychol. 2023, 75, 2174684. [Google Scholar] [CrossRef]
- Miles, S.; Howlett, A.C.; Berryman, C.; Nedeljkovic, M.; Moseley, G.L.; Phillipou, A. Considerations for using the Wisconsin Card Sorting Test to assess cognitive flexibility. Behav. Res. Methods 2021, 53, 2083–2091. [Google Scholar] [CrossRef] [PubMed]
- Acharya, U.R.; Joseph, K.P.; Kannathal, N.; Lim, C.M.; Suri, J.S. Heart rate variability: A review. Med. Biol. Eng. Comput. 2006, 44, 1031–1051. [Google Scholar] [CrossRef] [PubMed]
- Nardelli, M.; Valenza, G.; Greco, A.; Lanata, A.; Scilingo, E.P. Recognizing Emotions Induced by Affective Sounds through Heart Rate Variability. IEEE Trans. Affect. Comput. 2015, 6, 385–394. [Google Scholar] [CrossRef]
- Bosley, H.G.; Soyster, P.D.; Fisher, A.J. Affect Dynamics as Predictors of Symptom Severity and Treatment Response in Mood and Anxiety Disorders: Evidence for Specificity. J. Pers. Res. 2019, 5, 101–113. [Google Scholar] [CrossRef] [PubMed] [Green Version]
- Hamaker, E.L.; Ceulemans, E.; Grasman, R.P.P.P.; Tuerlinckx, F. Modeling Affect Dynamics: State of the Art and Future Challenges. Emot. Rev. 2015, 7, 316–322. [Google Scholar] [CrossRef]
- Waugh, C.; Kuppens, P. Affect Dynamics; Waugh, C.E., Kuppens, P., Eds.; Springer International Publishing: Cham, Switzerland, 2021. [Google Scholar]
- Bo, K.; Cui, L.; Yin, S.; Hu, Z.; Hong, X.; Kim, S.; Keil, A.; Ding, M. Decoding the temporal dynamics of affective scene processing. Neuroimage 2022, 261, 119532. [Google Scholar] [CrossRef]
- Valenza, G.; Lanata, A.; Scilingo, E.P. The Role of Nonlinear Dynamics in Affective Valence and Arousal Recognition. IEEE Trans. Affect. Comput. 2011, 3, 237–249. [Google Scholar] [CrossRef]
- Cipresso, P.; Borghesi, F.; Chirico, A. Affects affect affects: A Markov Chain. Front. Psychol. 2023, 14, 1162655. [Google Scholar] [CrossRef]
- Faul, F.; Erdfelder, E.; Lang, A.-G.; Buchner, A. G*Power 3: A flexible statistical power analysis program for the social, behavioral, and biomedical sciences. Behav. Res. Methods 2007, 39, 175–191. [Google Scholar] [CrossRef]
- Fernández-Aguilar, L.; Latorre, J.M.; Martínez-Rodrigo, A.; Moncho-Bogani, J.V.; Ros, L.; Latorre, P.; Ricarte, J.J.; Fernández-Caballero, A. Differences between young and older adults in physiological and subjective responses to emotion induction using films. Sci. Rep. 2020, 10, 14548. [Google Scholar] [CrossRef]
- Linn, B.S.; Linn, M.W.; Gurel, L. Cumulative illness rating scale. J. Am. Geriatr. Soc. 1968, 16, 622–626. Available online: https://pubmed.ncbi.nlm.nih.gov/5646906/ (accessed on 27 July 2023). [CrossRef] [PubMed]
- Fried, L.P.; Tangen, C.M.; Walston, J.; Newman, A.B.; Hirsch, C.; Gottdiener, J.; Seeman, T.; Tracy, R.; Kop, W.J.; Burke, G.; et al. Frailty in Older adults: Evidence for a phenotype. J. Gerontol. Ser. A Biol. Sci. Med. Sci. 2001, 56, M146–M156. [Google Scholar] [CrossRef] [PubMed]
- Mioshi, E.; Dawson, K.; Mitchell, J.; Arnold, R.; Hodges, J.R. The Addenbrooke’s Cognitive Examination Revised (ACE-R): A brief cognitive test battery for dementia screening. Int. J. Geriatr. Psychiatry 2006, 21, 1078–1085. [Google Scholar] [CrossRef]
- Conti, S.; Bonazzi, S.; Laiacona, M.; Masina, M.; Coralli, M.V. Montreal Cognitive Assessment (MoCA)-Italian version: Regression based norms and equivalent scores. Neurol. Sci. 2015, 36, 209–214. Available online: https://pubmed.ncbi.nlm.nih.gov/25139107/ (accessed on 7 January 2023). [CrossRef] [PubMed]
- Giovagnoli, A.R.; Del Pesce, M.; Mascheroni, S.; Simoncelli, M.; Laiacona, M.; Capitani, E. Trail making test: Normative values from 287 normal adult controls. Neurol. Sci. 1996, 17, 305–309. [Google Scholar] [CrossRef] [PubMed]
- Matias-Guiu, J.A. Addenbrooke’s Cognitive Examination. Diagn. Manag. Dement. Neurosci. Dement. 2020, 1, 379–393. [Google Scholar]
- Santangelo, G.; Siciliano, M.; Pedone, R.; Vitale, C.; Falco, F.; Bisogno, R.; Siano, P.; Barone, P.; Grossi, D.; Santangelo, F.; et al. Normative data for the Montreal Cognitive Assessment in an Italian population sample. Neurol. Sci. 2014, 36, 585–591. [Google Scholar] [CrossRef] [PubMed] [Green Version]
- Portoghese, I.; Lasio, M.; Conti, R.; Mascia, M.L.; Hitchcott, P.; Agus, M.; Gemignani, A.; Penna, M.P. Cognitive Flexibility Inventory: Factor structure, invariance, reliability, convergent, and discriminant validity among Italian university students. Psych. J. 2020, 9, 934–941. [Google Scholar] [CrossRef]
- Dennis, J.P.; Wal, J.S.V. The Cognitive Flexibility Inventory: Instrument Development and Estimates of Reliability and Validity. Cogn. Ther. Res. 2010, 34, 241–253. [Google Scholar] [CrossRef]
- Johnco, C.; Wuthrich, V.M.; Rapee, R.M. Reliability and validity of two self-report measures of cognitive flexibility. Psychol. Assess. 2014, 26, 1381–1387. [Google Scholar] [CrossRef] [PubMed]
- Godara, M.; Everaert, J.; Sanchez-Lopez, A.; Joormann, J.; De Raedt, R. Interplay between uncertainty intolerance, emotion regulation, cognitive flexibility, and psychopathology during the COVID-19 pandemic: A multi-wave study. Sci. Rep. 2023, 13, 9854. [Google Scholar] [CrossRef] [PubMed]
- Ram, D.; Chandran, S.; Sadar, A.; Gowdappa, B. Correlation of Cognitive Resilience, Cognitive Flexibility and Impulsivity in Attempted Suicide. Indian J. Psychol. Med. 2019, 41, 362–367. [Google Scholar] [CrossRef]
- Motevalli, S.; Salahshour, H.M.; Bailey, R.P. The mediating role of cognitive flexibility in the relationship between cognitive emotion regulation strategies and mindfulness in patients with type 2 diabetes. J. Affect. Disord. 2023, 339, 676–682. [Google Scholar] [CrossRef] [PubMed]
- Harel, O.; Hemi, A.; Levy-Gigi, E. The role of cognitive flexibility in moderating the effect of school-related stress exposure. Sci. Rep. 2023, 13, 5241. [Google Scholar] [CrossRef]
- Wu, C.-W.; Chen, W.-W.; Jen, C.-H. Emotional Intelligence and Cognitive Flexibility in the Relationship Between Parenting and Subjective Well-Being. J. Adult Dev. 2020, 28, 106–115. [Google Scholar] [CrossRef]
- Howlett, C.A.; Wewege, M.A.; Berryman, C.; Oldach, A.; Jennings, E.; Moore, E. Back to the Drawing Board—The Relationship Between Self-Report and Neuropsychological Tests of Cognitive Flexibility in Clinical Cohorts: A Systematic Review and Meta-Analysis. Neuropsychology 2022, 36, 347–372. Available online: https://doiLanding?doi=10.1037%2Fneu0000796 (accessed on 14 October 2022). [CrossRef] [PubMed]
- Cobos-Sánchez, L.; Flujas-Contreras, J.M.; Becerra, I.G. Relation between psychological flexibility, emotional intelligence and emotion regulation in adolescence. Curr. Psychol. 2020, 41, 5434–5443. [Google Scholar] [CrossRef]
- Aldao, A.; Sheppes, G.; Gross, J.J. Emotion Regulation Flexibility. Cogn. Ther. Res. 2015, 39, 263–278. [Google Scholar] [CrossRef]
- Marin, R. Apathy: Concept, Syndrome, Neural Mechanisms, and Treatment. Semin. Clin. Neuropsychiatry 1996, 1, 304–314. [Google Scholar] [PubMed]
- Wang, Y.-P.; Gorenstein, C. Psychometric properties of the Beck Depression Inventory-II: A comprehensive review. Braz J. Psychiatry 2013, 35, 416–431. [Google Scholar] [CrossRef] [PubMed] [Green Version]
- Hamilton, M. The assessment of anxiety states by rating. Psychol. Psychother. Theory Res. Pract. 1959, 32, 50–55. [Google Scholar] [CrossRef]
- Balzarotti, S.; John, O.P.; Gross, J.J. An Italian Adaptation of the Emotion Regulation Questionnaire. Eur. J. Psychol. Assess. 2010, 26, 61–67. [Google Scholar] [CrossRef]
- Chipi, E.; Frattini, G.; Eusebi, P.; Mollica, A.; D’andrea, K.; Russo, M.; Bernardelli, A.; Montanucci, C.; Luchetti, E.; Calabresi, P.; et al. The Italian version of cognitive function instrument (CFI): Reliability and validity in a cohort of healthy elderly. Neurol. Sci. 2017, 39, 111–118. [Google Scholar] [CrossRef] [PubMed]
- Amanzio, M.; Cipriani, G.E.; Bartoli, M.; Canessa, N.; Borghesi, F.; Chirico, A.; Cipresso, P. The neuropsychology of healthy aging: The positive context of the University of the Third Age during the COVID-19 pandemic. Sci. Rep. 2023, 13, 6355. [Google Scholar] [CrossRef] [PubMed]
- Gonzalez-Escamilla, G.; Dörfel, D.; Becke, M.; Trefz, J.; Bonanno, G.A.; Groppa, S. Associating Flexible Regulation of Emotional Expression with Psychopathological Symptoms. Front. Behav. Neurosci. 2022, 16, 924305. [Google Scholar] [CrossRef] [PubMed]
- Shaffer, F.; Ginsberg, J.P. An Overview of Heart Rate Variability Metrics and Norms. Front. Public Health 2017, 5, 258. [Google Scholar] [CrossRef] [Green Version]
- Brennan, M.; Palaniswami, M.; Kamen, P. Do existing measures of Poincare plot geometry reflect nonlinear features of heart rate variability? IEEE Trans. Biomed. Eng. 2001, 48, 1342–1347. [Google Scholar] [CrossRef]
- Brennan, M.; Palaniswami, M.; Kamen, P. Poincaré plot interpretation using a physiological model of HRV based on a network of oscillators. Am. J. Physiol. Circ. Physiol. 2002, 283, H1873–H1886. [Google Scholar] [CrossRef] [PubMed] [Green Version]
- Iqbal, T.; Elahi, A.; Ganly, S.; Wijns, W.; Shahzad, A. Photoplethysmography-Based Respiratory Rate Estimation Algorithm for Health Monitoring Applications. J. Med. Biol. Eng. 2022, 42, 242–252. [Google Scholar] [CrossRef]
- Sharma, M.; Kacker, S.; Sharma, M. A Brief Introduction and Review on Galvanic Skin Response. 2016. Available online: https://www.researchgate.net/publication/312246486 (accessed on 8 May 2023).
- Jayendhra, S.; Manuskandan, S.R.; Joseph, M.; Navaneethakrishna, M.; Karthick, P.A. Analysis of Facial Electromyography Signals Using Linear and Non-Linear Features for Human-Machine Interface. Annu Int. Conf. IEEE Eng. Med. Biol. Soc. 2021, 2021, 1149–1152. Available online: https://pubmed.ncbi.nlm.nih.gov/34891491/ (accessed on 28 May 2023). [PubMed]
- Grant, A.; Cassidy, S. Exploring the relationship between psychological flexibility and self-report and task-based measures of cognitive flexibility. J. Context. Behav. Sci. 2021, 23, 144–150. [Google Scholar] [CrossRef]
- Cheng, C. Assessing coping flexibility in real-life and laboratory settings: A multimethod approach. J. Pers. Soc. Psychol. 2001, 80, 814–833. Available online: https://pubmed-ncbi-nlm-nih-gov.bibliopass.unito.it/11374752/ (accessed on 23 May 2023). [CrossRef] [PubMed]
- Tong, K.; Chan, Y.N.; Cheng, X.; Cheon, B.; Ellefson, M.; Fauziana, R. Study protocol: How does cognitive flexibility relate to other executive functions and learning in healthy young adults? PLoS ONE 2023, 18, e0286208. [Google Scholar] [CrossRef]
- Sheppes, G.; Gross, J.J. Is Timing Everything? Temporal Considerations in Emotion Regulation. Pers. Soc. Psychol. Rev. 2011, 15, 319–331. [Google Scholar] [CrossRef] [PubMed] [Green Version]
- Ullah, N.; Treur, J.; Koole, S.L. Flexibility and Adaptivity of Emotion Regulation: From Contextual Dynamics to Adaptation and Control. Affect. Dyn. 2021, 261–292. [Google Scholar] [CrossRef]
- Goubet, K.E.; Chrysikou, E.G. Emotion Regulation Flexibility: Gender Differences in Context Sensitivity and Repertoire. Front. Psychol. 2019, 10, 935. [Google Scholar] [CrossRef]
- English, T.; Eldesouky, L. Emotion Regulation Flexibility. Eur. J. Psychol. Assess. 2020, 36, 456–459. [Google Scholar] [CrossRef]
- Specker, P.; Nickerson, A. Investigating the effectiveness of instructing emotion regulation flexibility to individuals with low and high anxiety. Anxiety Stress. Coping 2023, 1–14. [Google Scholar] [CrossRef]
- Orrù, G.; Monaro, M.; Conversano, C.; Gemignani, A.; Sartori, G. Machine Learning in Psychometrics and Psychological Research. Front. Psychol. 2020, 10, 2970. [Google Scholar] [CrossRef] [Green Version]
- Berntson, G.G.; Bigger, J.T.; Eckberg, D.L.; Grossman, P.; Kaufmann, P.G.; Malik, M.; Nagaraja, H.N.; Porges, S.W.; Saul, J.P.; Stone, P.H.; et al. Heart rate variability: Origins, methods, and interpretive caveats. Psychophysiology 1997, 34, 623–648. [Google Scholar] [CrossRef] [PubMed]
- Baevsky, R.M.; Chernikova, A.G. Heart rate variability analysis: Physiological foundations and main methods. Cardiometry 2017, 66–76. [Google Scholar] [CrossRef] [Green Version]
- Cipresso, P.; Serino, S.; Borghesi, F.; Tartarisco, G.; Riva, G.; Pioggia, G.; Gaggioli, A. Continuous measurement of stress levels in naturalistic settings using heart rate variability: An experience-sampling study driving a machine learning approach. Acta IMEKO 2021, 10, 239–248. [Google Scholar] [CrossRef]
- Malik, M.; Camm, A.J.; Bigger, J.T.; Breithardt, G.; Cerutti, S.; Cohen, R.J. Heart rate variability: Standards of measurement, physiological interpretation and clinical use. Task Force of the European Society of Cardiology and the North American Society of Pacing and Electrophysiology. Circulation 1996, 93, 1043–1065. [Google Scholar] [CrossRef]
- Borghesi, F.; Mancuso, V.; Pedroli, E.; Cipresso, P. From Virtual Reality to 360° Videos. In Handbook of Research on Implementing Digital Reality and Interactive Technologies to Achieve Society 5.0; IGI GLOBAL: Hershey, PA, USA, 2022; pp. 549–572. [Google Scholar] [CrossRef]


| Flexibility Measures | Construct | Neuropsychological Measurements | Acronym |
| Cognitive Flexibility | Trail Making Task | TMT A TMT B TMT BA | |
| Cognitive Flexibility | Addenbrooke’s Cognitive Examination Revised version: Memory, Visual spatial, Attention/Orientation scale | ACE AO, ACE M, ACE VS | |
| Cognitive Flexibility | Montreal Cognitive Assessment | MOCA | |
| Cognitive Flexibility | Cognitive Flexibility Inventory | CFI | |
| Convergence Measures | Decline cognitive | Cumulative Illness Rating Scale: Comorbidity and Severity scale | CIRS COM, CIRS SEV |
| Functional Abilities | Cognitive Function Instrument: self-report, partner, self-partner | CFI self, CFI partner, CFI self-partner | |
| Depression | Beck Depression Inventory | BDI | |
| Apathy | Apathy Evaluation Scale | AES | |
| Anxiety | Hamilton Anxiety Rating Scale | HARS | |
| Emotion Regulation | Emotion regulation Questionnaire: Re-appraisal Suppression | ERQ R ERQ S |
| Constructs | Type | Test | Group | N | Mean | SE | SD |
|---|---|---|---|---|---|---|---|
| Cognitive flexibility | Neuropsychological test | TMTA | High Flex | 15 | 38 | 3.2 | 12.4 |
| Low Flex | 15 | 37.2 | 2.54 | 9.84 | |||
| TMTB | High Flex | 15 | 100.47 | 12.9 | 50 | ||
| Low Flex | 15 | 89.8 | 5.11 | 19.8 | |||
| TMTBA | High Flex | 15 | 62.6 | 10.5 | 40.5 | ||
| Low Flex | 15 | 52.6 | 4.27 | 16.5 | |||
| ACE-R | High Flex | 15 | 94.73 | 0.54 | 2.09 | ||
| Low Flex | 15 | 94.6 | 0.7 | 2.72 | |||
| ACE AO | High Flex | 15 | 17.67 | 0.21 | 0.82 | ||
| Low Flex | 15 | 17.93 | 0.07 | 0.26 | |||
| ACE M | High Flex | 15 | 24.8 | 0.26 | 1.01 | ||
| Low Flex | 15 | 24.67 | 0.39 | 1.5 | |||
| ACE VS | High Flex | 15 | 15.27 | 0.27 | 1.03 | ||
| Low Flex | 15 | 14.8 | 0.22 | 0.86 | |||
| MOCA | High Flex | 15 | 26.4 | 0.68 | 2.64 | ||
| Low Flex | 15 | 27 | 0.56 | 2.17 | |||
| Cognitive Function | Self-report | CFI self | High Flex | 15 | 2.57 | 0.45 | 1.74 |
| Low Flex | 15 | 3.2 | 0.45 | 1.73 | |||
| CFI partner | High Flex | 15 | 1.37 | 0.26 | 1.03 | ||
| Low Flex | 15 | 1.33 | 0.37 | 1.44 | |||
| CFI self-partner | High Flex | 15 | 1.2 | 0.53 | 2.04 | ||
| Low Flex | 15 | 1.87 | 0.47 | 1.84 | |||
| Cognitive decline | Self-report | CIRS sev | High Flex | 15 | 1.33 | 0.04 | 0.17 |
| Low Flex | 15 | 1.36 | 0.03 | 0.14 | |||
| CIRS com | High Flex | 15 | 1.13 | 0.19 | 0.74 | ||
| Low Flex | 15 | 1.47 | 0.22 | 0.83 | |||
| Affective | Self-report | BDI | High Flex | 15 | 6.33 | 1.63 | 6.31 |
| Low Flex | 15 | 6.87 | 1.67 | 6.48 | |||
| HARS | High Flex | 15 | 7.6 | 1.37 | 5.3 | ||
| Low Flex | 15 | 7.33 | 1.41 | 5.46 | |||
| ERQ R | High Flex | 15 | 32.07 | 1.36 | 5.28 | ||
| Low Flex | 15 | 27.4 | 1.13 | 4.37 | |||
| ERQ S | High Flex | 15 | 17.47 | 1.04 | 4.02 | ||
| Low Flex | 15 | 18 | 1.29 | 5.01 |
| Physio | Type | Measurements | Group | N | Mean | SE | SD |
|---|---|---|---|---|---|---|---|
| Heart Rate Variability | Temporal domain | RMSSD (ms) | High Flex | 14 | 25.12 | 2.18 | 8.14 |
| Low Flex | 13 | 37.70 | 15.91 | 57.37 | |||
| SDNN (ms) | High Flex | 14 | 24.01 | 2.18 | 8.16 | ||
| Low Flex | 13 | 33.04 | 10.10 | 36.43 | |||
| Max HR (bpm) | High Flex | 14 | 83.62 | 2.04 | 7.62 | ||
| Low Flex | 13 | 84.78 | 5.44 | 19.60 | |||
| NN50 (beats) | High Flex | 14 | 178.50 | 44.95 | 168.20 | ||
| Low Flex | 13 | 293.00 | 153.65 | 553.98 | |||
| Frequency domain | VLF pow FFT (ms2) | High Flex | 14 | 43.99 | 12.00 | 44.91 | |
| Low Flex | 13 | 70.89 | 24.12 | 86.98 | |||
| LF pow FFT (ms2) | High Flex | 14 | 305.53 | 66.88 | 250.22 | ||
| Low Flex | 13 | 934.41 | 529.39 | 1908.74 | |||
| HF pow FFT (ms2) | High Flex | 14 | 222.51 | 59.00 | 220.76 | ||
| Low Flex | 13 | 806.51 | 631.68 | 2277.57 | |||
| LF HF ratio FFT | High Flex | 14 | 1.48 | 0.13 | 0.49 | ||
| Low Flex | 13 | 2.02 | 0.28 | 1.02 | |||
| Non linear | SD1 (ms) | High Flex | 14 | 17.76 | 1.54 | 5.76 | |
| Low Flex | 13 | 26.66 | 11.25 | 40.58 | |||
| SD2 (ms) | High Flex | 14 | 28.76 | 2.83 | 10.58 | ||
| Low Flex | 13 | 37.40 | 9.16 | 33.02 | |||
| SD2 SD1 ratio | High Flex | 14 | 1.65 | 0.10 | 0.36 | ||
| Low Flex | 13 | 1.79 | 0.13 | 0.46 | |||
| Facial Elettromiography | mean EMG1/EMG2 | High Flex | 14 | 2.99 | 0.38 | 1.44 | |
| Low Flex | 14 | 3.15 | 0.39 | 1.46 | |||
| mean EMG2/EMG1 | High Flex | 14 | 1.58 | 0.90 | 3.39 | ||
| Low Flex | 14 | 1.97 | 1.17 | 4.38 | |||
| StD EMG1/EMG2 | High Flex | 14 | 3.83 | 2.25 | 8.43 | ||
| Low Flex | 14 | 9.07 | 6.17 | 23.08 | |||
| StD EMG2/EMG1 | High Flex | 14 | 19.81 | 14.76 | 55.23 | ||
| Low Flex | 14 | 19.75 | 17.65 | 66.03 | |||
| RMS EMG1/EMG2 | High Flex | 14 | 5.50 | 2.17 | 8.12 | ||
| Low Flex | 14 | 10.52 | 6.06 | 22.69 | |||
| RMS EMG2/EMG1 | High Flex | 14 | 20.08 | 14.77 | 55.25 | ||
| Low Flex | 14 | 20.05 | 17.67 | 66.11 | |||
| Skin Condactance | Mean SC | High Flex | 13 | 2.38 | 1.37 | 0.38 | |
| Low Flex | 14 | 2.35 | 0.92 | 0.25 | |||
| StD SC | High Flex | 13 | 0.30 | 0.23 | 0.06 | ||
| Low Flex | 14 | 0.29 | 0.13 | 0.04 | |||
| RMS SC | High Flex | 13 | 2.41 | 1.37 | 0.38 | ||
| Low Flex | 14 | 2.37 | 0.92 | 0.25 | |||
| Respiration Rate | Mean RSP Rate | High Flex | 14 | 29.83 | 0.80 | 3.00 | |
| Low Flex | 14 | 31.85 | 1.64 | 6.14 | |||
| StD RSP Rate | High Flex | 14 | 10.52 | 0.44 | 1.66 | ||
| Low Flex | 14 | 12.26 | 0.87 | 3.27 | |||
| RMS RSP Rate | High Flex | 14 | 31.68 | 0.76 | 2.84 | ||
| Low Flex | 14 | 34.26 | 1.67 | 6.26 |
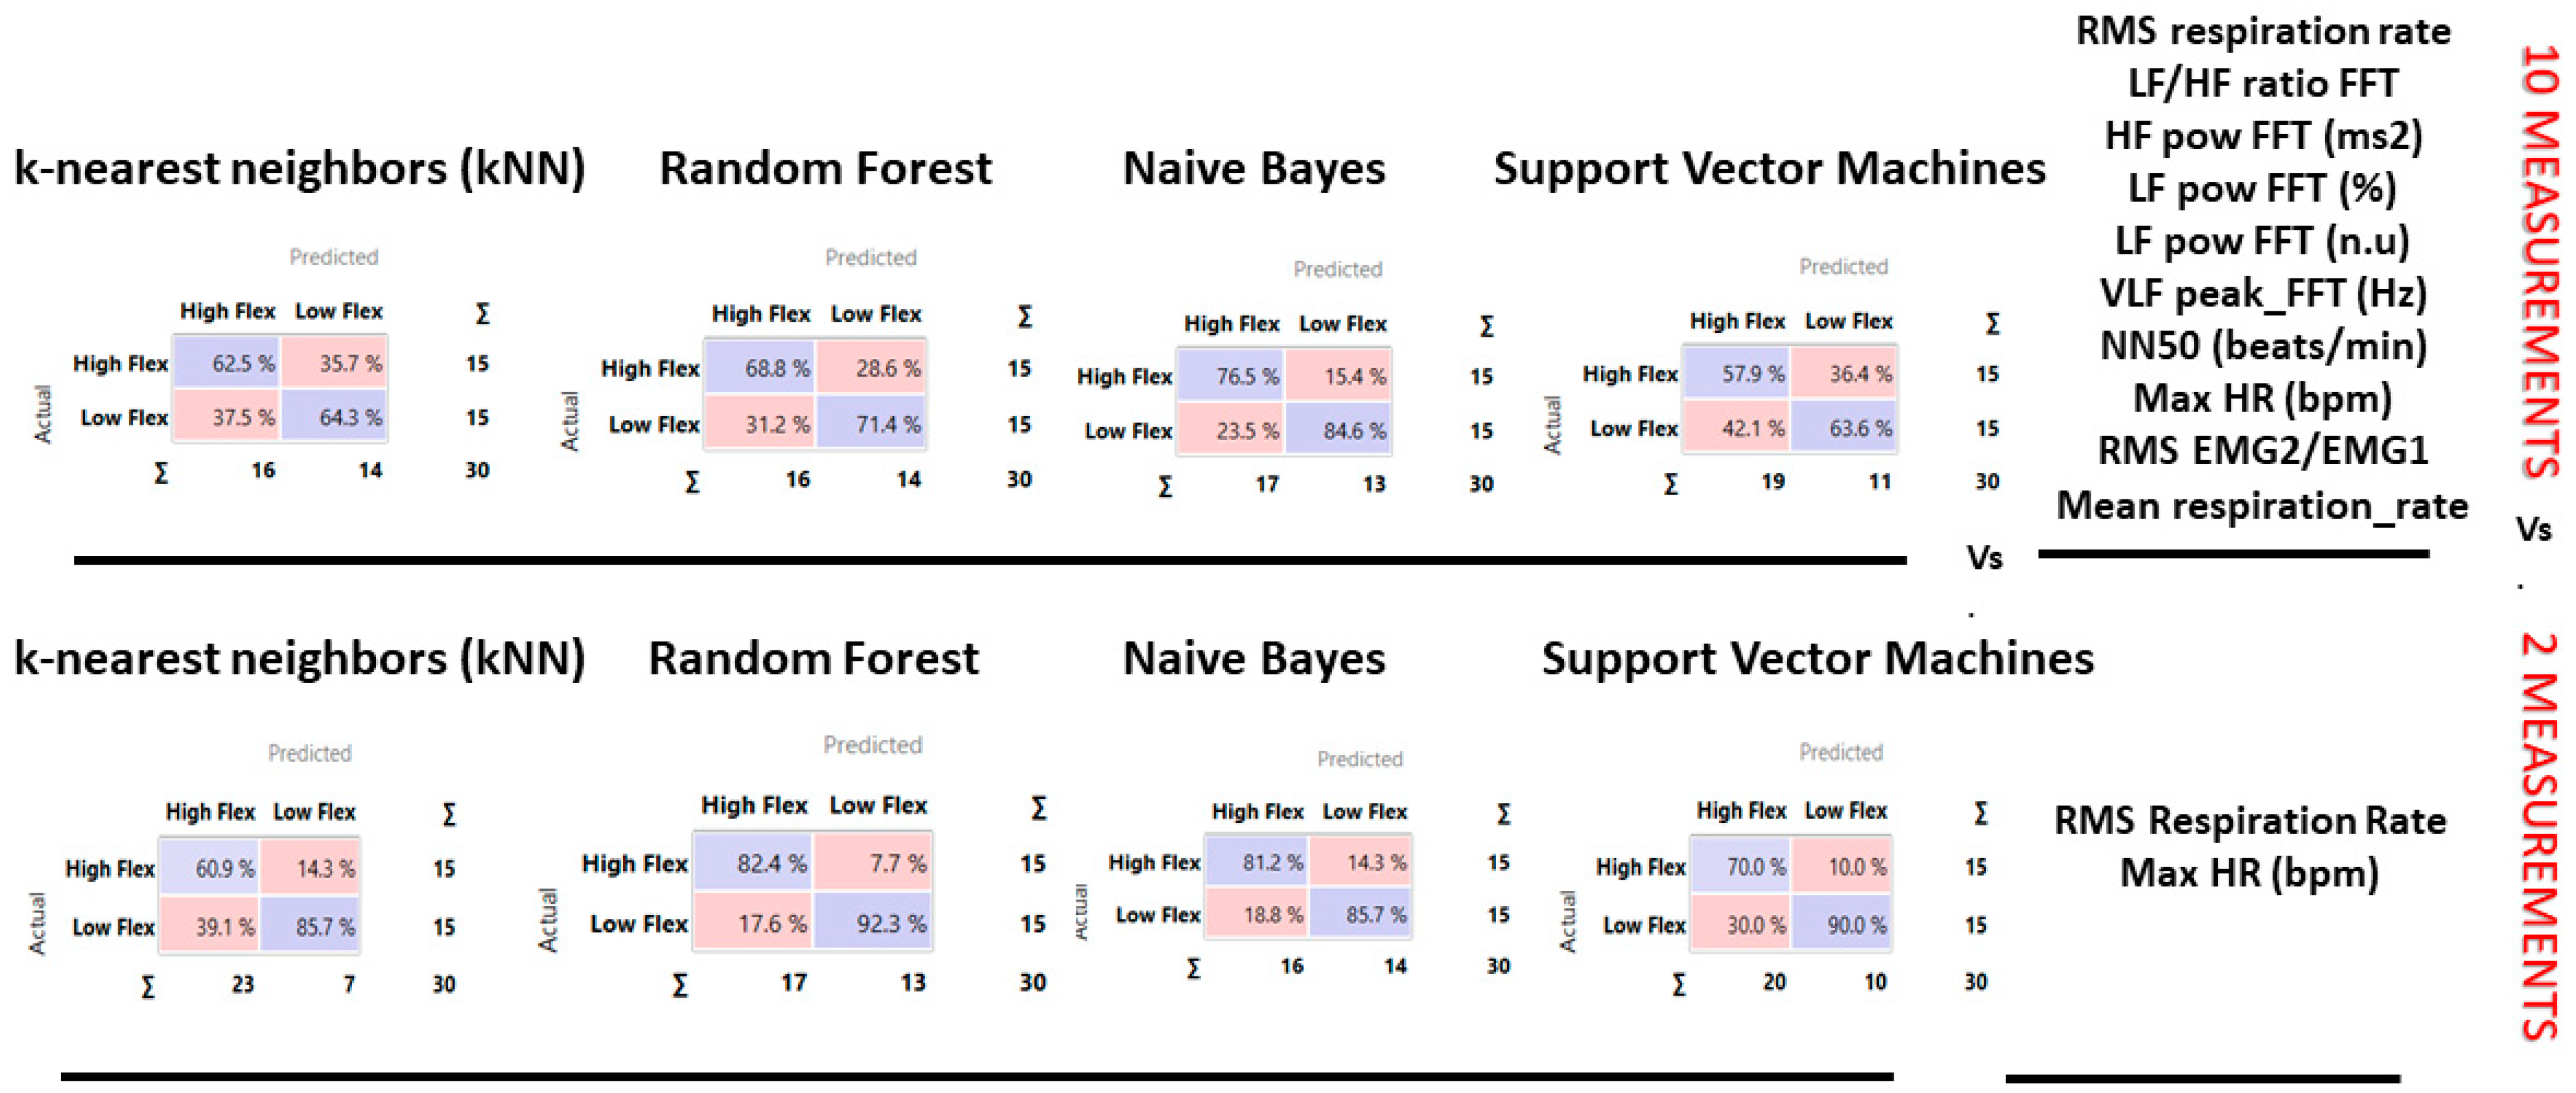
| Method | AUC | CA | F1 | Precision | Recall |
|---|---|---|---|---|---|
| kNN | 0.54 | 0.63 | 0.63 | 0.63 | 0.63 |
| Support Vector Machine (SVM) | 0.46 | 0.60 | 0.59 | 0.61 | 0.60 |
| Random Forest | 0.68 | 0.60 | 0.60 | 0.60 | 0.60 |
| Naive Bayes | 0.81 | 0.80 | 0.80 | 0.81 | 0.80 |
| Method | AUC | CA | F1 | Precision | Recall |
|---|---|---|---|---|---|
| kNN | 0.68 | 0.67 | 0.64 | 0.73 | 0.67 |
| Support Vector Machine (SVM) | 0.77 | 0.77 | 0.76 | 0.80 | 0.77 |
| Random Forest | 0.89 | 0.87 | 0.87 | 0.87 | 0.87 |
| Naive Bayes | 0.88 | 0.83 | 0.83 | 0.83 | 0.83 |
Disclaimer/Publisher’s Note: The statements, opinions and data contained in all publications are solely those of the individual author(s) and contributor(s) and not of MDPI and/or the editor(s). MDPI and/or the editor(s) disclaim responsibility for any injury to people or property resulting from any ideas, methods, instructions or products referred to in the content. |
© 2023 by the authors. Licensee MDPI, Basel, Switzerland. This article is an open access article distributed under the terms and conditions of the Creative Commons Attribution (CC BY) license (https://creativecommons.org/licenses/by/4.0/).
Share and Cite
Borghesi, F.; Chirico, A.; Pedroli, E.; Cipriani, G.E.; Canessa, N.; Amanzio, M.; Cipresso, P. Exploring Biomarkers of Mental Flexibility in Healthy Aging: A Computational Psychometric Study. Sensors 2023, 23, 6983. https://doi.org/10.3390/s23156983
Borghesi F, Chirico A, Pedroli E, Cipriani GE, Canessa N, Amanzio M, Cipresso P. Exploring Biomarkers of Mental Flexibility in Healthy Aging: A Computational Psychometric Study. Sensors. 2023; 23(15):6983. https://doi.org/10.3390/s23156983
Chicago/Turabian StyleBorghesi, Francesca, Alice Chirico, Elisa Pedroli, Giuseppina Elena Cipriani, Nicola Canessa, Martina Amanzio, and Pietro Cipresso. 2023. "Exploring Biomarkers of Mental Flexibility in Healthy Aging: A Computational Psychometric Study" Sensors 23, no. 15: 6983. https://doi.org/10.3390/s23156983