


Characterization of Instrument Transformers under Realistic Conditions: Impact of Single and Combined Influence Quantities on Their Wideband Behavior
 , , , , ,
  , ,
, ,
Abstract
:1. Introduction
- i.
- The definition of the accuracy and uncertainty limits of ITs in PQ measurements, functional to the establishment of “PQ Accuracy Classes” as an extension of the power frequency accuracy class concept of ITs to the frequency range up to 9 kHz. To this end, significant test waveforms and suitable performance indices for PQ parameters have been defined and experimented, as detailed in [35].
- ii.
- The development of missing reference measurement systems and related test procedures and methodologies to evaluate the relevant uncertainty contribution of ITs to PQ indices, to ensure the traceability and accuracy of the measurement results provided of ITs in the wideband measurement of PQ disturbances. On this subject, reference systems for the laboratory frequency characterization of VT/LPVT and CT/LPCT have been developed starting from previous experience. An example of a realized setup and its characterization is given in [16].
- iii.
- The implementation of simplified IT test procedures, which can be easily adopted by test laboratories that operate in an industrial environment. To this end, simplified but accurate procedures to characterize wideband ITs have been studied and validated by comparison with the reference ones as implemented by NMIs. An example of a procedure for VTs’ wideband characterization that makes use of measurement instrumentation commonly used in industrial laboratories is described in [36].
- iv.
- The evaluation of ITs’ performance under realistic conditions, including the impact of the simultaneous presence of different influence quantities. The adopted procedure, systems, and findings of the activity carried out on this last topic are the subject of the present paper, as described in the following sections, considering the previously mentioned influence quantities.
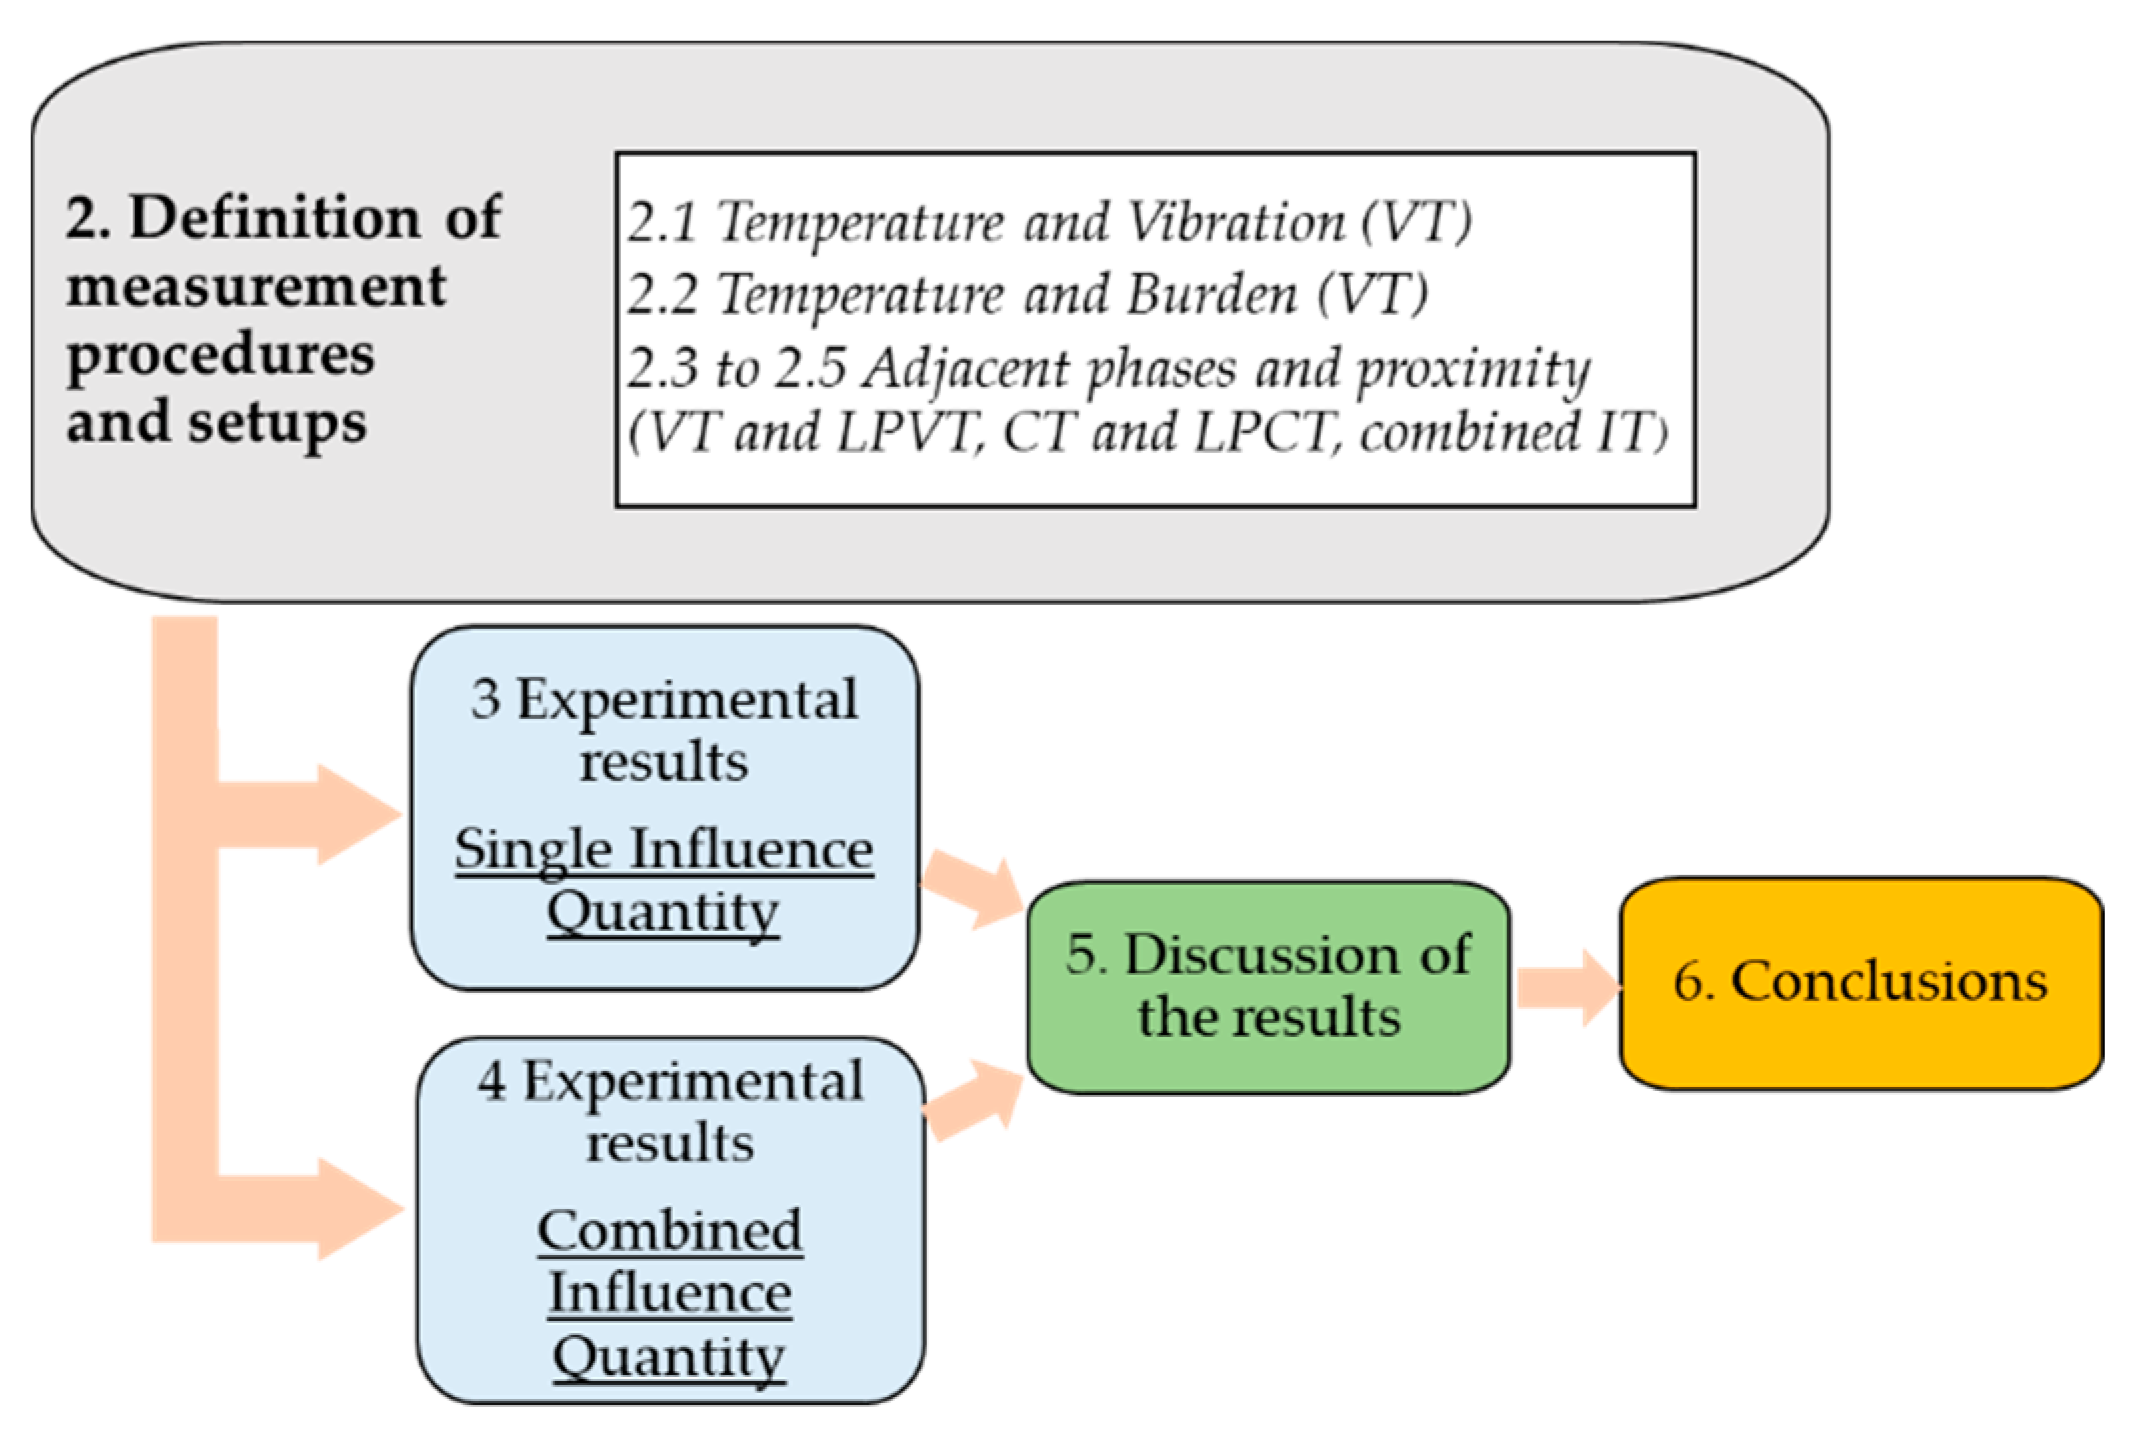
2. Measurement Procedures and Setups
2.1. Influence of Temperature and Vibration on VTs
2.1.1. Introduction
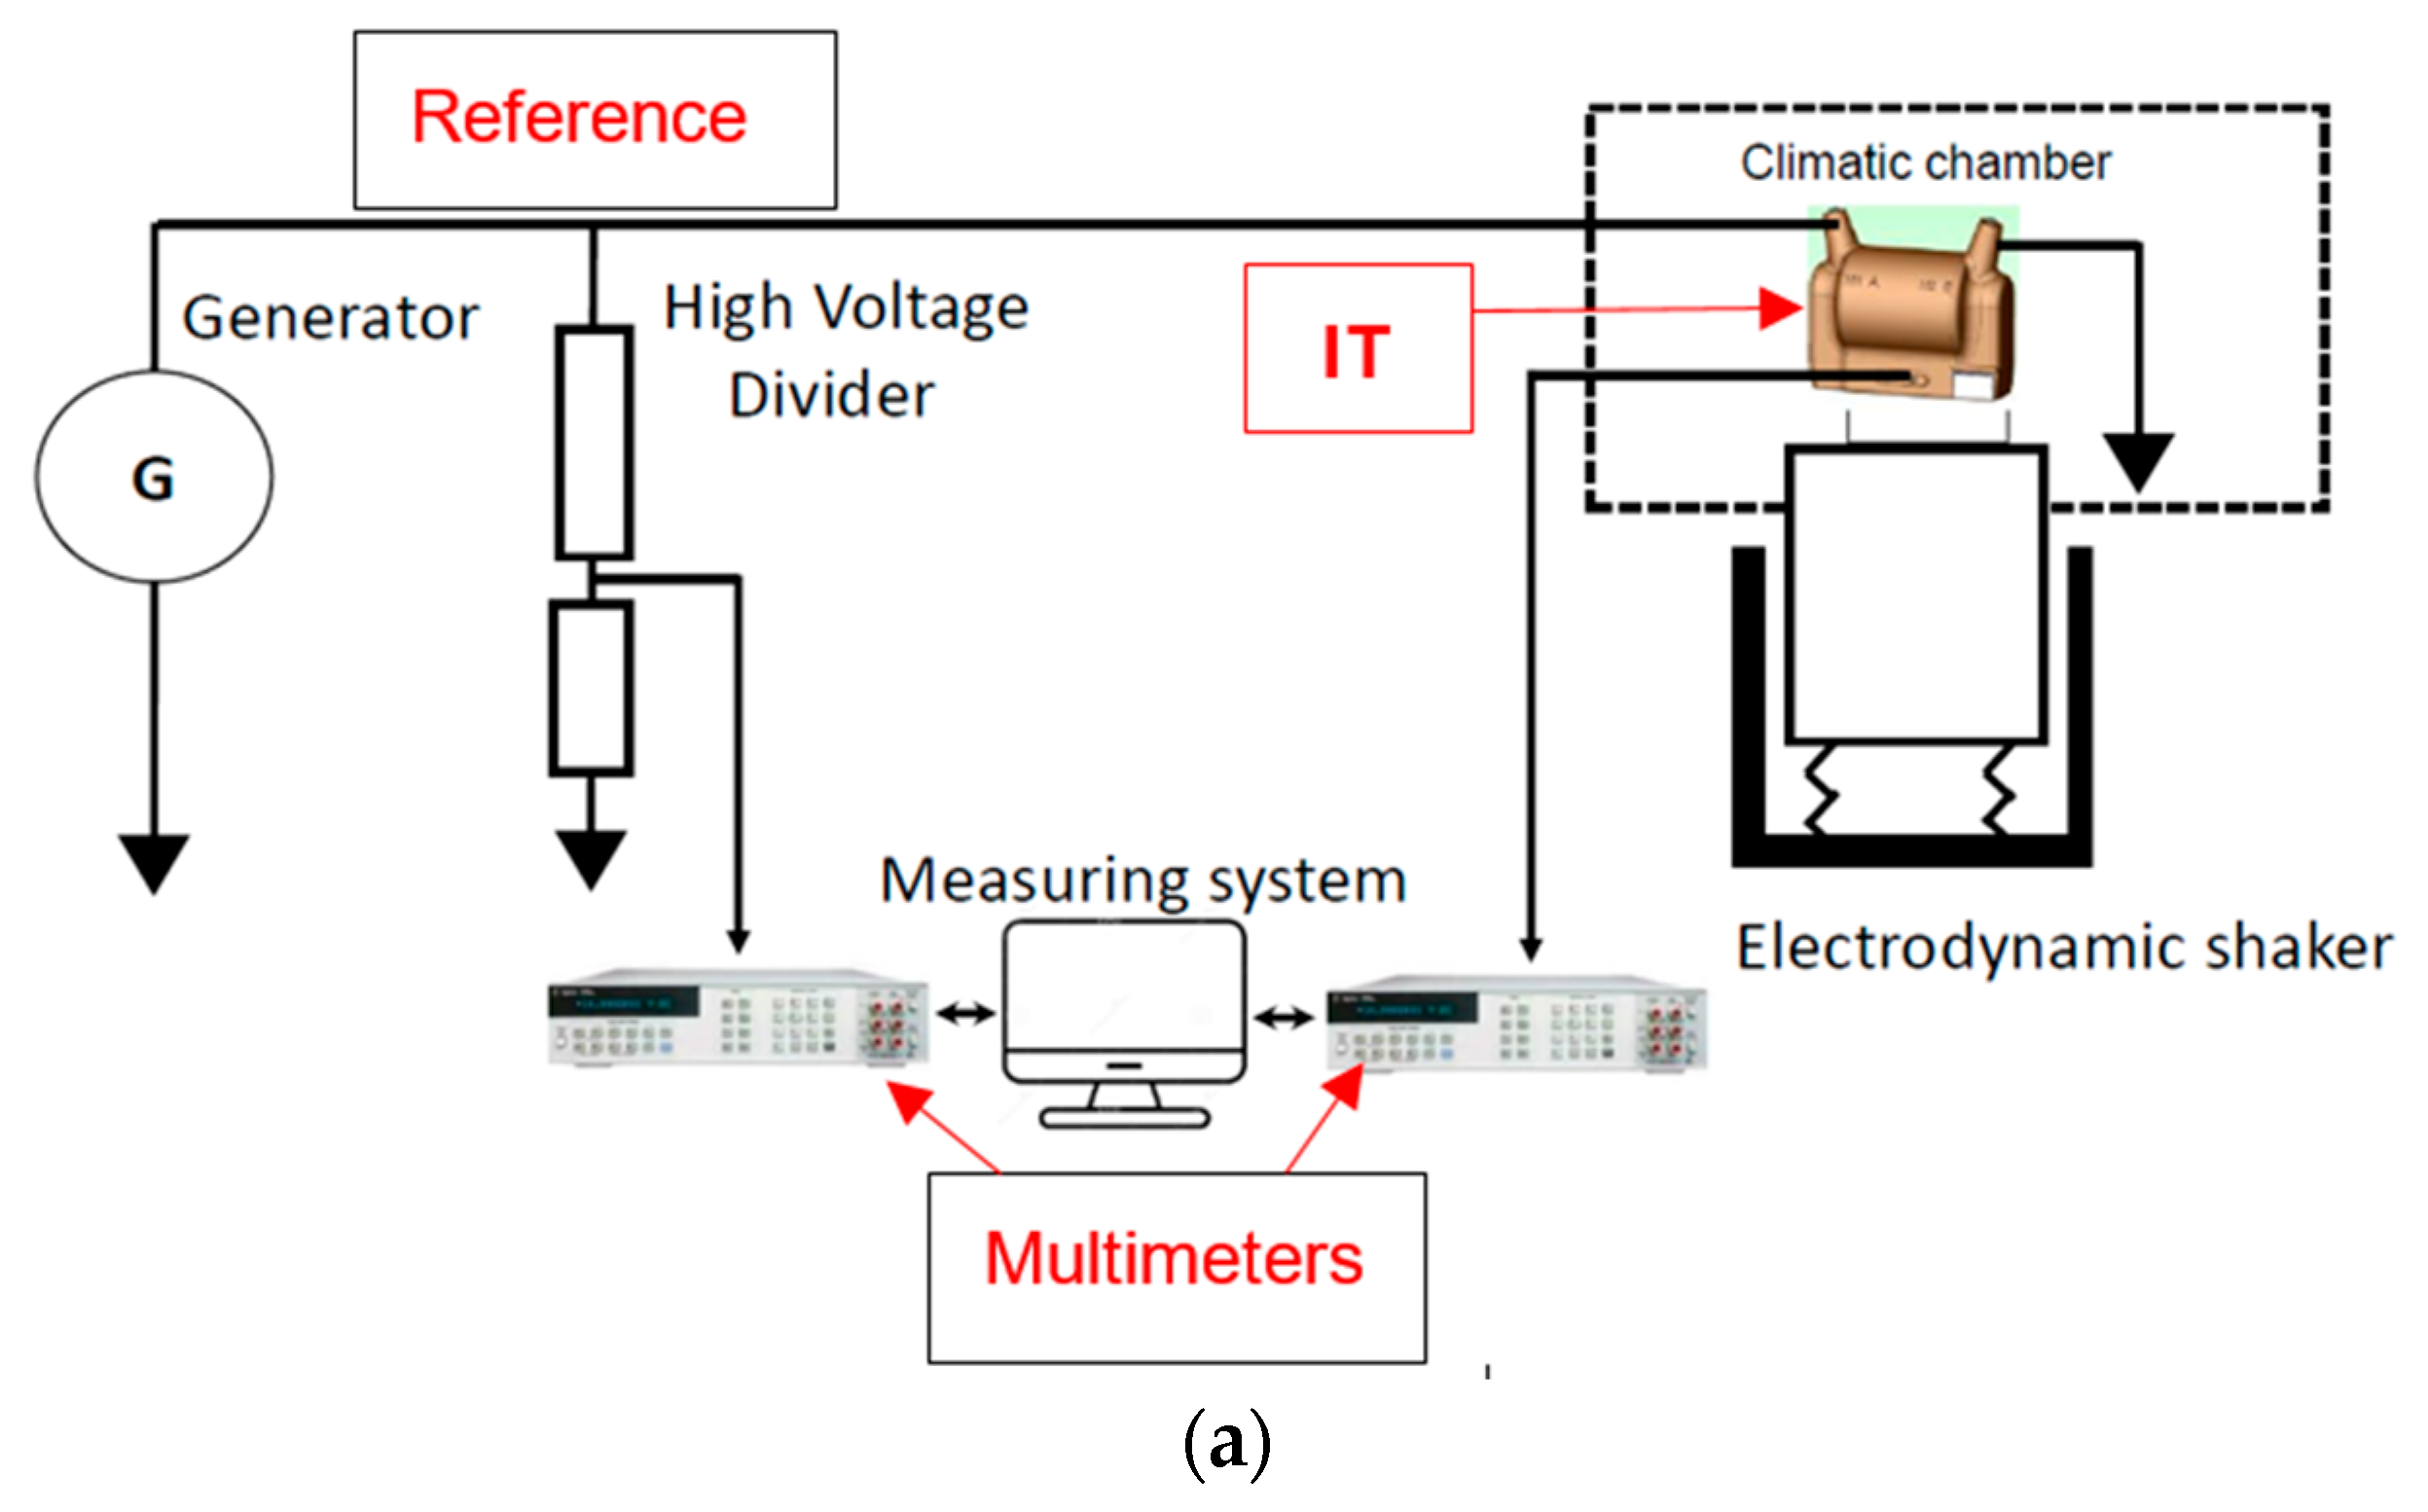
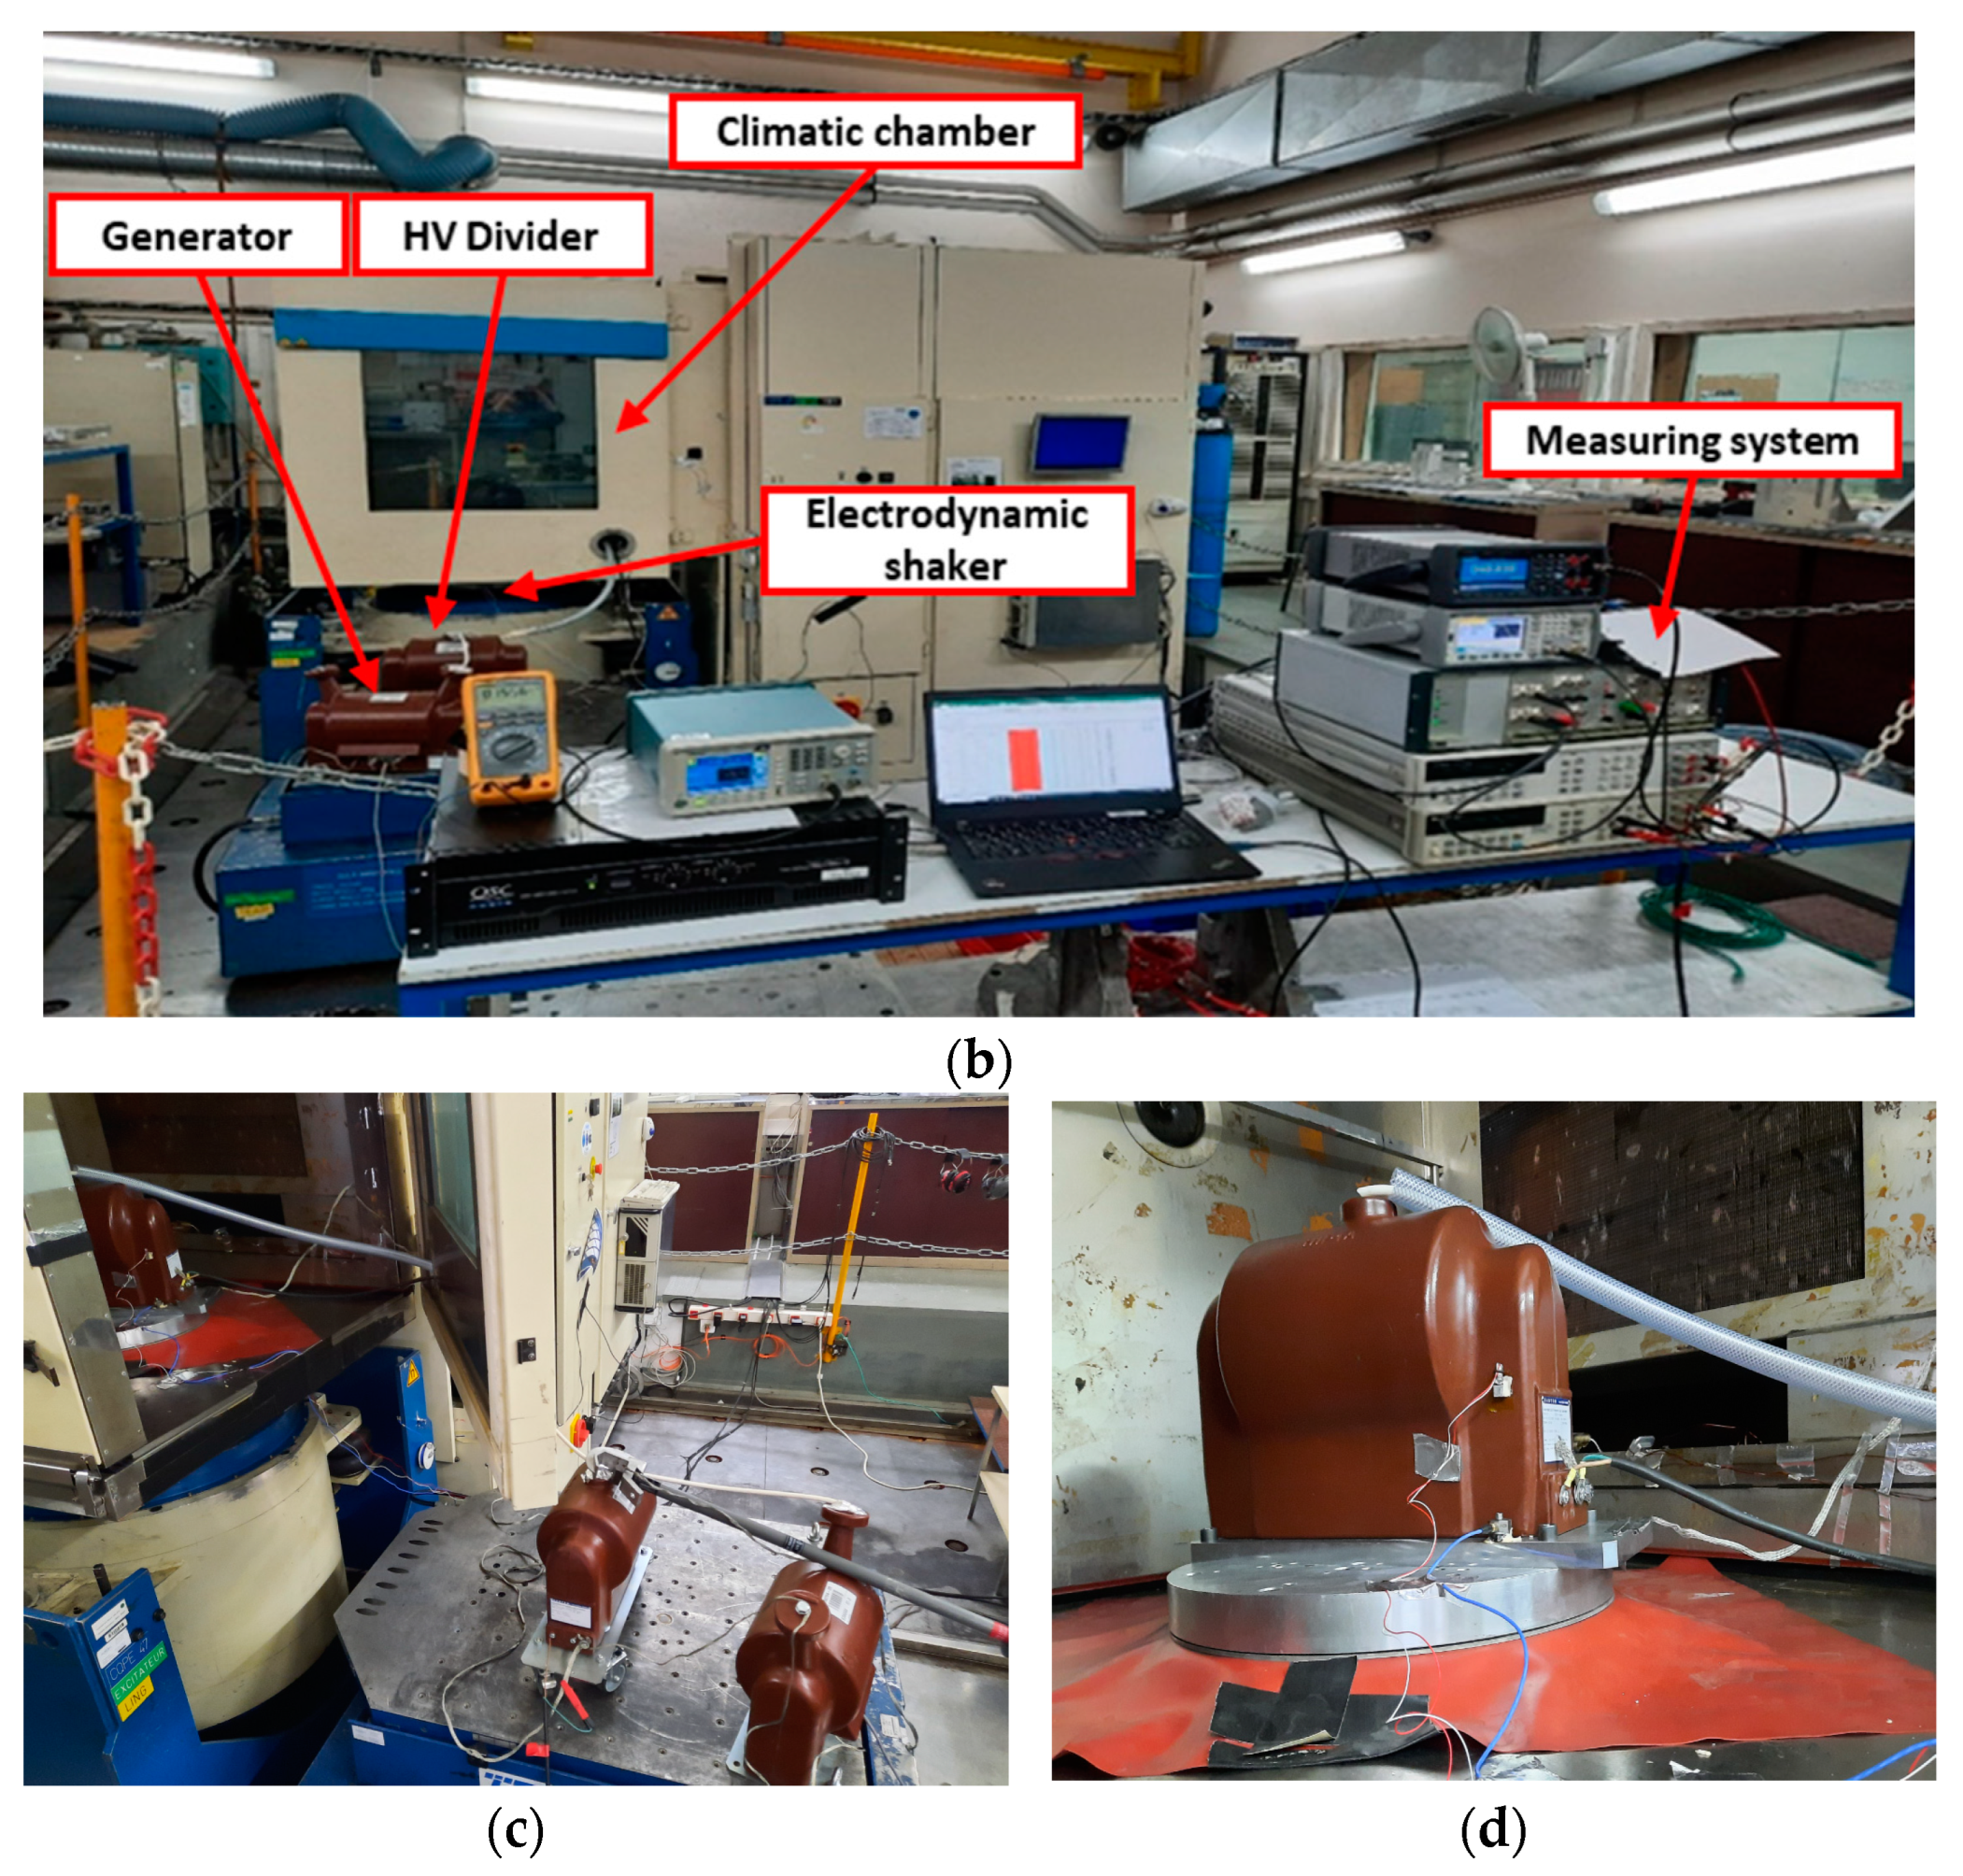
2.1.2. Measurement Setup
2.1.3. Test Procedure
- A.
- VT performance assessment under separate temperature and vibration
- a.
- Setup of the shaker at Z axis.
- b.
- Measurement of the VT PIs at fundamental frequency without vibration for all three temperatures (−25 °C, 23 °C, and 55 °C).
- c.
- Measurement of the VT PIs under vibration for all three temperatures (−25 °C, 23 °C, and 55 °C), all vibration frequencies (3 Hz, 20 Hz, 100 Hz, and 150 Hz), and all accelerations (0.1 g, 0.3 g, and 0.5 g).
- d.
- Setup of the shaker at X axis.
- e.
- Measurement of the VT PIs in the absence of vibration at 23 °C.
- f.
- Measurement of the VT PIs at 23 °C under vibration for all vibration frequencies (3 Hz, 20 Hz, 100 Hz, and 150 Hz) and all accelerations (0.1 g, 0.3 g, and 0.5 g).
- g.
- Setup of the shaker at the Y axis and at 23 °C.
- h.
- Measurement of the VT PIs without vibration at 23 °C.
- i.
- Measurement of the VT PIs at 23 °C under vibration for all vibration frequencies (3 Hz, 20 Hz, 100 Hz, and 150 Hz) and all accelerations (0.1 g, 0.3 g, and 0.5 g).
- B.
- Assessment of VT frequency response under temperature and vibration conditions.
- a.
- Setup of the shaker at the Z axis.
- b.
- Measurement of the VT’s frequency response without vibration for all three temperatures.
- c.
- Measurement of the frequency response of the VT under vibration for all three temperatures (−25 °C, 23 °C, and 55 °C) under vibration frequencies of 20 Hz and 100 Hz at 0.5 g acceleration.
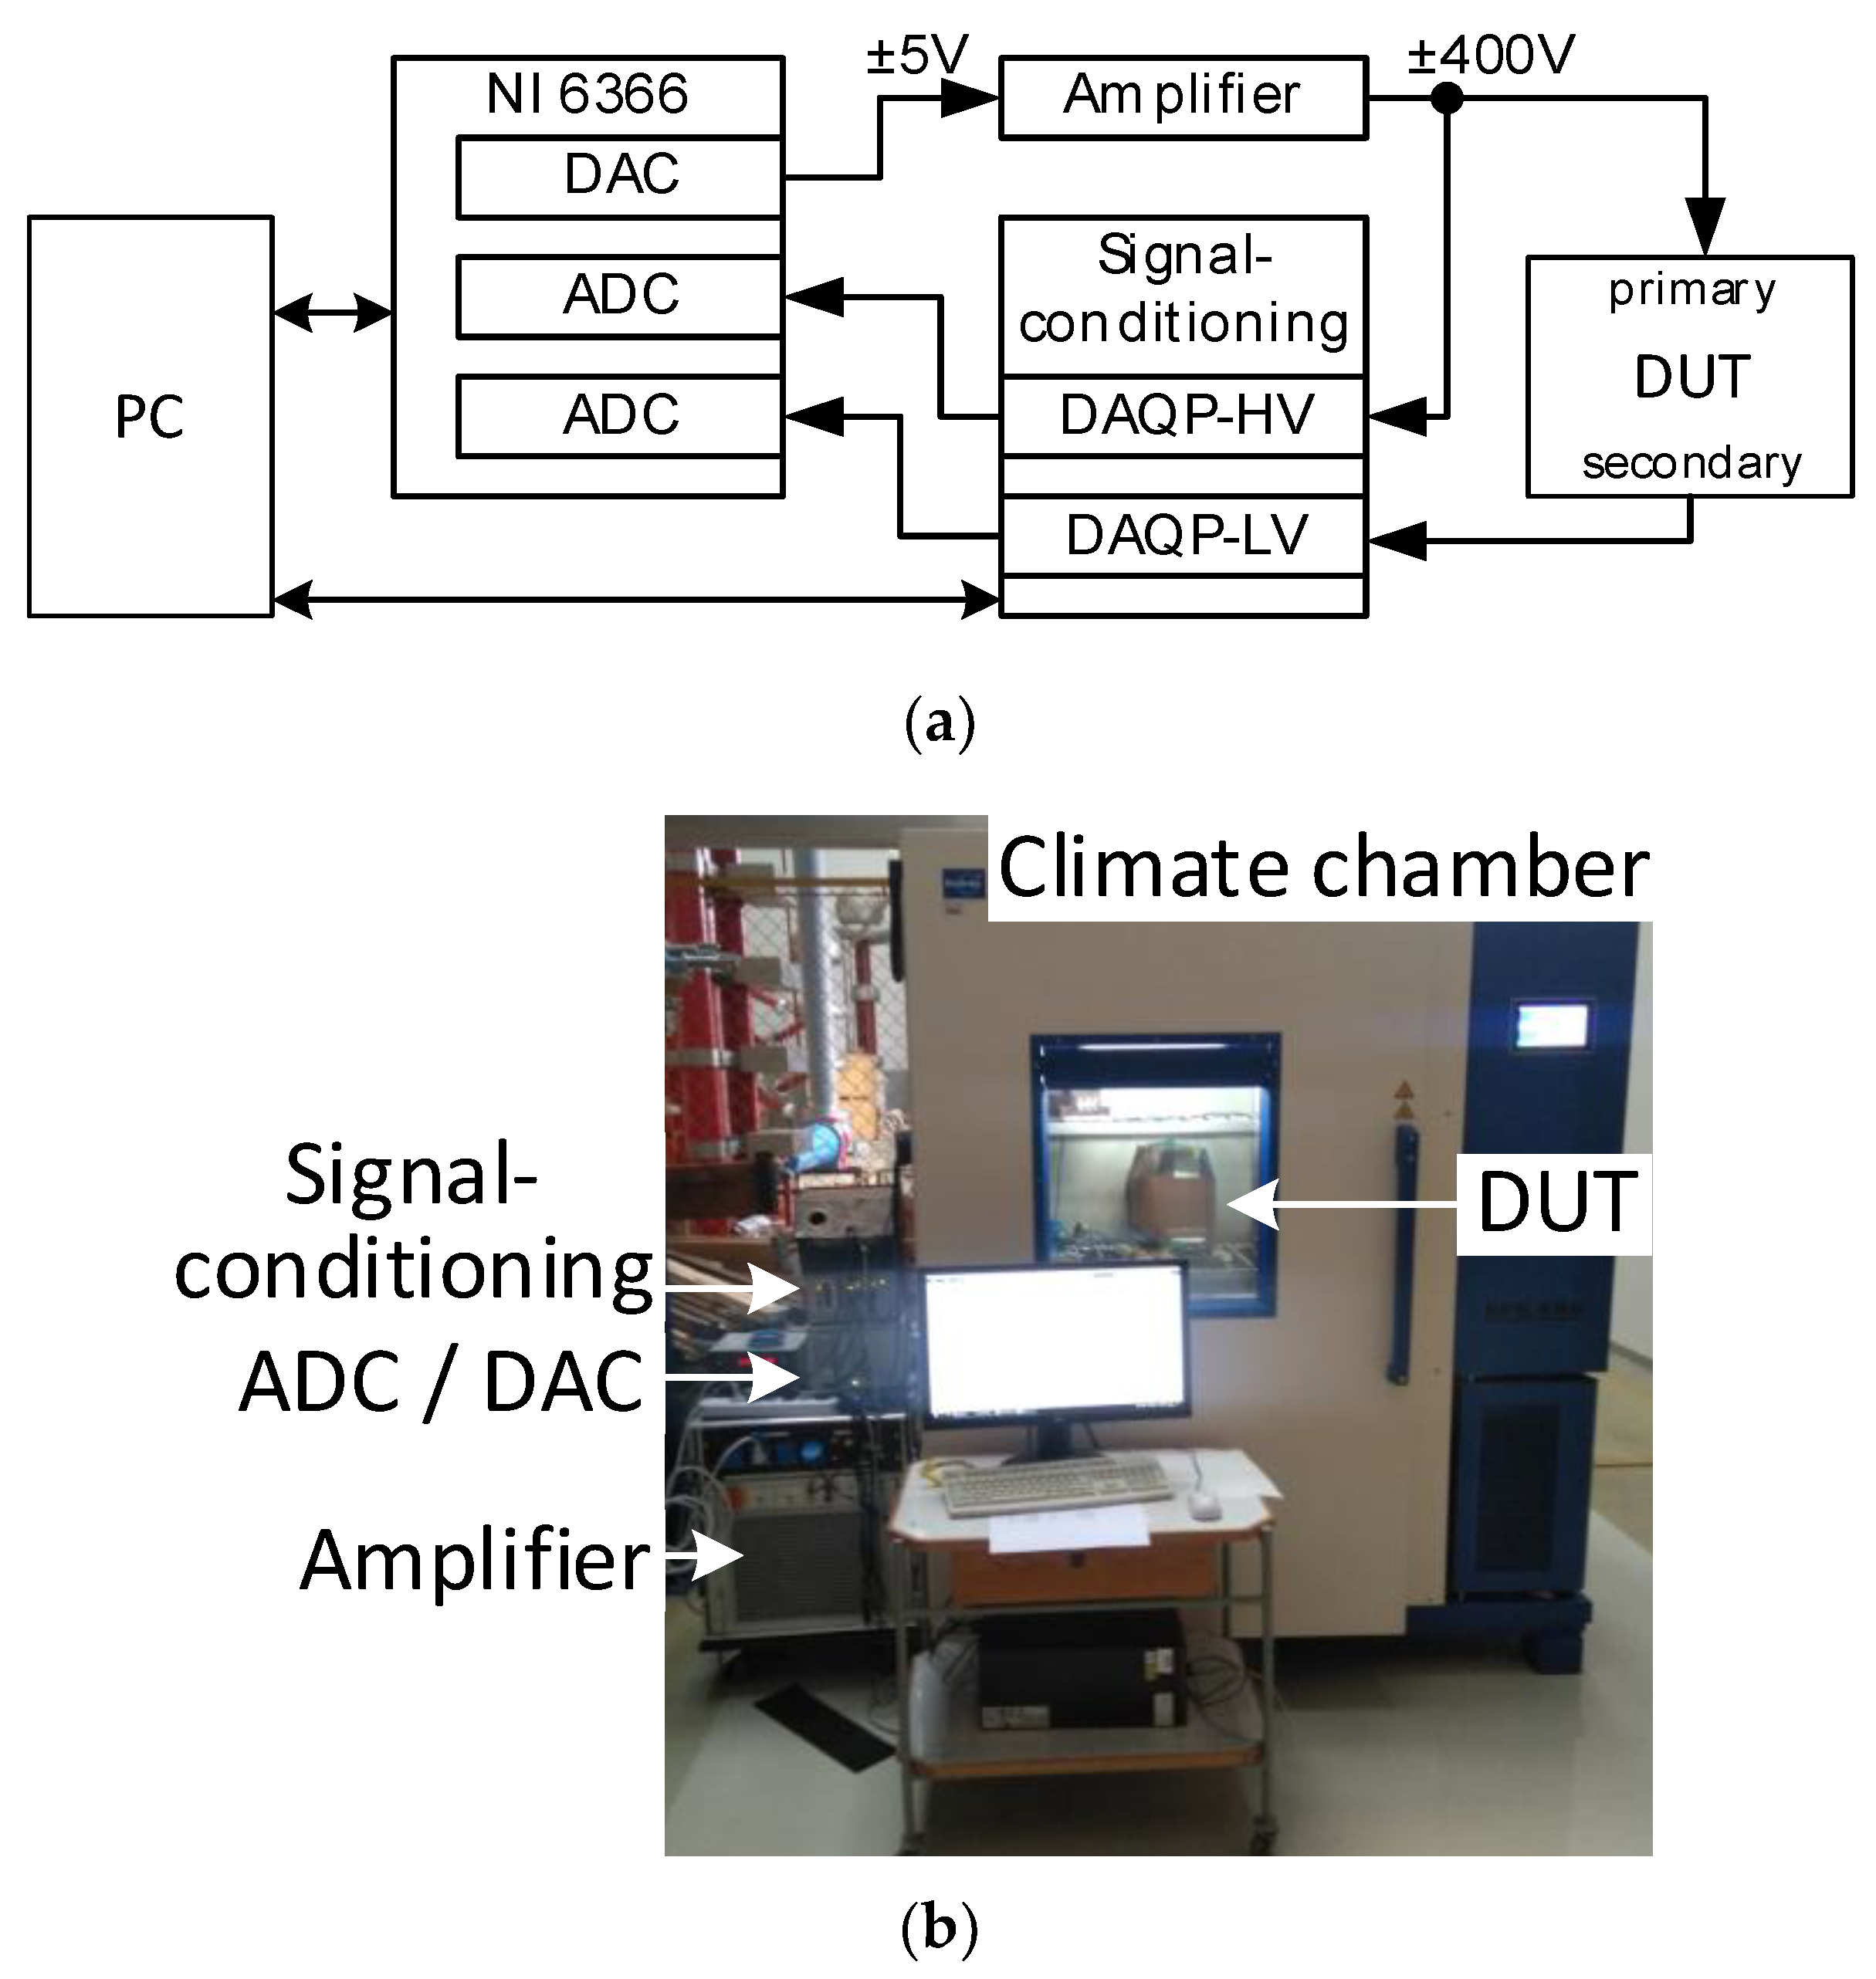
2.2. Influence of Temperature and Burden on VTs
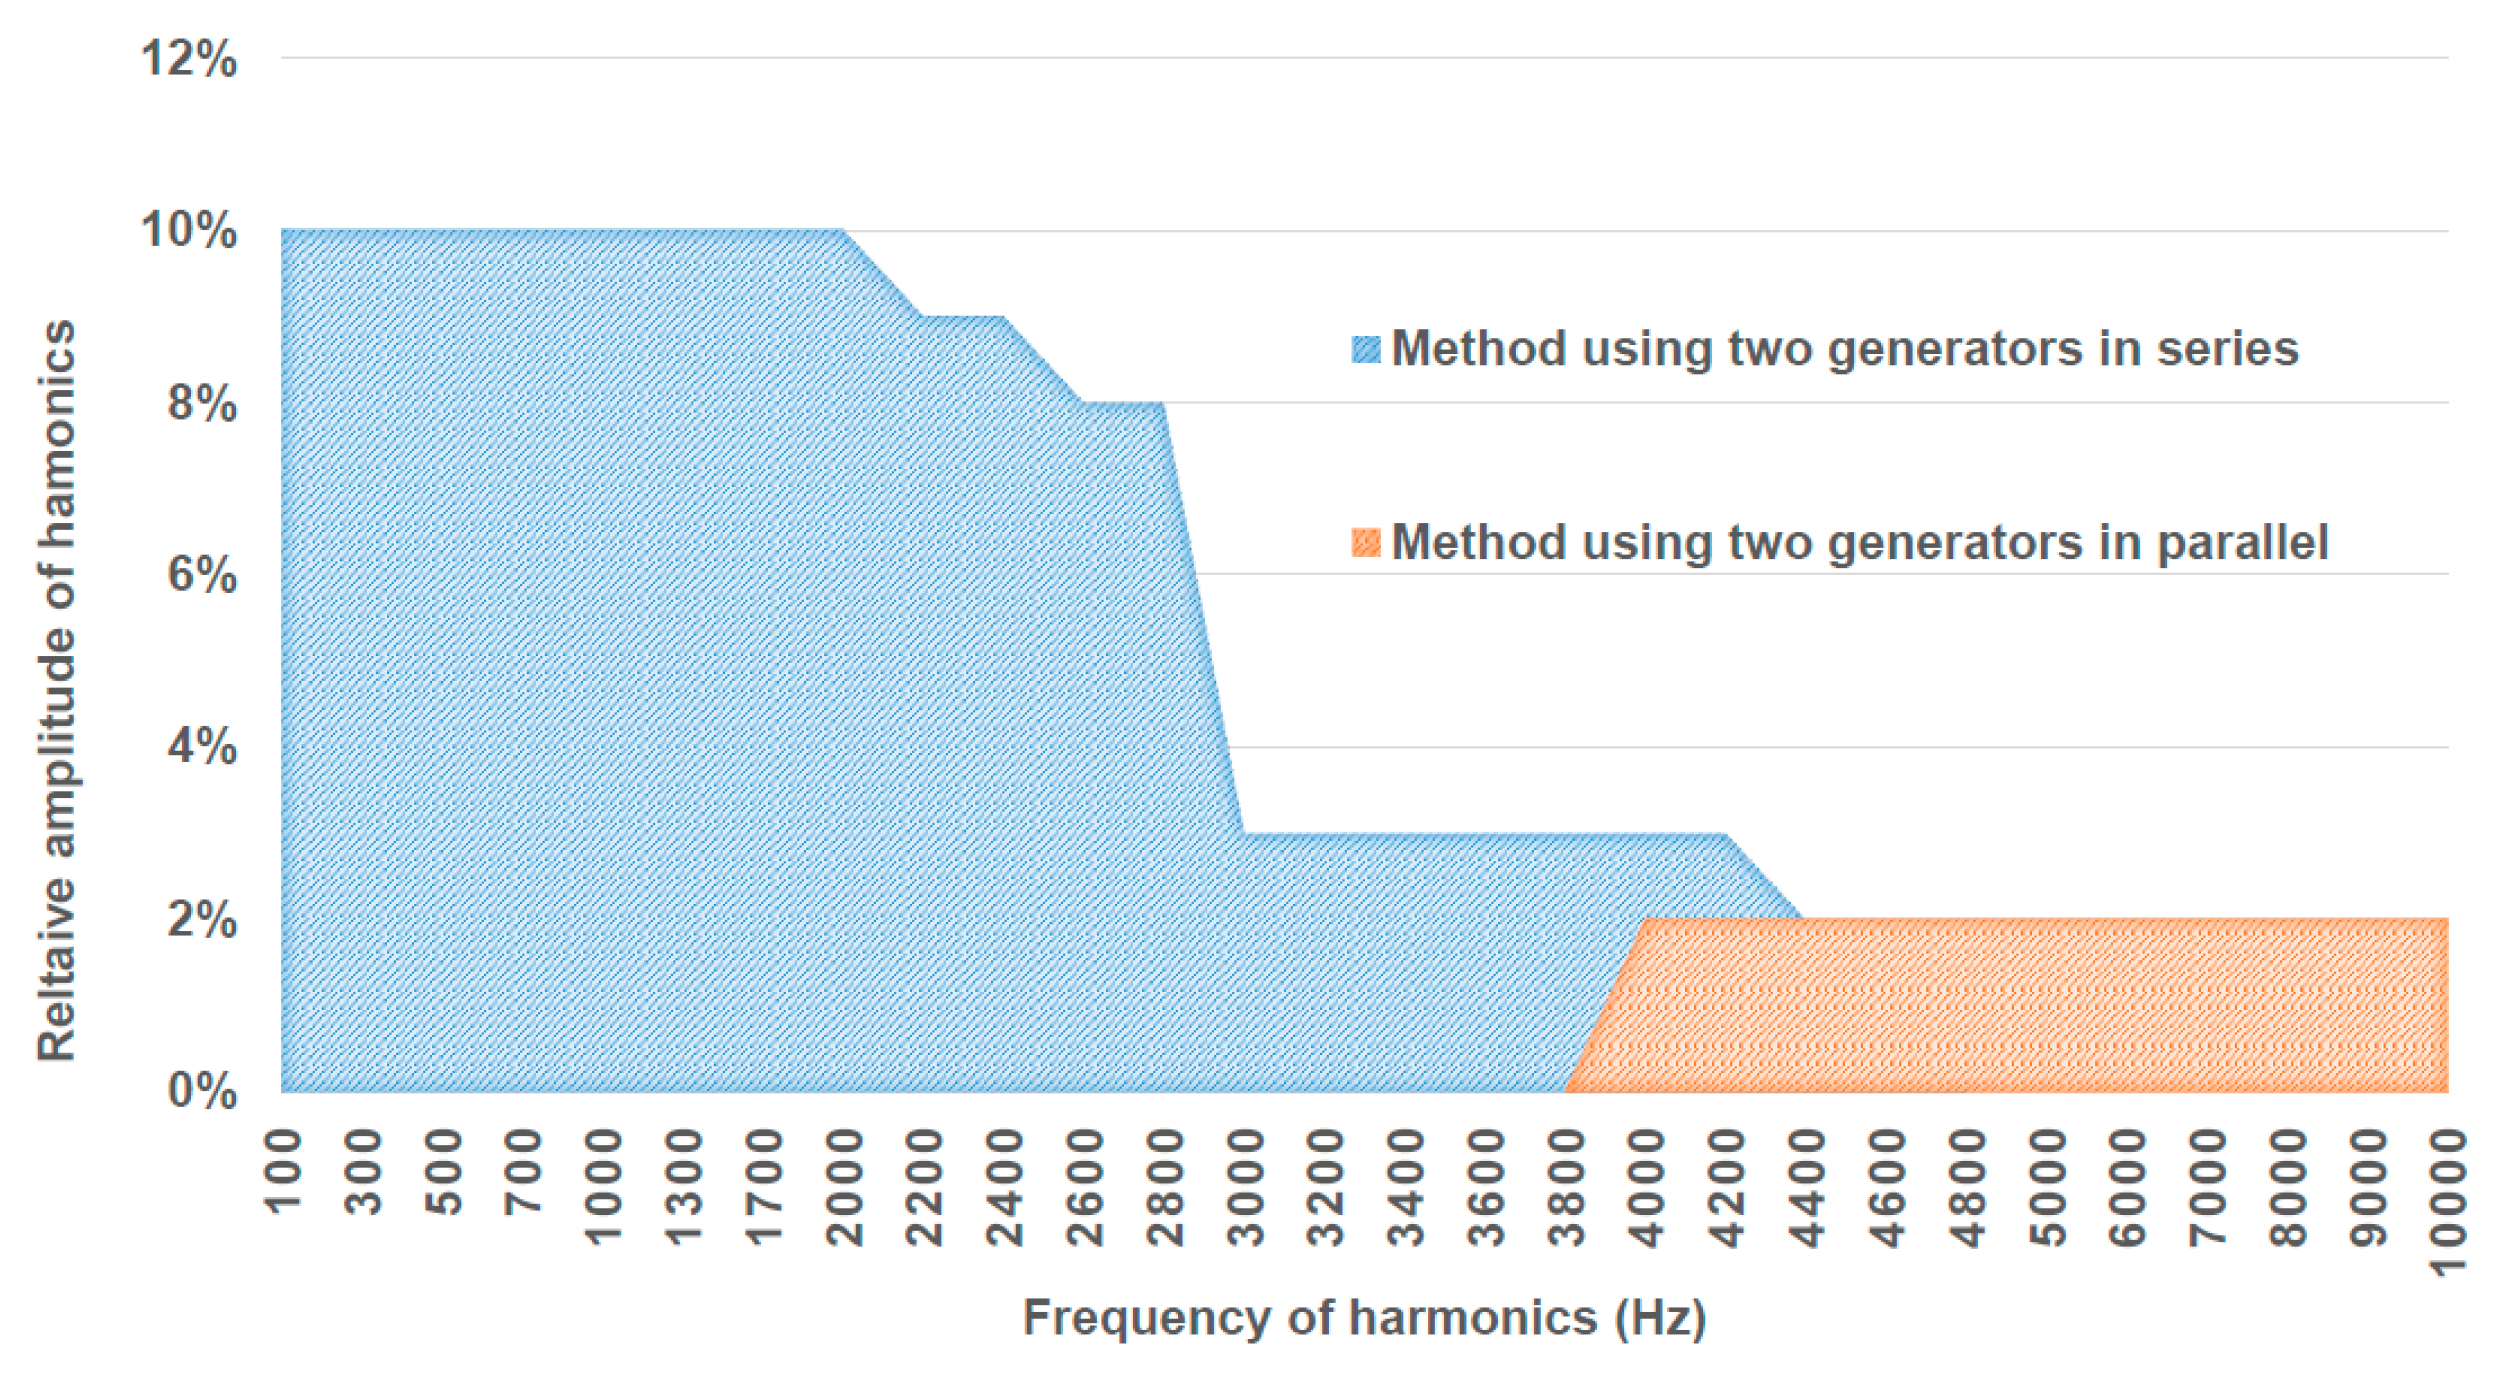
2.2.1. Generation and Measurement Setup
2.2.2. Test Procedure
2.3. Influence of Adjacent Phases and Proximity on VTs and LPVTs
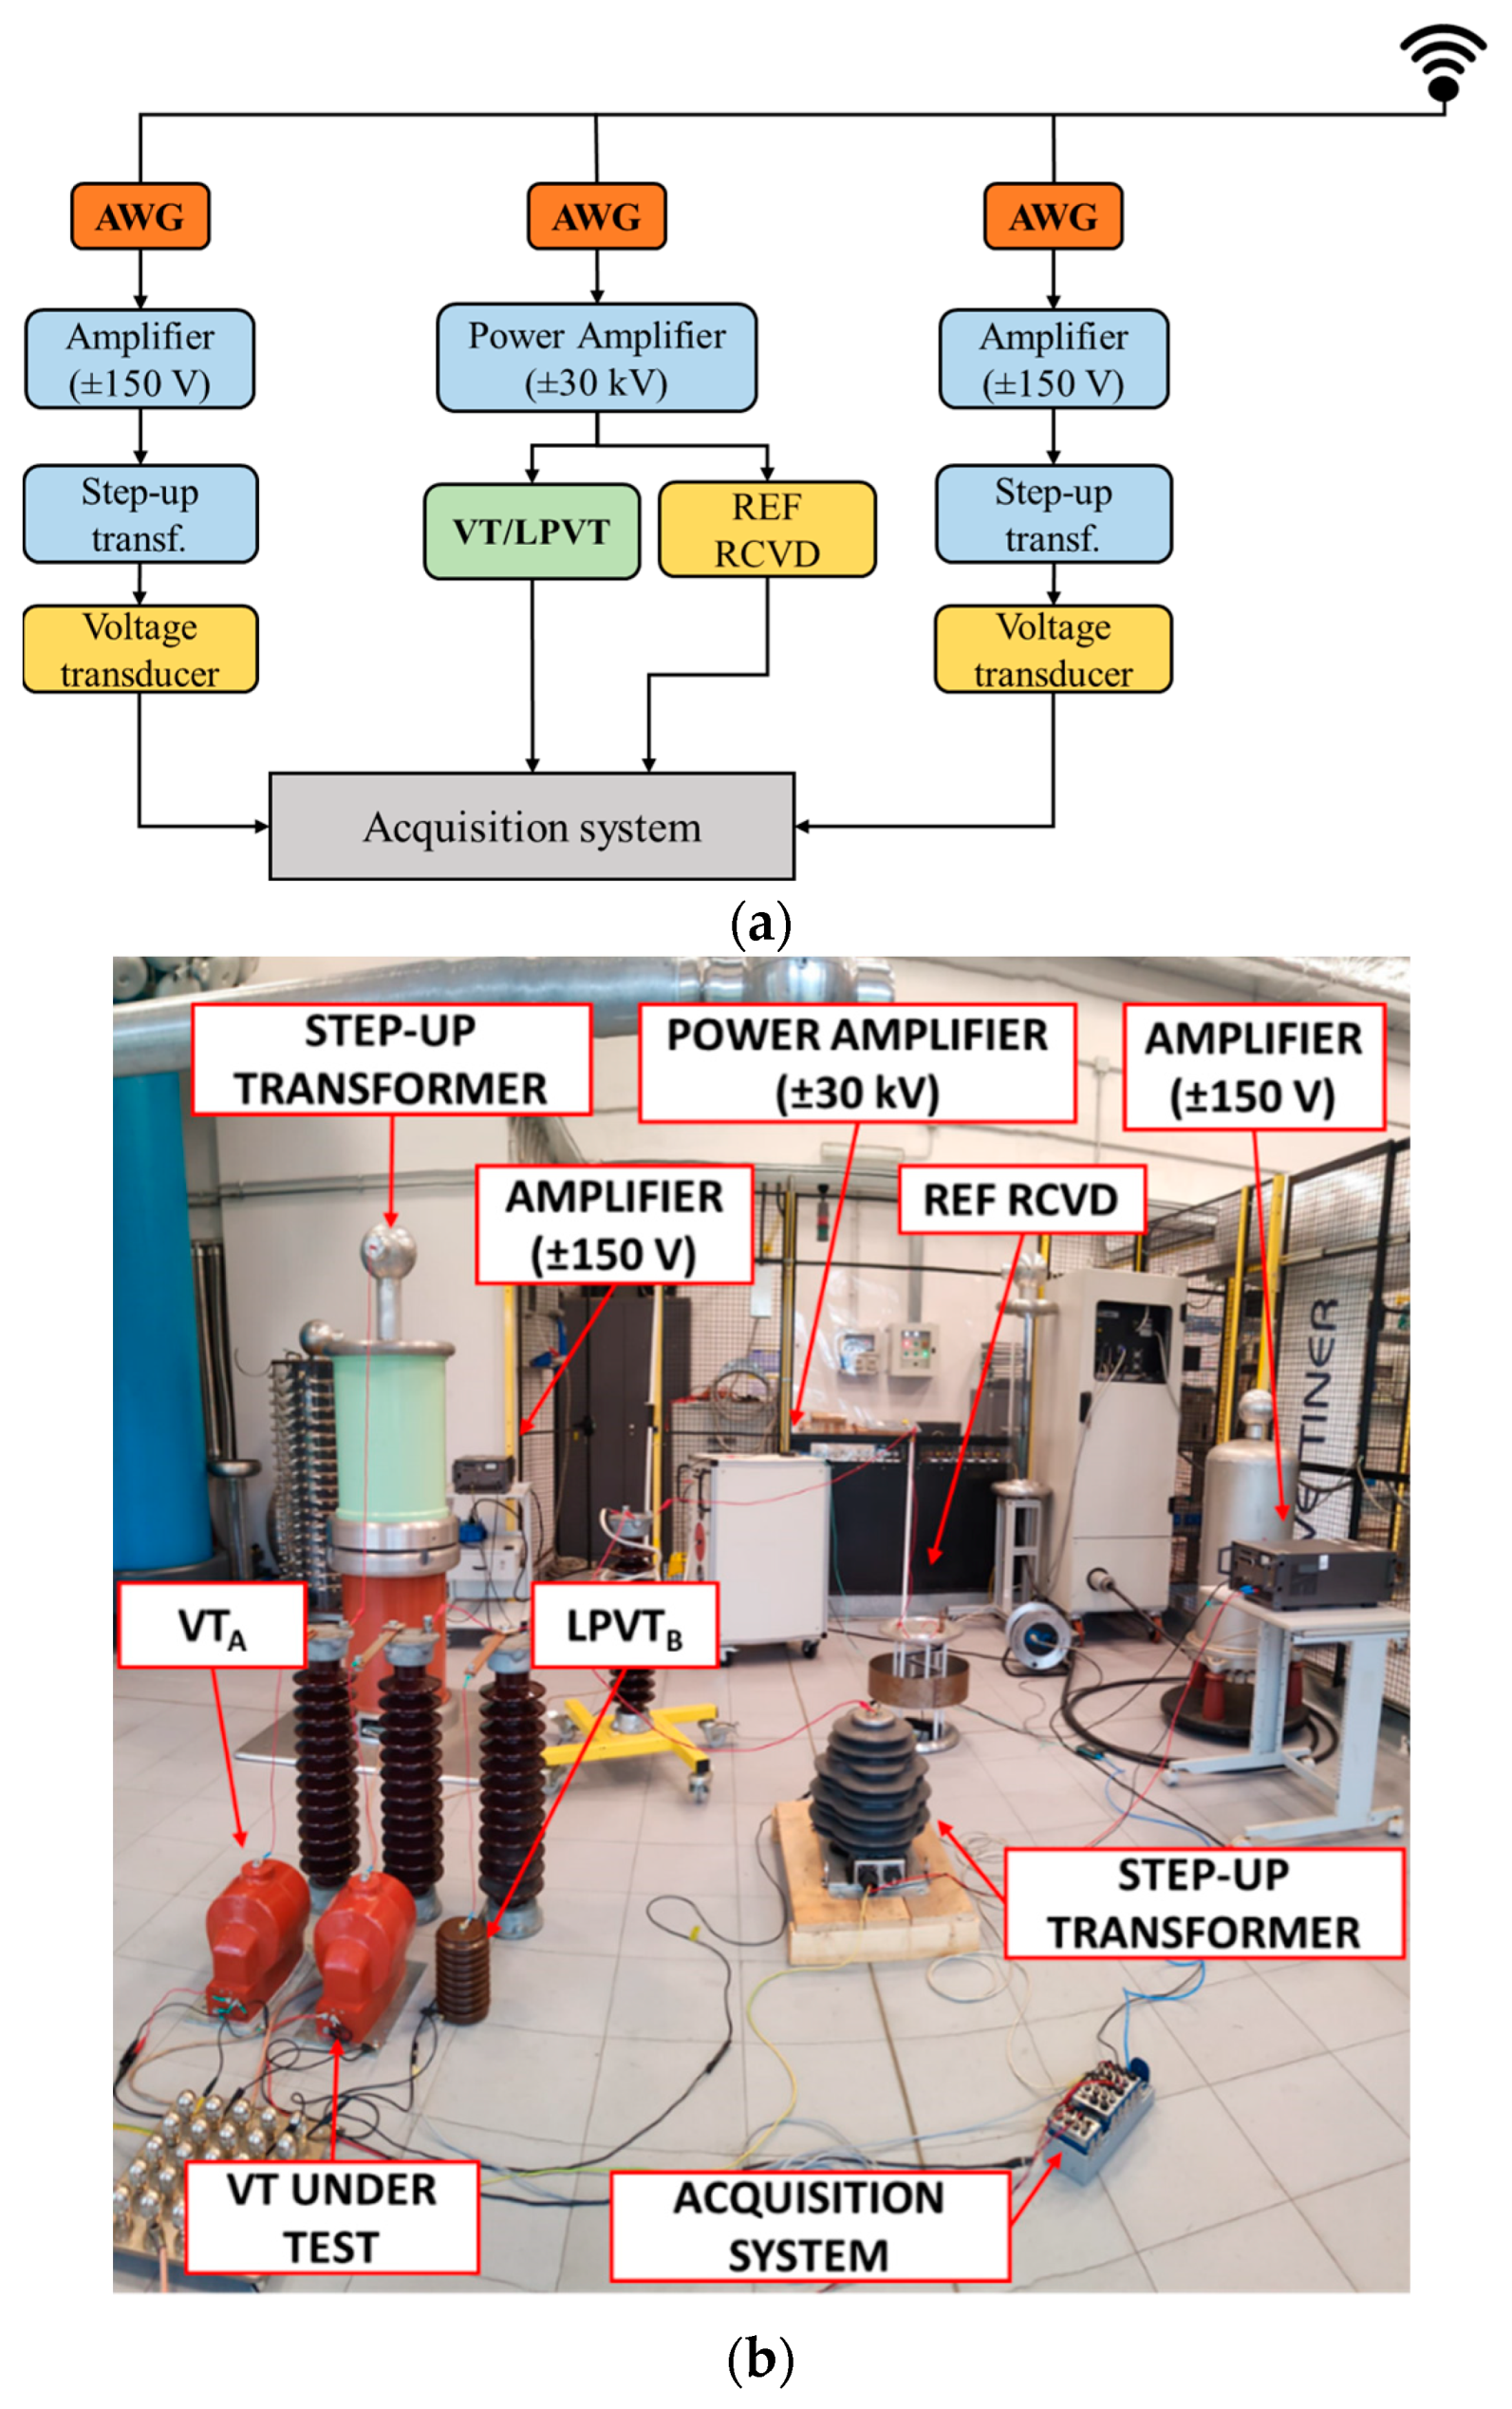
2.3.1. Generation and Measurement Setup
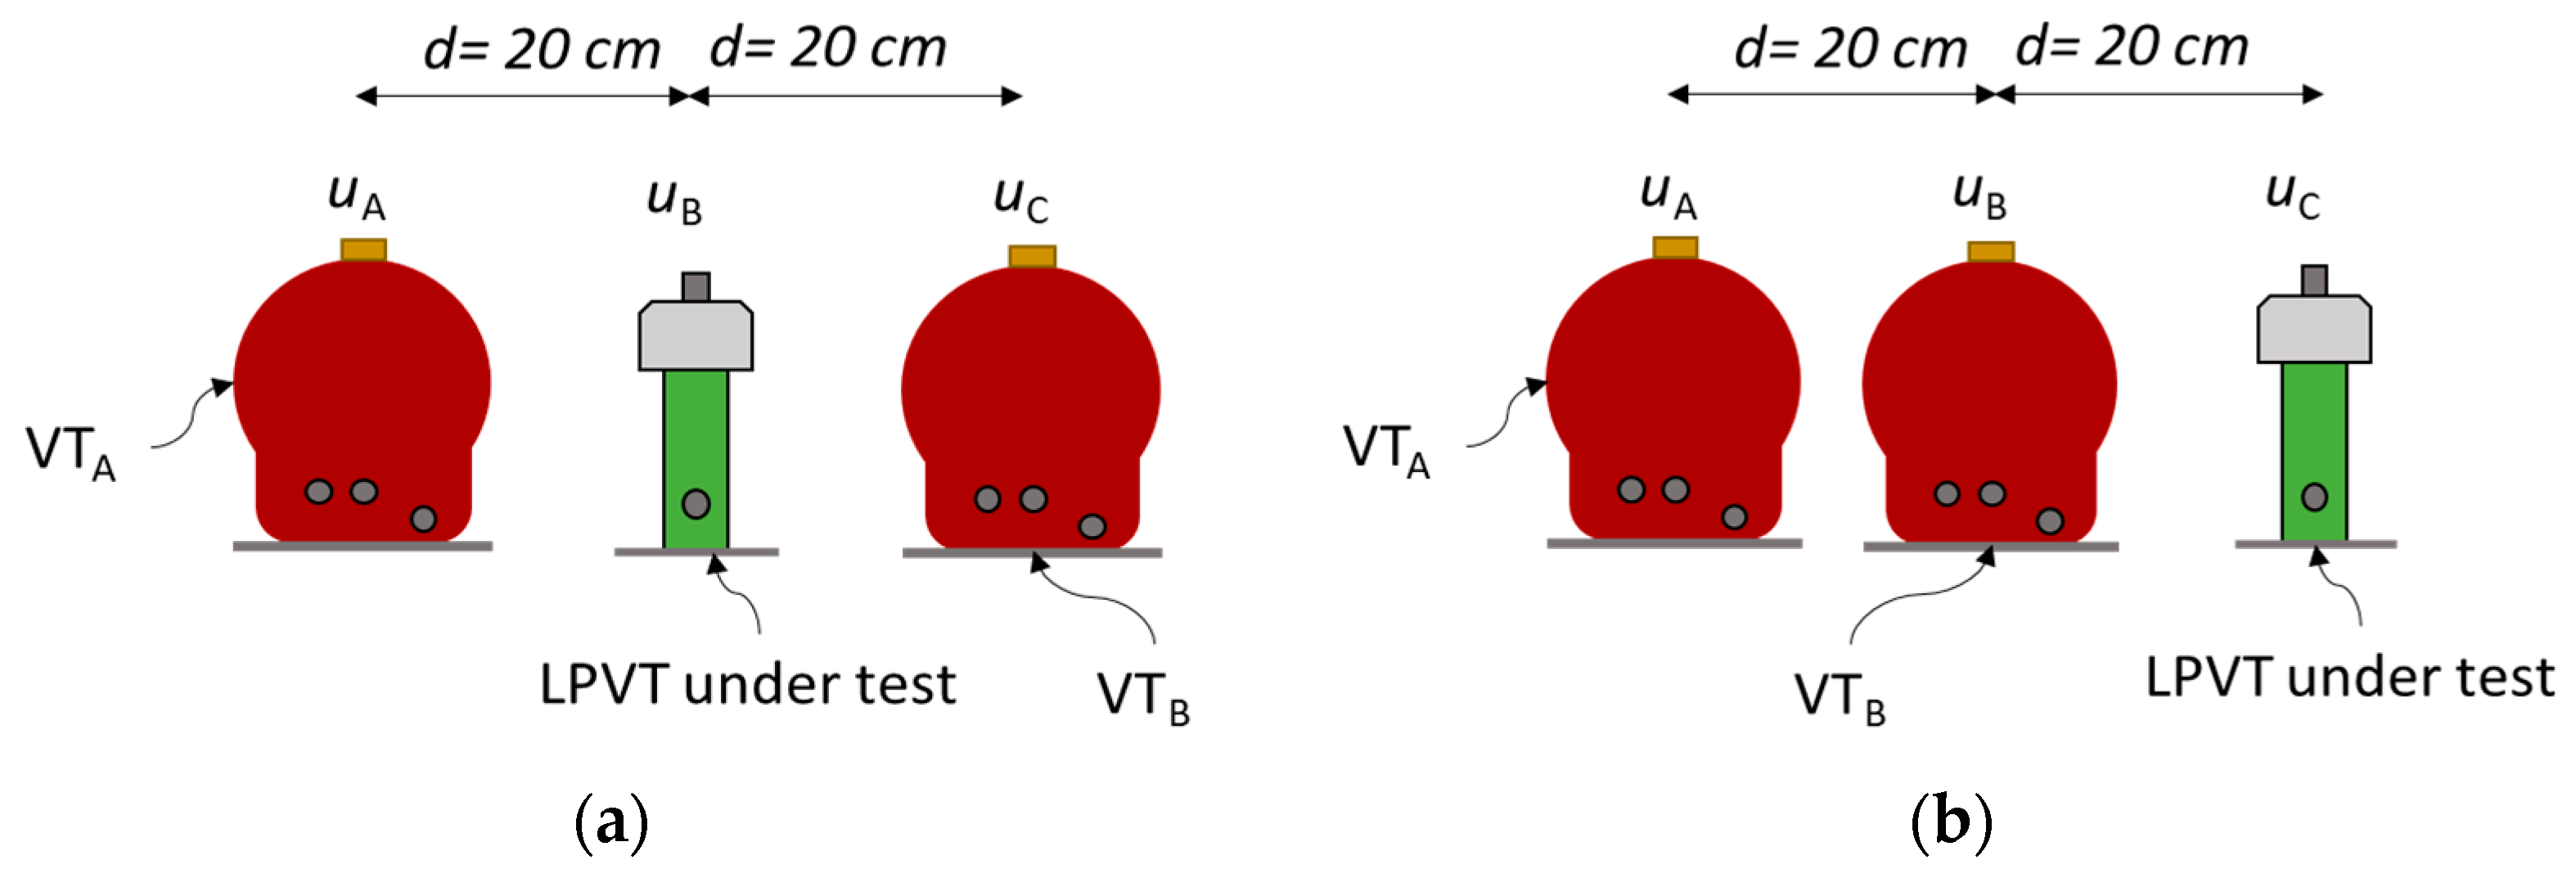
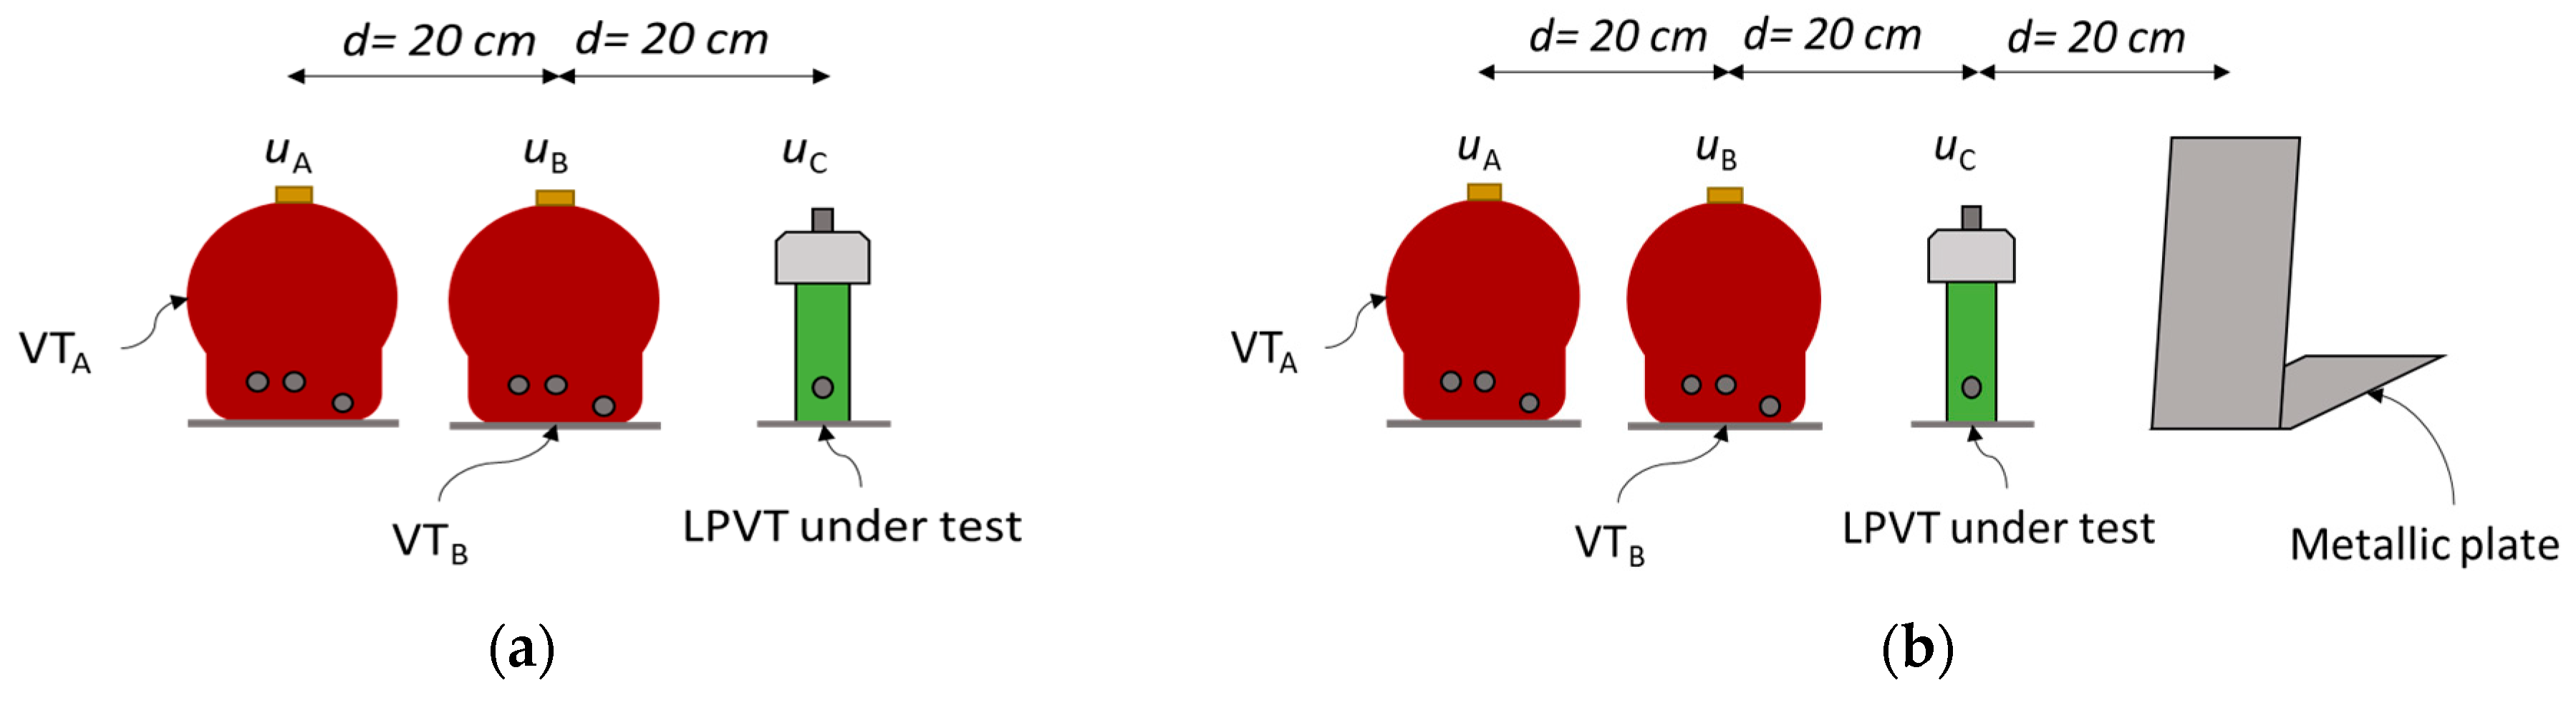
2.3.2. Test Procedures
- Adjacent Phase Test
- Proximity Effect
- Combined Effect of Adjacent Phases and Proximity
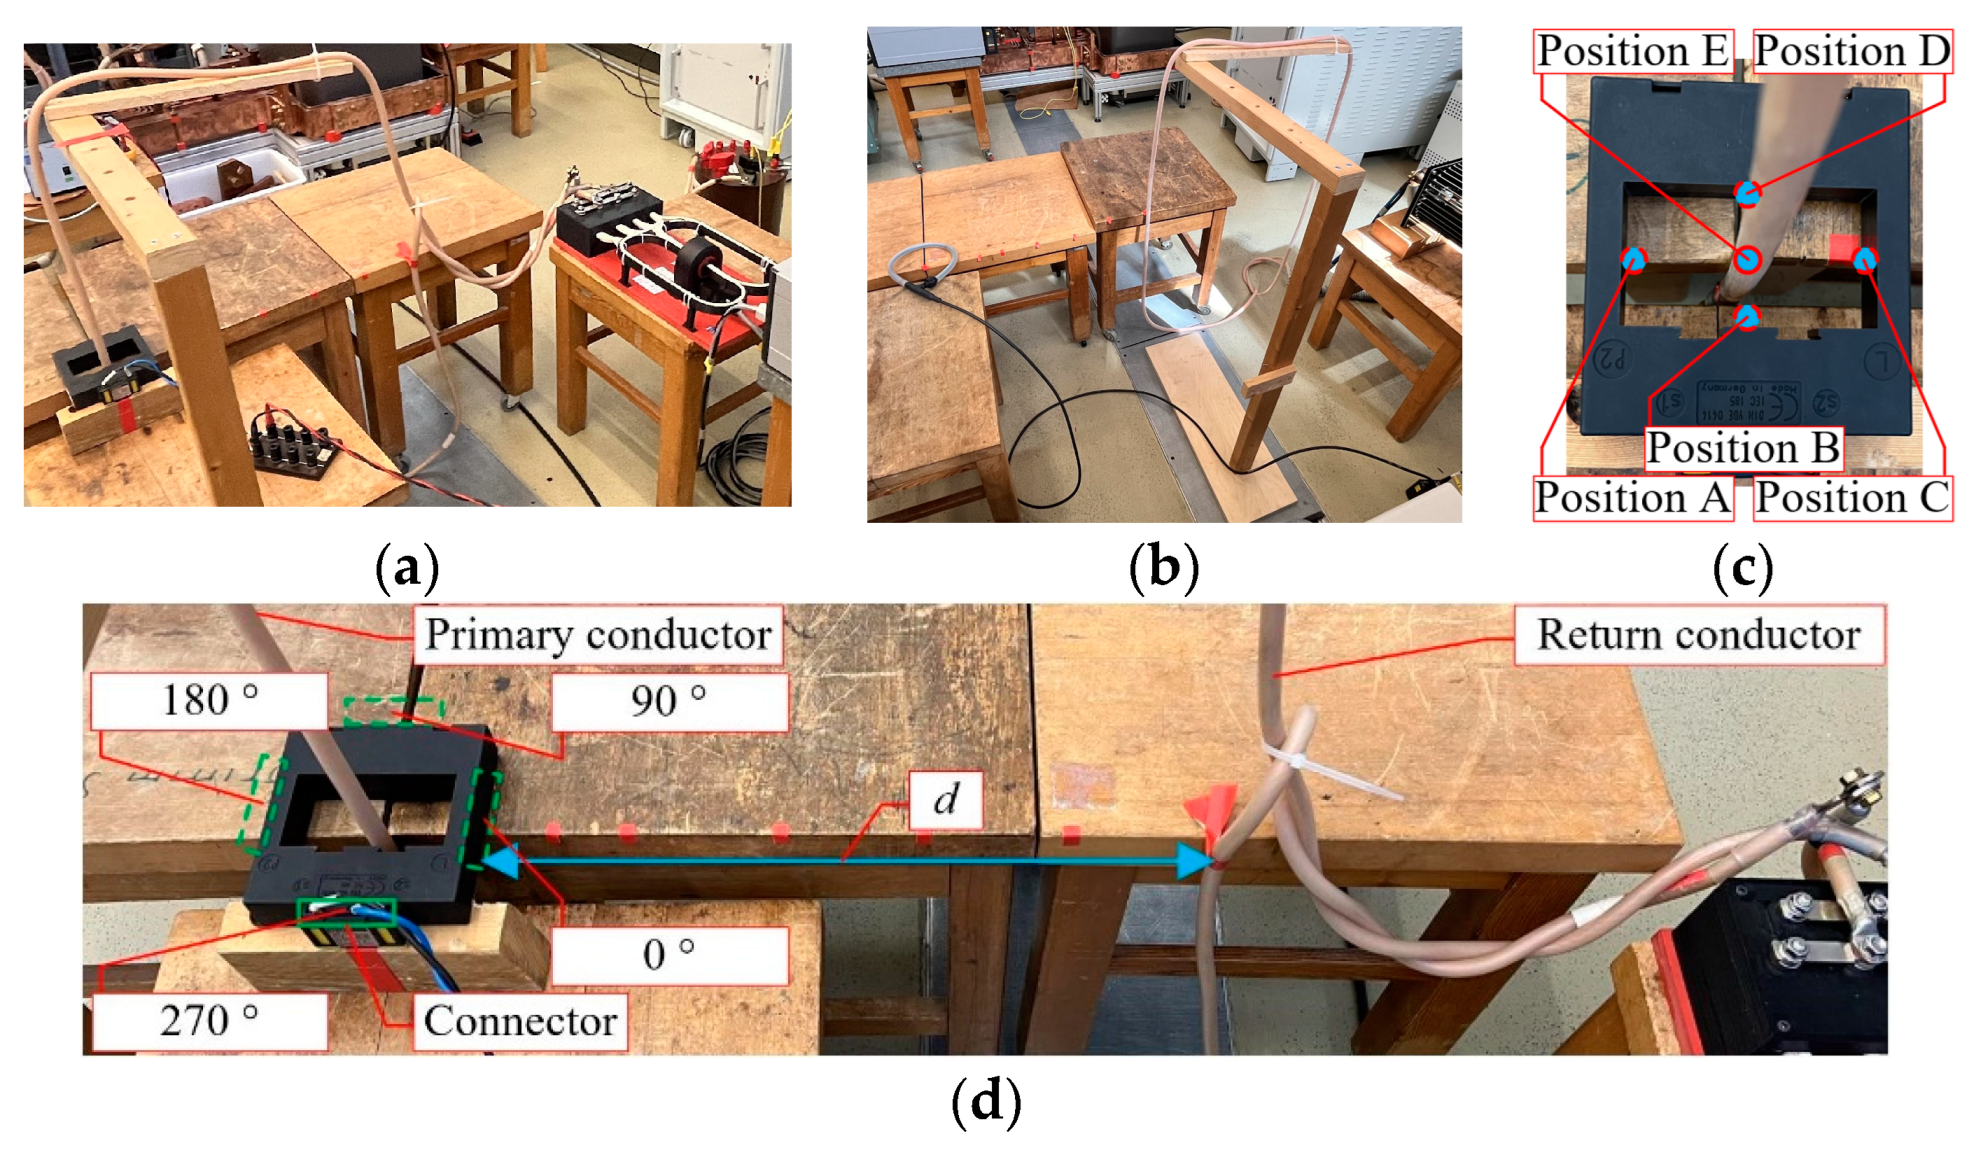
2.4. Effects of Adjacent Phase and Proximity on LPCTs and CTs
- Primary conductor centering;
- The position of the CT connector;
- The distance d between the primary conductor through the DUT and its return conductor;
- Test repeatability/random.
2.5. Adjacent Phases and Proximity Effect on LP Combined Sensors
2.5.1. Generation and Measurement Setup
2.5.2. Test Parameters and Procedures
3. Experimental Results: Effect of Single Influence Quantity
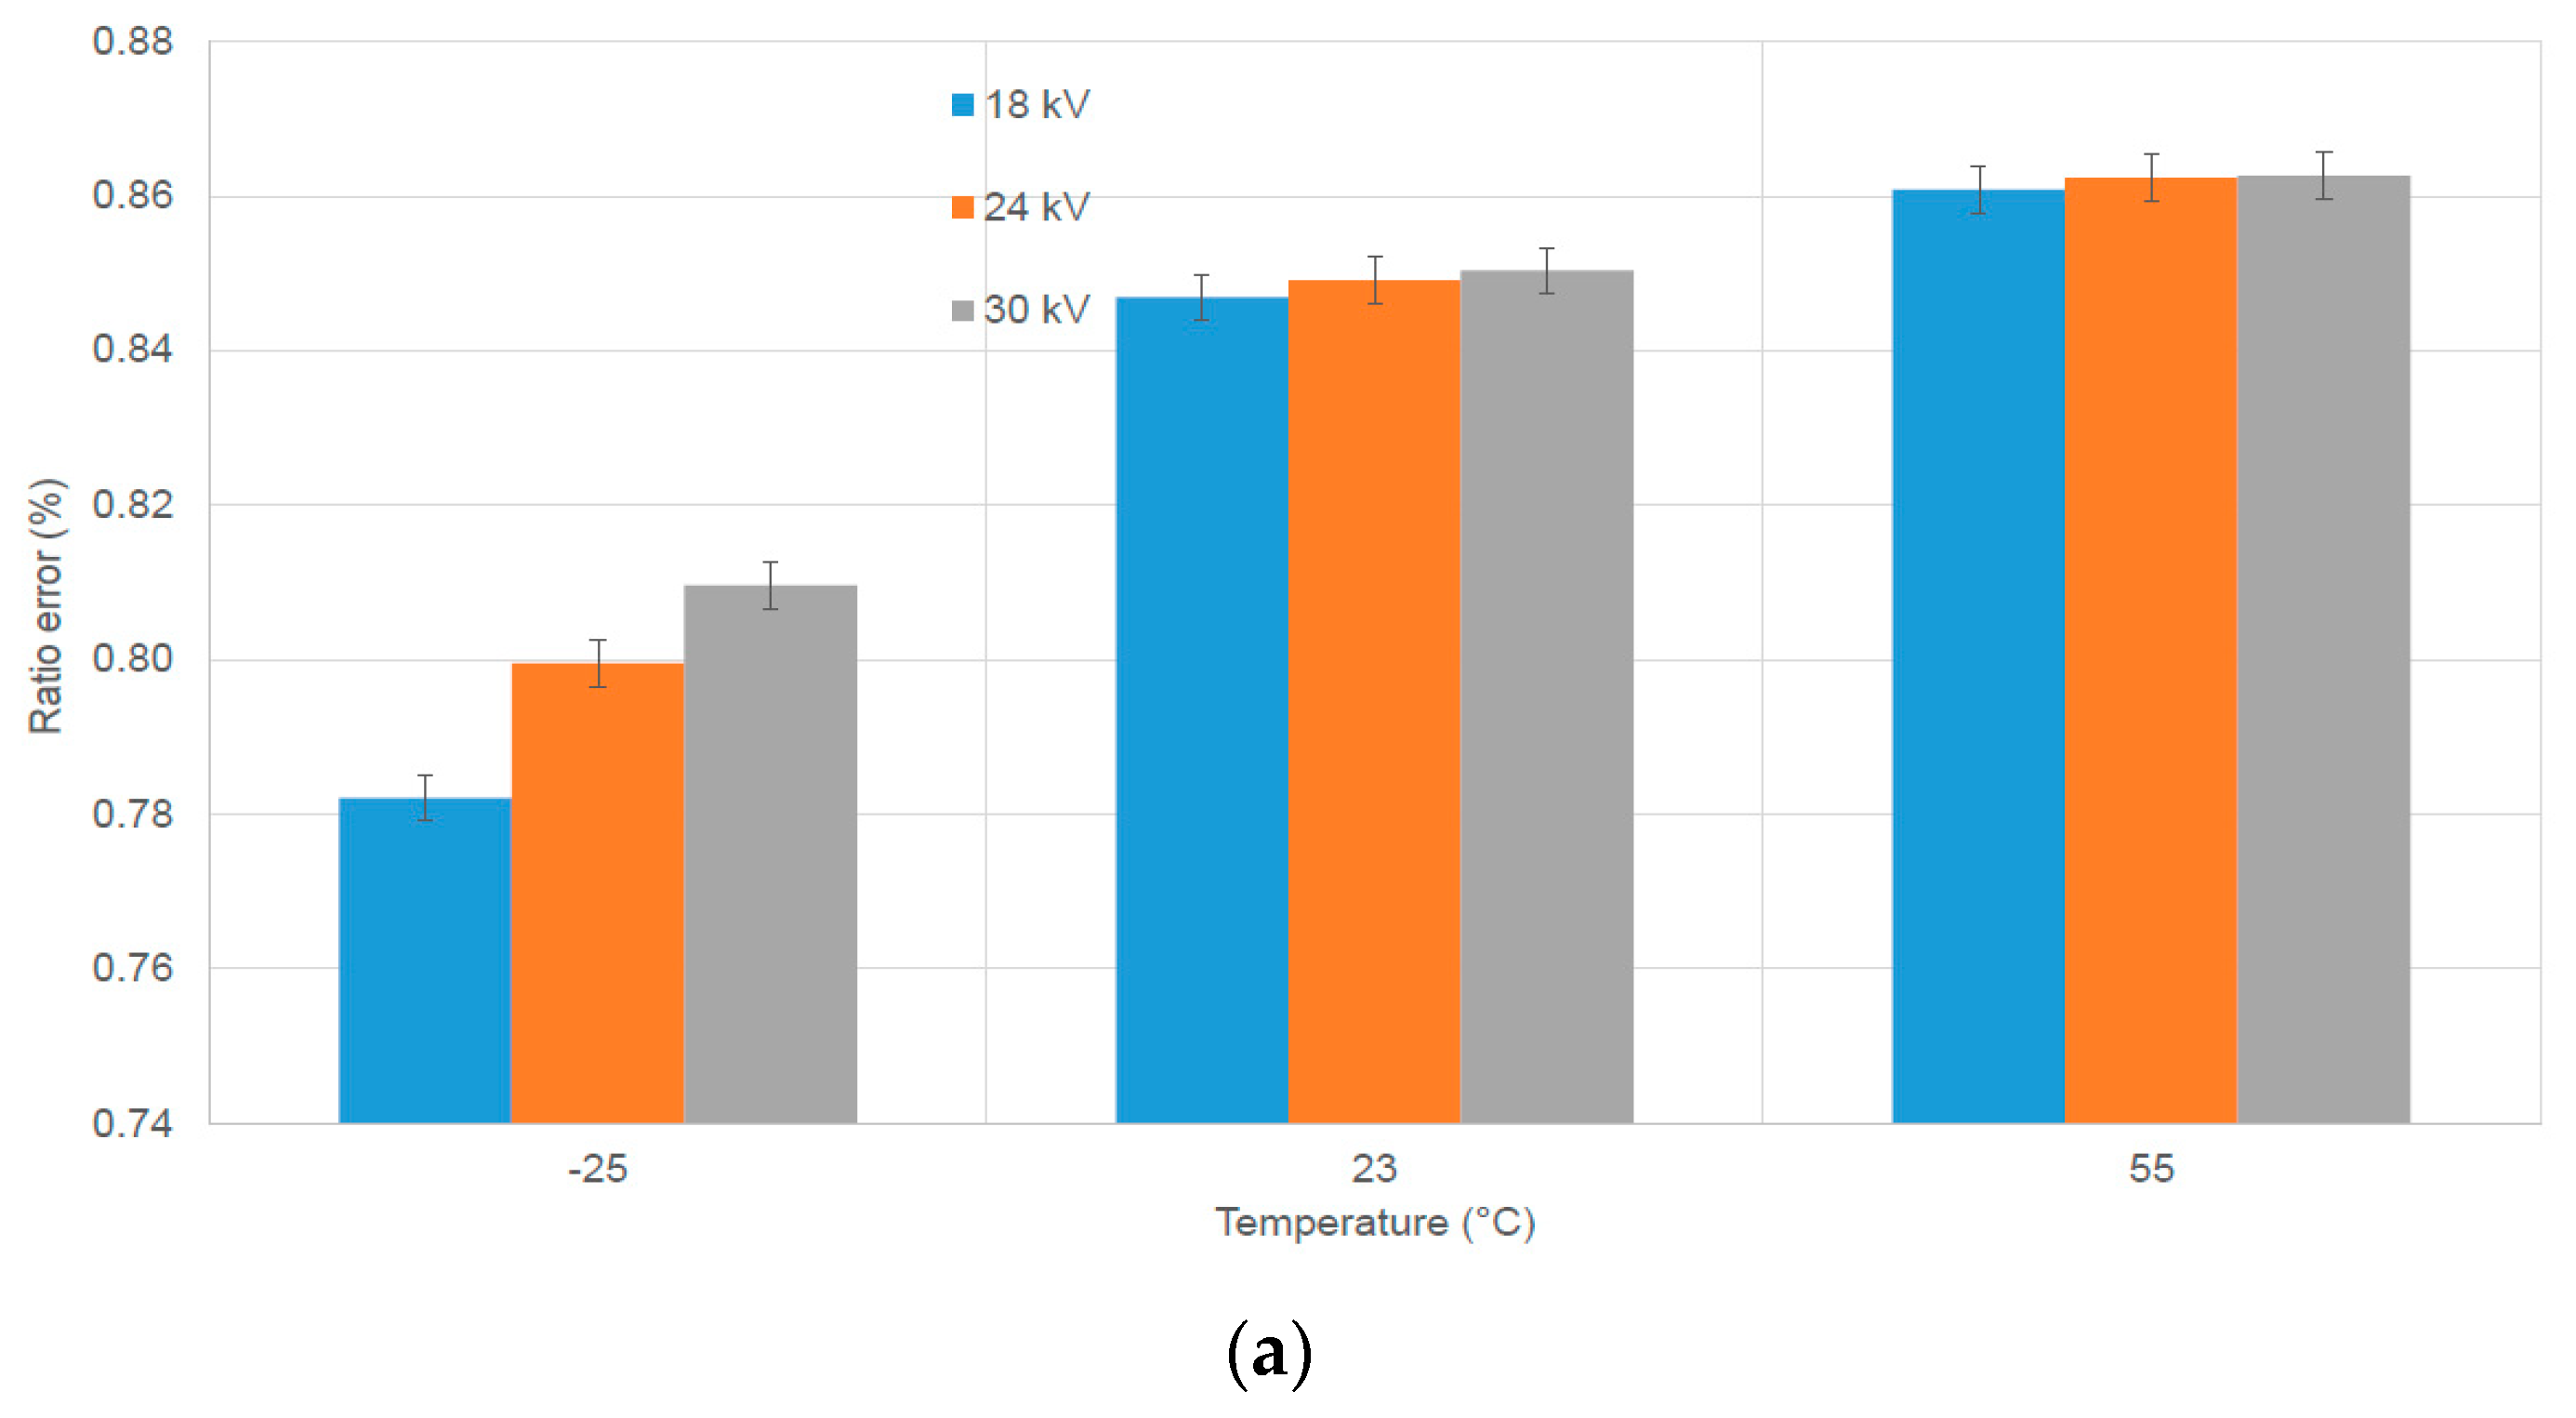
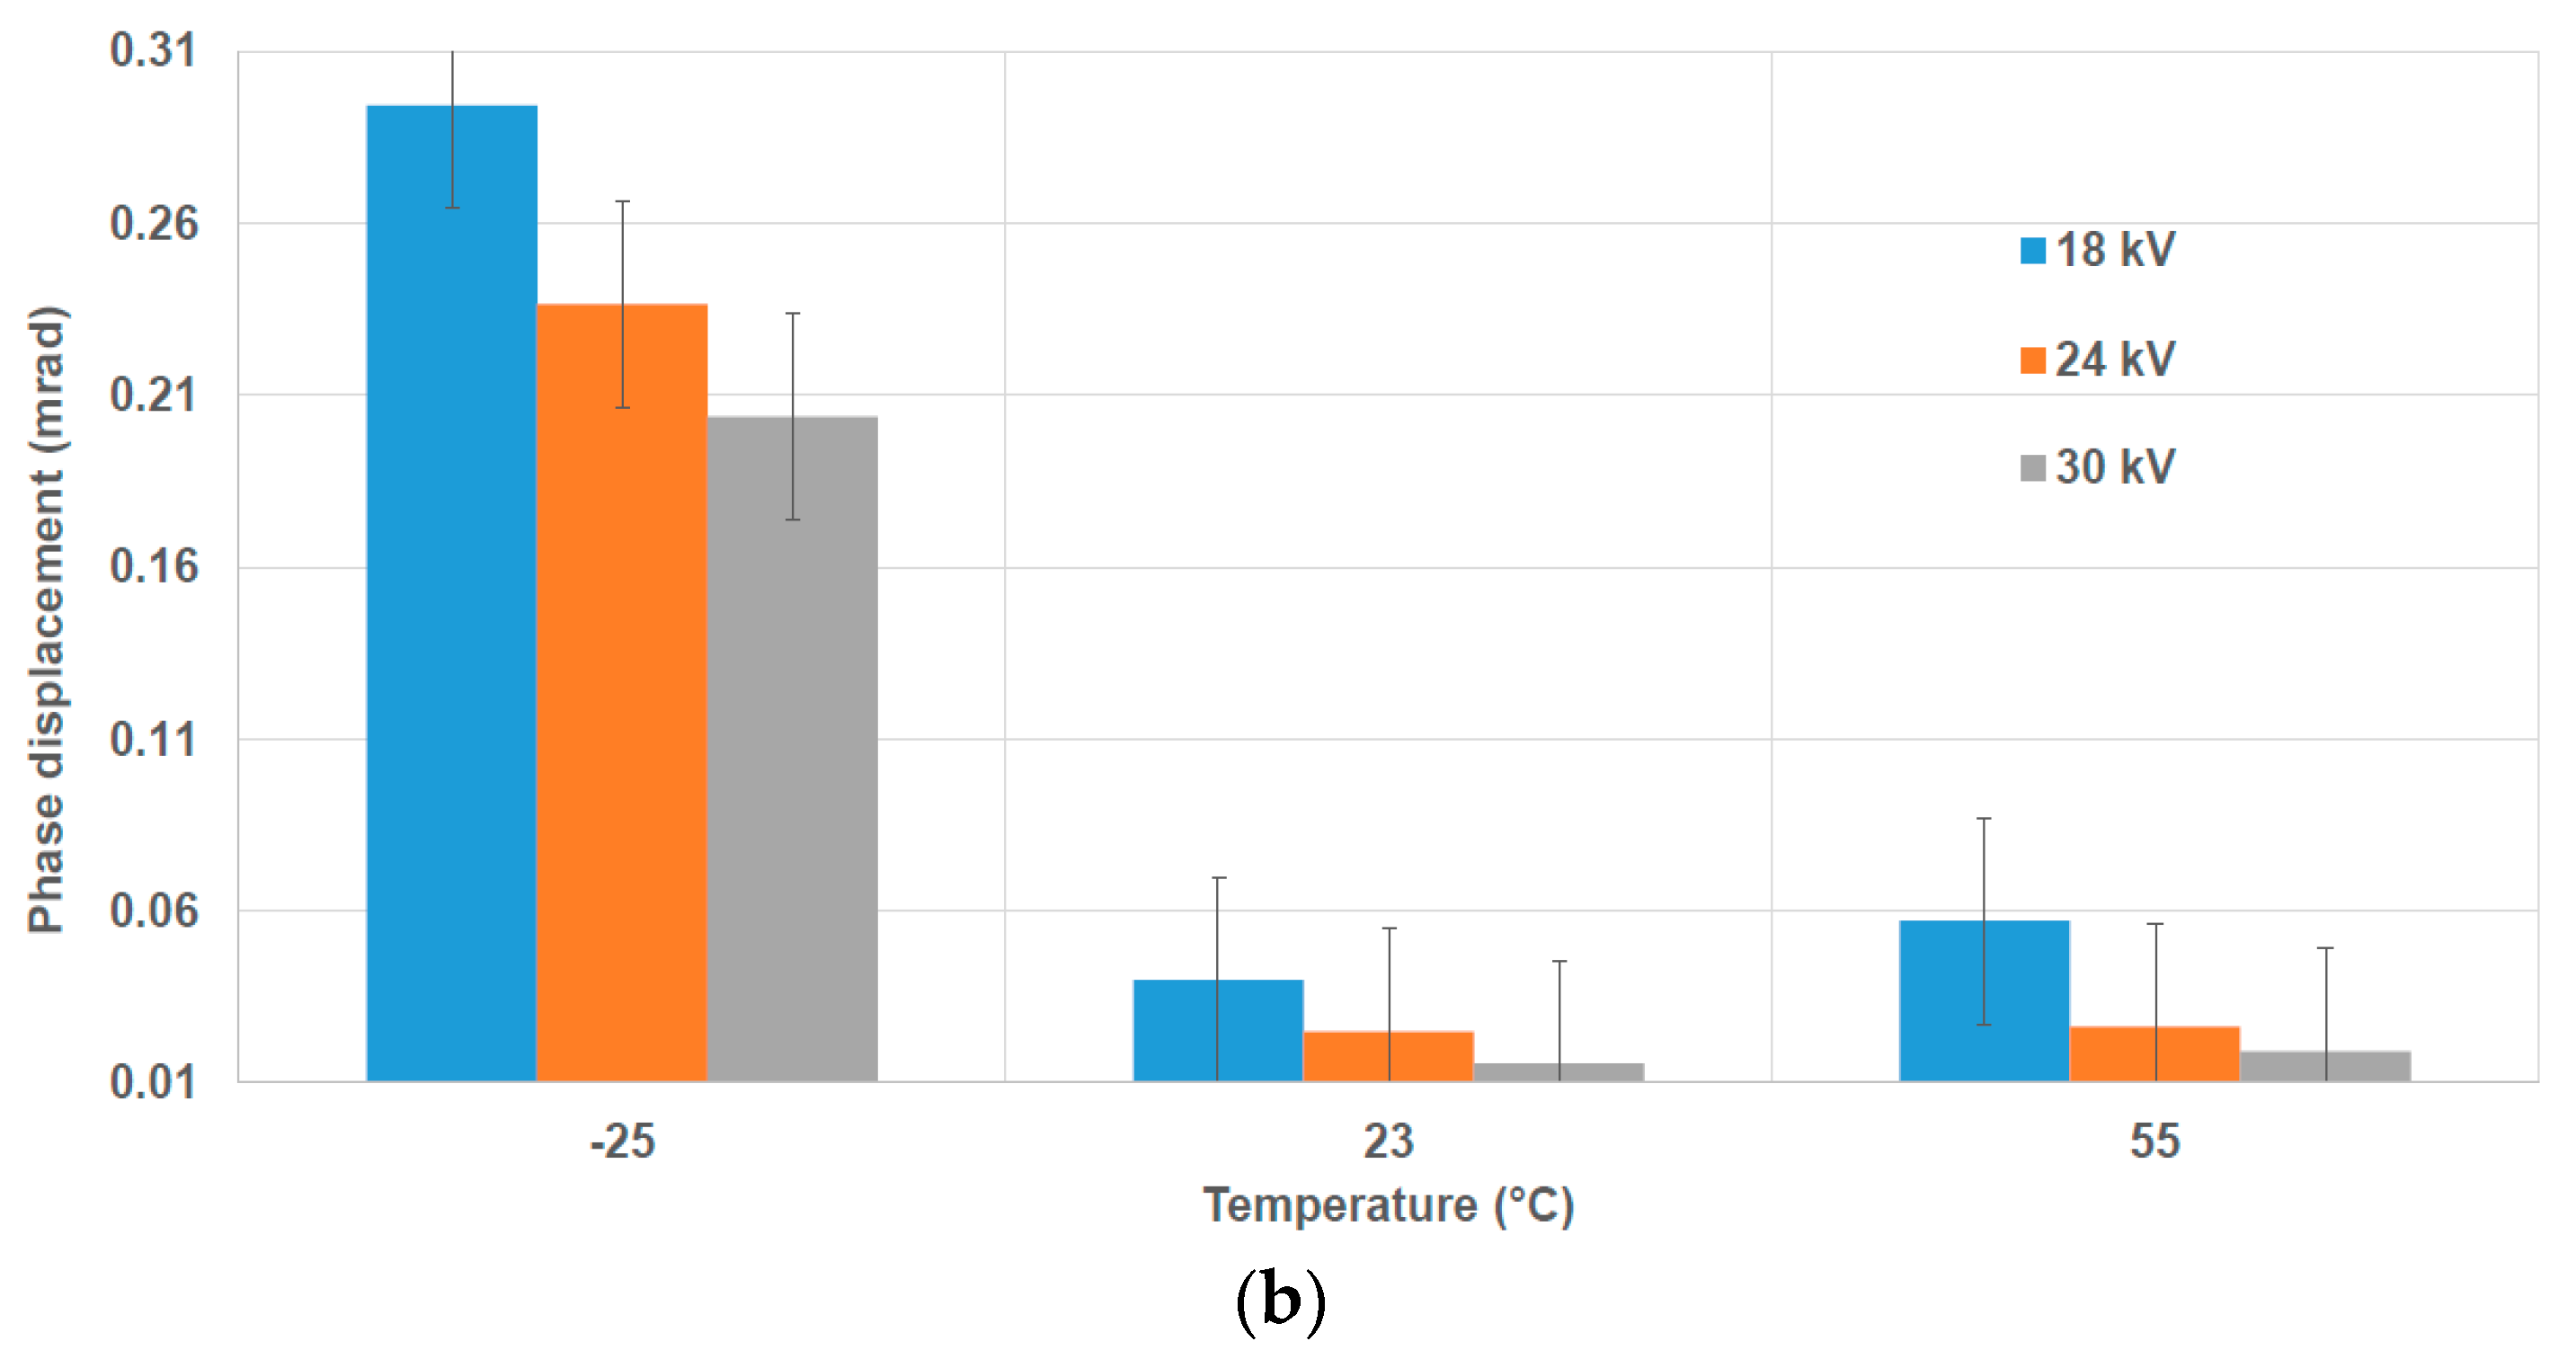
3.1. Temperature (VTs)
3.2. Vibration (VT)
3.3. Burden (VT)
3.4. Adjacent Phases
3.4.1. VT/LPVTs
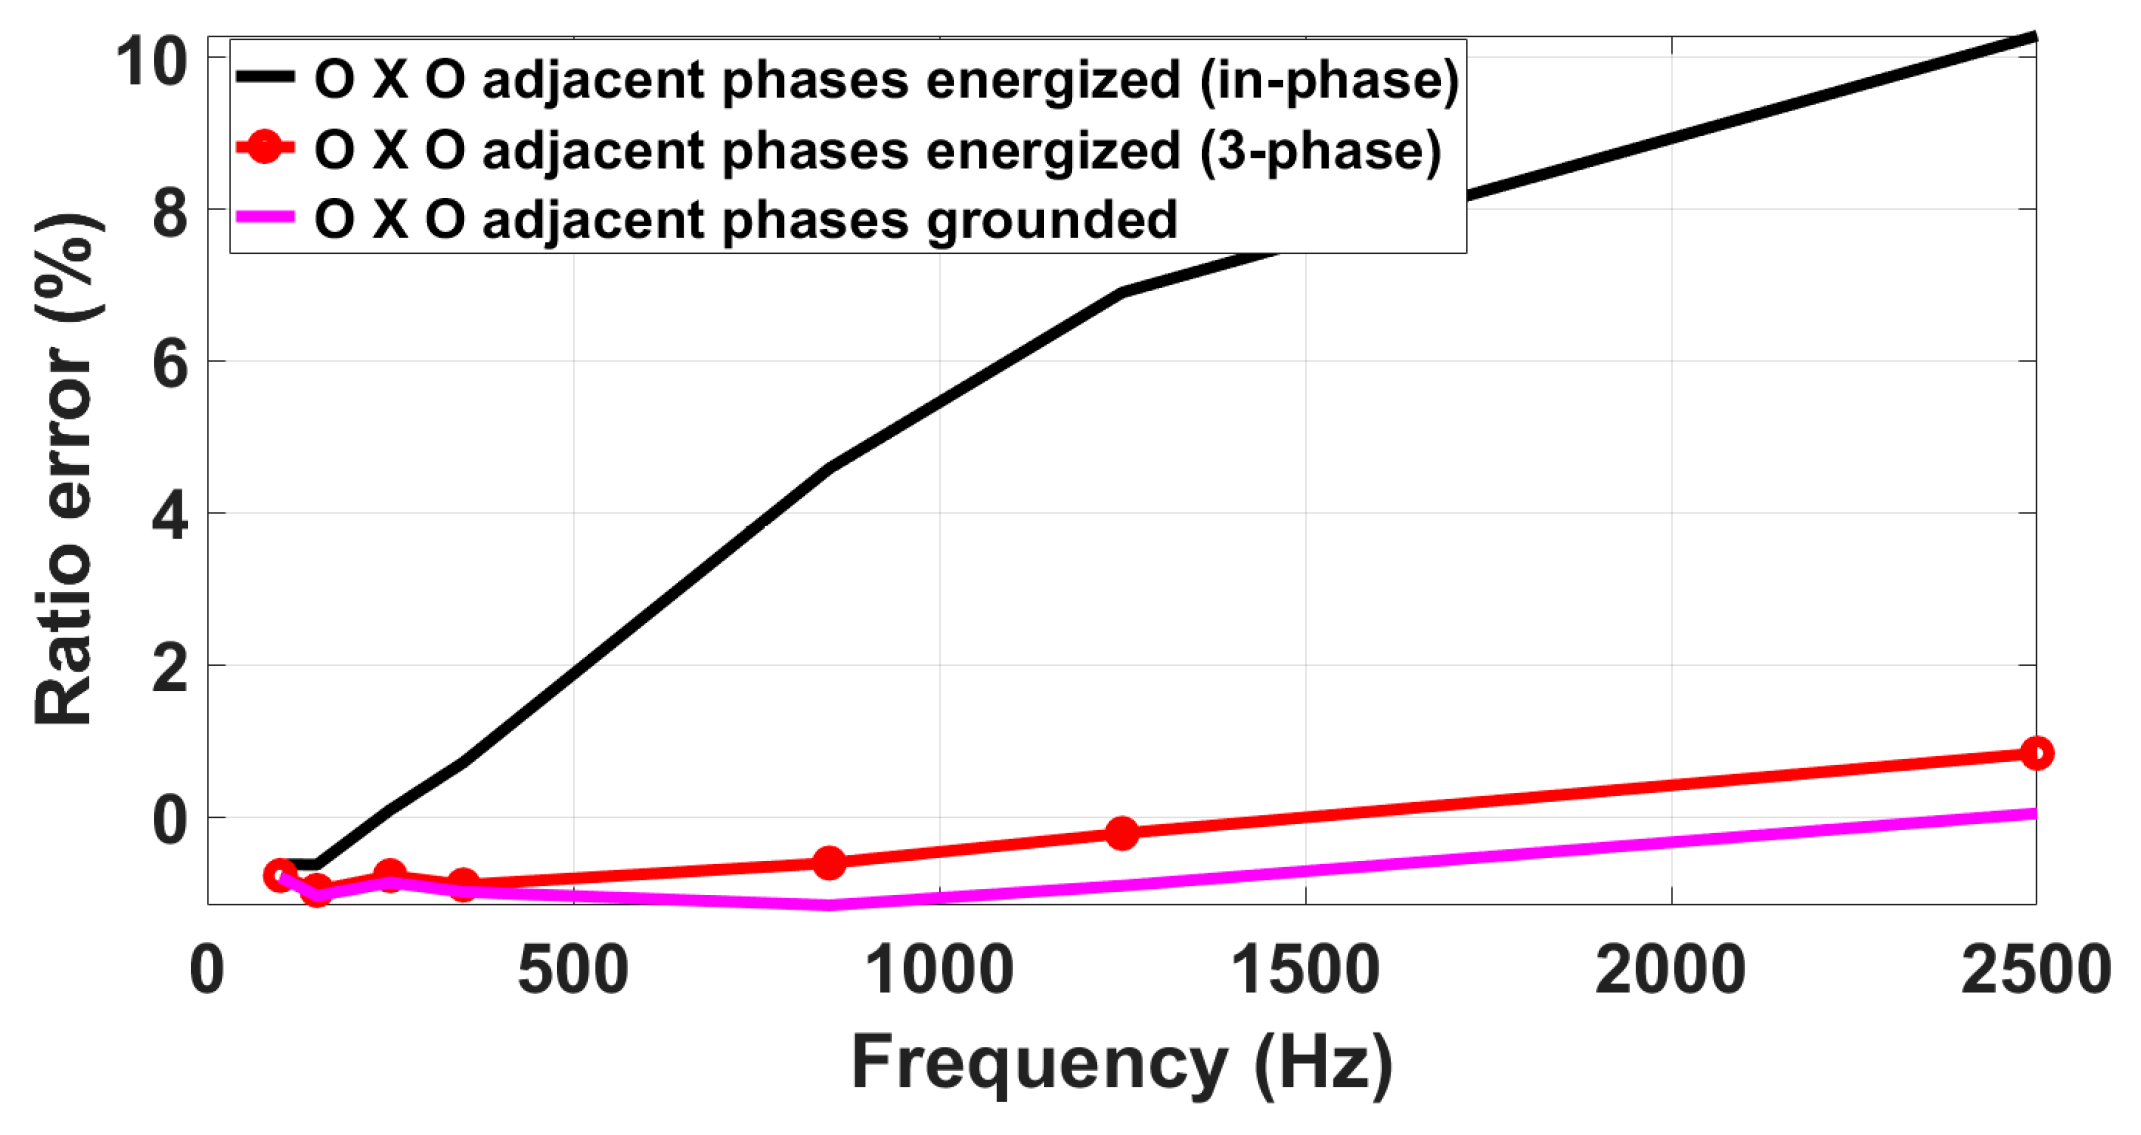
3.4.2. LP Combined Sensors (RCs)
3.5. Proximity
3.5.1. VT/LPVTs
3.5.2. LP Combined Sensors (RCs)
4. Experimental Results: Effect of Multiple Influence Quantities
4.1. Temperature and Vibration
4.2. Temperature and Burden
4.3. Adjacent Phases and Proximity
4.3.1. LPVTs and VTs
- R-LPVT
- C-LPVT
- RC-LPVT
- VT
4.3.2. LPCTs and CTs
4.3.3. LP Combined Sensors (RCs)
5. Discussion of the Experimental Results
5.1. Temperature and Vibration
5.2. Temperature and Burden
5.3. Adjacent Phases and Proximity
5.3.1. VTs and LPVTs
5.3.2. CTs and LPCTs
5.3.3. LP Combined CT Sensors
6. Conclusions
Author Contributions
Funding
Conflicts of Interest
Abbreviations
| Abbreviation/Acronym | Definition |
| AC | Alternate Current |
| ADC | Analogue-to-Digital Converter |
| AWG: | Arbitrary Waveform Generator |
| C-LPVT | Capacitive Low-Power Voltage Transformer |
| CT | Current Transformer |
| DAC | Digital-to-Analogue Converter |
| DAQ | Data Acquisition |
| DUT | Device Under Test |
| FH1 | Fundamental Tone Plus 1 Harmonic Tone Waveform |
| HV | High Voltage |
| IT | Instrument Transformer |
| ITPA | Inductive Transconductance Power Amplifier |
| IVPA | Inductive Voltage Power Amplifier |
| LP | Low Power |
| LPCT | Low-Power Current Transformer |
| LPVT | Low-Power Voltage Transformer |
| LV | Low Voltage |
| LVMS | Low-Voltage Measuring System |
| MV | Medium Voltage |
| NMI | National Metrology Institute |
| PI | Performance Index |
| PQ | Power Quality |
| PXI | PCI eXtension for Instrumentation |
| RC | Rogowski Coil |
| RCVD | Resistive–Capacitive Voltage Divider |
| R-LPVT | Resistive Low-Power Voltage Transformer |
| RC-LPVT | Resistive–Capacitive Low-Power Voltage Transformer |
| UUT | Unit Under Test |
| VT | Voltage Transformer |
References
- Available online: https://climate.ec.europa.eu/eu-action/climate-strategies-targets/2050-long-term-strategy_en (accessed on 6 September 2023).
- Şahin, M.E. Inductance Selection Criteria and Design Steps for Power Electronics Applications. Süleyman Demirel Üniv. Fen Bilim. Enstitüsü Derg. 2020, 24, 689–695. [Google Scholar] [CrossRef]
- Peretto, L. The role of measurements in the smart grid era. IEEE Instrum. Meas. Mag. 2010, 13, 22–25. [Google Scholar] [CrossRef]
- IEC 61869-103; Instrument Transformers—Part 103: The Use of Instrument Transformers for Power Quality Measurement. Technical Report; IEC: Geneva, Switzerland, 2012.
- IEC 61869-1:2023; Instrument Transformers—Part 1: General Requirements. International Standardization Organization: Geneva, Switzerland, 2023.
- IEC 61869-6; Part 6: Additional General Requirements for Low-Power Instrument Transformers. In Instrument Transformers. International Standardization Organization: Geneva, Switzerland, 2016.
- IEC 61869-2:2011; Instrument Transformers—Part 2: Additional Requirements for Current Transformers. International Standardization Organization: Geneva, Switzerland, 2011.
- IEC 61869-3:2011; Instrument Transformers—Part 3: Additional Requirements for Inductive Voltage Transformers. International Standardization Organization: Geneva, Switzerland, 2011.
- IEC 61869-4:2013; Instrument Transformers—Part 4: Additional Requirements for Combined Transformers. International Standardization Organization: Geneva, Switzerland, 2013.
- IEC 61869-10; Part 10: Additional Requirements for Low-Power Passive Current Transformers. In Instrument Transformers. International Standardization Organization: Geneva, Switzerland, 2018.
- IEC 61869-11:2018; Instrument Transformers—Part 11: Additional Requirements for Low-Power Passive Voltage Transformers. International Standardization Organization: Geneva, Switzerland, 2018.
- Kaczmarek, M.; Stano, E. Review of Measuring Methods, Setups and Conditions for Evaluation of the Inductive Instrument Transformers Accuracy for Transformation of Distorted Waveforms. Energies 2023, 16, 4360. [Google Scholar] [CrossRef]
- Castello, P.; Laurano, C.; Muscas, C.; Pegoraro, P.A.; Toscani, S.; Zanoni, M. Harmonic Synchrophasors Measurement Algorithms with Embedded Compensation of Voltage Transformer Frequency Response. IEEE Trans. Instrum. Meas. 2021, 70, 9001310. [Google Scholar] [CrossRef]
- Draxler, K.; Styblikova, R. Using instrument transformers in a wider frequency range. In Proceedings of the IEEE Instrumentation and Measurement Technology Conference, Hangzhou, China, 10–12 May 2011; pp. 1207–1210. [Google Scholar]
- Bimantoro, R.A.; Rahardjo, A.; Husnayain, F.; Aryani, D.R.; Hudayala, C. Calibration of 100 A/50mA instrument current transformer energy meter using bisection method. In Proceedings of the 2nd IEEE International Conference on Innovative Research and Development, the ICIRD 2019, Jakarta, Indonesia, 28–30 June 2019. [Google Scholar] [CrossRef]
- Chen, Y.; Dubowik, A.; Mohns, E. Reference system for current sensor calibrations at power frequency and for wideband frequencies. In Proceedings of the 2022 20th International Conference on Harmonics & Quality of Power (ICHQP), Naples, Italy, 29 May–1 June 2022; pp. 1–6. [Google Scholar] [CrossRef]
- Buchhagen, C.; Fischer, M.; Hofmann, L.; Däumling, H. Metrological determination of the frequency response of inductive voltage transformers up to 20 kHz. In Proceedings of the 2013 IEEE Power and Energy Society General Meeting, Vancouver, BC, Canada, 21–25 July 2013; pp. 1–5. [Google Scholar]
- Martin, K.; Ladislav, M.; David, M.; Karel, P.; Pavel, S.; Petr, K. Analysis of voltage quality parameters in MV distribution grid. In Proceedings of the 2014 16th International Conference on Harmonics and Quality of Power (ICHQP), Bucharest, Romania, 25–28 May 2014; Volume 2017, pp. 517–521. [Google Scholar]
- Faifer, M.; Laurano, C.; Ottoboni, R.; Toscani, S.; Zanoni, M. Harmonic Distortion Compensation in Voltage Transformers for Improved Power Quality Measurements. IEEE Trans. Instrum. Meas. 2019, 68, 3823–3830. [Google Scholar] [CrossRef]
- Pfajfar, T.; Meyer, J.; Schegner, P.; Papic, I. Influence of instrument transformers on harmonic distortion assessment. In Proceedings of the 2012 IEEE Power and Energy Society General Meeting, San Diego, CA, USA, 22–26 July 2012; pp. 1–6. [Google Scholar]
- Stano, E.; Kaczmarek, P.; Kaczmarek, M. Why Should We Test the Wideband Transformation Accuracy of Inductive Current Transformers? Energies 2022, 15, 5737. [Google Scholar] [CrossRef]
- Davis, P.; Wright, P.; King, J.; Jupe, S.; Pinkerton-Clark, S. Voltage Transformer Harmonic Characteristics For Distribution Power Quality Monitoring. In Proceedings of the CIRED 2021—The 26th International Conference and Exhibition on Electricity Distribution, Online, 20–23 September 2021; pp. 820–824. [Google Scholar] [CrossRef]
- Kaczmarek, M.; Stano, E. Proposal for extension of routine tests of the inductive current transformers to evaluation of transformation accuracy of higher harmonics. Int. J. Electr. Power Energy Syst. 2019, 113, 842–849. [Google Scholar] [CrossRef]
- Campos, O.D.L.; Zhu, H. Condition assessment of 653 instrument transformers with on-line PD testing. In Proceedings of the CMD 2016—International Conference on Condition Monitoring and Diagnosis, Xi’an, China, 25–28 September 2016; pp. 168–171. [Google Scholar] [CrossRef]
- Lu, B.; Chen, X.; Nie, G.; Ding, C. Simulation of current transformer insulation defect identification based on ultrasonic. In Proceedings of the 2023 8th Asia Conference on Power and Electrical Engineering, ACPEE, Tianjin, China, 14–16 April 2023; pp. 2217–2221. [Google Scholar] [CrossRef]
- Český, L.; Janíček, F.; Skudřík, F.; Zuščak, J. Design and testing of voltage instrument transformers for railway application. In Proceedings of the 10th International Scientific Symposium on Electrical Power Engineering, ELEKTROENERGETIKA 2019, Stara Lesna, Slovakia, 16–18 September 2019; pp. 315–318. [Google Scholar]
- Lesniewska, E. Modern methods of construction problem solving in designing various types of instrument transformers. Energies 2022, 15, 8199. [Google Scholar] [CrossRef]
- Huang, C.; Mei, J.; Bu, Q.; Su, L. FPGA-based adaptive phase-shift compensation method for electronic instrument transformers. Electr. Power Compon. Syst. 2017, 45, 774–784. [Google Scholar] [CrossRef]
- Mingotti, A.; Peretto, L.; Tinarelli, R. A simple modelling procedure of rogowski coil for power systems applications. In Proceedings of the 10th IEEE International Workshop on Applied Measurements for Power Systems (AMPS2019), Aachen, Germany, 25–27 September 2019. [Google Scholar] [CrossRef]
- Stiegler, R.; Meyer, J. Impact of external influences on the frequency dependent transfer ratio of resin cast MV voltage instrument transformers. In Proceedings of the 2022 20th International Conference on Harmonics & Quality of Power (ICHQP), Naples, Italy, 29 May–1 June 2022; pp. 1–6. [Google Scholar] [CrossRef]
- Agazar, M.; Istrate, D.; Pradayrol, P. Evaluation of the Accuracy and Frequency Response of Medium-Voltage Instrument Transformers under the Combined Influence Factors of Temperature and Vibration. Energies 2023, 16, 5012. [Google Scholar] [CrossRef]
- Liu, X.; Huang, H.; Dai, Y. Effect of Frequency on the Linearity of Double-Layer and Single-Layer Rogowski Coils. IEEE Sens. J. 2020, 20, 9910–9918. [Google Scholar] [CrossRef]
- Garnacho, F.; Khamlichi, A.; Rovira, J. The Design and Characterization of a Prototype Wideband Voltage Sensor Based on a Resistive Divider. Sensors 2017, 17, 2657. [Google Scholar] [CrossRef] [PubMed]
- Available online: https://www.it4pq.eu (accessed on 6 September 2023).
- Crotti, G.; Chen, Y.; Çayci, H.; D’Avanzo, G.; Landi, C.; Letizia, P.S.; Luiso, M.; Mohns, E.; Muñoz, F.; Styblikova, R.; et al. How Instrument Transformers Influence Power Quality Measurements: A Proposal of Accuracy Verification Tests. Sensors 2022, 22, 5847. [Google Scholar] [CrossRef] [PubMed]
- Crotti, G.; Giordano, D.; D’Avanzo, G.; Letizia, P.; Luiso, M. A New Industry-Oriented Technique for the Wideband Characterization of Voltage Transformers. Measurement 2021, 182, 109674. [Google Scholar] [CrossRef]
- Espel, P.; Poletaeff, A.; Bounouh, A. Characterization of analogue-to-digital converters of a commercial digital voltmeter in the 20 Hz to 400 Hz frequency range. Metrologia 2009, 46, 578–584. [Google Scholar] [CrossRef]
- Lapuh, R.; Kucera, J.; Kovac, J.; Voljc, B. Fluke 8588A and Keysight 3458A DMM Sampling Performance. arXiv 2022. [Google Scholar] [CrossRef]
- NF EN IEC 60721-3-3; Classification of Environmental Conditions—Part 3-3: Classification of Groups of Environmental Parameters and Their Severities—Stationary Use at Weather Protected Locations. IEC: Geneva, Switzerland, 2019.
- Crotti, G.; Meyer, J.; Letizia, P.S.; Agazar, M.; Istrate, D.; Chen, Y.; Mohns, E.; Van Den Brom, H.; Muñoz, F.; Cayci, H.; et al. Performance Evaluation of Instrument Transformers in Power Quality Measurements: Activities and Results from 19NRM05 IT4PQ Project. In Proceedings of the Cired 2023—The 27th International Conference and Exhibition on Electricity Distribution, Rome, Italy, 12–15 June 2023. [Google Scholar]


| Name and photo of the investigated VT | VT A | VT B | VT C | VT D | |
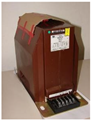 |  | 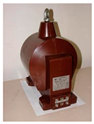 |  | ||
| Rated primary voltage | (kV) | 20/√3 | 20/√3 | 35/√3 | 10/√3 |
| Rated secondary voltage | (V) | 100/√3 | 100/√3 | 100/√3 | 100/√3 |
| Rated frequency | (Hz) | 50 | 50 | 50 | 50 |
| Rated burden | (VA) | 50 | 50 | 50 | 30 |
| Accuracy class | 0.5 | 0.5 | 0.5 | 0.5 | |
| Thermal time constant | (h) | 2.4 | 2.2 | 2.1 | 1.6 |
| Name of the DUT | Type | Primary Voltage (kV) | Rated Scale Factor (V/V) | Accuracy Class |
|---|---|---|---|---|
| R-LPVT | Resistive divider | 20/√3 | 6153.8 | 0.5 |
| C-LPVT | Capacitive divider | 20/√3 | 20/√3 | 0.5 |
| RC-LPVT | Resistive–capacitive divider | 45 | 10,000 | 0.2 |
| VT | Inductive VT | 20/√3 | 200 | 0.5 |
| (-) | (%) |
|---|---|
| 2 | 2 |
| 3 | 5 |
| 5 | 6 |
| 7 | 5 |
| 17 | 2 |
| 25 | 2 |
| 50 | 0.5 |
| 82 | 0.5 |
| 115 | 0.5 |
| 148 | 0.5 |
| 180 | 0.5 |
| Main Features of the DUT | Inductive CT | Rogowski Coil | |
|---|---|---|---|
| Name | CT I | CT II | CT III |
| Primary current | 400 A | 500 A | 1000 A |
| Output | 1 A | 1 A | 22.5 mV |
| Transformation ratio | 1:400 A/A | 1:500 A/A | - |
| Rated burden | 5 VA | 2.5 VA | 10 kΩ |
| Accuracy class | Cl. 0.2S | Cl. 0.5 | Cl. 0.5 |
| 1 | UUT-LP Combined Sensor (RC): Sensor UUT is tested as a standalone device by applying a multitone (FH1) test signal. |  |
| 2 | Adjacent Phases (in-phase supply): Sensor UUT is placed in the middle (B) between sensors A and C, which are energized with the same fundamental tone as Sensor UUT, but without harmonics. | 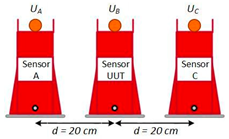 |
| 3 | Adjacent Phases (three-phase supply): Sensors A and C are energized with ±120° phase differences from UUT. | |
| 4 | Adjacent Phases (in-phase supply): Sensor UUT is replaced by Sensor C, while Sensors A and C are energized with the same phase as Sensor UUT | |
| 5 | Proximity (return cable alignment): The primary current conductor is aligned 90° downwards with a distance of 20 cm from the central axes. |  |
| 6 | Combined (adjacent phases and proximity): Arrangements 4 and 5 are placed together. (Figure is for demonstration only). Sensors are aligned as in previous arrangements. | 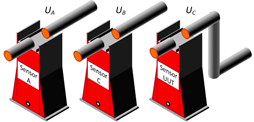 |
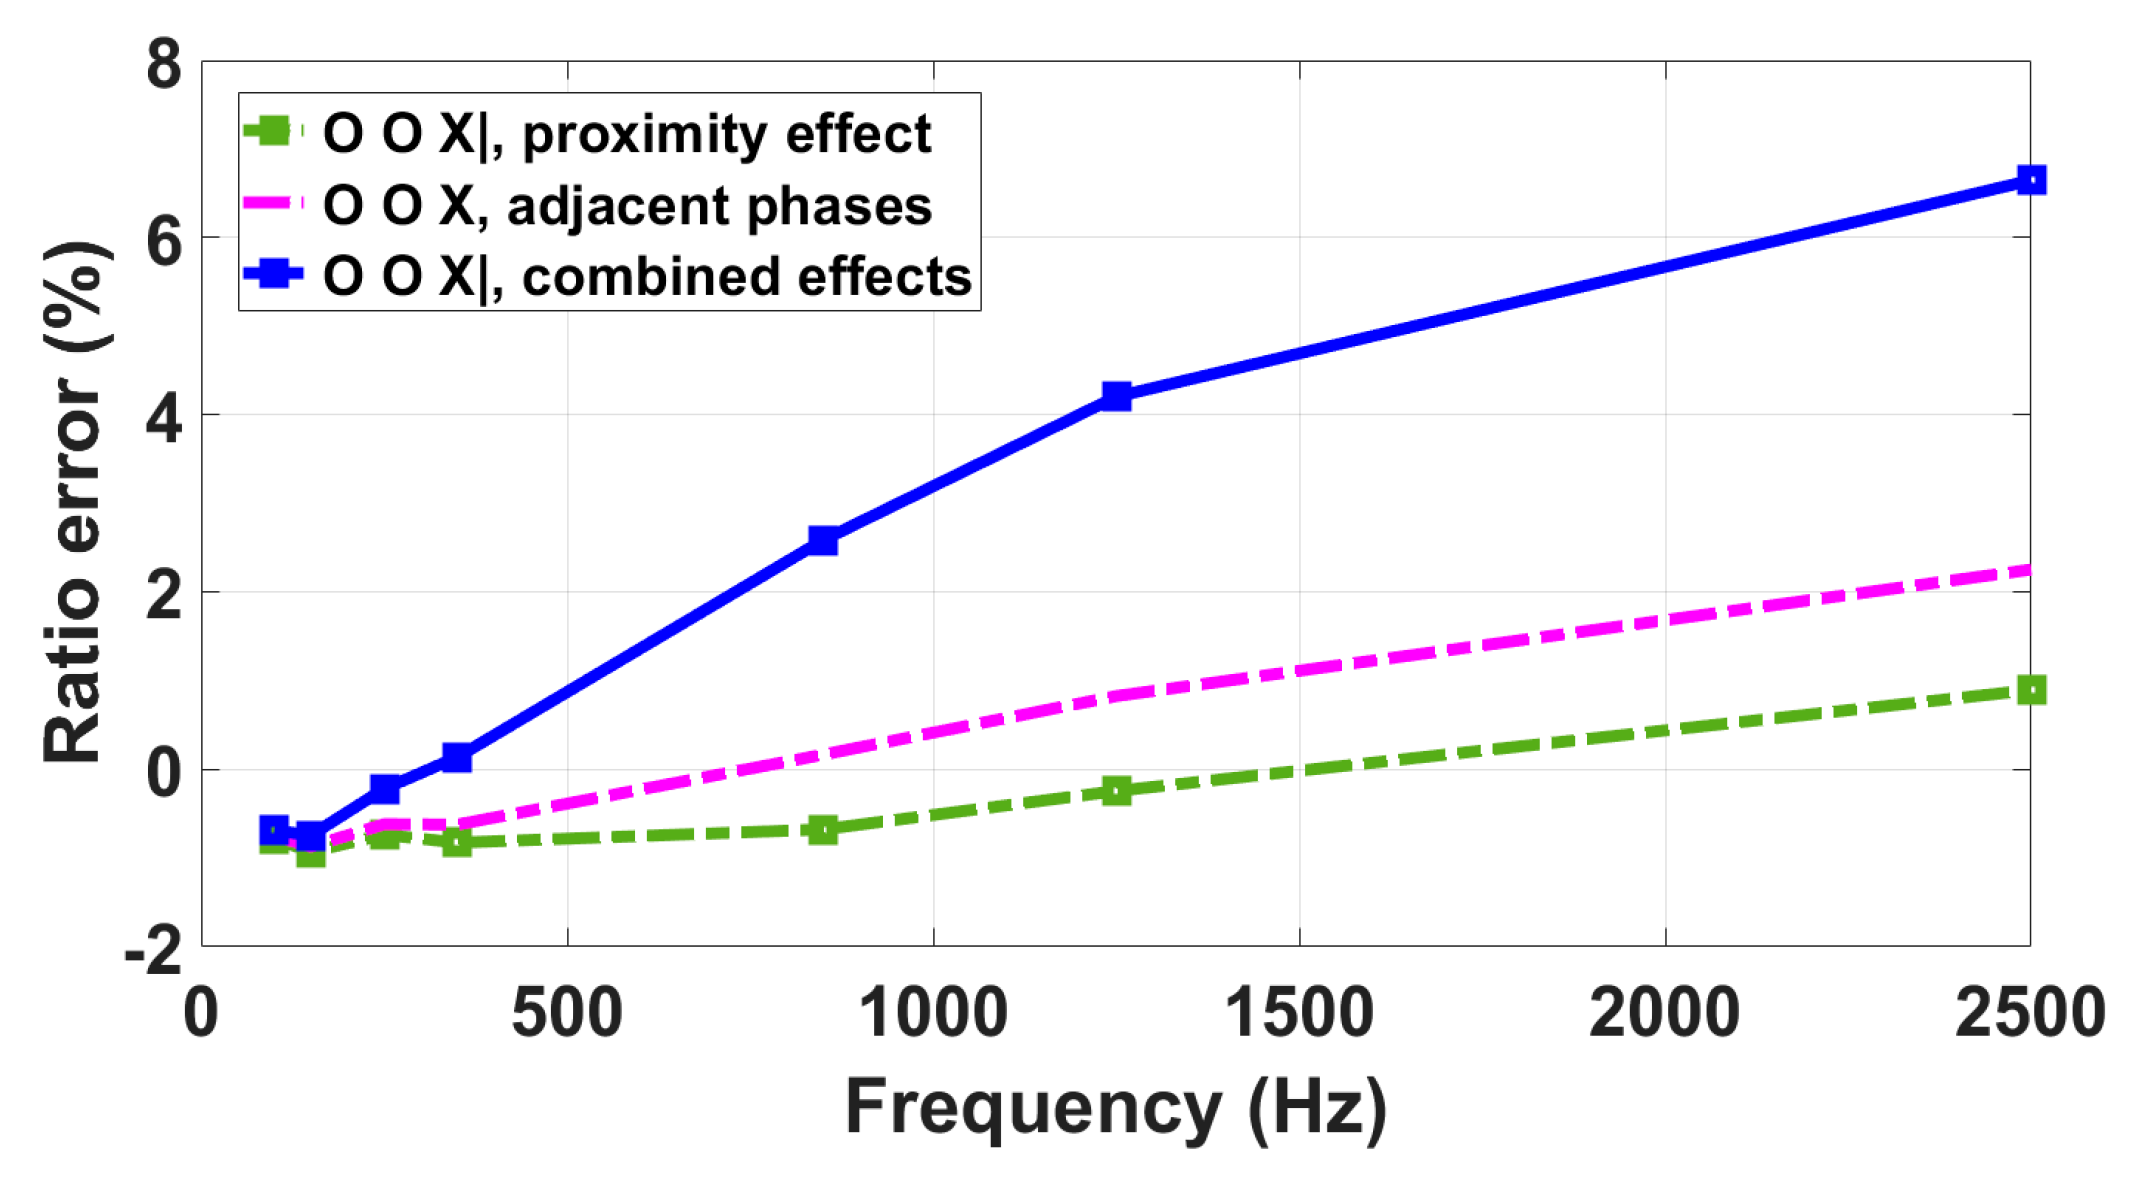
| Frequency (Hz) | εadjacent-phases (%) | εprox (%) | εcomb (%) |
|---|---|---|---|
| 150 | −0.87 | −0.93 | −0.74 |
| 850 | 0.16 | −0.68 | 2.58 |
| 1250 | 0.82 | −0.24 | 4.20 |
| 2500 | 2.25 | 0.90 | 6.65 |
| Frequency (Hz) | εadjacent-phases (%) | εprox (%) | εcomb (%) |
|---|---|---|---|
| 100 | 0.92 | 0.69 | 0.88 |
| 350 | 1.33 | 1.12 | 1.30 |
| 1250 | 1.02 | 0.82 | 1.00 |
| 9000 | −0.87 | −1.02 | −0.89 |
| Frequency (Hz) | εadjacent-phases (%) | εprox (%) | εadjacent-phases + εprox (%) | εcomb (%) | εcomb- (εadjacent-phases + εprox) |
|---|---|---|---|---|---|
| 50 | 1.08 | −0.17 | 0.91 | 0.84 | −0.07 |
| 350 | 3.66 | −1.96 | 1.70 | 2.60 | 0.90 |
| 9000 | 3.88 | −1.62 | 2.26 | 2.83 | 0.57 |
| Frequency (Hz) | εadjacent-phases (%) | εprox (%) | εcomb (%) |
|---|---|---|---|
| 150 | 0.31 | 0.32 | 0.31 |
| 850 | 0.13 | 0.15 | 0.15 |
| 1250 | −0.26 | −0.25 | −0.24 |
| 2500 | −2.49 | −2.45 | −2.44 |
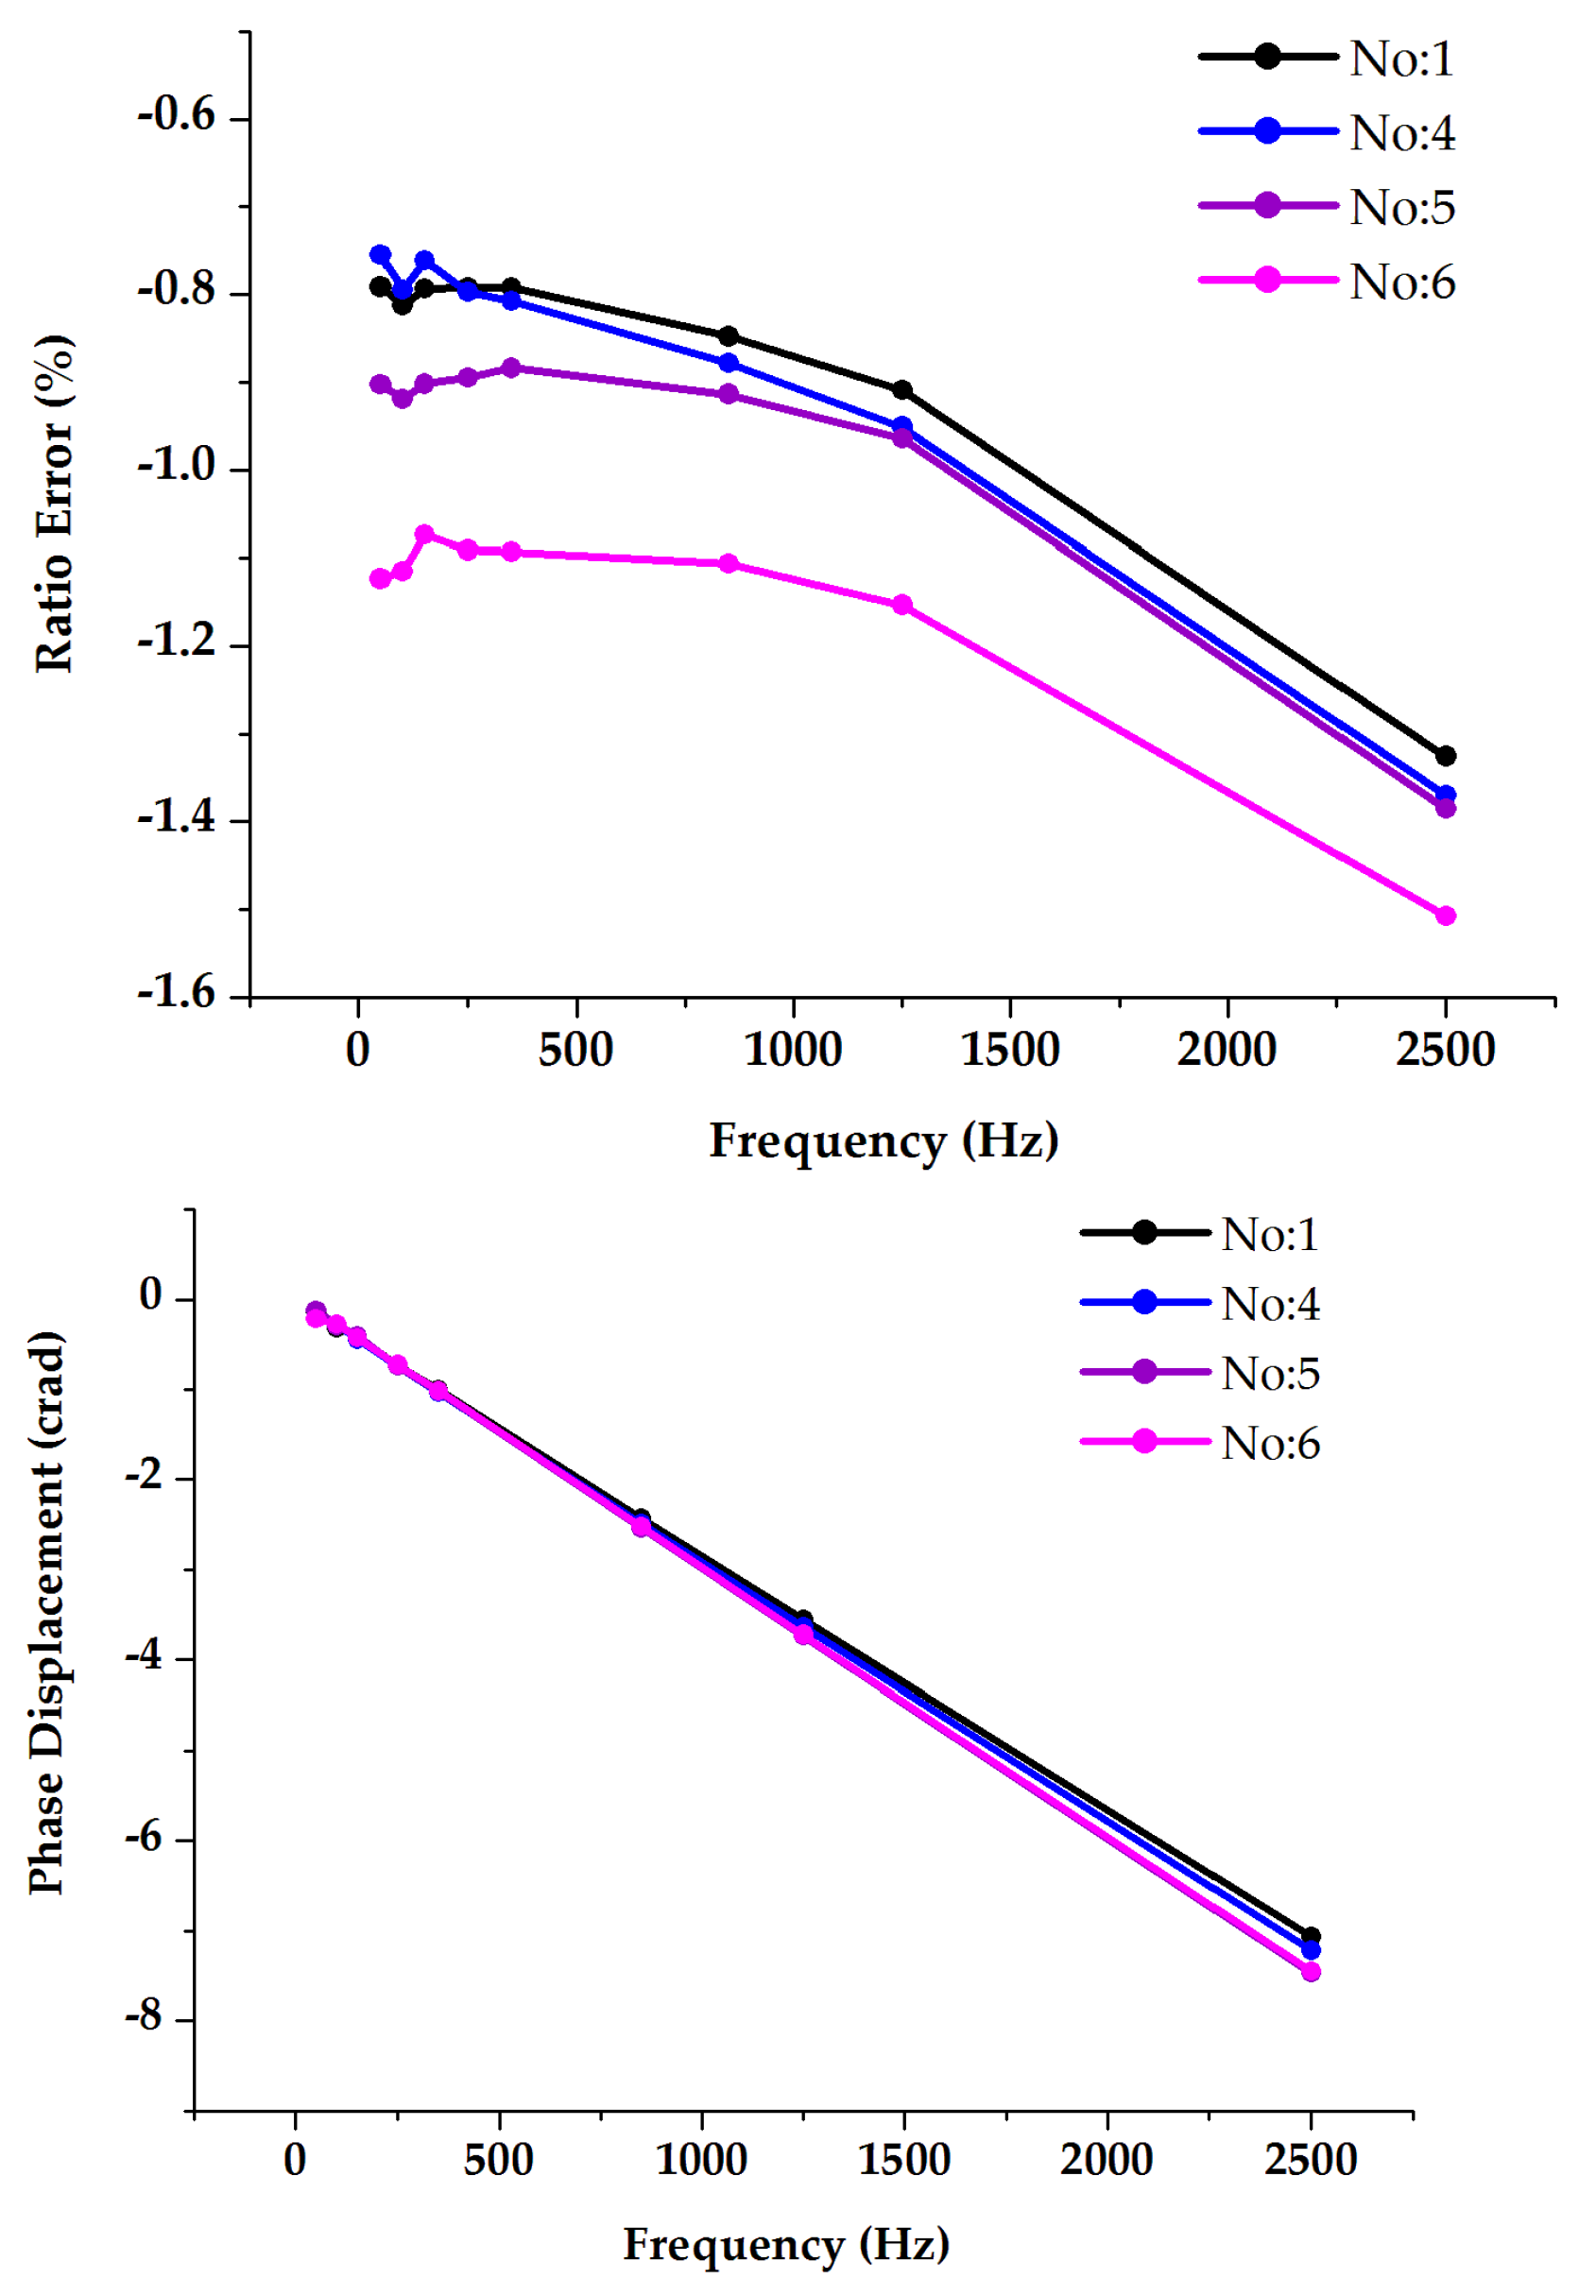
| Position | CT II | CT III | ||
|---|---|---|---|---|
| Δε (%) | Δφ (crad) | Δε (%) | Δφ (crad) | |
| (1) | 0.04 | 0.02 | 0.99 | 0.01 |
| (2) | 0.01 | 0 | 0.09 | 0 |
| (3) | 0.01 | 0 | 0.02 | 0 |
| (4) | 0.02 | 0.03 | 0.16 | 0 |
| CT I | CT II | CT III (Uout = 0.25 V) | CT III (Uout = 2.75 V) | |
|---|---|---|---|---|
| Δ|E| in ppm | Δ|E| in % | Δ|E| in % | Δ|E| in % | |
| (2) | 8 | 0.03 | 0.19 | 0.15 |
| (3) | 1 | 0.01 | 0.01 | 0.01 |
| |E|max in ppm | |E|max in % | |E|max in % | |E|max in % | |
| (4) | 2 | 0.009 | 0.019 | 0.016 |
| DUT | Temperature | Vibration | Combined |
|---|---|---|---|
| Inductive VT | High impact, most critical situation at lowest temperature (−25 °C) and frequencies close to the resonance | No impact | No impact of vibration |
| Burden | Combined | ||
| High impact | Burden impact decreases with rising temperature, most critical situation at −25 °C |
| DUT | Adjacent Phases | Proximity | Combined |
|---|---|---|---|
| R-LPVT | Medium impact | Medium impact | High impact, Combined error higher than the sum of single influence parameter errors |
| C-LPVT | Low impact | No impact | No impact of proximity |
| RC-LPVT | Medium impact | High impact | High impact. Possible to assume a direct sum of the two influence quantities (error associated with the sum of the effects < 1% up to 9 kHz) |
| Inductive VT | No impact | No impact | No impact |
| DUT | Adjacent Phases | Proximity | Combined |
|---|---|---|---|
| RC (alone and as part of combined sensor) | High impact (for power frequency errors only) | Medium impact | Higher impact, error higher than the sum of the single influence parameters |
| Inductive CT | Low impact | Low impact | Medium impact |
Disclaimer/Publisher’s Note: The statements, opinions and data contained in all publications are solely those of the individual author(s) and contributor(s) and not of MDPI and/or the editor(s). MDPI and/or the editor(s) disclaim responsibility for any injury to people or property resulting from any ideas, methods, instructions or products referred to in the content. |
© 2023 by the authors. Licensee MDPI, Basel, Switzerland. This article is an open access article distributed under the terms and conditions of the Creative Commons Attribution (CC BY) license (https://creativecommons.org/licenses/by/4.0/).
Share and Cite
Letizia, P.S.; Crotti, G.; Mingotti, A.; Tinarelli, R.; Chen, Y.; Mohns, E.; Agazar, M.; Istrate, D.; Ayhan, B.; Çayci, H.; et al. Characterization of Instrument Transformers under Realistic Conditions: Impact of Single and Combined Influence Quantities on Their Wideband Behavior. Sensors 2023, 23, 7833. https://doi.org/10.3390/s23187833
Letizia PS, Crotti G, Mingotti A, Tinarelli R, Chen Y, Mohns E, Agazar M, Istrate D, Ayhan B, Çayci H, et al. Characterization of Instrument Transformers under Realistic Conditions: Impact of Single and Combined Influence Quantities on Their Wideband Behavior. Sensors. 2023; 23(18):7833. https://doi.org/10.3390/s23187833
Chicago/Turabian StyleLetizia, Palma Sara, Gabriella Crotti, Alessandro Mingotti, Roberto Tinarelli, Yeying Chen, Enrico Mohns, Mohamed Agazar, Daniela Istrate, Burak Ayhan, Hüseyin Çayci, and et al. 2023. "Characterization of Instrument Transformers under Realistic Conditions: Impact of Single and Combined Influence Quantities on Their Wideband Behavior" Sensors 23, no. 18: 7833. https://doi.org/10.3390/s23187833