
Porous MgNiO2 Chrysanthemum Flower Nanostructure Electrode for Toxic Hg2+ Ion Monitoring in Aquatic Media

1
Advanced Materials and Devices Laboratory, Department of Bio-Convergence Science, Jeonbuk National University, Jeongeup Campus, Jeongeup 56212, Republic of Korea
2
Environmental Engineering Laboratory, Department of Bioactive Material Sciences, Jeonbuk National University, Jeonju 54896, Republic of Korea
*
Authors to whom correspondence should be addressed.
†
These authors contributed equally to this work.
Sensors 2023, 23(18), 7910; https://doi.org/10.3390/s23187910
Submission received: 19 July 2023
/
Revised: 28 August 2023
/
Accepted: 4 September 2023
/
Published: 15 September 2023
(This article belongs to the Special Issue Thin Film Materials and Nanostructure Devices for Sensing Applications)
Abstract
:A simple hydrothermal synthesis approach was used to synthesize porous MgNiO2 Chrysanthemum Flowers (CFs) nanostructures and applied as a sensing electrode for quick detection of hazardous mercury (Hg2+ ions). The morphological, structural, and electrochemical properties of MgNiO2 CFs were investigated. The morphological characteristic of MgNiO2 CFs, with a specific surface area of 45.618 m2/g, demonstrated strong electrochemical characteristics, including cations in different oxidation states of Ni3+/Ni2+. Using a three-electrode system for electrochemical detection, the MgNiO2 CFs based electrode revealed a good correlation coefficient (R2) of ~0.9721, a limit of detection (LOD) of ~11.7 μM, a quick response time (10 s), and a sensitivity of 8.22 μA∙μM−1∙cm−2 for Hg2+ ions over a broad linear range of 10–100 μM. Moreover, the selectivity for Hg2+ ions in tap water and drinking water was determined, and a promising stability of 25 days by MgNiO2 CFs electrode was exhibited. The obtained results indicate that the developed MgNiO2 CFs are a promising electrode for detecting hazardous Hg2+ ions in water and have the potential to be commercialized in the future.
1. Introduction
With the expansion of industry, environmental contamination has become a social concern as a result of mining for materials. Mine development seriously pollutes the aquatic environment along with soil. Additionally, industries such as chemical fertilizers, cosmetics, and gold and aluminum mining contribute significantly to heavy metal pollution in water [1]. Because heavy metal pollution is not biodegradable and may accumulate in the bodies of living beings, it is regarded as a major source of harmful environmental contamination. It causes several physical and mental health issues for humans and animals, including terrestrial and aquatic creatures [2]. Metallic elements are necessary for the human body in trace amounts, but their concentration range has a significant influence on human health. When the concentration range of a metal is below its toxic range, it is deemed safe, but when it exceeds the permissible limit, it causes a variety of cytological and physiological effects [3].
Hg2+ ions are the most dangerous and dominant toxicant in the environment, and ingestion of Hg2+ ions might damage reproductive organs, bones, brain function, kidneys, and liver, resulting in damaging the nervous system, hair, vision, and hearing loss [4,5]. Human chromosomes and genetic abnormalities are both caused by the intake of Hg2+ ions [6]. Hg2+ is a highly toxic heavy metal that might cause serious problems in aquatic environments. Mercury is a major source of environmental concern due to its stability at polluted sites and complex biological toxicity processes [7,8,9,10,11,12]. The accumulation of these metals in the body constitutes a serious hazard to human health, and therefore, the development of highly sensitive technologies for measuring trace levels of heavy metal ions has garnered considerable attention [13,14,15,16].
Many approaches for measuring heavy metals have been developed over the last few decades. Inductively coupled plasma mass spectrometry (ICP-MS), X-ray fluorescence spectroscopy (XRF), and atomic absorption spectrometry (AAS) are common techniques for assessing these metal ions [17]. However, the time-consuming method, hefty maintenance expenses, and pricey complex instruments severely limit their practical applicability. In modern society, the sensitive and selective identification of dangerous heavy metals using cost-effective and acceptable methodologies is critical [18]. Electrochemical detection techniques have recently garnered a lot of interest for heavy metal ion detection because of their capacity to detect ions with a fast analysis time, low power cost, and high sensitivity [17]. In an electrochemical approach, heavy metal ions generate changes in current, potential, electrochemical impedance, capacitance, or electrochemical luminescence that can be utilized to detect them [19].
Over the past few decades, nano-metal oxides have been widely explored in the field of electrochemical detection. Nano-metal oxides are synthesized to achieve varying sizes, stability, and morphologies. Because of these variances, these materials exhibit a wide range of electrical and photochemical characteristics, making them valuable for a wide range of applications [20]. Metal oxides, primarily transition metal oxides, have been utilized to alter electrodes for the detection of a variety of analytes [21], and just a few have been exploited for heavy metal detection [22]. Recently, secondary transition metal oxide or binary metal oxide-based materials have presented remarkable catalytic properties [23]. Apart from other metal oxides, blending MgO and NiO to form MgNiO2 materials has received immense attention because this combination significantly elevates the active sites for excellent catalytic reaction. In addition, various synthetic techniques can yield different catalytic impacts on electrochemical and photoelectrochemical systems. MgNiO2 is commonly produced using solid-state reactions or chemical approaches, such as co-precipitation, sol-gel, or hydrothermal synthesis [3]. In most reports, a solid state approach has been used to produce MgNiO2 materials in which high-purity magnesium oxide (MgO) and nickel oxide (NiO) powders are thoroughly mixed in the desired stoichiometric ratio at high temperature ranges from 800 °C to 1000 °C [24]. However, the hydrothermal technique involves utilizing a closed physical system and a chemical process that occurs in an aqueous solution at temperatures exceeding 100 °C to synthesize diverse chemical compounds and materials. Usually, hydrothermal synthesis offers an improved approach for obtaining small, porous, uniformly sized nanomaterials. Recently, there has been a surge in research focused on hydrothermal synthesis for secondary metal oxide materials, including MgFe2O4, MgNiO2, LiFePO4 etc. [25].
In this study, MgNiO2 CFs were synthesized using a simple hydrothermal approach and utilized for the three-electrode electrochemical system for the detection of toxic Hg2+ ions. Morphological, structural, optical, and electrochemical investigations are performed for as-synthesized MgNiO2 CFs, and the sensor performances in terms of sensitivity, stability, selectivity, repeatability, and detection limit for Hg2+ ions are thoroughly investigated. The sensing behavior of MgNiO2 CFs based electrode is examined by measuring the cyclicvoltametry (CV) and linear sweep voltammetry (LSV) in 0.1 M PBS (pH = 7) by varying the concentration of Hg2+ ions. MgNiO2 CFs based electrode shows a broad linear range of 1 μM–1 mM and a limit of detection (LOD) of ~373.9 nM with a good sensitivity of 9.008 μA∙μM−1∙cm−2 for Hg2+ ions.
2. Materials and Methods
2.1. Synthesis of MgNiO2 CFs
MgNiO2 was synthesized by a simple hydrothermal method. A total of 0.214 g of magnesium acetate tetrahydrate (CH3COO)2Mg∙4H2O, Sigma-Aldrich, St. Louis, MO, USA), 0.498 g of nickel(II) acetate (CH3COO)2Ni∙4H2O, Sigma-Aldrich, St. Louis, MO, USA) and 0.6 g of urea (CO(NH2)2, Sigma-Aldrich, Missouri, United States) were dissolved in 40 mL of deionized (DI) water [26]. After that, the solution was magnetically stirred at room temperature for 1 h. The mixed solution was subjected to Teflon-lined stainless steel for 10 h at 120 °C. After completion of the reaction, the product was washed with DI water and ethanol and centrifuged for 15 min at ~3000 rpm to obtain a white solid product. The product was then dried overnight at 60 °C in an oven and calcined at 650 °C for 6 h.
2.2. Characterization of MgNiO2 CFs
Field emission scanning electron microscopy (FESEM, Hitachi S-4700, Tokyo, Japan) and a transmission electron microscope (TEM, H-7650, Hitachi, Tokyo, Japan) were used to identify the morphological properties. Energy dispersive X-ray spectroscopy (EDS) was used to determine the elemental composition. To explain the crystal characteristics, X-ray diffraction (XRD, Rigaku, Woodlands, TA, USA, Cu K, = 1.54178 Å) in the Bragg angle range of 20° to 80° was used. A UV-visible spectrophotometer (JASCO, V-670) was used to measure the absorption characteristics. The structural characteristics were determined by Fourier transform infrared (FTIR, IR300, Nicolet, QC, Canada,) spectroscopy in the 400–4000 cm−1 region and Raman (Renishaw, Wotton-under-Edge, Old Town, UK) spectroscopy in the 200–1400 cm−1 ranges, respectively [26]. Surface characteristics of MgNiO2 CFs, such as specific surface area and pore size distribution, were investigated using the Brunauer-Emmett-Teller (BET) method with a Micromeritics Tristar 3000. The X-rays Photoelectron Spectroscopy (XPS; KRATOS AXIS-Nova, Manchester, UK) evaluated the surface composition and element states with a 0–1400 eV energy range.
2.3. Electrochemical Sensing of Hg2+ Ions Using MgNiO2 CFs Electrode
For the observation of Hg2+ ions in the solution medium, cyclic voltammetry (CV) and linear sweep voltammetry (LSV) were used. The electrolyte was prepared using 0.1 M phosphate buffered saline (PBS) at concentrations ranging from 1–100 μM Hg2+ ions. For electrode preparation, a cleaned 3 mm diameter screen printed electrode (SPE) was used, and a paste of 0.05 wt% of MgNiO2 powder with nafion solution was deposited on the SPE surface by the doctor blade method [27,28,29,30]. Thereafter, the nafion binder was subsequently removed by annealing SPE for 15 min at 80 °C in an oven. Three electrodes with SPE as working electrode, Ag/AgCl reference electrode, and a gold wire counter electrode were used to detect Hg2+ ions. For cyclic voltammetry (CV) measurements, the scan rate was fixed at 10 mV/s using different concentration of Hg2+ ions. The sensitivity of the electrochemical sensor is estimated by dividing the slope of the calibrated plot by the active area of the sensing electrode. The limit of detection (LOD) was calculated from the following equation:
where SD = standard deviation
LOD = 3.3 × SD/slope
3. Results
3.1. Morphological Properties and Element Analysis of MgNiO2 CFs
FESEM was employed to investigate the morphology of MgNiO2 nanostructures, as shown in Figure 1a–c. At low magnification, the synthesized MgNiO2 exhibited the morphology of Chrysanthemum Flowers (CFs) with an average diameter of ~6.34 μm, as shown in Figure 1a,b. Figure 1c exhibits the MgNiO2 CFs at high magnification with thin sheet aggregation and an average thickness of ~25 nm. The existence of several pores in the sheet was apparent, suggesting that the synthesized MgNiO2 CFs are porous and have a high specific surface area. Additionally, SEM-EDS was used to verify the purity of the synthesized MgNiO2 CFs. The EDS spectra of MgNiO2 CFs are shown in Figure 1d. Herein, no peaks other than Mg, Ni, and O were seen, suggesting that the synthesized MgNiO2 CFs are pristine. The traces of Pt peaks can be seen in an EDS image, which might be due to the surface coating of Pt during FESEM. Furthermore, the atomic percentages (at %) of Mg, Ni, and O were 17.9%, 19.2%, and 62.9%, respectively, with a comparatively high proportion of oxygen perhaps owing to oxygen or moisture in the air sticking to the MgNiO2 CFs. The FESEM results confirmed that the synthesized MgNiO2 was pure with a unique Chrysanthemum Flower structure.
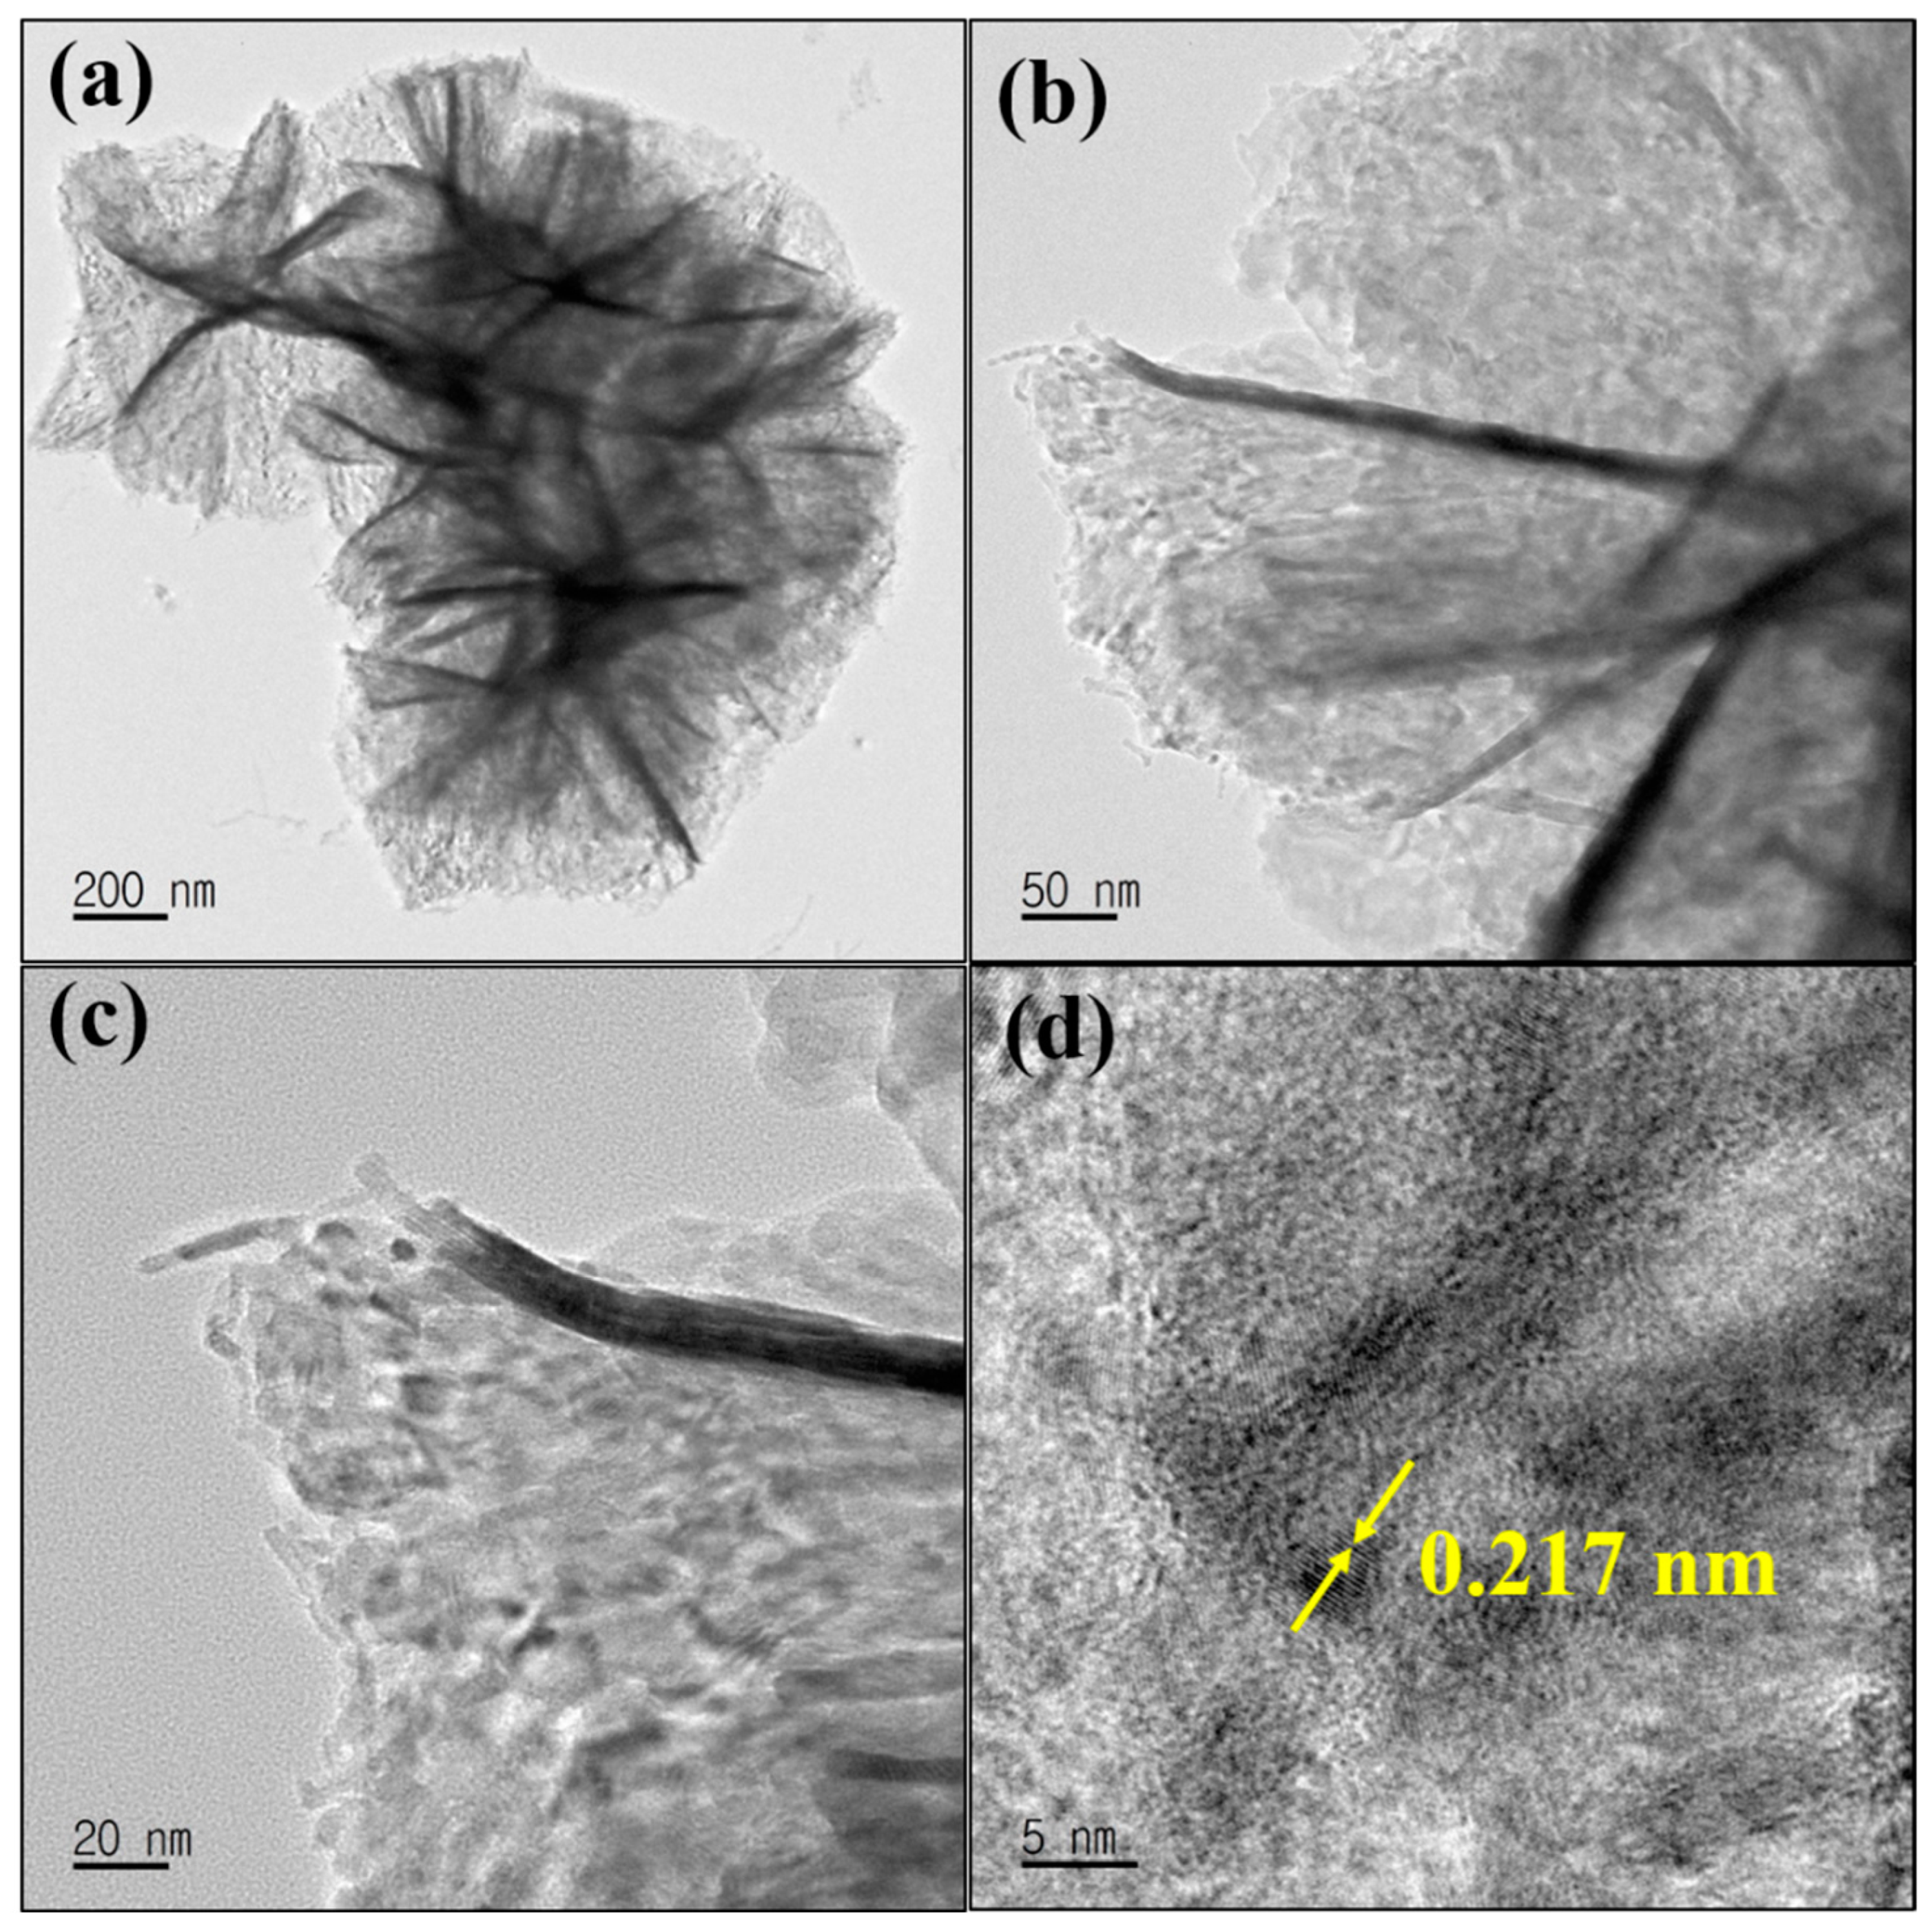
TEM and HRTEM were used to confirm the morphology of MgNiO2 CFs. The TEM image in Figure 2a corresponds with FESEM results, exhibiting the size of MgNiO2 CFs as ~5–7 μm. Figure 2b,c is a high magnification TEM image that reveals a clear lattice structure, showing that the synthesized MgNiO2 CFs have an excellent crystalline phase. The HRTEM image, as shown in Figure 2d, exhibited a lattice distance of ~0.217 nm, which corresponds to the (200) crystal plane [31,32].
3.2. Structural and Surface Properties of MgNiO2 CFs
The crystalline characteristics of MgNiO2 CFs were identified by X-ray diffraction (XRD), as shown in Figure 3a. The observed diffraction peaks at ~36.40° (111), ~42.40° (200), ~61.98° (220), ~74.58° (311), and 78.52° (222) correspond to typical MgNiO2 (JCPDS 24-0712). A prominent diffraction peak appeared at ~42.40°, indicating that MgNiO2 CFs had primarily grown in the (200) plane. The Scherrer equation [33] was used for calculating the size of the crystals of MgNiO2 CFs:
where τ is the crystal size, β is the full width at half maximum (FWHM), θ is the Bragg angle, k is the Scherrer constant (crystal shape = 0.94), and λ is the X-ray wavelength (Cu = 1.54178 Å). Herein, the strongest lattice plane of ~42.4° (200) is chosen, and an FWHM (β) value of 0.3983° and a crystal size (τ) of ~22.35 nm is obtained. This is similar to the thickness of a single sheet, as shown in FESEM, indicating that the MgNiO2 sheets are agglomerated into a single layer crystal structure. In addition, MgNiO2 CFs showed no additional peaks, confirming the purity of the synthesized nanostructures. FTIR analysis was employed to characterize the structural properties of the MgNiO2 CFs, as depicted in Figure 3b. The O–H stretching vibration of water molecules was adsorbed on the surface causes the appearance of a common wide peak at ~3413 cm−1. The Mg–O vibration coupling frequency was involved in the existence of a peak at ~571 cm−1, whereas the Ni–O vibration coupling frequency was confirmed by the peak at ~407 cm−1. The observed peaks in MgNiO2 CFs matched well with the reported values in the published literature [34,35]. Furthermore, quite weak bands were observed at ~2359 cm−1 and ~1476 cm−1, corresponding to atmospheric CO2 adsorption [36]. The Raman spectroscopy observations of MgNiO2 CFs are presented in Figure 3c. The peak at ~496 cm−1 was attributed to a single phonon (1P) TO mode, and the peak at ~1076 cm−1 was assumed to be the result of LO modes. The existence of NiO was the primary cause for the observed Raman peaks [37]. According to the Raman spectra, the synthesized MgNiO2 CFs showed high phase purity.
Figure 4 exhibits the adsorption/desorption of N2 gas via Brunauer-Emmett-Teller (BET) analysis of MgNiO2 CFs. As shown in Figure 4a, the overall specific surface area of MgNiO2 CFs was ~45.618 m2/g, with voids providing the total specific surface area at ~41.041 m2/g. Herein, because of the high porosity of MgNiO2 CFs, the specific surface area increased significantly. Figure 4b shows the average diameter of the pores as ~61.871 nm. The results showed a match with the morphological properties of FESEM results, implying that the increased surface area of MgNiO2 CFs might enhance the active sites for the detection of target heavy metals, resulting in enhanced sensitivity.
X-ray photoelectron (XPS) analysis was utilized to determine the surface binding energies of MgNiO2 CFs. Figure 5a shows the survey profile, which exhibits distinct peaks of O 1s, Ni 2p, and Mg 1s, indicating the existence of Ni, Mg, and O in MgNiO2 CFs. Figure 5b depicts a high-resolution O 1s spectra with peaks at ~528.17 eV, ~529.90 eV, and ~530.98 eV resulting from oxygen bonding with Ni2+, Mg2+, and Ni3+ ions, respectively [38,39]. It suggests that the MgNiO2 CFs bonding is composed of three ions: Ni2+, Mg2+, and Ni3+. In Figure 5c, the high-resolution spectrum of Ni 2p depicts the peaks at ~853.14 eV and 855.19 eV, which might be due to Ni 2p3/2 of Ni2+ and Ni3+, while the peaks at ~870.72 eV and ~872.19 eV are due to Ni 2p1/2 of Ni2+ and Ni3+. The MgNiO2 CFs were assumed to be in the Ni3+ and Ni2+ states [40]. The peaks at ~859.59 eV and ~861.13 eV were Ni 2p3/2 satellites, whereas the peaks at ~877.27 eV, ~878.75 eV, and ~880.47 eV were Ni 2p1/2 satellites. Furthermore, the difference between the Ni 2p3/2 and Ni 2p1/2 double peaks was ~17.58 eV, indicating the existence of various oxidized Ni3+ and Ni2+ ions [41,42]. Figure 5d shows the high-resolution Mg 1s spectra, which has binding energies of ~1302.12 eV for Mg and ~1303.24 eV for Mg–O [23]. Thus, the existence of Ni3+, Ni2+, and Mg2+ ions was explained by the XPS spectra of MgNiO2 CFs.
3.3. Optical Properties of MgNiO2 CFs
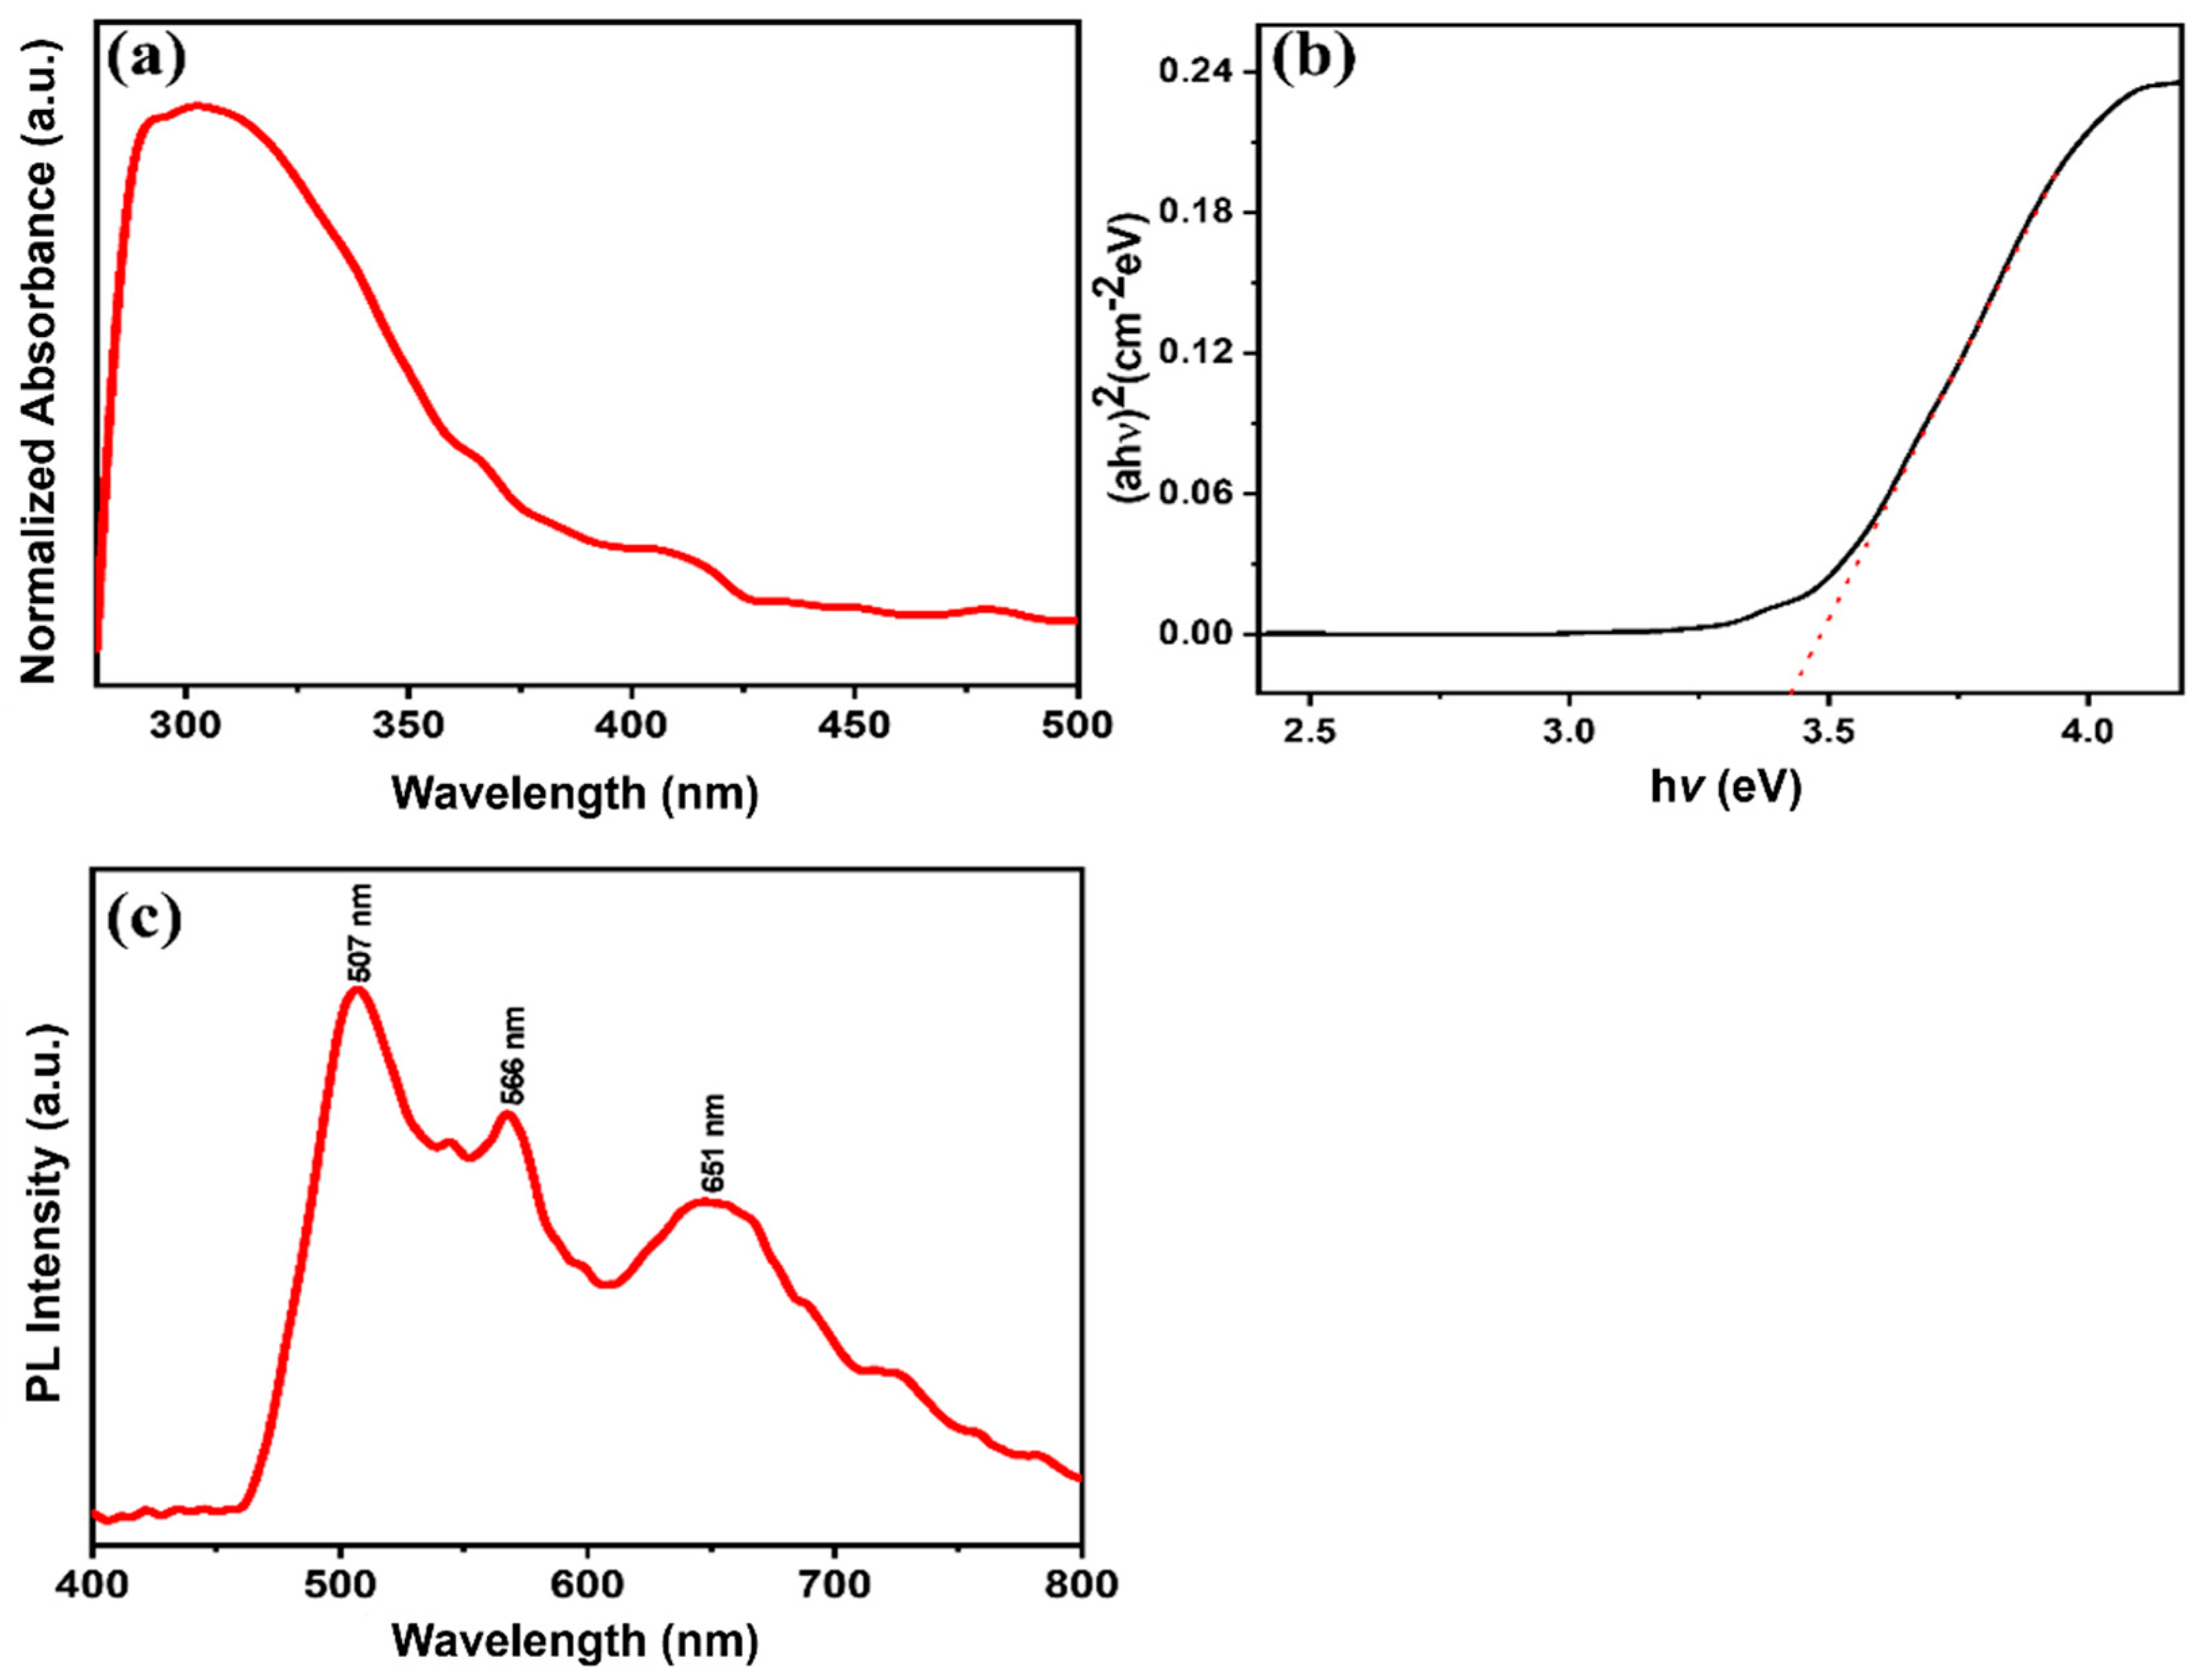
UV-vis in the range of 300–800 nm was applied to investigate the optical characteristics of the MgNiO2 CFs. The absorption peak of MgNiO2 CFs at ~303 nm is shown in Figure 6a. The optical band gap of MgNiO2 CFs was calculated using the Tau Equation (2) based on the UV-vis graph [43].
where α is the absorption coefficient, hν is photon energy, A is absorbance, Eg is optical band gap, and n is a number (n = 2) describing the transition process. The optical band gap of ~3.41 eV was determined by (αhν)2 versus hν energy, as shown in Figure 6b. This value was lower than the optical bandgap of conventional NiO (~3.6 eV), implying that MgNiO2 CFs can be excited more easily than typical NiO [44]. The photoluminescence emission spectra of MgNiO2 CFs were measured in the 400–800 nm region at room temperature. Three emission peaks appear at ~507 nm, ~566 nm, and ~651 nm. Herein, the peaks at ~507 nm and ~566 nm were related to NiO, and the PL peaks were upshifted by a smaller particle size and appeared as a double peak at ~20 nm [45]. These findings matched well to the crystal size determined by XRD (~25 nm). MgO is shown by the peak at ~651 nm [46]. Herein, the photoluminescence peak was caused by an electronic shift involving 3d8 electrons of Ni2+ ions [47]. Direct recombination between electrons in the conduction band and holes in the valence band induced the PL spectrum to consist of strong and wide peaks [48].
(αhν)n = A (hν − Eg)
3.4. Sensing Performance, Selectivity, and Real Sample Performance of MgNiO2 CFs
The electrochemical characteristics of the MgNiO2 CFs modified electrode towards the detection of Hg2+ ions were investigated using cyclicvoltammetry (CV). A three-electrode system was utilized with MgNiO2 CFs as the working electrode, Ag/AgCl as the counter electrode, and Pt as the reference electrode [49]. The target electrolyte was prepared by dissolving different concentration of Hg2+ ions (1–100 μM) in phosphate buffer solution (PBS, pH = 7.0), and the CV plots were measured at a scan rate of 50 mV/s, as shown in Figure 7a. In our work, as the concentration of Hg2+ ion increased, the oxidation or reduction current increased correspondingly. The maximum oxidation current peak of ~5.20 μA was observed for 100 μM of Hg2+ ions, which was 3 times higher than the oxidation current for 1 μM. Notably, a higher oxidation peak suggested a quicker electron transfer process in the electrochemical system and a stronger electrocatalytic behavior of the electrode [31]. The excellent and rapid sensing response of the MgNiO2 CFs electrode for Hg2+ ions might be related to the conductive character of Ni3+/Ni2+ in the charge transfer process [50]. Due to excellent electrocatalytic efficiency towards Hg2+ ions, the MgNiO2 CFs electrode exhibited an increase in anodic current. In order to calculate the sensitivity of the MgNiO2 CFs electrode, the oxidation current versus Hg2+ ions concentration is displayed in Figure 7b. The fabricated electrode showed a correlation coefficient (R2) of ~0.9721, a limit of detection (LOD) of ~11.7 μM, a constant sensitivity of ~8.22 μA∙μM−1∙cm−2, and high linearity in the 10–100 μM wide range. The existence of significantly promising sensitivity might be due to the large surface area of MgNiO2 CFs, which allows considerable analytic adsorption on the electrode surface [21]. The detection of Hg2+ ion as reported by other workers is discussed in Table 1. In comparison, MgNiO2 CFs based electrode displayed a low LOD and a high sensitivity across a large linear range towards the detection of the Hg2+ ion.
To investigate the effect of MgNiO2 on sensing behavior, CV measurements of Hg2+ ions in 0.1 M PBS electrolyte on bare SPE and MgNiO2 CFs modified SPE were performed. According to Figure 7c, the bare SPE posed the least current response to 1 μM concentration of Hg2+ ions in PBS electrolyte, whereas a prominent current response to 1 μM concentration of Hg2+ ions was recorded by MgNiO2 CF-modified SPE. This noted change in current response indicates the sensing behavior of MgNiO2 CFs toward Hg2+ ions at very low concentrations. Therefore, the obtained result showed strong electrocatalytic characteristics of MgNiO2 CFs electrode to sense Hg2+ ions at low traces.
To investigate the electrode selectivity, the MgNiO2 CFs electrode were tested by electrochemical method for the detection of other heavy metal ions, such as Cr3+ and Cu2+. The PBS electrolytes of Cr3+ and Cu2+ ions were prepared in the same way as the Hg2+ ions. The MgNiO2 CFs electrode was measured by CV investigation at a constant scan rate of 50 mV/s. Figure 8a depicts that the oxidation current increases with increasing Cr3+ ion concentration. The result was comparable to Hg2+, but the oxidation peak emerged at a lower voltage range, implying that Cr3+ might be evaluated independently of Hg2+. The CV curve of Cu2+ in Figure 8b revealed erratic results regardless of concentration rise, indicating that the MgNiO2 CFs electrode has no selectivity for Cu2+.
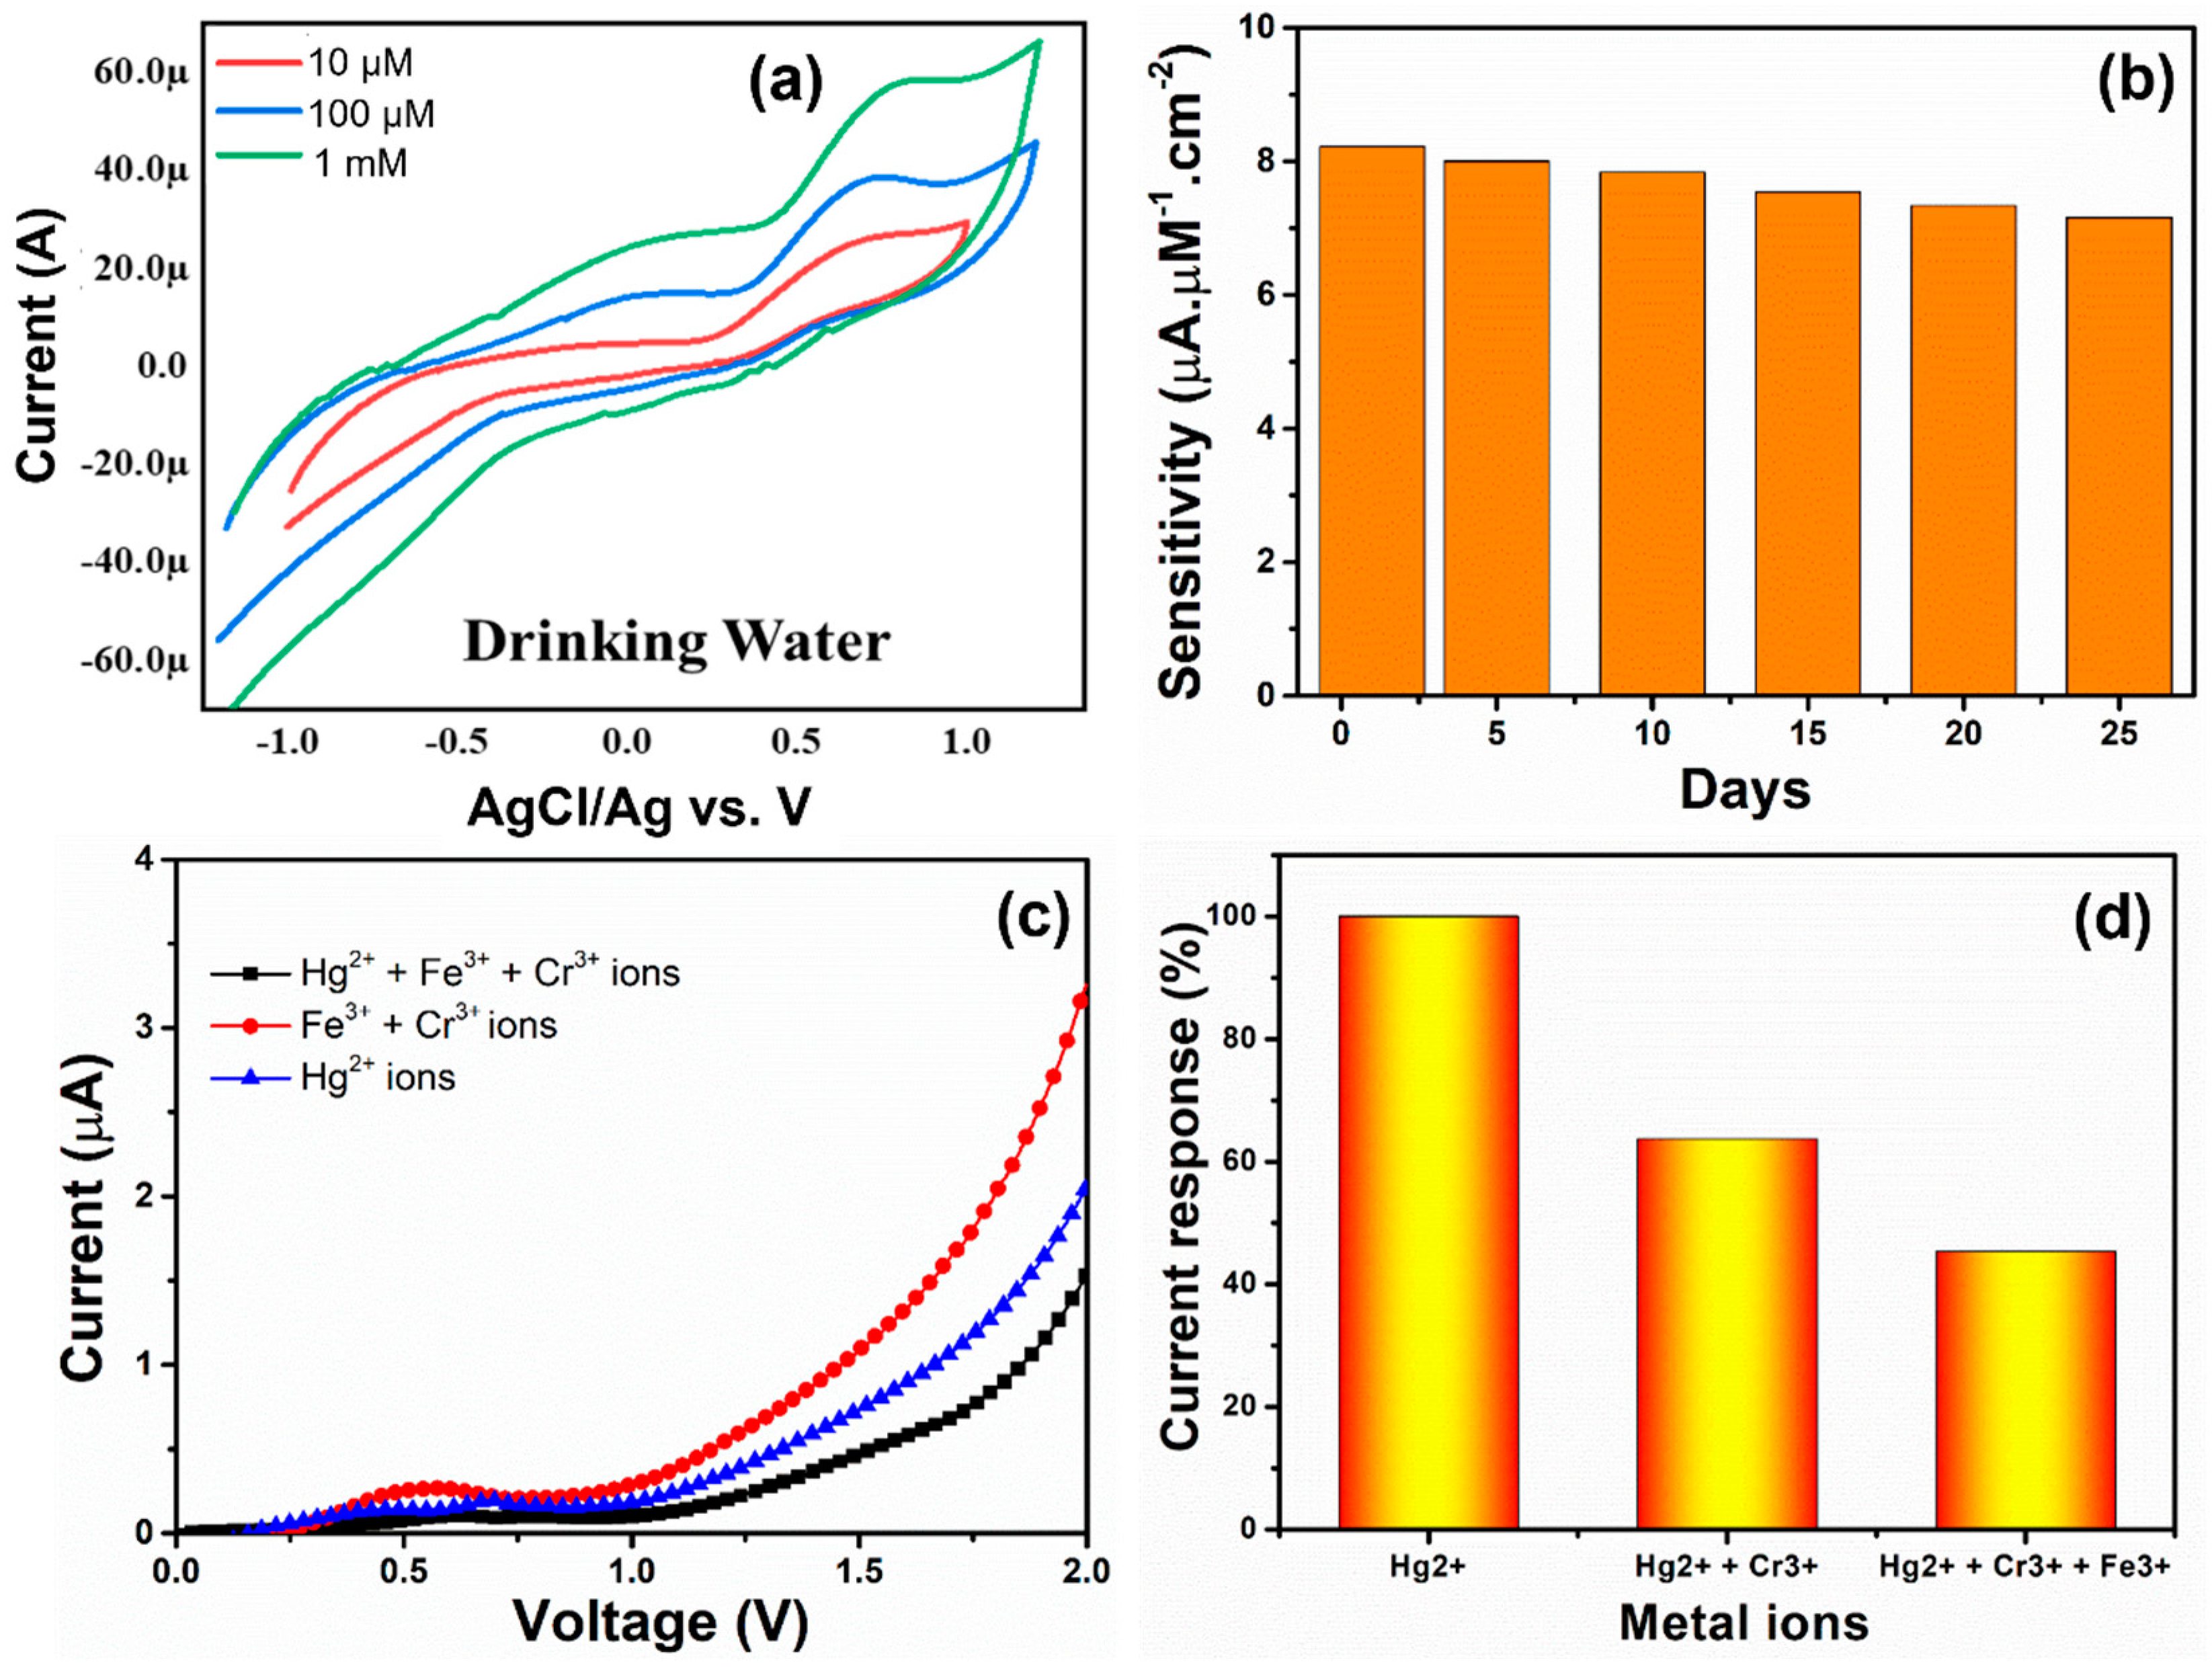
The Hg2+ ions sensing behavior in drinking water was tested to determine the actual usage of the MgNiO2 CFs electrode. The CV plots of Hg2+ ion in drinking water are shown in Figure 9a, exhibiting increasing concentrations of Hg2+ ion, and higher voltage values. This confirms the actual usability of the MgNiO2 CFs electrode. Moreover, the shapes of CV curves differed from almost similar oxidation peaks (as observed in Figure 7a), which might be related to direct testing in drinking water. To evaluate the stability of the MgNiO2 CFs electrode, as shown in Figure 9c, the sensitivity performances for Hg2+ ions were measured at regular intervals over a period of 25 days. The I–V properties of the MgNiO2 CFs electrode were examined after every 5-days, and the I–V current values for the detection of Hg2+ ions remained at roughly ~86% of the initial value without exhibiting a significant drop in the performance. This demonstrates an excellent stability of the MgNiO2 CFs electrode toward the detection of Hg2+ ions. The obtained stability results clearly showed the long-term viability of the MgNiO2 CFs electrode towards electrochemical sensing for the detection of harmful Hg2+ ions.
The selectivity of the MgNiO2 CFs electrode toward Hg2+ ions was further examined by measuring the current response in PBS electrolytes with Hg2+ ions (10 µM) and mixtures with other metal ions. As shown in Figure 9c, the current responses were considerably decreased when Fe3+ (10 µM) and Cr3+ (10 µM) ions were mixed with Hg2+ ions. In other words, interfering species such as Fe3+ (10 µM) and Cr3+ (10 µM) ions and Hg2+ ions in PBS electrolytes resulted in lowering the current response compared to a high current response observed only by Hg2+ ions. Figure 9d displays the percentage response of interfering metal ions by the MgNiO2 CFs electrode. With the MgNiO2 CFs electrode, ~100% sensitivity of Hg2+ ions was achieved, whereas the sensing responses were lowered towards Cr3+ + Fe3+ ions (~62%) and Cr3+ + Fe3+ + Hg2+ ions (~44%). Thus, the MgNiO2 CFs electrode expressed good selectivity for Hg2+ ions compared to other heavy metal ions.
4. Conclusions
A simple hydrothermal technique was used to synthesize MgNiO2 nanomaterials in the form of Chrysanthemum Flowers (CFs). The synthesized MgNiO2 CFs showed significant size pores of ~61.871 nm with a high specific surface area of ~45.618 m2/g, which created an extensive sensing active site. The Ni ions in the MgNiO2 CFs showed multiple Ni3+/Ni2+ oxidation states, which supported good conductive characteristics and promising electronic behavior. The MgNiO2 CFs electrode had a high correlation coefficient (R2) of ~0.9721, a low limit of detection (LOD) of ~11.7 μM, a fast reaction time (10 s), and a sensitivity of ~8.22 μA∙μM−1∙cm−2 towards the detection of Hg2+ ions over a wide linear range of 10–100 μM. Furthermore, the MgNiO2 CFs electrode was tested to detect other heavy metal ions, namely Cr3+ and Cr2+, and the obtained results confirmed that the MgNiO2 CFs electrode is a promising material for the detection of Hg2+ ions and could be utilized in the future for testing other toxic materials.
Author Contributions
Conceptualization, M.I. and E.-B.K.; methodology, M.I. and E.-B.K.; software, M.I.; validation, M.I., E.-B.K., and D.-H.K.; formal analysis, M.I.; investigation, M.I. and E.-B.K.; data curation, M.I. and E.-B.K.; writing—original draft preparation, M.I.; writing—review and editing, S.A.; visualization, E.-B.K. and D.-H.K.; supervision, S.A.; funding acquisition, S.A. and D.-H.K. All authors have read and agreed to the published version of the manuscript.
Funding
This research received no external funding.
Institutional Review Board Statement
Not applicable.
Informed Consent Statement
Not applicable.
Data Availability Statement
Not applicable.
Acknowledgments
This research was supported by the Basic Science Research Program through the National Research Foundation of Korea (NRF) funded by the Ministry of Education (NRF-2022R1A6A3A01086334). This work was also supported by the National Research Foundation of Korea (NRF) grant funded by the Korean government (MSIT) (NRF-2022R1A2C1091936).
Conflicts of Interest
The authors declare no conflict of interest.
References
- Dilek, D.Y.; Derya, A.D.; Hamdi, M. Colorimetric detection of mercury ion using chlorophyll functionalized green silver nanoparticles in aqueous medium. Surf. Inter. 2021, 22, 100840. [Google Scholar]
- Tchounwou, P.B.; Yedjou, C.G.; Patlolla, A.K.; Sutton, D.J. Heavy Metal Toxicity and the Environment. Mol. Clin. Environ. Toxicol. 2012, 101, 133–164. [Google Scholar]
- Wang, Z.; Su, S.; Yu, C.; Chen, Y.; Xia, D. Synthesis, Characterization, and Electrochemical Properties of Spherical-like LiFePO4 by Hydrothermal Method. J. Power Sour. 2008, 184, 633–636. [Google Scholar] [CrossRef]
- Annadhasan, M.; Rajendiran, N. Highly Selective and Sensitive Colorimetric Detection of Hg (II) Ions Using Green Synthesized Silver Nanoparticles. RSC Adv. 2015, 5, 94513–94518. [Google Scholar] [CrossRef]
- Liu, B.; Zhuang, J.; Wei, G. Recent Advances in the Design of Colorimetric Sensors for Environmental Monitoring. Environ. Sci. Nano 2020, 7, 2195–2213. [Google Scholar] [CrossRef]
- Cyril, N.; George, J.B.; Joseph, L.; Sylas, V.P. Catalytic Degradation of Methyl Orange and Selective Sensing of Mercury Ion in Aqueous Solutions Using Green Synthesized Silver Nanoparticles from the Seeds of Derris trifoliata. J. Cluster Sci. 2019, 30, 459–468. [Google Scholar] [CrossRef]
- Luiz, J.; Nascimento, M.; Oliveira, K.R.M.; Crespolopez, M.E.; Barbarella, M.; Maués, L.A.L. Methylmercury Neurotoxicity & Antioxidant Defenses. Indian J. Med. Res. 2008, 128, 373–382. [Google Scholar]
- Dayan, A.D.; Paine, A.J. Human & Experimental Toxicology: Mechanisms of Chromium Toxicity, Carcinogenicity, and Allergenicity: Review of the Literature from 1985 to 2000. Hum. Exp. Toxicol. 2001, 20, 439–451. [Google Scholar]
- Graeme, K.A.; Charles, V.P. Toxicology Heavy Metal Toxicity. Part I: Arsenic and Mercury. J. Emerg. Med. 1998, 16, 45–56. [Google Scholar] [CrossRef]
- Barringer, J.L.; Szabo, Z.; Reilly, P.A. Occurrence and Mobility of Mercury in Groundwater. Curr. Perspect. Contam. Hydrol. Water Res. Sus. 2012, 1, 117–147. [Google Scholar]
- Hughes, M.F.; Beck, B.D.; Chen, Y.; Lewis, A.S.; Thomas, D.J. Arsenic Exposure and Toxicology: A Historical Perspective. Toxicol. Sci. 2011, 123, 305–332. [Google Scholar] [CrossRef] [PubMed]
- Nriagu, J. Zinc Toxicity in Humans. In Encyclopedia of Environmental Health; Elsevier: Amsterdam, The Netherlands, 2019; pp. 500–508. [Google Scholar]
- Patrick, L. Lead Toxicity. Part II: The Role of Free Radical Damage and the Use of Antioxidants in the Pathology and Treatment of Lead Toxicity. Altern. Med. Rev. 2006, 11, 114–127. [Google Scholar] [PubMed]
- Dey, S.K.; Roy, S. Effects of Chromium on Certain Aspects of Cellular Toxicity. Iran. J. Toxicol. 2009, 2, 260–267. [Google Scholar]
- Adrienne, S.E.; Anne, G.W. Guidelines for the Identification and Management of Lead Exposure in Pregnant and Lactating Women; U.S. Department of Health and Human Services: Atlanta, GA, USA, 2010; pp. 5–27.
- Liu, C.; Bai, R.; Ly, Q.S. Selective Removal of Copper and Lead Ions by Diethylenetriamine-Functionalized Adsorbent: Behaviors and Mechanisms. Water Res. 2008, 42, 1511–1522. [Google Scholar] [CrossRef]
- Arino, C.; Serrano, N.; Díaz-Cruz, J.M.; Esteban, M. Voltammetric Determination of Metal Ions beyond Mercury Electrodes: A Review. Anal. Chim. Acta 2017, 990, 11–53. [Google Scholar] [CrossRef] [PubMed]
- Barakat, M.A. New Trends in Removing Heavy Metals from Industrial Wastewater. Arab. J. Chem. 2011, 4, 361–377. [Google Scholar] [CrossRef]
- Ameen, S.; Akhtar, M.S.; Shin, H.S. Spindles Shaped ZnO Modified Glassy Carbon Electrode for the Selective Monitoring of Piperidine. Mater. Lett. 2015, 148, 188–191. [Google Scholar] [CrossRef]
- Zhang, M.; Igalavithana, A.D.; Xu, L.; Sarkar, B.; Hou, D.; Zhang, M.; Bhatnagar, A.; Cho, W.C.; Ok, Y.S. Engineered/Designer Hierarchical Porous Carbon Materials for Organic Pollutant Removal from Water and Wastewater: A Critical Review. Crit. Rev. Environ. Sci. Technol. 2020, 51, 2295–2328. [Google Scholar] [CrossRef]
- Kim, E.B.; Imran, M.; Akhtar, M.S.; Shin, H.S.; Ameen, S. Enticing 3D Peony-like ZnGa2O4 Microstructures for Electrochemical Detection of N, N-Dimethylmethanamide Chemical. J. Hazard. Mater. 2021, 404, 124069. [Google Scholar] [CrossRef]
- Zhang, J.; Shan, J.; Li, P.; Zhai, F.; Wan, Q.; Liu, Z.; Qu, X. Dehydrogenation mechanism of ball-milled MgH2 doped with ferrites (CoFe2O4, ZnFe2O4, MnFe2O4 and Mn0.5Zn0.5Fe2O4) nanoparticles. J. Alloys Compd. 2015, 643, 174–180. [Google Scholar] [CrossRef]
- Jang, G.S.; Kim, E.B.; Akhtar, M.S.; Shin, H.S.; Ameen, S. An Exploration of 3-Methoxypropionitrile Chemical Sensor Based on Layered Hexagonal NiCo2O4 Nanoplates as Electrode Material. Ceram. Int. 2021, 47, 15357–15366. [Google Scholar] [CrossRef]
- Gineys, N.; Aouad, G.; Sorrentino, F.; Damidot, D. Incorporation of trace elements in Portland cement clinker: Thresholds limits for Cu, Ni, Sn or Zn. Cem. Concr. Res. 2011, 41, 1177–1184. [Google Scholar] [CrossRef]
- Franger, S.; Le Cras, F.; Bourbon, C.; Rouault, H. Comparison between different LiFePO4 synthesis routes and their influence on its physico-chemical properties. J. Power Sources 2003, 119–121, 252–257. [Google Scholar] [CrossRef]
- Yu, L.; Zhang, P.; Dai, H.; Chen, L.; Ma, H.; Lin, M.; Shen, D. An Electrochemical Sensor Based on Co3O4 Nanosheets for Lead Ions Determination. RSC Adv. 2017, 7, 39611–39616. [Google Scholar] [CrossRef]
- Ali, N.A.; Idris, N.H.; Din, M.F.M.; Yahya, M.S.; Ismail, M. Nanoflakes MgNiO2 Synthesized via a Simple Hydrothermal Method and Its Catalytic Roles on the Hydrogen Sorption Performance of MgH2. J. Alloys Compd. 2019, 796, 279–286. [Google Scholar] [CrossRef]
- Kim, E.B.; Imran, M.; Lee, E.H.; Akhtar, M.S.; Ameen, S. Multiple Ions Detection by Field-Effect Transistor Sensors Based on ZnO@GO and ZnO@rGO Nanomaterials: Application to Trace Detection of Cr(III) and Cu(II). Chemosphere 2022, 286, 131695–131705. [Google Scholar] [CrossRef]
- Riman, D.; Jirovsky, D.; Hrbac, J.; Prodromidis, M.I. Green and Facile Electrode Modification by Spark Discharge: Bismuth Oxide-Screen Printed Electrodes for the Screening of Ultra-Trace Cd (II) and Pb (II). Electrochem. Comm. 2015, 50, 20–23. [Google Scholar] [CrossRef]
- Li, M.; Li, D.W.; Xiu, G.; Long, Y.T. Applications of Screen-Printed Electrodes in Current Environmental Analysis. Curr. Opin. Electrochem. 2017, 3, 137–143. [Google Scholar] [CrossRef]
- Cui, L.; Wu, J.; Fu, H. Synthesis of Bismuth-Nanoparticle-Enriched Nanoporous Carbon on Graphene for Efficient Electrochemical Analysis of Heavy-Metal Ions. Chem. Eur. J. 2015, 21, 11525–11530. [Google Scholar] [CrossRef]
- Ameen, S.; Akhtar, M.S.; Shin, H.S. Low Temperature Grown ZnO Nanotubes as Smart Sensing Electrode for the Effective Detection of Ethanolamine Chemical. Mater. Lett. 2013, 106, 254–258. [Google Scholar] [CrossRef]
- Suppuraj, P.; Thirumalai, K.; Parthiban, S.; Swaminathan, M.; Muthuvel, I. Novel Ag-TiO2/ZnFe2O4 Nanocomposites for Effective Photocatalytic, Electrocatalytic, and Cytotoxicity Applications. J. Nanosci. Nanotechnol. 2020, 20, 709–718. [Google Scholar] [CrossRef] [PubMed]
- Suvith, V.S.; Devu, V.S.; Philip, D. Tannic Acid Mediated Synthesis of Nanostructured NiO and SnO2 for Catalytic Degradation of Methylene Blue. Opt. Quant. Electron. 2020, 52, 1–17. [Google Scholar] [CrossRef]
- Monshi, A.; Foroughi, M.R.; Monshi, M.R. Modified Scherrer Equation to Estimate More Accurately Nano-Crystallite Size Using XRD. World J. Nano Sci. Eng. 2012, 2, 154–160. [Google Scholar] [CrossRef]
- Allaedini, G.; Aminayi, P.; Tasirin, S.M. Structural properties and optical characterization of flower-like Mg doped NiO. AIP Adv. 2015, 5, 077161. [Google Scholar] [CrossRef]
- Wang, B.; Xiong, X.; Ren, H.; Huang, Z. Preparation of MgO nanocrystals and catalytic mechanism on phenol ozonation. RSC Adv. 2017, 7, 43464–43473. [Google Scholar] [CrossRef]
- Maitra, S.; Mitra, R.; Nath, T.K. Investigation of electrochemical performance of MgNiO2 prepared by sol-gel synthesis route for aqueous-based supercapacitor application. Curr. Appl. Phys. 2020, 20, 628–637. [Google Scholar] [CrossRef]
- Kotta, A.; Kim, E.B.; Ameen, S.; Shin, H.S.; Seo, H.K. Ultra-Small NiO Nanoparticles Grown by Low-Temperature Process for Electrochemical Application. J. Electrochem. Soc. 2020, 167, 167517. [Google Scholar] [CrossRef]
- Wu, P.Y.; Jiang, Y.-P.; Zhang, Q.Y.; Jia, Y.; Peng, D.Y.; Xu, W. Comparative Study on Arsenate Removal Mechanism of MgO and MgO/TiO2 Composites: FTIR and XPS Analysis. New J. Chem. 2016, 40, 2878–2885. [Google Scholar] [CrossRef]
- Huang, W.; Ding, S.; Chen, Y.; Hao, W.; Lai, X.; Peng, J.; Tu, J.; Cao, Y.; Li, X. 3D NiO Hollow Sphere/Reduced Graphene Oxide Composite for High-Performance Glucose Biosensor. Nat. Sci. Rep. 2017, 7, 5220. [Google Scholar] [CrossRef]
- Yang, B.; Bai, X.; Wang, J.; Fang, M.; Wu, X.; Liu, Y.; Huang, Z.; Lao, C.Y.; Min, X. Photocatalytic Performance of NiO/NiTiO3 Composite Nanofiber Films. Catalysts 2019, 9, 561. [Google Scholar] [CrossRef]
- Han, B.; Yang, Y.; Huang, Z.; You, L.; Huang, H.; Wang, K. A Composite Anodic Coating Containing Graphene on AZ31 Magnesium Alloy. Int. J. Electrochem. Sci. 2017, 12, 9829–9843. [Google Scholar] [CrossRef]
- El-Kemary, M.; Nagy, N.; El-Mehasseb, I. Nickel oxide nanoparticles: Synthesis and spectral studies of interactions with glucose. Mat. Sci. Semicon. Proc. 2013, 16, 1747–1752. [Google Scholar] [CrossRef]
- Zhu, L.P.; Liao, G.H.; Yang, Y.; Xiao, H.M.; Wang, J.F.; Fu, S.Y. Self-Assembled 3D Flower-Like Hierarchical b-Ni(OH)2 Hollow Architectures and their In Situ Thermal Conversion to NiO. Nanoscale Res. Lett. 2009, 4, 550–557. [Google Scholar] [CrossRef] [PubMed]
- Musevi, S.J.; Aslani, A.; Motahari, H.; Salimi, H. A Novel Method for Size Appraisal of NiO Nanoparticles by PL Analysis: Synthesis by Sonochemical Method. J. Saudi. Chem. Soc. 2016, 20, 245–252. [Google Scholar] [CrossRef]
- Kumar, S.A.; Shankar, J.S.; Periyasamy, B.K.; Nayak, S.K. Role of Defective States in MgO Nanoparticles on the Photophysical Properties and Photostability of MEH-PPV/MgO Nanocomposite. Phys. Chem. Chem. Phys. 2021, 23, 22804–22816. [Google Scholar] [CrossRef]
- Anandan, K.; Rajendran, V. Morphological and Size Effects of NiO Nanoparticles via Solvothermal Process and Their Optical Properties. Mat. Sci. Semicon. Proc. 2011, 14, 43–47. [Google Scholar] [CrossRef]
- Taşer, A.; Güldüren, M.E.; Güney, H. Tuning PL Emission Energy and Bandgap with Ni Dopant of MgO Thin Films. Ceram. Int. 2021, 47, 15792–15800. [Google Scholar] [CrossRef]
- Ansari, A.; Ali, A.; Asif, M.; Shamsuzzaman. Microwave-assisted MgO NP catalyzed one-pot multicomponent synthesis of polysubstituted steroidal pyridines. New J. Chem. 2018, 42, 184–197. [Google Scholar] [CrossRef]
- Gao, X.H.; Wei, W.Z.; Yang, L.; Yin, T.J. Simultaneous Determination of Lead, Copper, and Mercury Free from Macromolecule Contaminants by Square Wave Stripping Voltammetry. Mat. Lett. 2005, 38, 2327–2343. [Google Scholar] [CrossRef]
- Granado, E.; Gervais, E.; Gotti, G.S.; Meireles, M.; Gros, P.; Evrard, D. Mercury (II) Trace Detection Using a Glassy Carbon Electrode Functionalized by Chemically Prepared Gold Nanoparticles. Influence of Coating Process on Surface Reactivity and Analytical Performances. Int. J. Electrochem. Sci. 2017, 12, 6092–6107. [Google Scholar] [CrossRef]
- Zhou, L.; Xiong, W.; Liu, S. Preparation of a gold electrode modified with Au–TiO2 nanoparticles as an electrochemical sensor for the detection of mercury (II) ions. J. Mater. Sci. 2015, 50, 769–776. [Google Scholar] [CrossRef]
Figure 1.
FESEM images at low magnification (a,b), high magnification (c), and EDX spectrum (d) of MgNiO2 CFs.
Figure 1.
FESEM images at low magnification (a,b), high magnification (c), and EDX spectrum (d) of MgNiO2 CFs.
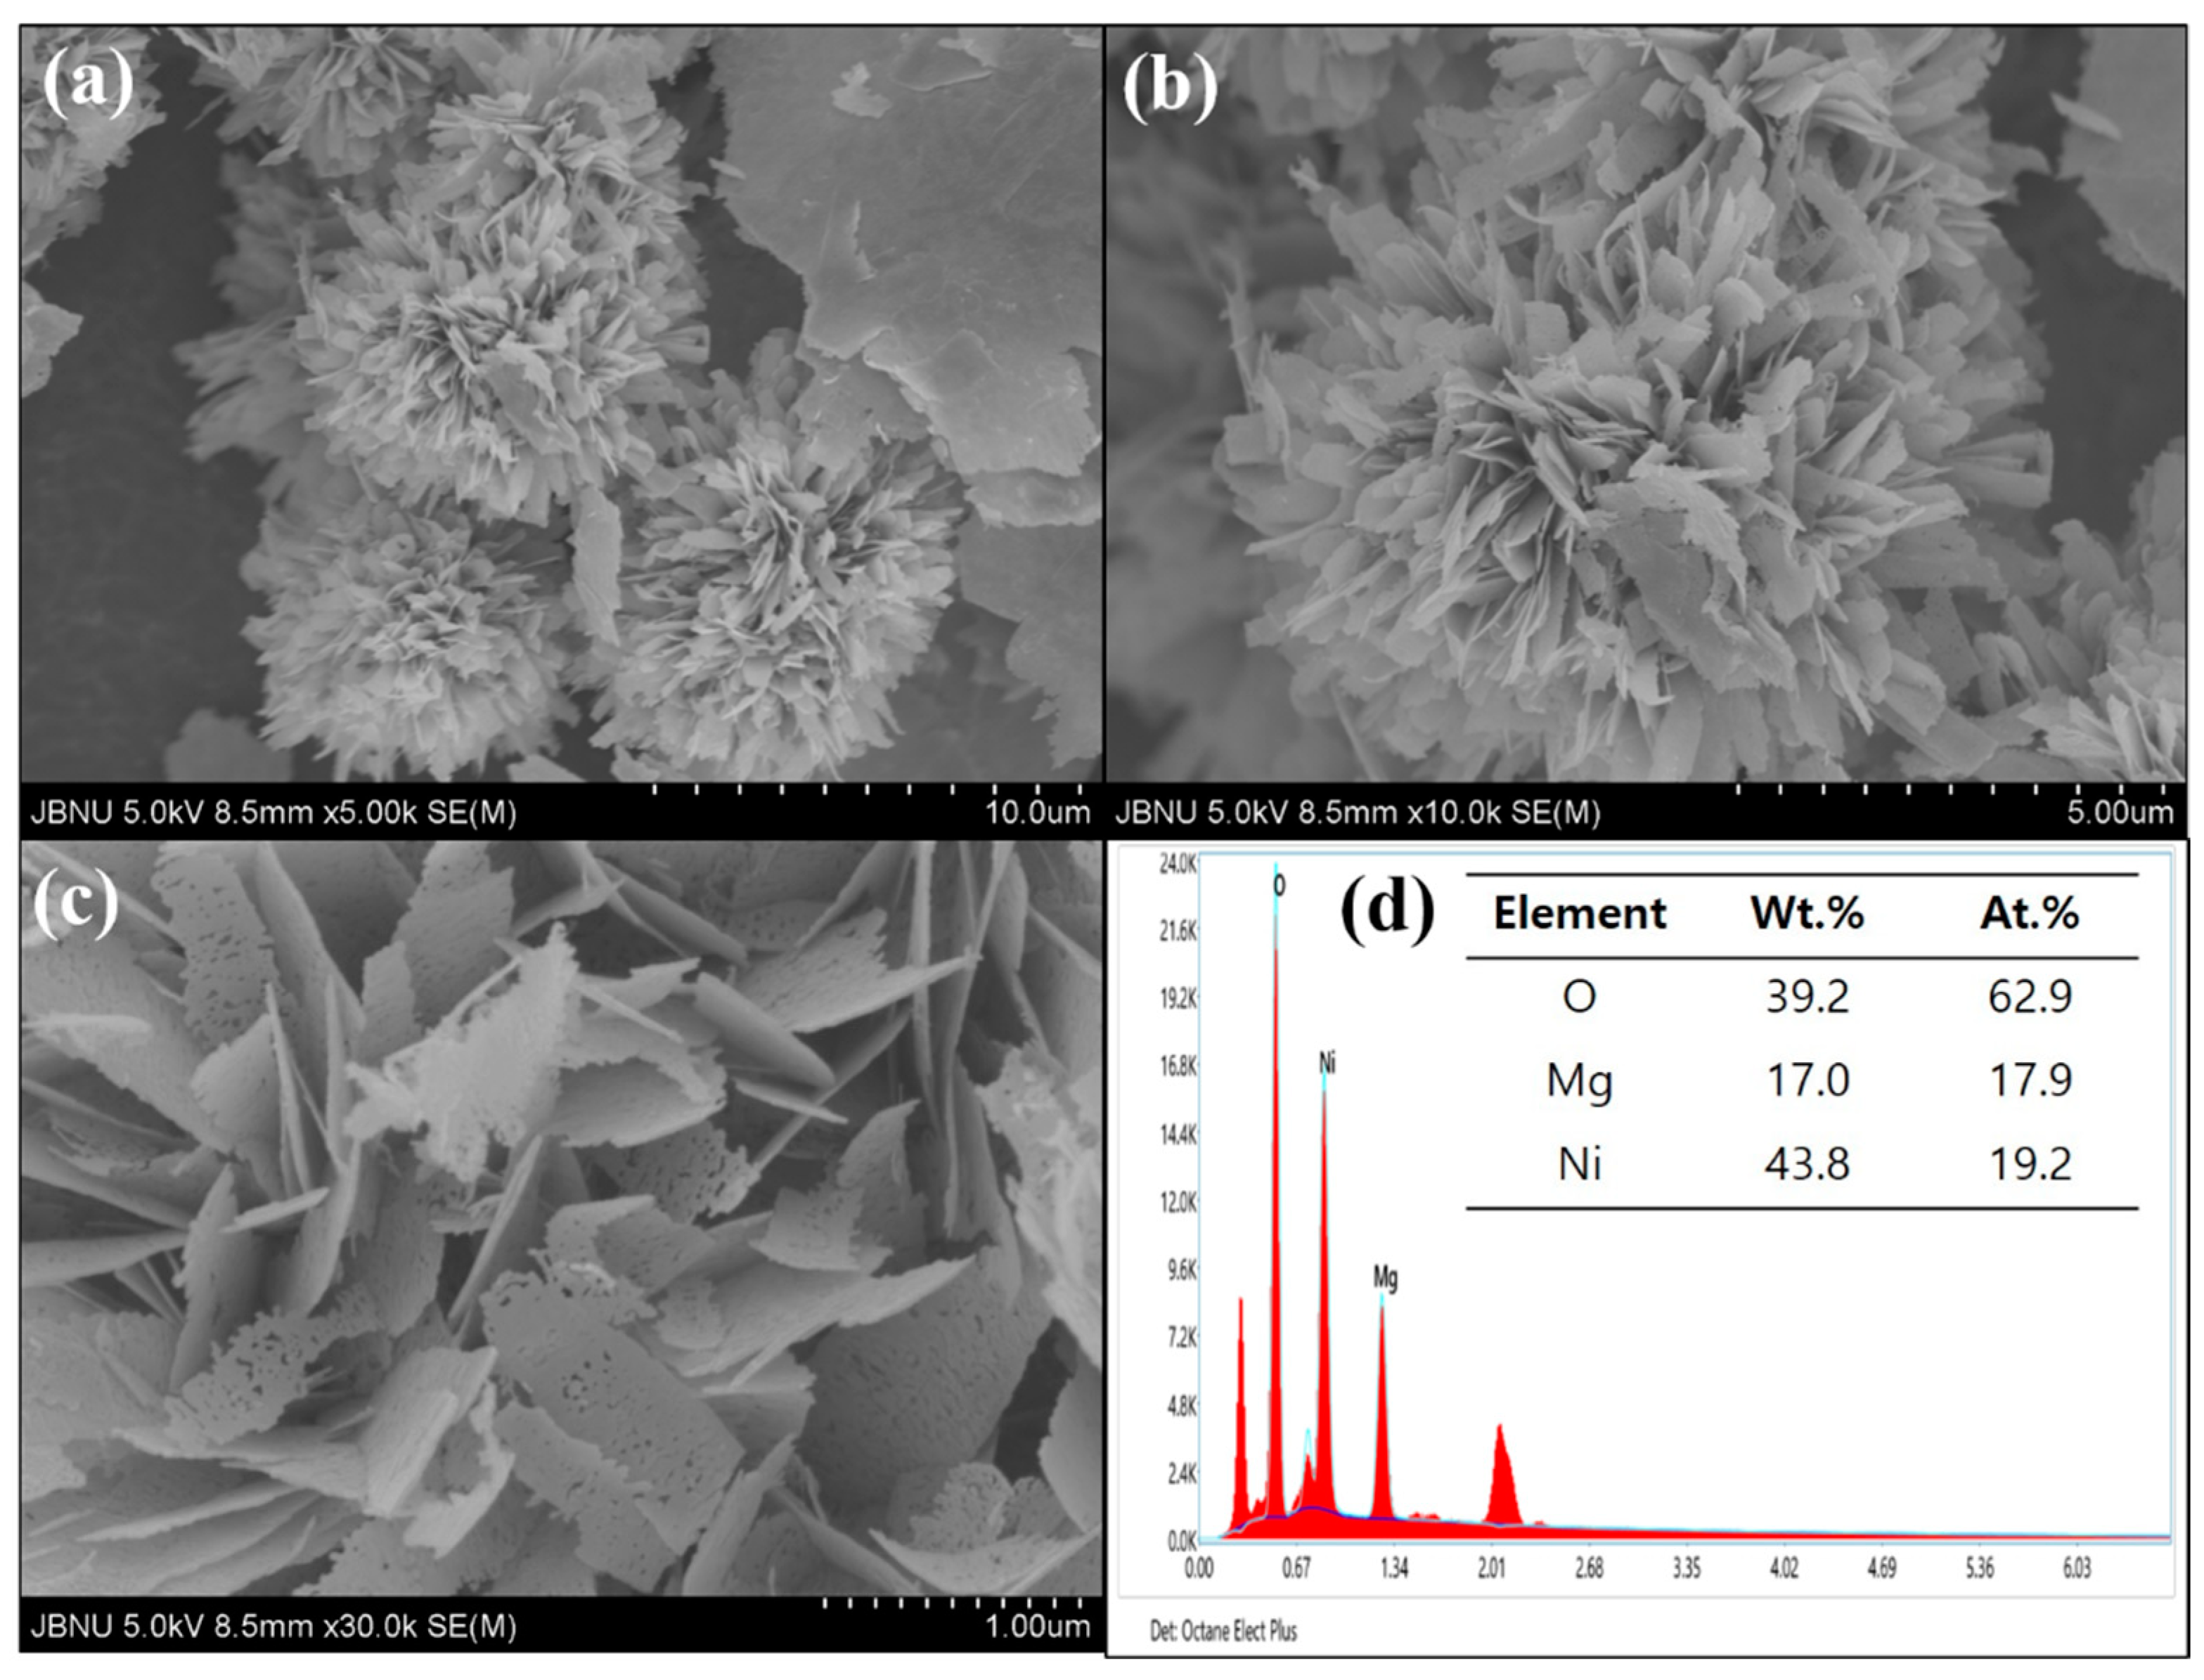
Figure 2.
HRTEM images at low magnification (a–c) and high magnification (d) of MgNiO2 CFs.

Figure 3.
XRD patterns (a) FTIR spectroscopy (b) Raman spectroscopy (c) of MgNiO2 CFs.

Figure 4.
N2 adsorption and desorption plot (a) pore size contribution (b) of MgNiO2 CFs.
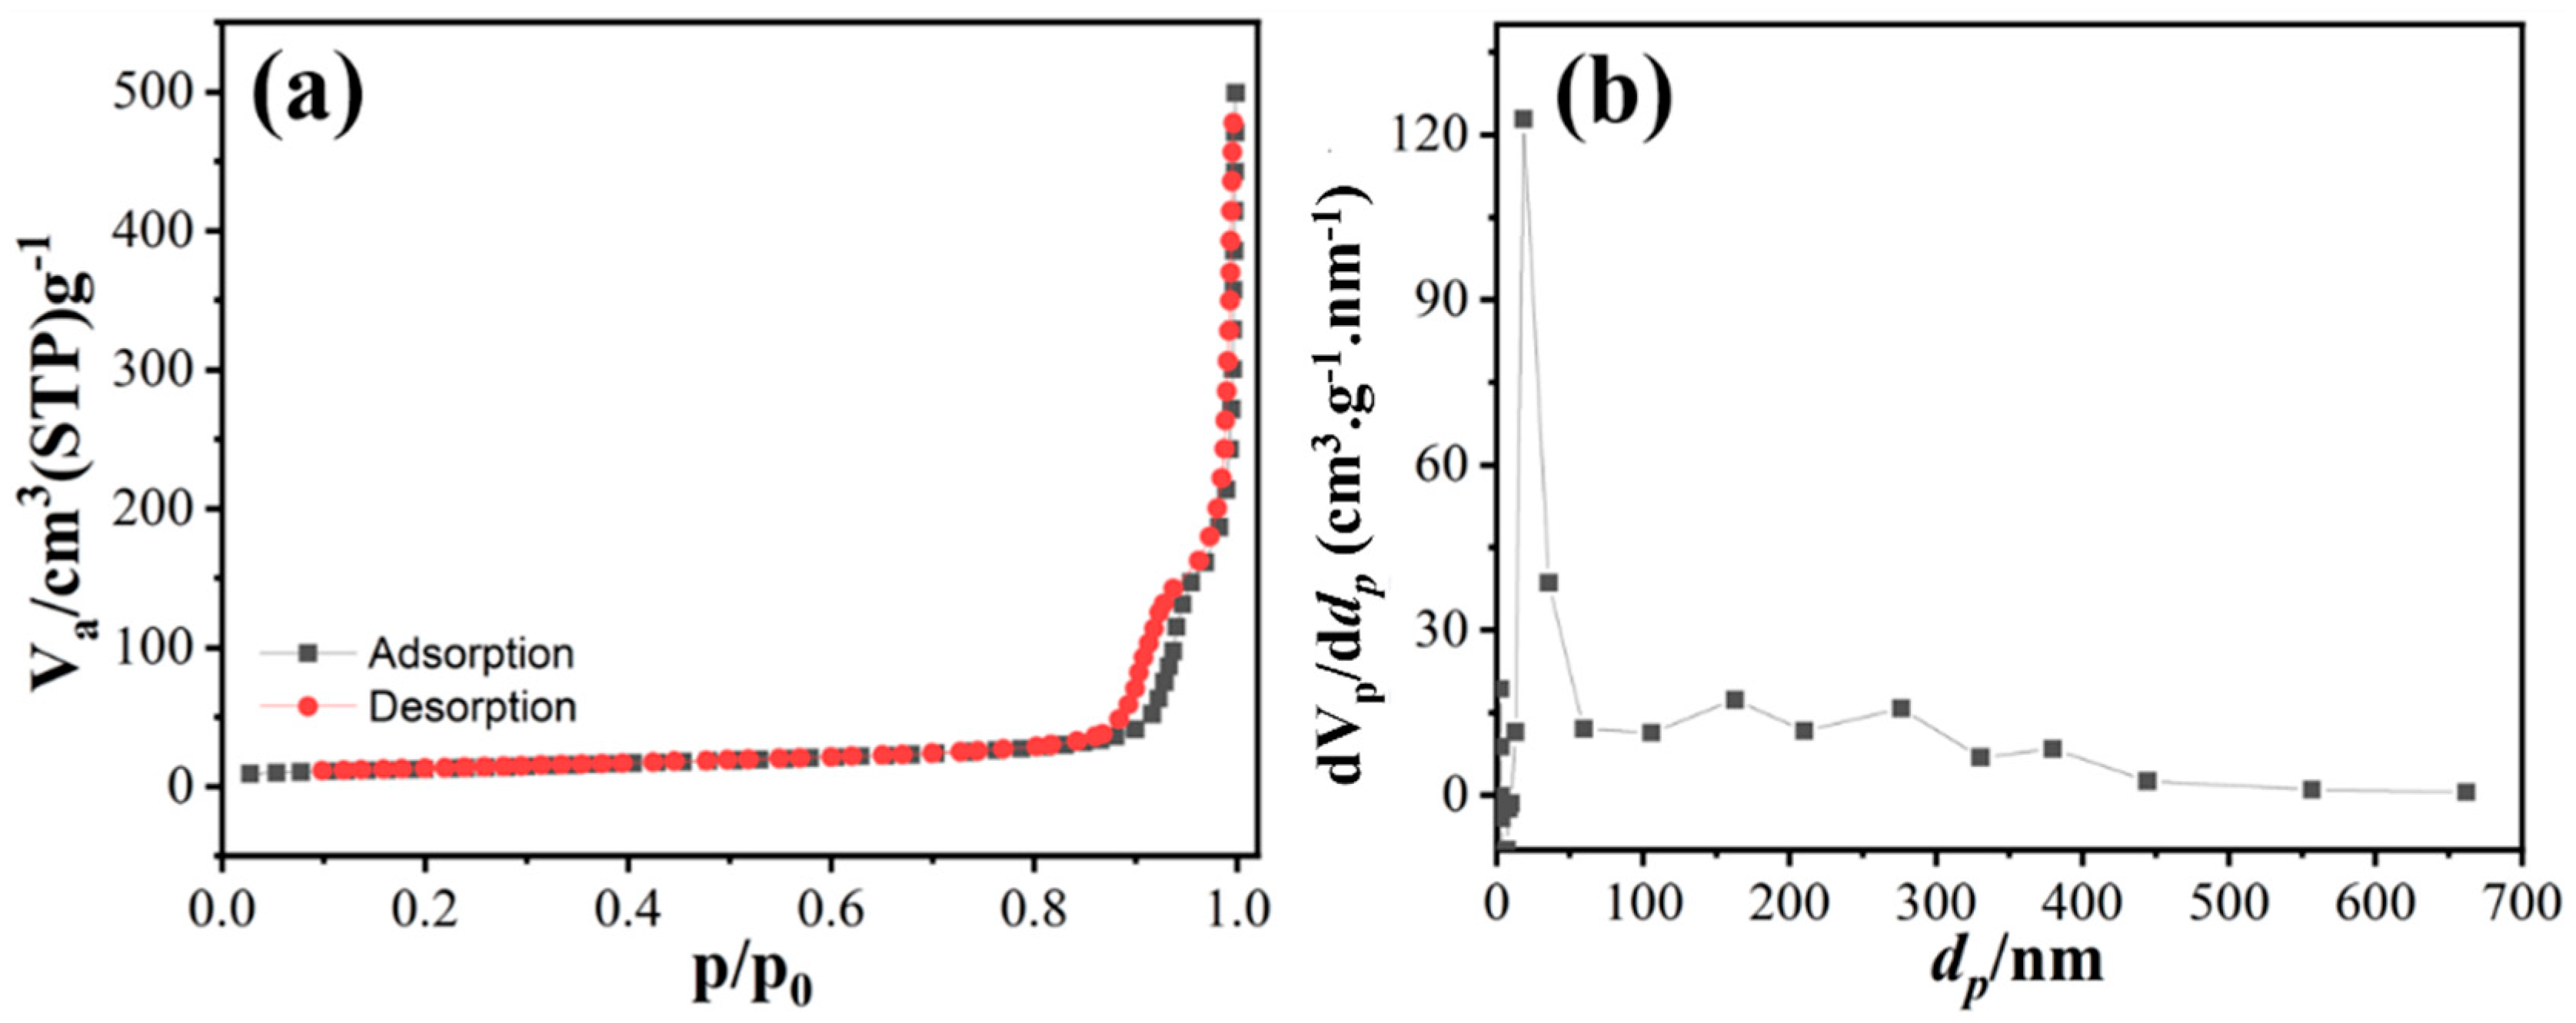
Figure 5.
XPS spectra of MgNiO2 CFs (a) survey profile, (b) O ls, (c) Ni 2p (d) Mg 1s.
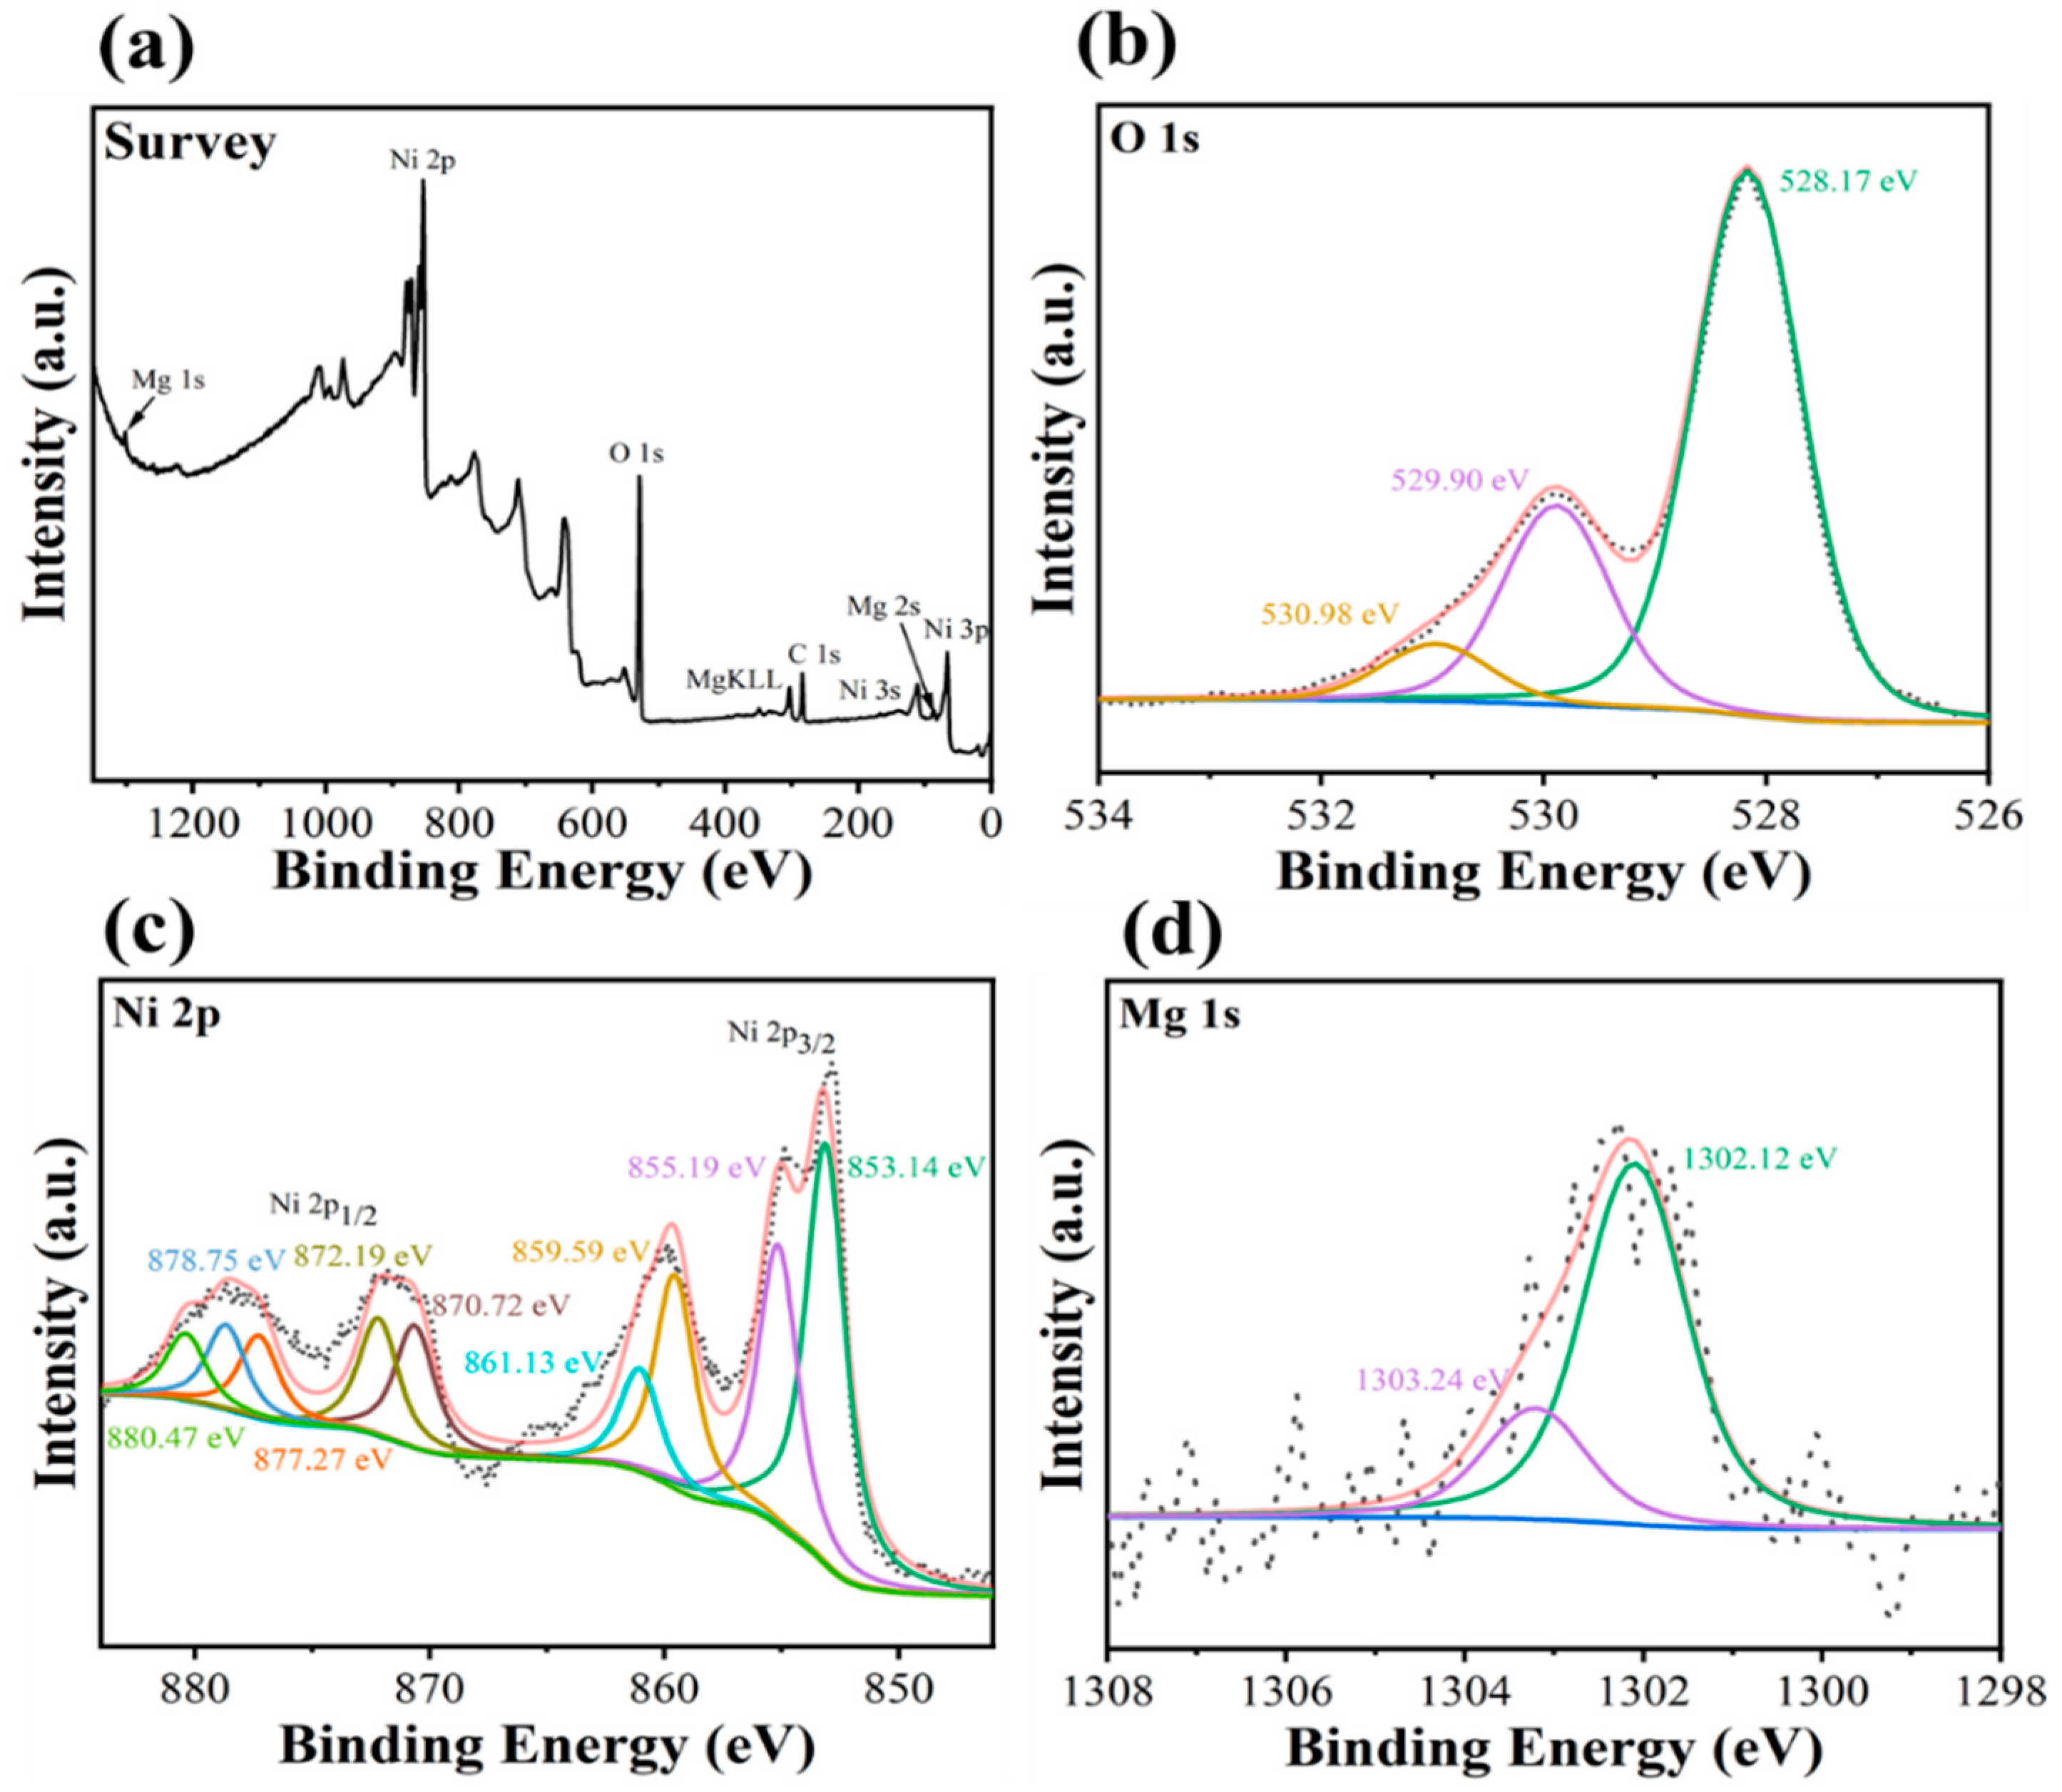
Figure 6.
UV-vis (a), calculated optical band (αhν)2 vs. hν (b) (Dotted red line shows the intercept of plot) and PL spectrum (c) of MgNiO2 CFs.
Figure 6.
UV-vis (a), calculated optical band (αhν)2 vs. hν (b) (Dotted red line shows the intercept of plot) and PL spectrum (c) of MgNiO2 CFs.

Figure 7.
CV plot (a), calibrated oxidation current versus concentration of Hg2+ ions (b), and I–V curves with varying Hg2+ ion concentrations from 1 μM~100 μM concentration of the Hg2+ ion in 0.1 M PBS and (c) CV plots of bare SPE and MgNiO2 CFs modified electrode in PBS with Hg2+ (μM).
Figure 7.
CV plot (a), calibrated oxidation current versus concentration of Hg2+ ions (b), and I–V curves with varying Hg2+ ion concentrations from 1 μM~100 μM concentration of the Hg2+ ion in 0.1 M PBS and (c) CV plots of bare SPE and MgNiO2 CFs modified electrode in PBS with Hg2+ (μM).
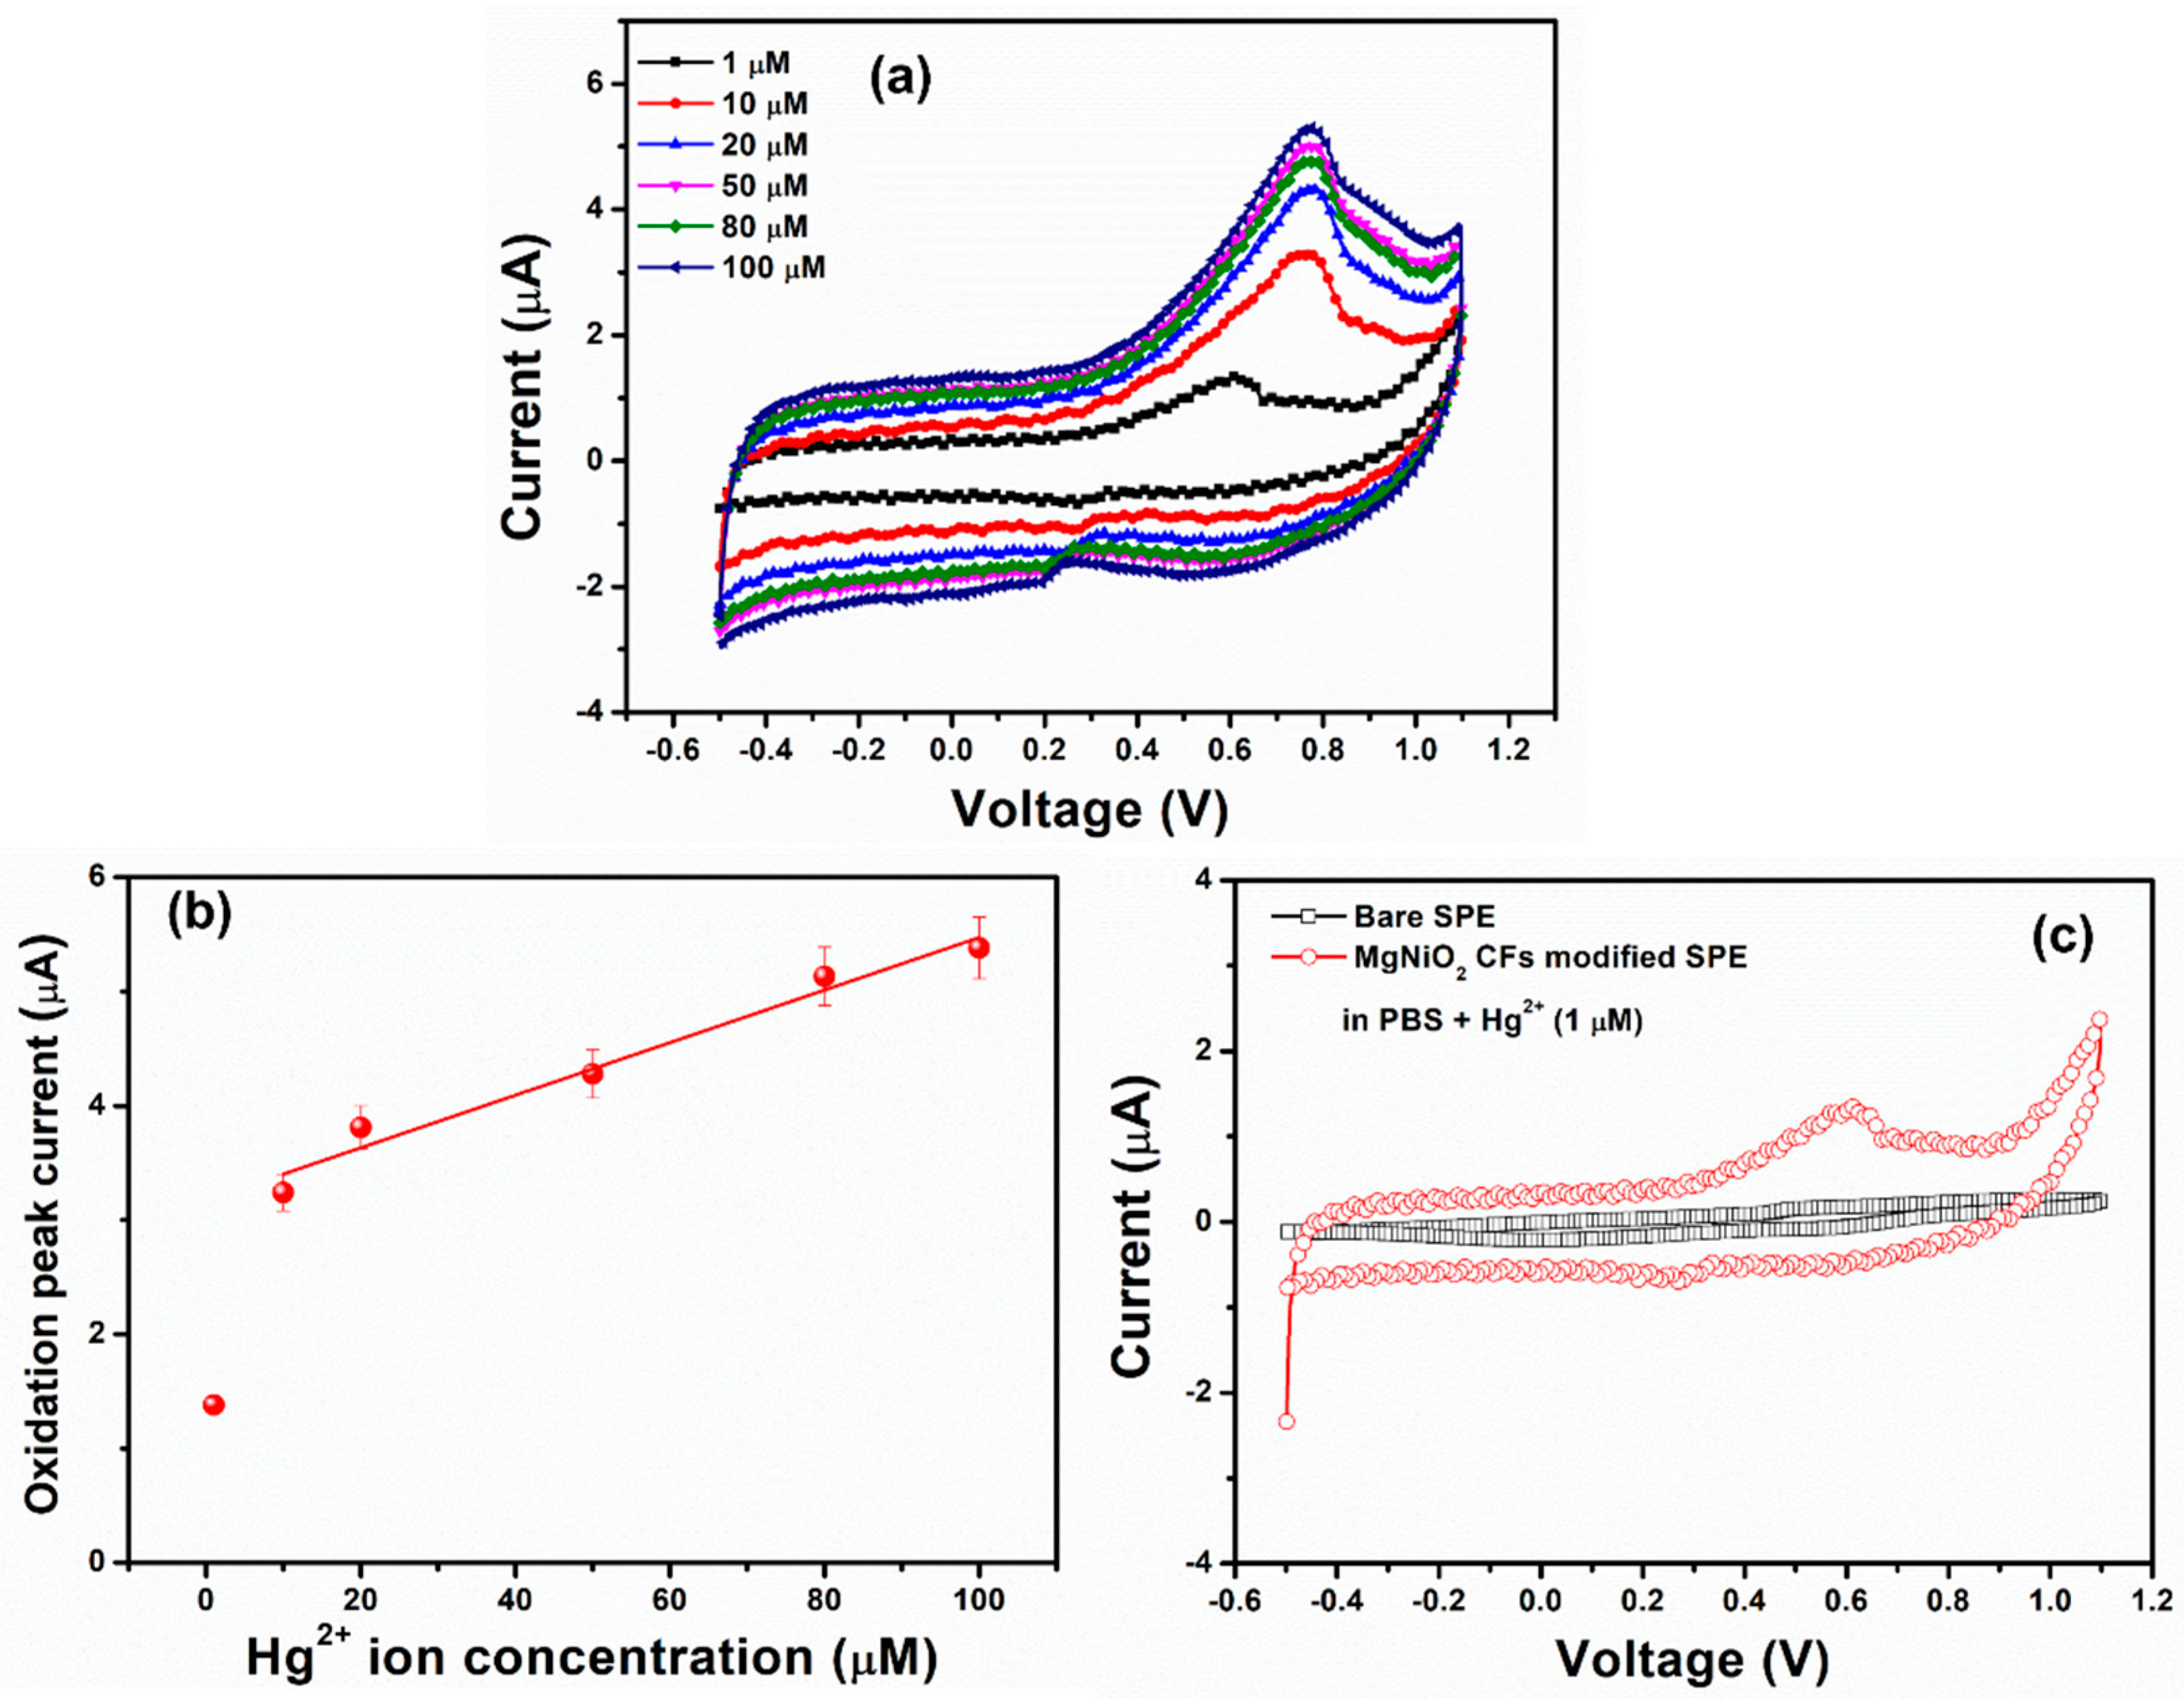
Figure 8.
CV plots for (a) Cr3+ and (b) Cu2+ ions in 0.1 M PBS of MgNiO2 CFs modified electrode.
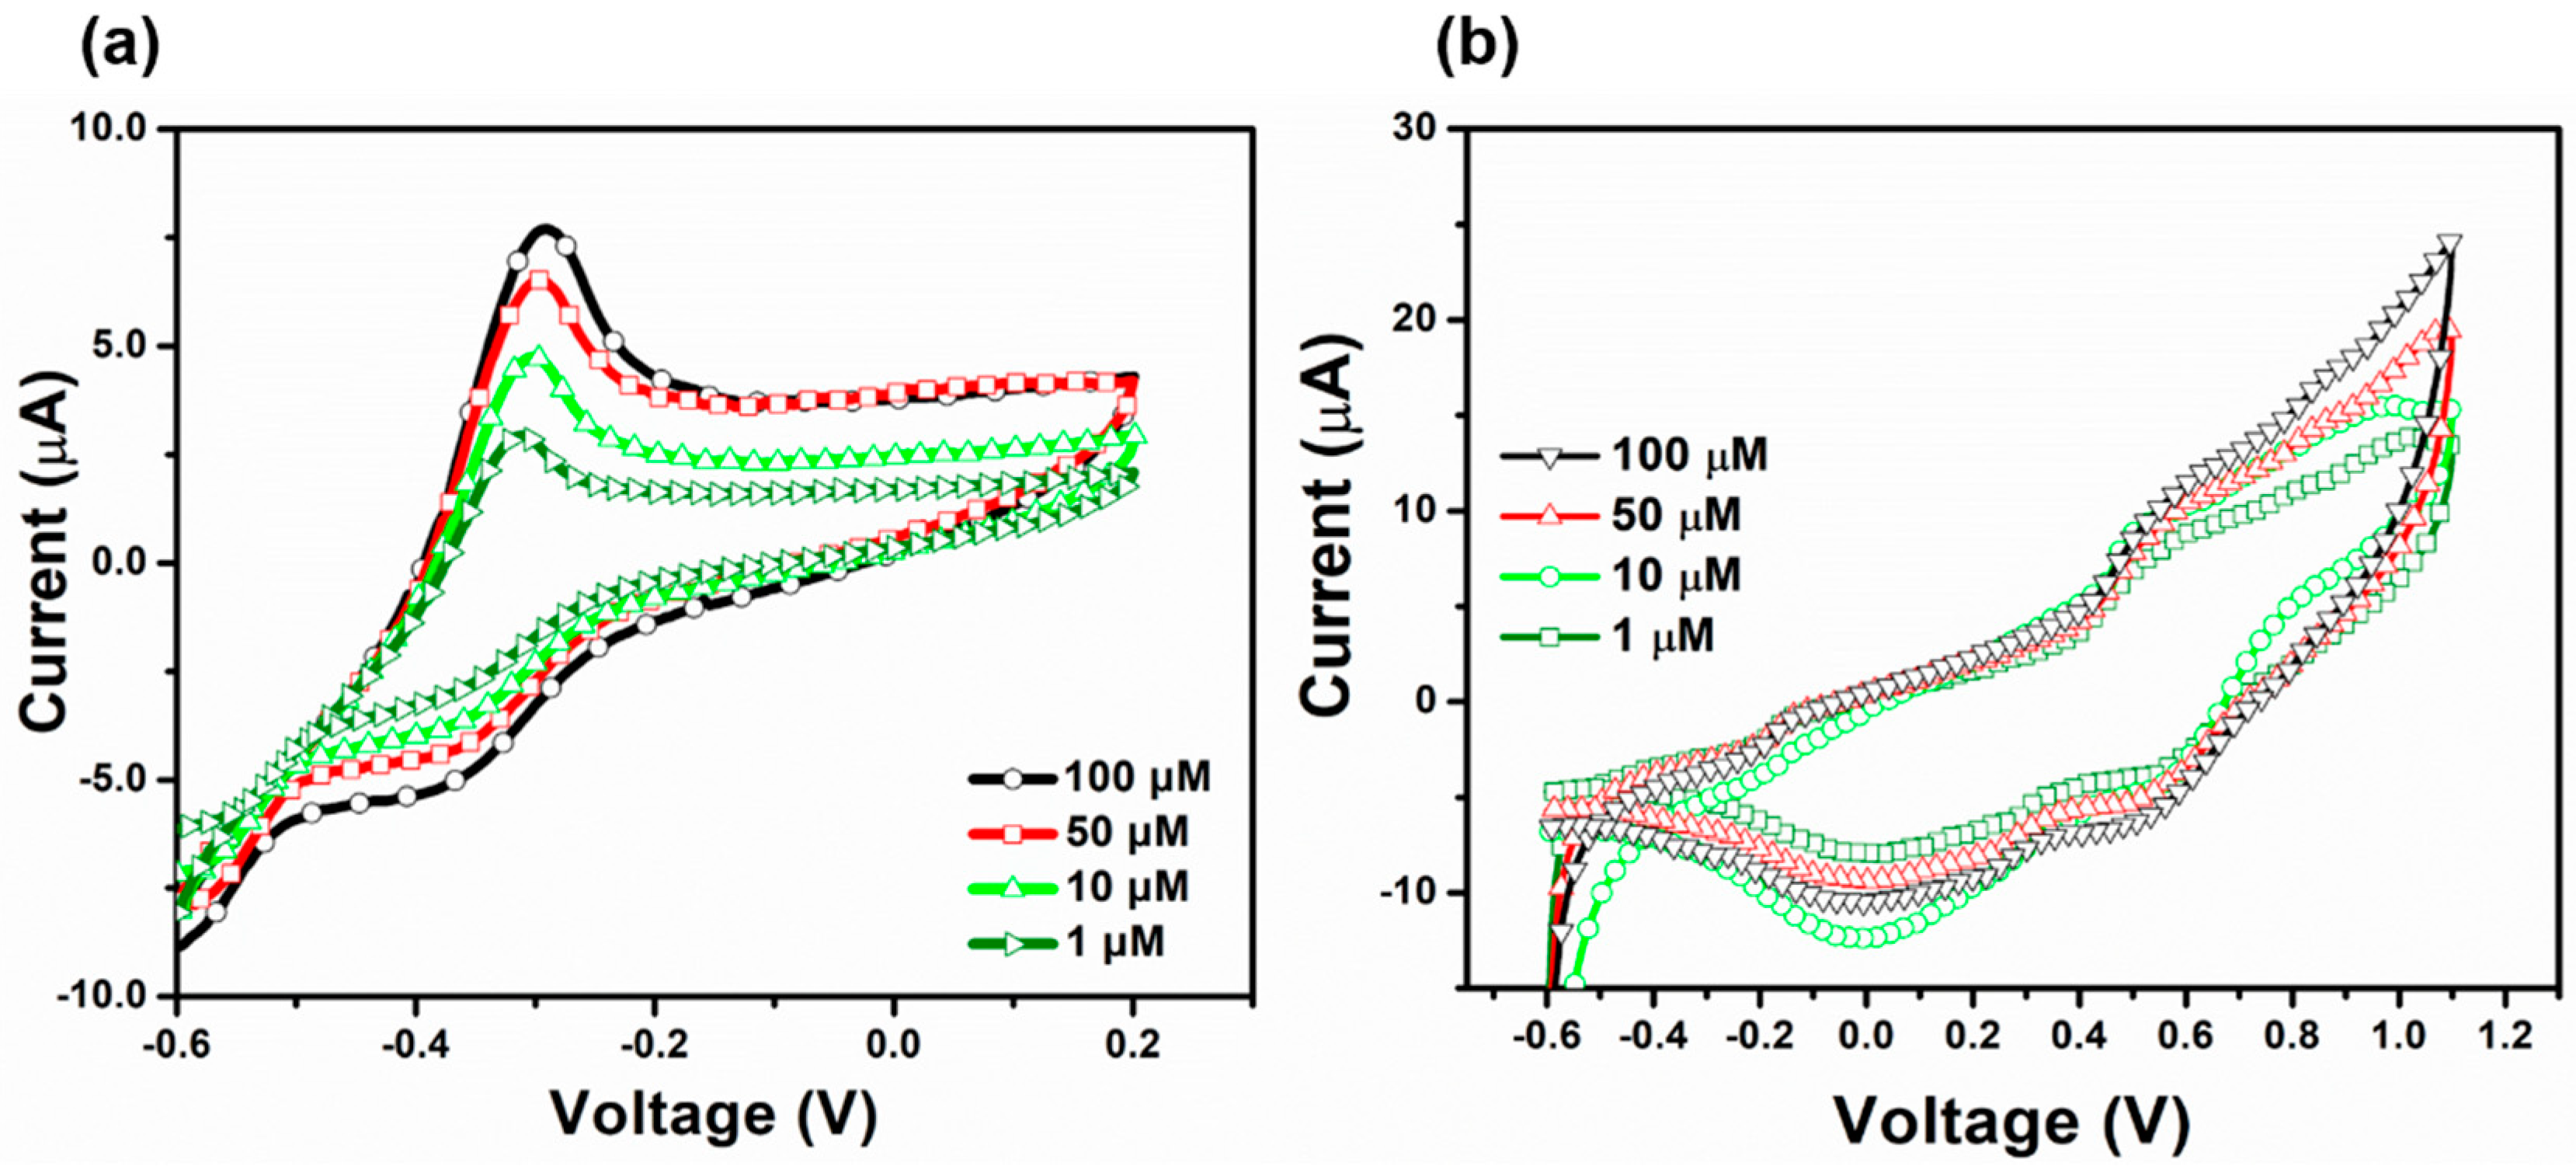
Figure 9.
(a) CV plots for real samples sensing in drinking water, and (b) stability test of MgNiO2 CFs modified electrode. (c) I–V curves and (d) current response (%) of MgNiO2 CFs modified electrode with interfering metal ions in PBS electrolyte.
Figure 9.
(a) CV plots for real samples sensing in drinking water, and (b) stability test of MgNiO2 CFs modified electrode. (c) I–V curves and (d) current response (%) of MgNiO2 CFs modified electrode with interfering metal ions in PBS electrolyte.

Table 1.
Comparison of different analytes and methods for the detection of the Hg2+ ion. Correct the reference in the table as [47,48,49].
| Material and Method | LOD (μM) | Sensitivity (μA.μM−1cm−2) | Linear Range (μM) | R2 | Ref. |
|---|---|---|---|---|---|
| AuNPs-GCE (Electrodeposition method) | 0.64 | 0.274 | - | - | [51] |
| AuNPs (Turkevich method) | 1.0 | 0.269 | 0.36–10 | - | [52] |
| Au-TiO2 (Sol-gel method) | 1.0 | - | 0.05–4 | - | [53] |
| MgNiO2 (Hydrothermal synthesis) | 11.7 | 8.22 | 10–100 | 0.9721 | This work |
Disclaimer/Publisher’s Note: The statements, opinions and data contained in all publications are solely those of the individual author(s) and contributor(s) and not of MDPI and/or the editor(s). MDPI and/or the editor(s) disclaim responsibility for any injury to people or property resulting from any ideas, methods, instructions or products referred to in the content. |
© 2023 by the authors. Licensee MDPI, Basel, Switzerland. This article is an open access article distributed under the terms and conditions of the Creative Commons Attribution (CC BY) license (https://creativecommons.org/licenses/by/4.0/).
Share and Cite
MDPI and ACS Style
Imran, M.; Kim, E.-B.; Kwak, D.-H.; Ameen, S. Porous MgNiO2 Chrysanthemum Flower Nanostructure Electrode for Toxic Hg2+ Ion Monitoring in Aquatic Media. Sensors 2023, 23, 7910. https://doi.org/10.3390/s23187910
AMA Style
Imran M, Kim E-B, Kwak D-H, Ameen S. Porous MgNiO2 Chrysanthemum Flower Nanostructure Electrode for Toxic Hg2+ Ion Monitoring in Aquatic Media. Sensors. 2023; 23(18):7910. https://doi.org/10.3390/s23187910
Chicago/Turabian StyleImran, Mohammad, Eun-Bi Kim, Dong-Heui Kwak, and Sadia Ameen. 2023. "Porous MgNiO2 Chrysanthemum Flower Nanostructure Electrode for Toxic Hg2+ Ion Monitoring in Aquatic Media" Sensors 23, no. 18: 7910. https://doi.org/10.3390/s23187910
Note that from the first issue of 2016, this journal uses article numbers instead of page numbers. See further details here.