
CVII: Enhancing Interpretability in Intelligent Sensor Systems via Computer Vision Interpretability Index


Abstract
:1. Introduction
- SHAP (SHapley Additive exPlanations): Originating from cooperative game theory, SHAP values offer a comprehensive understanding of feature importance by quantifying the contribution of each feature to a model’s output [19]. The model-agnostic nature of SHAP makes it adaptable to diverse machine learning models;
- LIME (Local Interpretable Model-agnostic Explanations): LIME addresses the challenge of complex global model behavior by creating interpretable surrogate models for local input space regions [20]. It generates perturbed samples, observes model predictions, and constructs interpretable models, providing locally faithful explanations;
- Occlusion Detection: This method involves systematically occluding specific input regions, such as portions of an image, to observe changes in model predictions [21]. It proves valuable in image-based models, revealing the importance of different regions in influencing predictions;
- Saliency Maps: Particularly prominent in computer vision tasks, saliency maps highlight relevant input regions influencing model decisions [22]. By calculating gradients with respect to input features, these saliency maps visualize areas crucial for the model’s output.
- We propose an interpretability index tailored for intelligent sensor applications, focusing on image classification, object detection, and semantic segmentation;
- We introduce a Computer Vision Interpretability Index benchmark that leverages the COCO (Microsoft Common Objects in Context) test set annotation as a reference, enabling developers to assess their models’ contributions to interpretability;
- We provide comprehensive experimental evidence showcasing the consistency and reliability of our CVII approach, both in benchmark comparisons and real-world scenarios.
2. Computer Vision Interpretability Index for Intelligent Sensors
2.1. Terminology: Main Tasks in Computer Vision
- Image Classification: Image classification is the task of assigning a single label or class to an entire image. Models such as ResNet50, DenseNet161, VGG-16, Inception-V3, and EfficientNet are commonly used for image classification [27]. In the realm of intelligent sensors, image classification empowers vision-based sensors to recognize and categorize scenes or objects in real time. For example, a smart traffic camera equipped with image classification capabilities can identify various types of vehicles, facilitating traffic monitoring and management.
- Object Detection: Object detection aims to locate objects within an image by providing bounding box coordinates and class labels for each detected object. There are two main categories of methods: one-stage methods and two-stage methods. One-stage methods like YOLO, SSD, and RetinaNet prioritize fast inference, while two-stage methods like Faster R-CNN, Mask R-CNN, and Cascade R-CNN focus on detection accuracy [28]. In the context of intelligent sensors, object detection is crucial for applications such as autonomous identification of pedestrians, vehicles, and obstacles, enabling autonomous navigation and collision avoidance.
- Image Segmentation: Image segmentation involves pixel-level semantic labeling to classify pixels (i.e., semantic segmentation) or to identify and delineate specific objects (i.e., instance segmentation) or both (i.e., panoptic segmentation) [29]. In the realm of intelligent sensors in vision, image segmentation is essential for fine-grained scene understanding. In autonomous robotics, sensors with image segmentation can identify objects of interest, enabling precise manipulation and navigation in unstructured environments.
- Benchmark Dataset: The Microsoft Common Objects in Context (MS COCO) dataset is widely used for object detection, segmentation, and captioning tasks [30]. It consists of images depicting everyday situations with annotated instances of 91 object categories. In this study, we utilized the COCO dataset, specifically the images and their annotations, to train and evaluate our approach.
2.2. Problem Statement and Challenge
2.3. Overview of CVII
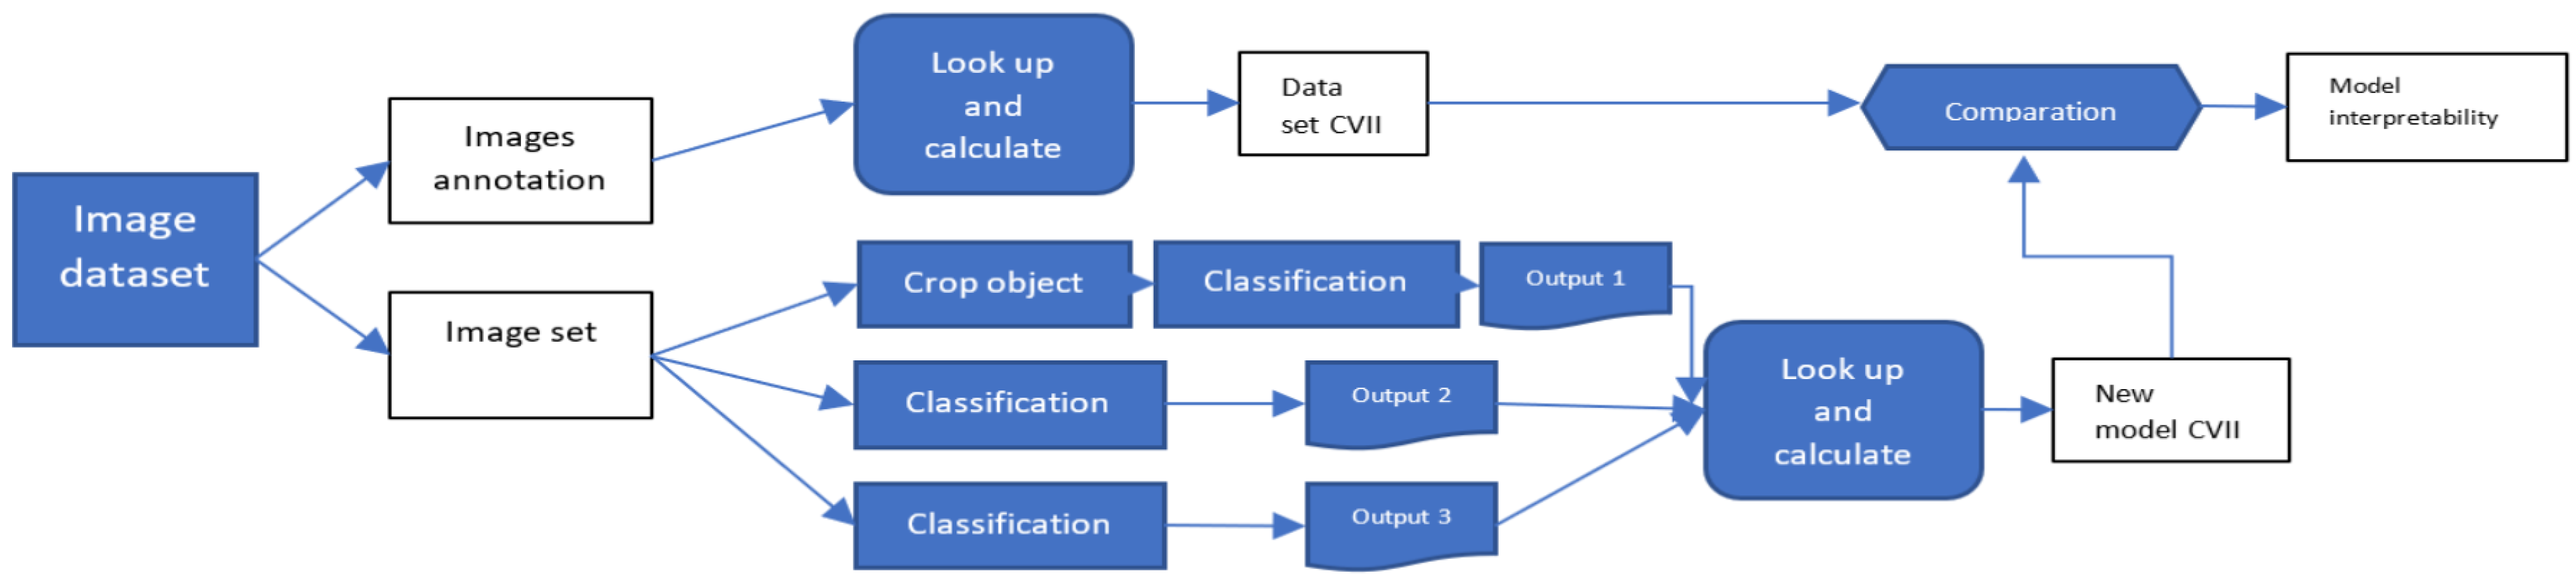
- First, for end-users utilizing deep learning models in computer-vision-related sensors, our index enables calculating the interpretability of an image by simply inputting the image into the model. This functionality is critical for ensuring that the outputs generated by machine learning algorithms are reliable and effective for decision-making purposes. By utilizing the CVII, users can gain valuable insights into the factors influencing the model’s predictions and grasp how the algorithm arrived at its conclusions.
- Second, our proposed model serves as a computational framework for comparative evaluation using the CVII. The CVII is calculated by averaging it across a benchmark dataset, which serves as our gold standard. Other developers can compare their models against this gold standard by incorporating their own models as part of our framework. This comparison enables developers to assess how closely their models approach the human-level interpretability provided by the benchmark dataset.
2.4. Interpretability Index Formulation
- Detection Ratio. The first part of the CVII captures the recognizability of the objects in an image, which is defined aswhere DR stands for detection ratio, OD stands for Objects Detected, and OE stands for objects exist. In the creation phase with a benchmark, we can collect the OD from the number of objects recognized by the model under construction and the OE from the annotations in the benchmark dataset for the image under examination.
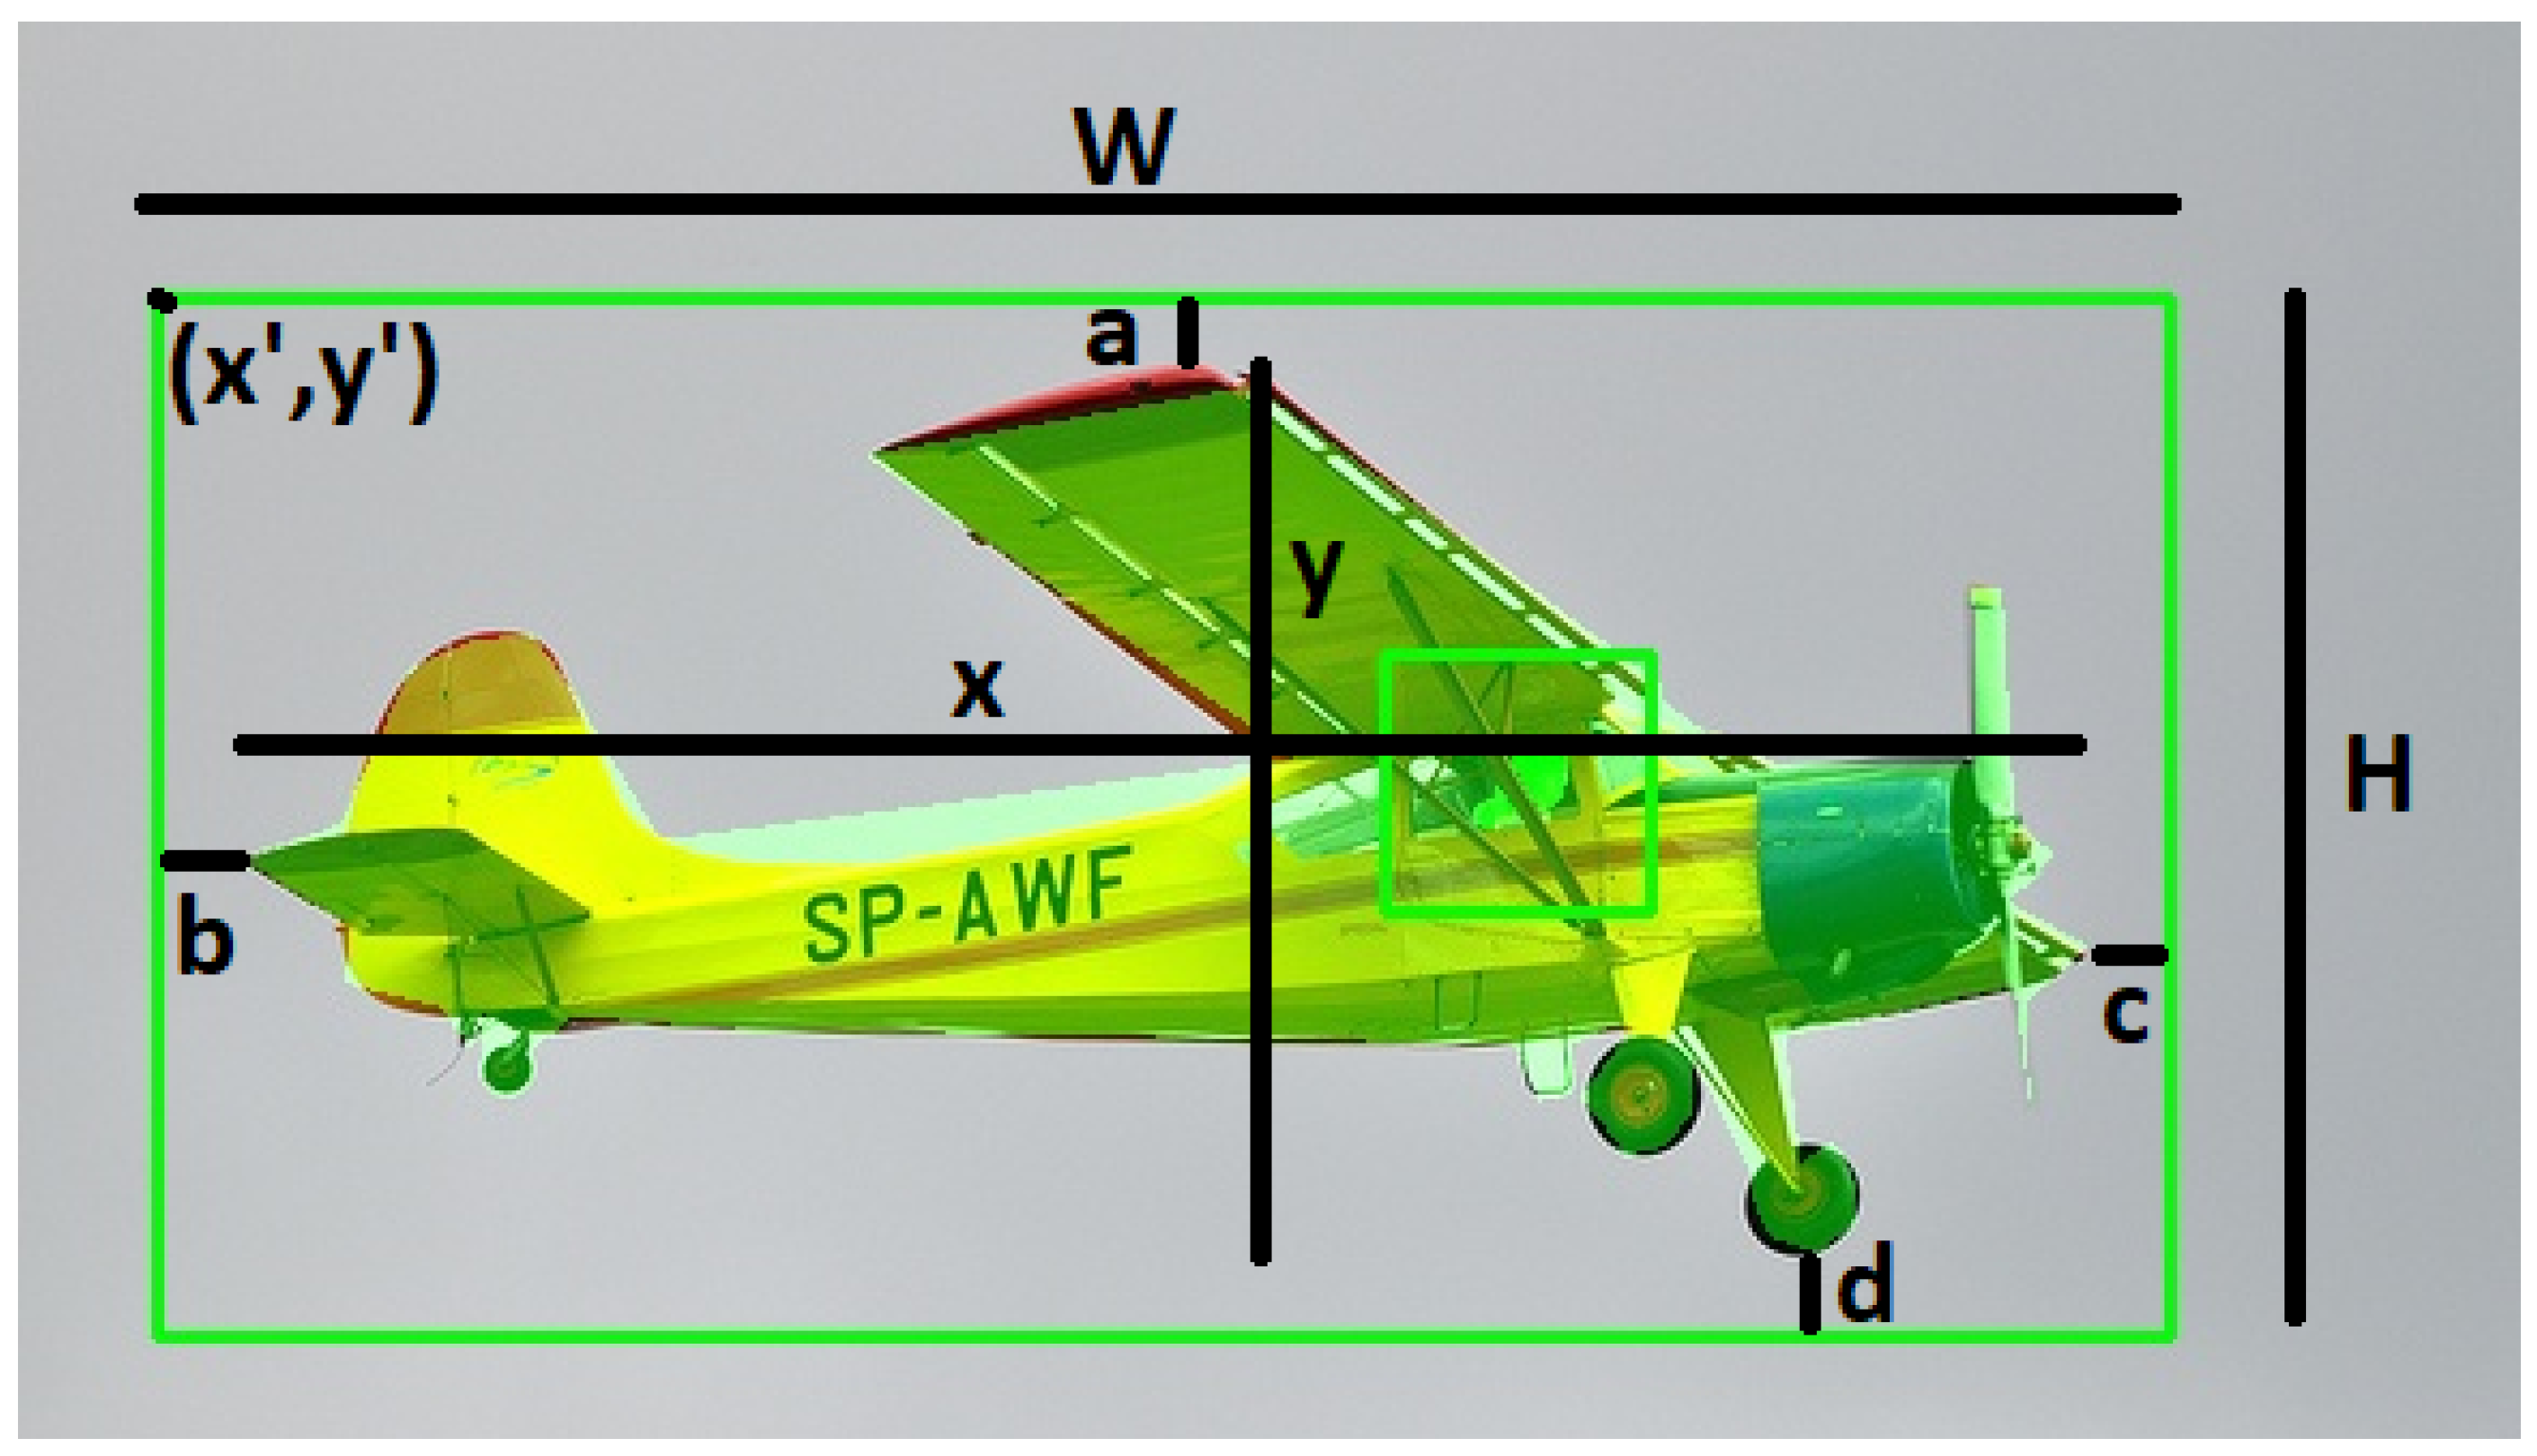
- Intersection over Union-Anchor Segmentation. The second part, which captures the resolution of the objects in the image, is computed using the three-part formula below:where IoU_AS represents the intersection over union-anchor segmentation that assesses the accuracy and fitness of bounding boxes and their annotations for objects in an image, where the greater the agreement between the two, the more likely the object can be detected. Specifically, for each bounding box i, AF, the anchor fitness is computed by summing the distances between the object and anchor box edges (i.e., distances a, b, c, and d of the four edges), divided by the object’s bounding box dimensions (i.e., width W and height H):Using the following equation, the centrality of the anchor box in the image can be determined. AC stands for anchor centerness, which is calculated asASMM, or anchor segmentation mismatch, is calculated using anchor segmentation unity (ASU), which assesses the overlap between the anchor and the segmentation:where an overlap of more than 50 percent indicates that the object is less likely to be obscured or divided. ASU is computed by counting the pixels in the segmentation that overlap with the anchor box.
- Classification Rate. All relevant metrics above can be derived from the output of computer vision algorithms and annotations in computer vision benchmarks. However, the accuracy of classification is only relevant when the method is applied in practical scenarios. This component is determined using the following formula:This metric, denoted as CR or classification rate, is a measure of the accuracy of object classification in computer vision systems. The underlying factor for CR is the value of classification correctness (CC), which is determined by analyzing the outputs of image classification, object recognition, and semantic segmentation applications. To ensure that CR remains within the range of 0 to 1, we incorporate a ratio term (AnchorSize/ImageSize). The membership of an object to a particular class is used to determine CC. When all three applications recognize the same class, the algorithm’s average confidence percentage is used to calculate CC. If the outputs of the three applications do not agree and assign different classes, CC is the average confidence of the applications that agree on the same class.
- Computer Vision Interpretability Index (CVII). Finally, the formula for computing the CVII is defined as follows:where , , and are integer hyperparameters that can be determined at the time of use, depending on the importance of each of the three components for the computer vision task. Note that IoU_AS has a punitive aspect, because it assumes that the algorithm correctly segments the pixels and determines the bounding boxes so that the rest of the analysis is meaningful, and if they do not match, the CVII of the image is reduced. Figure 2 provides a visual representation of the relevant annotations. Let and be the coordinates of the upper-left corner of the bounding box, W be the width of the bounding box, H be the height of the bounding box, x be the real width of the object, and y be the real height of the object. Let a be the distance between the upper edge of the bounding box and the top of the object, b be the distance between the left edge of the bounding box and the left side of the object, c be the distance between the right edge of the bounding box and the right side of the object, and d be the distance between the lower edge of the bounding box and the bottom of the object.
- CVII for Intelligent Sensors. Intelligent sensors equipped with DNNs can leverage the CVII, not only to recognize objects in images, but also provide insights into the factors influencing the model’s predictions. This is essential for ensuring safety, security, and precision in applications. Moreover, the CVII offers a benchmark for evaluating the interpretability of intelligent sensor models. Developers can compare their models against this benchmark, allowing them to assess its accessibility to humans, as provided by benchmark datasets and annotations. This comparison aids in standardizing and improving evaluation, ultimately leading to more reliable and trustworthy systems.
3. Experimental Results and Analysis
3.1. Implementation Details
		annotation = {’image_name’: name_only,
		’objects_seg’: {}, ’objects_OD’: {},
		’objects_class’: {}, ’CVII’:{}}
3.2. CVII for the COCO Dataset
3.3. CVII in a Real-World Setting
- R-CNN Mask ResNet50 FPN is an advanced instance segmentation model that accurately detects objects in an input image. It generates a list of detected objects with confidence scores and instance segmentation masks. By integrating Mask R-CNN ResNet50 FPN’s segmentation output with our architecture, we gain valuable insights into the image’s content and improve interpretability;
- YOLOv5 is a state-of-the-art object detection model that extracts meaningful features from input images. It uses a deep neural network architecture and multiple backbone networks. By incorporating YOLOv5 into our system, we can identify specific objects and their contribution to the CVII;
- ResNet50, a well-known deep neural network architecture, has been widely used for image classification and object detection tasks. To fine-tune the ResNet50 model, the 80 object types in the COCO dataset were organized into higher-order categories like animals, vehicles, and indoor items, depicting diverse aspects of daily life, we trained it using cropped images and employed transfer learning with pretrained weights. This process leveraged the model’s vast parameter space to improve its performance on a specific dataset.
3.4. Parameter Evaluation
3.5. Case Study
3.5.1. Case Study A
3.5.2. Case Study B
4. Challenges and Solutions
5. Discussions on Limitations, and Ethical and Regulatory Compliance
5.1. Limitations
5.2. Ethical and Regulatory Compliance
- Explainability and Trustworthiness: By providing a quantitative measure of interpretability, the CVII enhances the explainability of AI models. Transparent models are crucial for establishing trust in AI systems, especially in decision-making processes that impact individuals and society at large. Stakeholders can better understand how models arrive at decisions, fostering trust and acceptance;
- Ethical AI Development: The CVII can serve as a guiding metric for ethical AI development. The framework encourages developers to consider interpretability during model design and training. This emphasis on interpretability aligns with ethical AI principles, ensuring that models are not “black boxes” and that their decisions can be scrutinized for fairness, bias, and adherence to ethical standards;
- Regulatory Compliance: As AI continues to evolve, regulatory bodies are actively seeking ways to ensure responsible AI deployment. The CVII offers a standardized metric that aligns with regulatory efforts. It provides a measurable benchmark for evaluating the interpretability of AI systems, aiding compliance with emerging regulations that mandate transparency and accountability in AI applications.
- Human–AI Collaboration: The CVII facilitates collaboration between humans and AI systems. In scenarios where AI-driven decisions impact human lives, having interpretable models allows human stakeholders to intervene, question, or provide feedback. This collaborative approach aligns with ethical considerations, recognizing the importance of human oversight in critical decision-making processes.
6. Conclusions
Author Contributions
Funding
Institutional Review Board Statement
Informed Consent Statement
Data Availability Statement
Conflicts of Interest
References
- Ha, N.; Xu, K.; Ren, G.; Mitchell, A.; Ou, J.Z. Machine learning-enabled smart sensor systems. Adv. Intell. Syst. 2020, 2, 2000063. [Google Scholar] [CrossRef]
- Warden, P.; Stewart, M.; Plancher, B.; Katti, S.; Reddi, V.J. Machine learning sensors. Commun. ACM 2023, 66, 25–28. [Google Scholar] [CrossRef]
- Dai, N.; Lei, I.M.; Li, Z.; Li, Y.; Fang, P.; Zhong, J. Recent advances in wearable electromechanical sensors—Moving towards machine learning-assisted wearable sensing systems. Nano Energy 2023, 105, 108041. [Google Scholar] [CrossRef]
- Parks, D.; Prochaska, J.; Dong, S.; Cai, Z. Deep learning of quasar spectra to discover and characterize damped Lya systems. Mon. Not. R. Astron. Soc. 2018, 476, 4668–4685. [Google Scholar] [CrossRef]
- Wainberg, M.; Merico, D.; Delong, A.; Frey, B. Deep learning in biomedicine. Nat. Biotechnol. 2018, 36. [Google Scholar] [CrossRef] [PubMed]
- Xiong, H.; Alipanahi, B.; Lee, L.; Bretschneider, H.; Merico, D.; Yuen, R.; Hua, Y.; Gueroussov, S.; Najafabadi, H.; Hughes, T.; et al. The human splicing code reveals new insights into the genetic determinants of disease. Science 2015, 347, 1254806. [Google Scholar] [CrossRef] [PubMed]
- Zhang, S.; Hu, H.; Jiang, T.; Zhang, L.; Zeng, J. Titer: Predicting translation initiation sites by deep learning. Bioinformatics 2017, 33, 2270–2278. [Google Scholar] [CrossRef] [PubMed]
- Pouyanfar, S.; Sadiq, S.; Yan, Y.; Tian, H.; Tao, Y.; Reyes, M.P.; Shyu, M.L.; Chen, S.C.; Iyengar, S.S. A survey on deep learning: Algorithms, techniques, and applications. ACM Comput. Surv. (CSUR) 2018, 51, 1–36. [Google Scholar] [CrossRef]
- Burger, C.; Chen, L.; Le, T. “Are Your Explanations Reliable?” Investigating the Stability of LIME in Explaining Text Classifiers by Marrying XAI and Adversarial Attack. In Proceedings of the 2023 Conference on Empirical Methods in Natural Language Processing (EMNLP), Singapore, 6–10 December 2023; pp. 12831–12844. [Google Scholar]
- Krizhevsky, A.; Sutskever, I.; Hinton, G. ImageNet classification with deep convolutional neural networks. In Proceedings of the Advances in Neural Information Processing Systems, Lake Tahoe, NV, USA, 3–8 December 2012; pp. 1097–1105. [Google Scholar]
- He, K.; Zhang, X.; Ren, S.; Sun, J. Deep residual learning for image recognition. In Proceedings of the IEEE Conference on Computer Vision and Pattern Recognition, Las Vegas, NV, USA, 27–30 June 2016; pp. 770–778. [Google Scholar]
- Hinton, G.; Deng, L.; Yu, D.; Dahl, G.; Mohamed, A.R.; Jaitly, N.; Senior, A.; Vanhoucke, V.; Nguyen, P.; Sainath, T.; et al. Deep neural networks for acoustic modeling in speech recognition. IEEE Signal Process. Mag. 2012, 29, 82–97. [Google Scholar] [CrossRef]
- Sutskever, I.; Vinyals, O.; Le, Q. Sequence to sequence learning with neural networks. In Proceedings of the Advances in Neural Information Processing Systems, Montreal, QC, Canada, 8–13 December 2014; pp. 3104–3112. [Google Scholar]
- LeCun, Y.; Bengio, Y.; Hinton, G. Deep learning. Nature 2015, 521, 436–444. [Google Scholar] [CrossRef]
- Alahmari, F.; Naim, A.; Alqahtani, H. E-Learning Modeling Technique and Convolution Neural Networks in Online Education. In IoT-Enabled Convolutional Neural Networks: Techniques and Applications; River Publishers: Aalborg, Denmark, 2023; pp. 261–295. [Google Scholar]
- Krichen, M. Convolutional neural networks: A survey. Computers 2023, 12, 151. [Google Scholar] [CrossRef]
- Szegedy, C.; Zaremba, W.; Sutskever, I.; Bruna, J.; Erhan, D.; Goodfellow, I.; Fergus, R. Intriguing properties of neural networks. In Proceedings of the International Conference on Learning Representations, Banff, AB, Canada, 14–16 April 2014. [Google Scholar]
- Carvalho, D.V.; Pereira, E.M.; Cardoso, J.S. Machine learning interpretability: A survey on methods and metrics. Electronics 2019, 8, 832. [Google Scholar] [CrossRef]
- Lundberg, S.; Lee, S. A unified approach to interpreting model predictions. In Proceedings of the Advances in Neural Information Processing Systems, Long Beach, CA, USA, 4–9 December 2017; Volume 30. [Google Scholar]
- Ribeiro, M.; Singh, S.; Guestrin, C. “Why should I trust you?” Explaining the predictions of any classifier. In Proceedings of the 22nd ACM SIGKDD International Conference on Knowledge Discovery and Data Mining, San Francisco, CA, USA, 13–17 August 2016; pp. 1135–1144. [Google Scholar]
- Zeiler, M.; Fergus, R. Visualizing and understanding convolutional networks. In Proceedings of the Computer Vision–ECCV 2014: 13th European Conference, Zurich, Switzerland, 6–12 September 2014; Volume 13, pp. 818–833. [Google Scholar]
- Simonyan, K.; Vedaldi, A.; Zisserman, A. Deep inside convolutional networks: Visualising image classification models and saliency maps. arXiv 2013, arXiv:1312.6034. [Google Scholar]
- Feng, X.; Jiang, Y.; Yang, X.; Du, M.; Li, X. Computer vision algorithms and hardware implementations: A survey. Integration 2019, 69, 309–320. [Google Scholar] [CrossRef]
- Molnar, C.; Casalicchio, G.; Bischl, B. Interpretable machine learning–a brief history, state-of-the-art and challenges. In Proceedings of the Joint European Conference on Machine Learning and Knowledge Discovery in Databases, Ghent, Belgium, 14–18 September 2020; pp. 417–431. [Google Scholar]
- Doshi-Velez, F.; Kim, B. Towards a rigorous science of interpretable machine learning. arXiv 2017, arXiv:1702.08608. [Google Scholar]
- Schmidt, P.; Biessmann, F. Quantifying interpretability and trust in machine learning systems. arXiv 2019, arXiv:1901.08558. [Google Scholar]
- Wang, W.; Yang, Y.; Wang, X.; Wang, W.; Li, J. Development of convolutional neural network and its application in image classification: A survey. Opt. Eng. 2019, 58, 040901. [Google Scholar] [CrossRef]
- Zou, Z.; Chen, K.; Shi, Z.; Guo, Y.; Ye, J. Object detection in 20 years: A survey. Proc. IEEE 2023, 111, 257–276. [Google Scholar] [CrossRef]
- Asgari Taghanaki, S.; Abhishek, K.; Cohen, J.P.; Cohen-Adad, J.; Hamarneh, G. Deep semantic segmentation of natural and medical images: A review. Artif. Intell. Rev. 2021, 54, 137–178. [Google Scholar] [CrossRef]
- Lin, T.Y.; Maire, M.; Belongie, S.; Hays, J.; Perona, P.; Ramanan, D.; Dollár, P.; Zitnick, C.L. Microsoft COCO: Common objects in context. In Proceedings of the European Conference on Computer Vision, Zurich, Switzerland, 6–12 September 2014; Springer: Berlin/Heidelberg, Germany; pp. 740–755. [Google Scholar]
- Zhang, Y.; Tiňo, P.; Leonardis, A.; Tang, K. A survey on neural network interpretability. IEEE Trans. Emerg. Top. Comput. Intell. 2021, 5, 726–742. [Google Scholar] [CrossRef]
- Hassabis, D.; Kumaran, D.; Summerfield, C.; Botvinick, M. Neuroscience-inspired artificial intelligence. Neuron 2017, 95, 245–258. [Google Scholar] [CrossRef] [PubMed]


| Using | CVII1 | CVII2 | CVII3 | CVII4 | CVII5 |
|---|---|---|---|---|---|
| COCO Ann. | 0.73898 | 0.58142 | 0.83352 | 0.66860 | 0.77721 |
| ML models | 0.53411 | 0.43121 | 0.59584 | 0.52809 | 0.59103 |
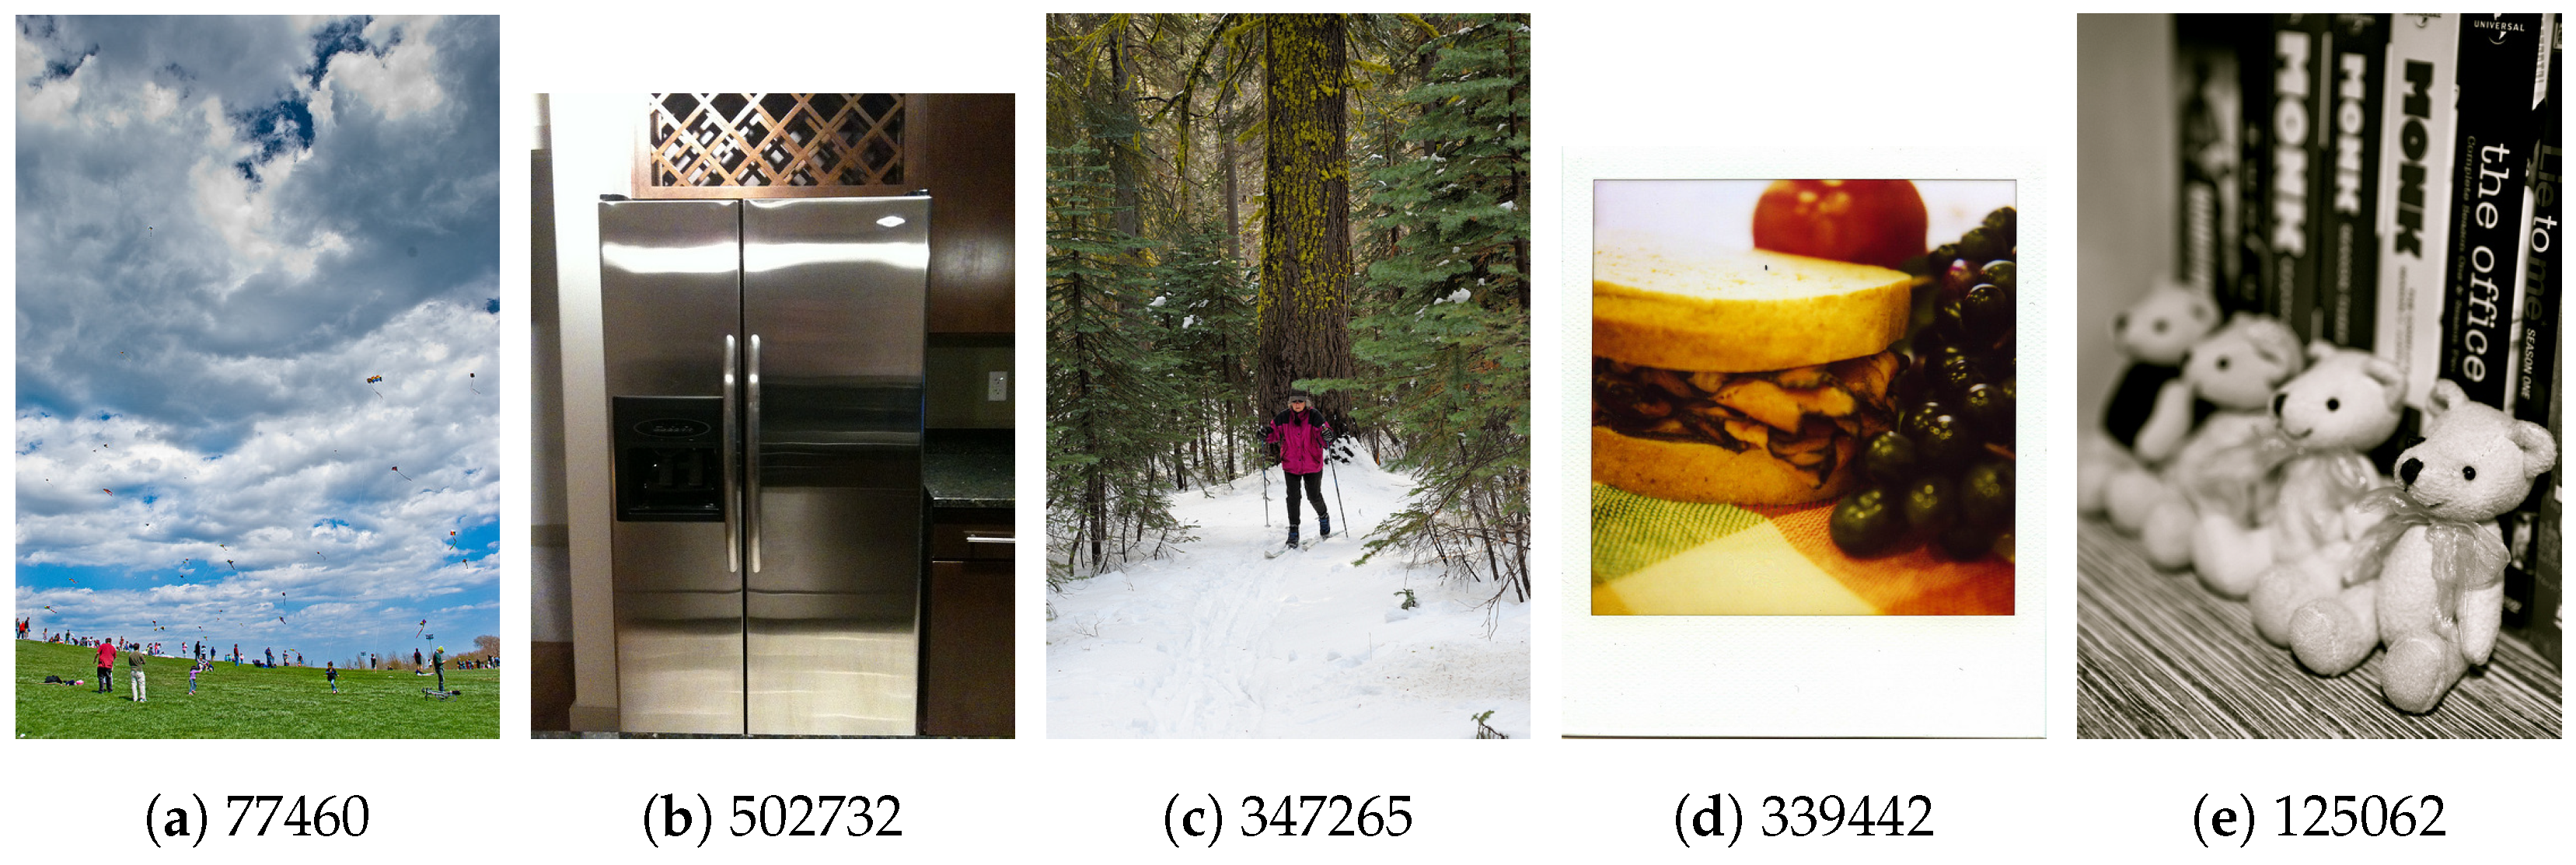
| Image No. | CVII1 | CVII2 | CVII3 | CVII4 | CVII5 | Object Count | Object Types | Is Crowded |
|---|---|---|---|---|---|---|---|---|
| 125062 | 0.89568 | 0.80905 | 0.94767 | 0.88243 | 0.93706 | 10 | 2 | No |
| 347265 | 0.58012 | 0.27791 | 0.76144 | 0.49187 | 0.69084 | 2 | 2 | No |
| 339442 | 0.97078 | 0.94958 | 0.98349 | 0.96476 | 0.97868 | 3 | 3 | No |
| 502732 | 0.99870 | 0.99740 | 0.99948 | 0.99870 | 0.99948 | 1 | 1 | No |
| 77460 | 0.29223 | 0.00510 | 0.52464 | 0.05192 | 0.33239 | 28 | 2 | Yes |
Disclaimer/Publisher’s Note: The statements, opinions and data contained in all publications are solely those of the individual author(s) and contributor(s) and not of MDPI and/or the editor(s). MDPI and/or the editor(s) disclaim responsibility for any injury to people or property resulting from any ideas, methods, instructions or products referred to in the content. |
© 2023 by the authors. Licensee MDPI, Basel, Switzerland. This article is an open access article distributed under the terms and conditions of the Creative Commons Attribution (CC BY) license (https://creativecommons.org/licenses/by/4.0/).
Share and Cite
Mohammadi, H.; Thirunarayan, K.; Chen, L. CVII: Enhancing Interpretability in Intelligent Sensor Systems via Computer Vision Interpretability Index. Sensors 2023, 23, 9893. https://doi.org/10.3390/s23249893
Mohammadi H, Thirunarayan K, Chen L. CVII: Enhancing Interpretability in Intelligent Sensor Systems via Computer Vision Interpretability Index. Sensors. 2023; 23(24):9893. https://doi.org/10.3390/s23249893
Chicago/Turabian StyleMohammadi, Hossein, Krishnaprasad Thirunarayan, and Lingwei Chen. 2023. "CVII: Enhancing Interpretability in Intelligent Sensor Systems via Computer Vision Interpretability Index" Sensors 23, no. 24: 9893. https://doi.org/10.3390/s23249893
APA StyleMohammadi, H., Thirunarayan, K., & Chen, L. (2023). CVII: Enhancing Interpretability in Intelligent Sensor Systems via Computer Vision Interpretability Index. Sensors, 23(24), 9893. https://doi.org/10.3390/s23249893