
Optimized EWT-Seq2Seq-LSTM with Attention Mechanism to Insulators Fault Prediction
by
 , , , and
Anne Carolina Rodrigues Klaar
1,
Stefano Frizzo Stefenon
2,3,4,* ,
,
Laio Oriel Seman
5,6 ,
,
Viviana Cocco Mariani
4,7 and
Leandro dos Santos Coelho
4,6 1
Graduate Program in Education, University of Planalto Catarinense, Lages 88509-900, Brazil
2
Digital Industry Center, Fondazione Bruno Kessler, 38123 Trento, Italy
3
Department of Mathematics, Computer Science and Physics, University of Udine, 33100 Udine, Italy
4
Department of Electrical Engineering, Federal University of Parana, Curitiba 81530-000, Brazil
5
Graduate Program in Applied Computer Science, University of Vale do Itajai, Itajai 88302-901, Brazil
6
Industrial and Systems Engineering Graduate Program, Pontifical Catholic University of Parana, Curitiba 80215-901, Brazil
7
Mechanical Engineering Graduate Program, Pontifical Catholic University of Parana, Curitiba 80215-901, Brazil
*
Author to whom correspondence should be addressed.
Sensors 2023, 23(6), 3202; https://doi.org/10.3390/s23063202
Submission received: 23 February 2023
/
Revised: 9 March 2023
/
Accepted: 14 March 2023
/
Published: 17 March 2023
(This article belongs to the Special Issue Sensors for Measurements and Diagnostic in Electrical Power Systems)
Abstract
:Insulators installed outdoors are vulnerable to the accumulation of contaminants on their surface, which raise their conductivity and increase leakage current until a flashover occurs. To improve the reliability of the electrical power system, it is possible to evaluate the development of the fault in relation to the increase in leakage current and thus predict whether a shutdown may occur. This paper proposes the use of empirical wavelet transform (EWT) to reduce the influence of non-representative variations and combines the attention mechanism with a long short-term memory (LSTM) recurrent network for prediction. The Optuna framework has been applied for hyperparameter optimization, resulting in a method called optimized EWT-Seq2Seq-LSTM with attention. The proposed model had a 10.17% lower mean square error (MSE) than the standard LSTM and a 5.36% lower MSE than the model without optimization, showing that the attention mechanism and hyperparameter optimization is a promising strategy.
1. Introduction
Insulators that are installed outdoors are exposed to environmental variations such as the accumulation of contaminants on their surface, which are mainly from industrial waste, salinity in coastal regions, or dust from unpaved roads [1]. These contaminants increase the surface conductivity of the network’s insulating components, causing higher leakage currents until a flashover occurs. The power grid is monitored through inspections of the electrical power system by specialized personnel, however, it is difficult to determine the specific location of failure when the faults are not visibly distinguishable [2].
Since there is little visual difference between faulty and non-faulty contaminated insulators, the classification of adverse conditions regarding this condition is a challenging task [3]. When there is a missing or partially broken insulator, this can be easily noticed, and finding the location of a fault in which the insulator is complete is more difficult; for this reason, specific types of equipment are used such as ultrasound detector, radio interference, ultraviolet camera, among others. One way to assess the impact of contamination on the grid insulation is the leakage current [4].
Although leakage current is a direct measurement method in which it is necessary to be connected to the electric potential, and this potential can be in high-voltage, this method is one of the most efficient to determine the supportability of an insulator to adverse conditions [5]. For this reason, the leakage current values from contaminated insulators will be used for the evaluation presented in this paper. Therefore, the data used are from a high-voltage laboratory experiment under controlled conditions.
The basic sequence-to-sequence (Seq2Seq) long short-term memory (LSTM) model for time series forecasting comprises an encoder LSTM that processes the input time series data and generates a context vector of fixed length, and a decoder LSTM that generates the forecasted values. This approach may not be optimal, however, when the time series data are lengthy or contain intricate patterns that are difficult to capture with a context vector of the specified length [6].
Attention mechanisms can circumvent these limitations by enabling the model to selectively concentrate on the most significant portions of the input time series data at each stage of decoding. In particular, the attention mechanism computes a set of attention weights for each input time step, indicating how much attention the model should pay to that time step when generating the output forecast [7].
By employing attention, the model can selectively focus on the most pertinent portions of the input time series data, such as the time steps that contain significant patterns or trends, and disregard the less pertinent portions of the data. This can enhance the model’s capacity to identify complex patterns in time series data and produce accurate forecasts [8].
On the other side, the empirical wavelet transform (EWT) is a mathematical tool that can be used to decompose time series data into various frequency bands with the goal of capturing the data’s essence and reducing the impact of noise or irrelevant information. EWT has been utilized in a variety of time series analysis applications, such as signal processing, image analysis, finance, and energy [9].
The EWT is founded on the concept of wavelets, which are functions that can represent data in both the time and frequency domains. In contrast to conventional Fourier analysis, which decomposes data into sinusoids with fixed frequencies, wavelets can represent data in terms of localized oscillations of varying frequencies and scales. This permits EWT to capture both short-term and long-term patterns in time series, making it more effective than techniques that solely rely on Fourier analysis to capture the essence of the data [10].
Thus, given the promising outcomes of the attention mechanism and the improvement in time series forecasting by the trend analysis with the EWT technique, this paper proposes a modified long short-term memory network model, named optimized EWT-Seq2Seq-LSTM with attention, wherein the Seq2Seq evaluation is based on two insulators.
The main contributions of this paper are:
- The use of two separate experiments (measuring the leakage current rise of contaminated high-voltage power grid insulators) for Seq2Seq evaluation enhances the generalizability of the analysis. This contribution addresses the need for robustness in forecasting models, as it ensures that the model can generalize well to unseen data.
- Model optimization using Optuna improves the selection of appropriate hyperparameters for the model, and the attention mechanism improves the model’s ability to predict forward values, thereby achieving an optimized structure. This contribution addresses the need for improved accuracy in forecasting models, as it ensures that the model is optimized to perform well on the given dataset.
- The use of empirical wavelet transform reduces signal variations that are not representative and maintains the trend variability, which is the focus of the failure prediction analysis evaluated in this paper. This contribution addresses the need for improved data-preprocessing techniques, as it ensures that the model is trained on meaningful features that capture the underlying patterns in the data.
The remainder of this paper is organized in the following way: Section 2 presents related works regarding time series analysis for fault prediction, and the proposed method is explained in Section 3. Section 4 is focused on the discussion of the results, and in Section 5, a conclusion and future directions of research are drawn.
2. Related Works
Fault prediction in insulators is a process of detecting potential faults or failures in electrical insulation systems before they occur. This helps prevent unplanned outages, equipment damage, and improves the overall power system reliability [11]. There are several techniques used for fault prediction in insulators, including a partial discharge measurement [12], thermal imaging [13], acoustic analysis [14], and online monitoring systems [15]. Using these techniques, it is possible to effectively predict faults in insulators and prevent them causing unplanned outages and equipment damage [16].
One means of monitoring that is rather promising is the evaluation of leakage current, which can be analyzed in the laboratory during an experiment, or after a controlled test is conducted [17]. An insulator leakage current refers to the flow of electrical current through an insulator that is intended to be an electrical barrier. This flow of current is usually due to defects or damages in the insulation system, which can result in partial discharge or the complete failure of the insulation [18].
By the controlling the current leakage levels, power system operators can improve the reliability, efficiency, and longevity of their equipment, reducing the risk of unplanned outages and equipment damage [19]. The leakage current prediction through time series analysis might be a means of helping in the monitoring of the electrical power system, which is the focus of the research presented in this paper.
Time Series Forecasting Using LSTM with Attention
Time series forecasting is a common problem in many fields, including finance, healthcare, weather, transportation, and energy [20]. The appropriate forecasting of these series is important for making informed decisions and achieving optimal results. Learning to correctly predict time series can be challenging, but with the use of advanced machine learning models, such as LSTM, this has become more feasible [21].
LSTM is a recurrent neural network developed to handle complex time series. It is capable of handling long-term information and mitigating the forgetting of relevant information, making it more effective than other traditional machine learning techniques [22]. When training an LSTM model to forecast a time series, the model learns to identify patterns and trends in the series, including both short- and long-term trends. This enables the model to predict future values more accurately than if a simple forecasting technique, such as a moving average, were used [23].
In summary, using the LSTM for time series forecasting is a powerful and effective approach [20]. However, it is important to keep in mind that achieving reliable time series forecasting requires a combination of advanced machine learning approaches, reliable data, and technical skills to correctly adjust the model parameters. Several authors have presented promising works using the LSTM for time series forecasting [24].
A day-ahead residential load forecasting model based on feature engineering, pooling, and a hybrid model combining LSTM with a self-attention mechanism was proposed by Zang et al. [25]. The case studies were made on a dataset containing multiple residential users. The results showed the superiority of the proposed load forecasting model through comparison with other models. The volatility and intermittence of solar energy influence the accuracy of photovoltaic power prediction.
To improve the forecasting of this field, Qu et al. [26] proposed an attention-based long-term and short-term temporal neural network prediction model assembled using the convolutional neural network, LSTM, and an attention mechanism under the multiple relevant and target variables prediction pattern. The proposed model was superior when compared to classical models. Important parameters affecting the forecasting range of the model were analyzed, and suggestions were provided.
A univariate deep-LSTM-based stackable autoencoder model, fitted with a multi-stage attention mechanism for short-term load forecasting (15 and 30 min ahead) was proposed by Fazlipour et al. [27]. The model performance was evaluated by several tests employing realistic New England energy market data across three indices, demonstrating the superiority of the model and its strength in offline and online load forecasting. An attention mechanism was able to capture the temporal merit features lying in the LSTM unit.
Lin et al. [28] applied dual-stage attention based on LSTM for short-term load forecasting. Firstly, a feature attention-based encoder was constructed to calculate the correlation of the input features with the electricity load at each time step. Secondly, a temporal attention-based decoder was developed to mine the time dependencies. An LSTM model integrated these attention results and probabilistic predictions were obtained using a pinball loss function. The efficacy of the model was verified on the GEFCom2014 dataset, showing a higher generality capability compared to other state-of-the-art forecasting models.
An LSTM model enhanced by a dual-attention mechanism was proposed by Zhu et al. [29], which was inserted into the encoder–decoder to take into account the effects of different factors and time nodes to simultaneously analyze the characteristics of daily peak load to achieve more accurate prediction results. Experiments on a dataset of one city in eastern China showed that the proposed methodology provided promising results.
A deep learning-based interval prediction model combining fuzzy information granulation, attention mechanism, and LSTM was proposed by Li et al. [30] to predict the building energy consumption presenting future uncertainties in the form of ranges. A real-building dataset was used showing that attention-based LSTM provides better an interval prediction performance than conventional LSTM. Thus, the attention mechanism gains significant advantages by increasing the efficiency with which the model uses the information.
Meng et al. [31] applied the empirical wavelet transform to decompose the input features into multiple components after a hybrid attention mechanism-based LSTM was proposed as the forecasting model. The attention mechanism was used to dynamically investigate the importance of different input features, for example, the effect of renewable energy (wind and solar power generation) on the electricity price prediction. The model was validated on the datasets of the Danish electricity market with a high quantity of renewable energy, showing that the proposed model is superior to other hybrid models.
For simultaneously predicting both the active and reactive power, a new multi-task regression was proposed by Qin et al. [32] based on LSTM supported by the attention mechanism, to prevent performance deterioration, which was employed to accurately predict loads of a substation. The model was compared with other single-task load forecasting models achieving superior accuracy on both subtasks.
Dai et al. [33] proposed a novel combined short-term power load forecasting model, employing the weighted gray relational projection algorithm to distinguish the holidays and non-holidays, using the attention mechanism and extreme gradient boosting (XGBoost) to improve the LSTM model. The datasets from Singapore’s and Norway’s power markets were used to evaluate the prediction model by comparing it with six other models, outperforming in effectiveness, accuracy, and practicability.
Using an upgraded stacked gated recurrent unit–recurrent neural network for both uni-variate and multi-variate situations, Xia et al. [34] introduced a unique method for the prediction of renewable energy generation and electrical load. The suggested method is tested in two tests that anticipate the electricity load based on the historical energy consumption data and wind power generation utilizing a variety of meteorological conditions.
The ultrasound device is a piece of equipment used for the examination of the electric power system. It produces an audible noise based on a time series that is used to spot potential problems. A hybrid approach was suggested by [35] that employs the group method of data handling model for time series prediction and the wavelet energy coefficient for feature extraction. In comparison to LSTM and adaptive neuro-fuzzy inference systems, the proposed method demonstrated accuracy and was found to be considerably faster.
Three deep learning classification and regression models for fault region identification, classification, and location prediction were introduced by [36]. To model the spatiotemporal sequences of high-dimensional multivariate features and produce reliable classification and prediction results, deep sequential learning is used in conjunction with long short-term memory. Data for training and testing are gathered while various sorts of transmission line faults are introduced at various sites throughout various areas.
To find the best transformer model and locate various power system problems and unpredictable conditions, Thomas and K. V. [37] suggested a neural architecture search approach. To automatically construct ideal Transformer architectures with a lower search time cost, the authors applied the differential architecture search algorithm. The suggested fault analysis was performed using the VSB power line fault detection database and the industry-standard IEEE 14 bus distribution system. The real-world power line data for fault detection was used to examine the transferability of the suggested method’s architecture.
An overview and investigation of the fault prediction and fault location areas were presented in [38]. To achieve this, the methods and viewpoints currently in use in the context of fault prediction are first evaluated, followed by an analysis of fault location. In conventional distribution networks, smart grids, and microgrids, this paper examines numerous systems, their benefits and drawbacks, technical reports, and patents.
The diagnosis of power system faults using machine learning was thoroughly reviewed by [39]. The success of machine learning approaches was first attributed to attempts to include the problems with traditional fault diagnosis. Then, several fault diagnosis methods, including supervised and unsupervised learning approaches, were individually addressed. The benefits and drawbacks of each fault detection method were also covered, which will aid readers in choosing the best method for their own research.
Considering the high capabilities of the LSTM with the attention mechanism [40], in this paper, this model is used to forecast the increase in leakage current in contaminated insulators, as will be explained in detail in the next section. Besides the model employed, the considered dataset and the EWT technique used for signal preprocessing and denoising (noise reduction) will be explained. A summary of LSTM applied to forecasting works discussed in this chapter is presented in Table 1.
3. Methodology
LSTM with attention is designed to handle such complex patterns and dependencies. The attention mechanism in LSTM allows the model to focus on the most important inputs at each time step when making predictions. This can improve the model’s performance and stability compared to traditional LSTM models [41].
In the LSTM with attention applied to time series forecasting, the input data are typically divided into a series of time steps and processed through the LSTM. The attention mechanism then provides a weighted sum of the hidden states of the LSTM units, which is used as input to a fully connected layer for the final prediction [42].
3.1. Luong Attention Mechanism
The Luong attention mechanism is a method for calculating the attention weights in a neural network, including but not limited to the Seq2Seq model [43]. Given a set of hidden states , the attention mechanism computes a set of attention weights that represent the relative importance of each hidden state in creating the output [44]. Attention weights are calculated as follows:
where is a score that measures the compatibility between the target hidden state and the decoder state at the previous time step. The score is calculated using one of several functions, including dot-product, general, and concat. The dot-product function calculates the dot-product of the target hidden state and the decoder state, as follows:
The general function calculates the dot-product of the target hidden state and a linear transformation of the decoder state, as follows:
where is a learned parameter. The concat function concatenates the target hidden state and the decoder state, and passes the concatenation through a feedforward neural network as follows:
where is a learned parameter and denotes concatenation.
The attention weights are then used to compute a weighted sum of the hidden states, which is used as input to the decoder at the current time step. The weighted sum is computed as follows:
Notice that the function used to determine the score depends on the job and available data. Typically, the dot-product function is employed when the dimensions of the hidden states are identical, and the general function is used when the dimensions are different. The concat function can capture more intricate interactions between the hidden and decoder states, but it needs to learn more parameters. A general overview of the method is given in Algorithm 1.
| Algorithm 1: Luong Attention Mechanism |
 |
3.2. Encoder–Decoder LSTM
The encoder–decoder LSTM with attention is a form of neural network design that can be used for forecasting time series. In time series forecasting, the objective is to predict the future values of a time series using its historical values [45]. In this instance, the encoder LSTM analyzes the input time series and compresses it into the encoding, a vector of fixed length. The encoding serves as the network’s memory by summarizing the pertinent information in the time series. Let us denote the input time series as , where T is the length of the time series [46]. The hidden state of the encoder LSTM at time step t is denoted as . The encoding is calculated as the final hidden state of the encoder, .
The decoder LSTM takes the encoding and generates the forecast, , where M is the number of steps to forecast. The decoder LSTM also has an attention mechanism which allows it to focus on different parts of the encoding at each time step and generate the forecast one step at a time [47]. At time step t, the decoder computes the attention weights over the encoding and calculates the context vector as a weighted sum of the encodings, as follows:
The decoder then updates its hidden state as a function of the previous hidden state , the current input , and the context vector , as follows:
where f is the LSTM function. Finally, the decoder generates the next forecast by passing the hidden state through a fully connected layer with a linear activation function, as follows:
where and are learned parameters.
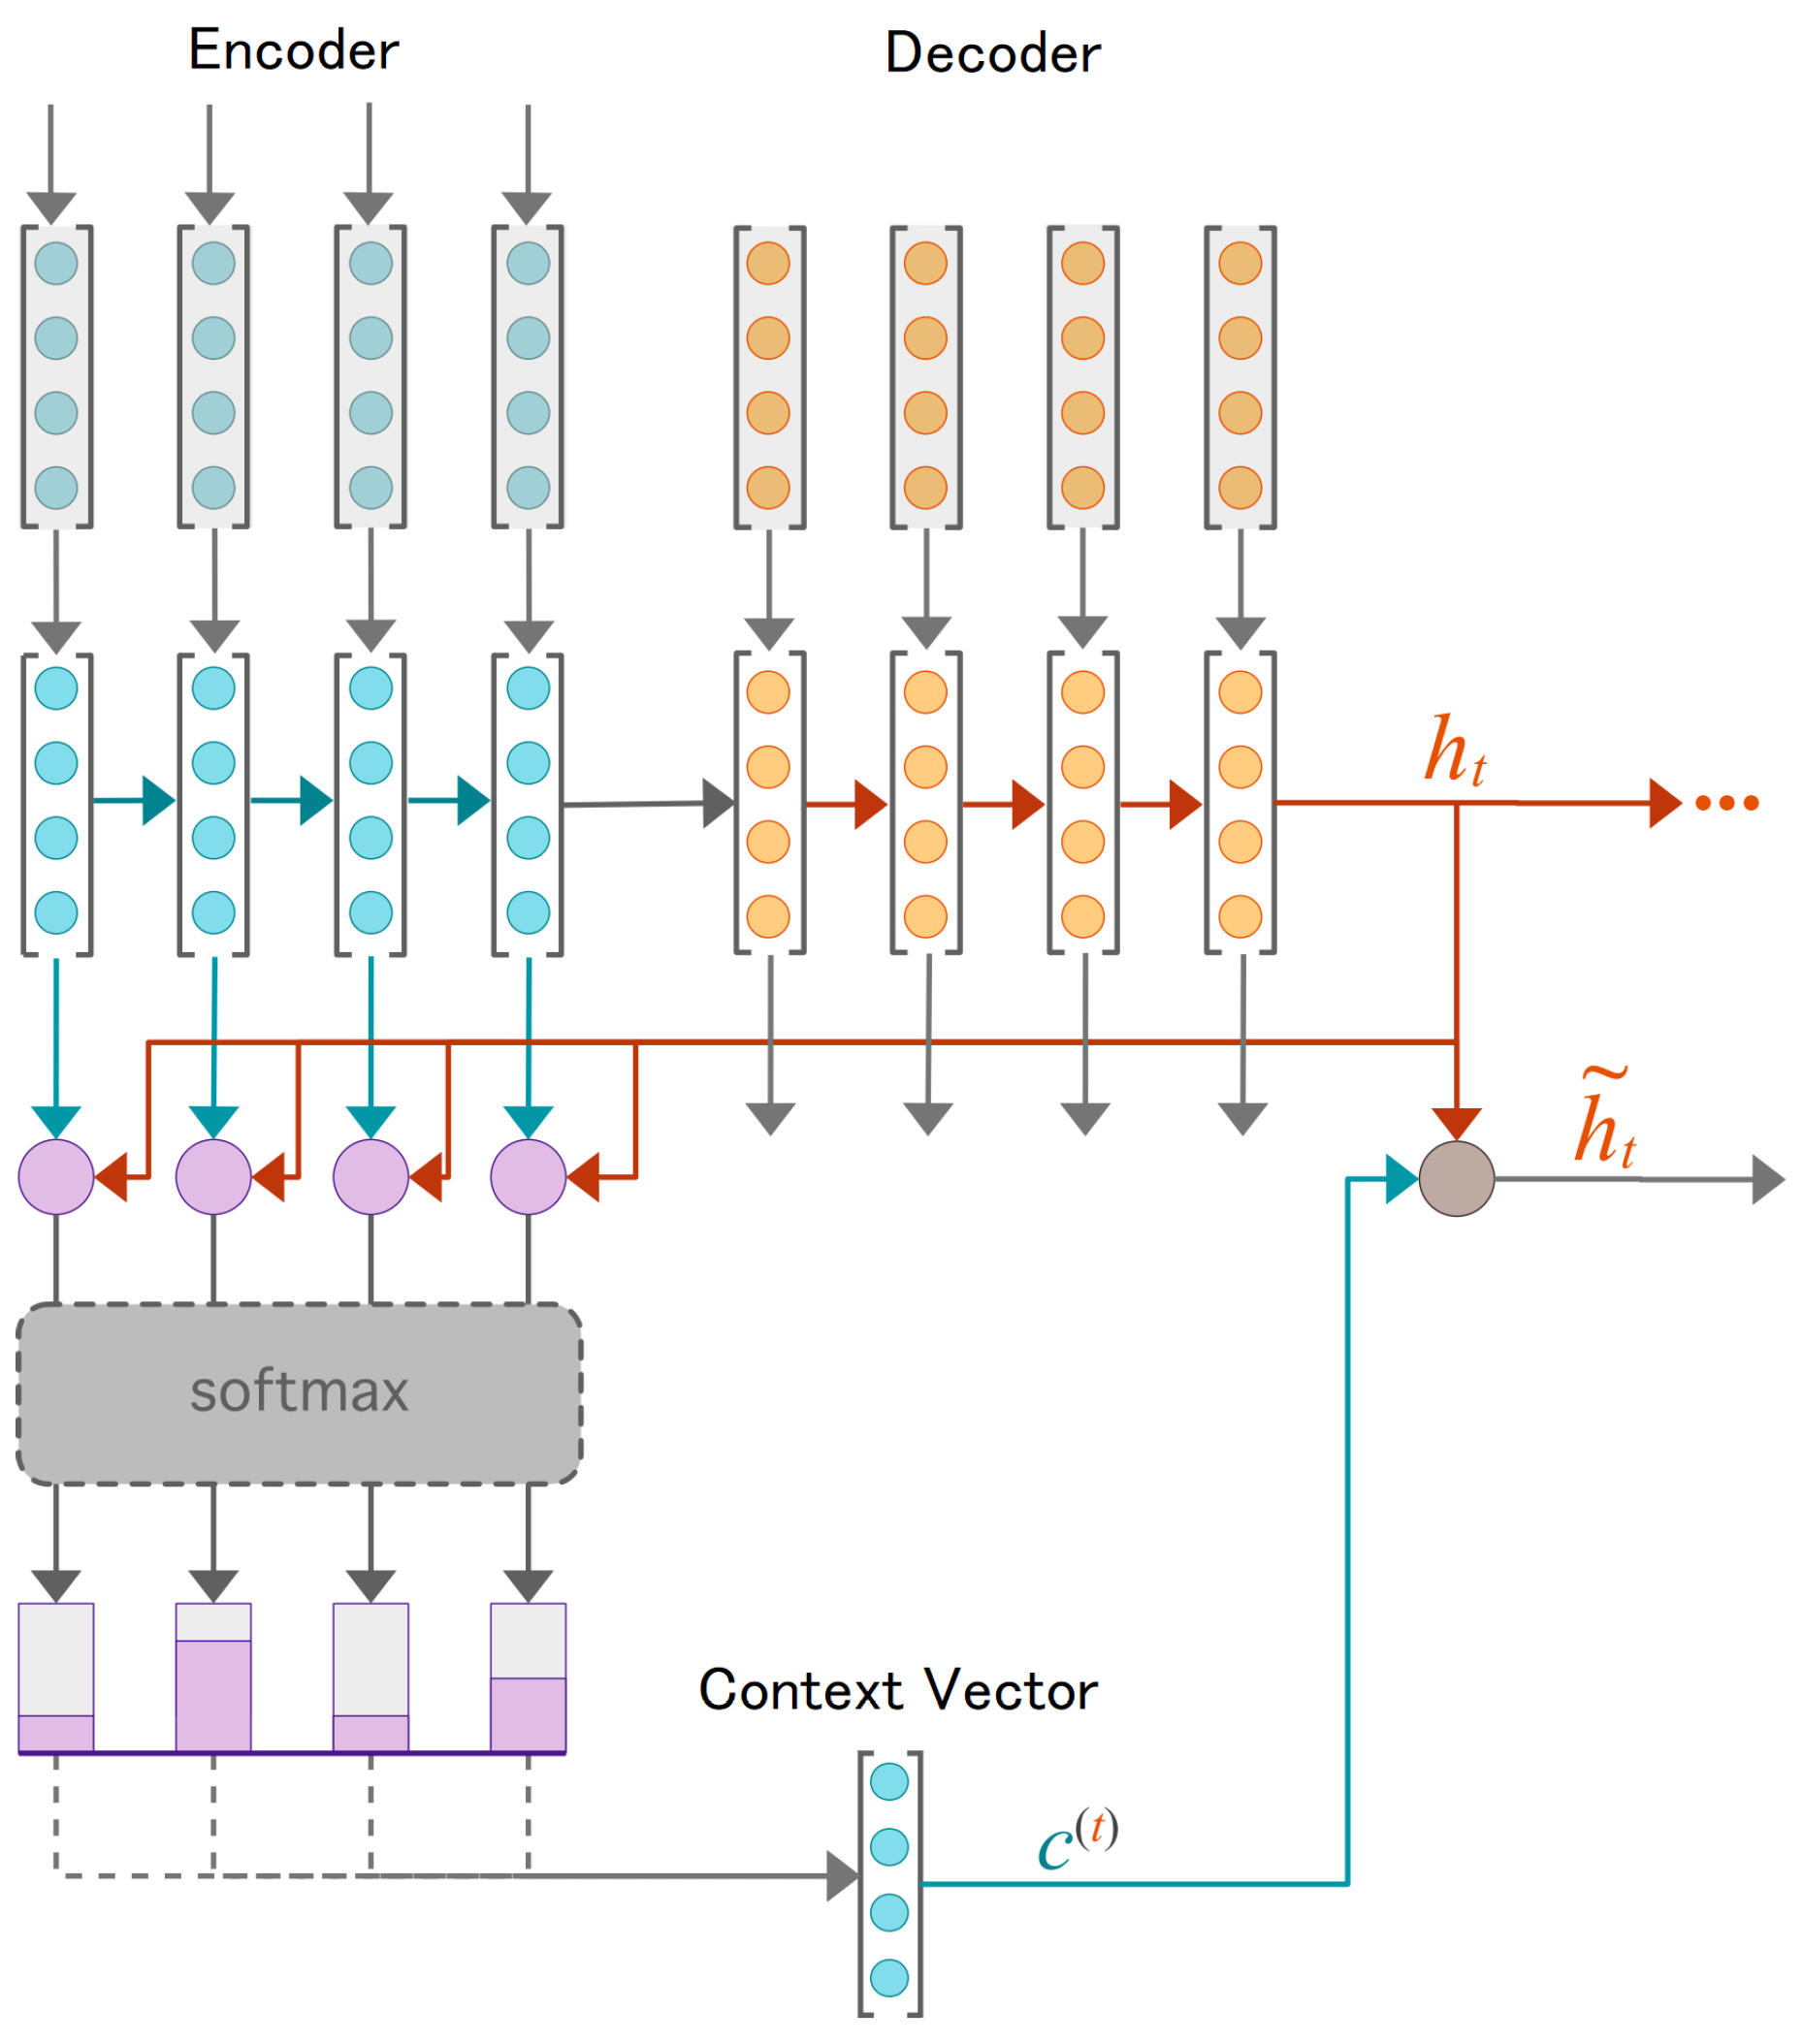
The encoder–decoder LSTM with attention is trained to minimize a loss function, such as a mean squared error or mean absolute error, between the predicted and actual future values. The network generates the forecast step-by-step until the appropriate number of steps has been anticipated [48]. A general overview of the network architecture is shown in Figure 1.
3.3. Hypertuning
Selecting the ideal hyperparameters for a machine learning model’s optimal performance is a process known as hyperparameter tuning or hypertuning. It entails experimenting with hyperparameter combinations and evaluating their performance on a validation set. In this context, Optuna [49] is a Python module for hyperparameter optimization that provides multiple search algorithms for the hyperparameter space; the Tree-structured Parzen Estimator (TPE) algorithm is one of these algorithms [50].
TPE starts with a prior distribution over the hyperparameters, and at each iteration, it updates the prior and suggests new hyperparameters to try based on the model’s performance with the previous hyperparameters. TPE employs a probabilistic model to estimate the performance distribution of hyperparameters and to achieve a balance between exploration and exploitation in the search process [51].
The algorithm models the distribution of the performance of the hyperparameters using two probability density functions: for good hyperparameters (those that result in low loss values) and for bad hyperparameters (those that result in high loss values), where is a hyperparameter configuration. The algorithm starts with a prior over these density functions and at each iteration, updates them based on the observed performance of the model to suggest the next hyperparameter configuration to try [52].
Let us denote the set of hyperparameters as and the performance of the model with hyperparameters as y. At iteration t, TPE first calculates the Expected Improvement (EI) function, which measures the trade-off between exploration and exploitation. The EI function is defined as:
where and are the probability density functions for good and bad hyperparameters, respectively. Then, it suggests the next hyperparameter configuration to try as the one that maximizes the EI function:
Finally, the algorithm updates the probability density functions based on the observed performance of the model with the suggested hyperparameters:
This procedure is repeated until a stopping requirement is satisfied, such as a maximum number of iterations or a minimum performance improvement [53]. In this paper, the rectified linear unit (ReLU), exponential linear unit (ELU), and hyperbolic tangent (Tanh) activation functions are evaluated.
3.4. Empirical Wavelet Transform
The Empirical Wavelet Transform (EWT) is an adaptive method for signal analysis, especially effective for time-varying signals. The procedure begins with signal preprocessing, denoted by , where t represents time. In this phase, the signal is cleaned by removing any noise or trends that could affect the analysis.
The EWT process then assesses the signal’s frequency content and divides it into distinct subbands. These subbands are represented by a set of filters denoted as , where i ranges between 1 and N and is the angular frequency. The filters are designed based on the characteristics of the signal, ensuring that they cover its entire frequency spectrum. Once the filters have been designed, the EWT applies them to the signal in order to determine the wavelet coefficients for each filter [54,55].
4. Experiments and Results
In this section, the results of the evaluation of the proposed model are presented. Initially, the influence of the data initialization is analyzed, explaining how the Seq2Seq dataset was used. Then, the model is optimized with Optuna, the EWT filter is used for noise reduction, and statistical analysis is presented. Finally, benchmarking is performed. The best overall results from this section are highlighted in bold and the best results from each comparison are underlined, with exception of the statistical analysis of the dataset.
4.1. Dataset
The experiments were performed in a saline chamber, using an applied voltage of 8.66 kV (RMS 60 Hz). The contamination was gradually increased until a flashover occurred following the NBR 10621 (equivalent to IEC 60507) standard. The NBR 10621 defines the characteristics of supportability under contamination for insulators in power grids. The experiment was conducted under controlled conditions (humidity, temperature, pressure, and contamination). The statistical characteristics of the dataset are presented in Table 2. The mean, median, mode, range, variance, standard deviation (Std. Dev.), percentile (%ile), interquartile range (IQR), skewness, and kurtosis are considered.
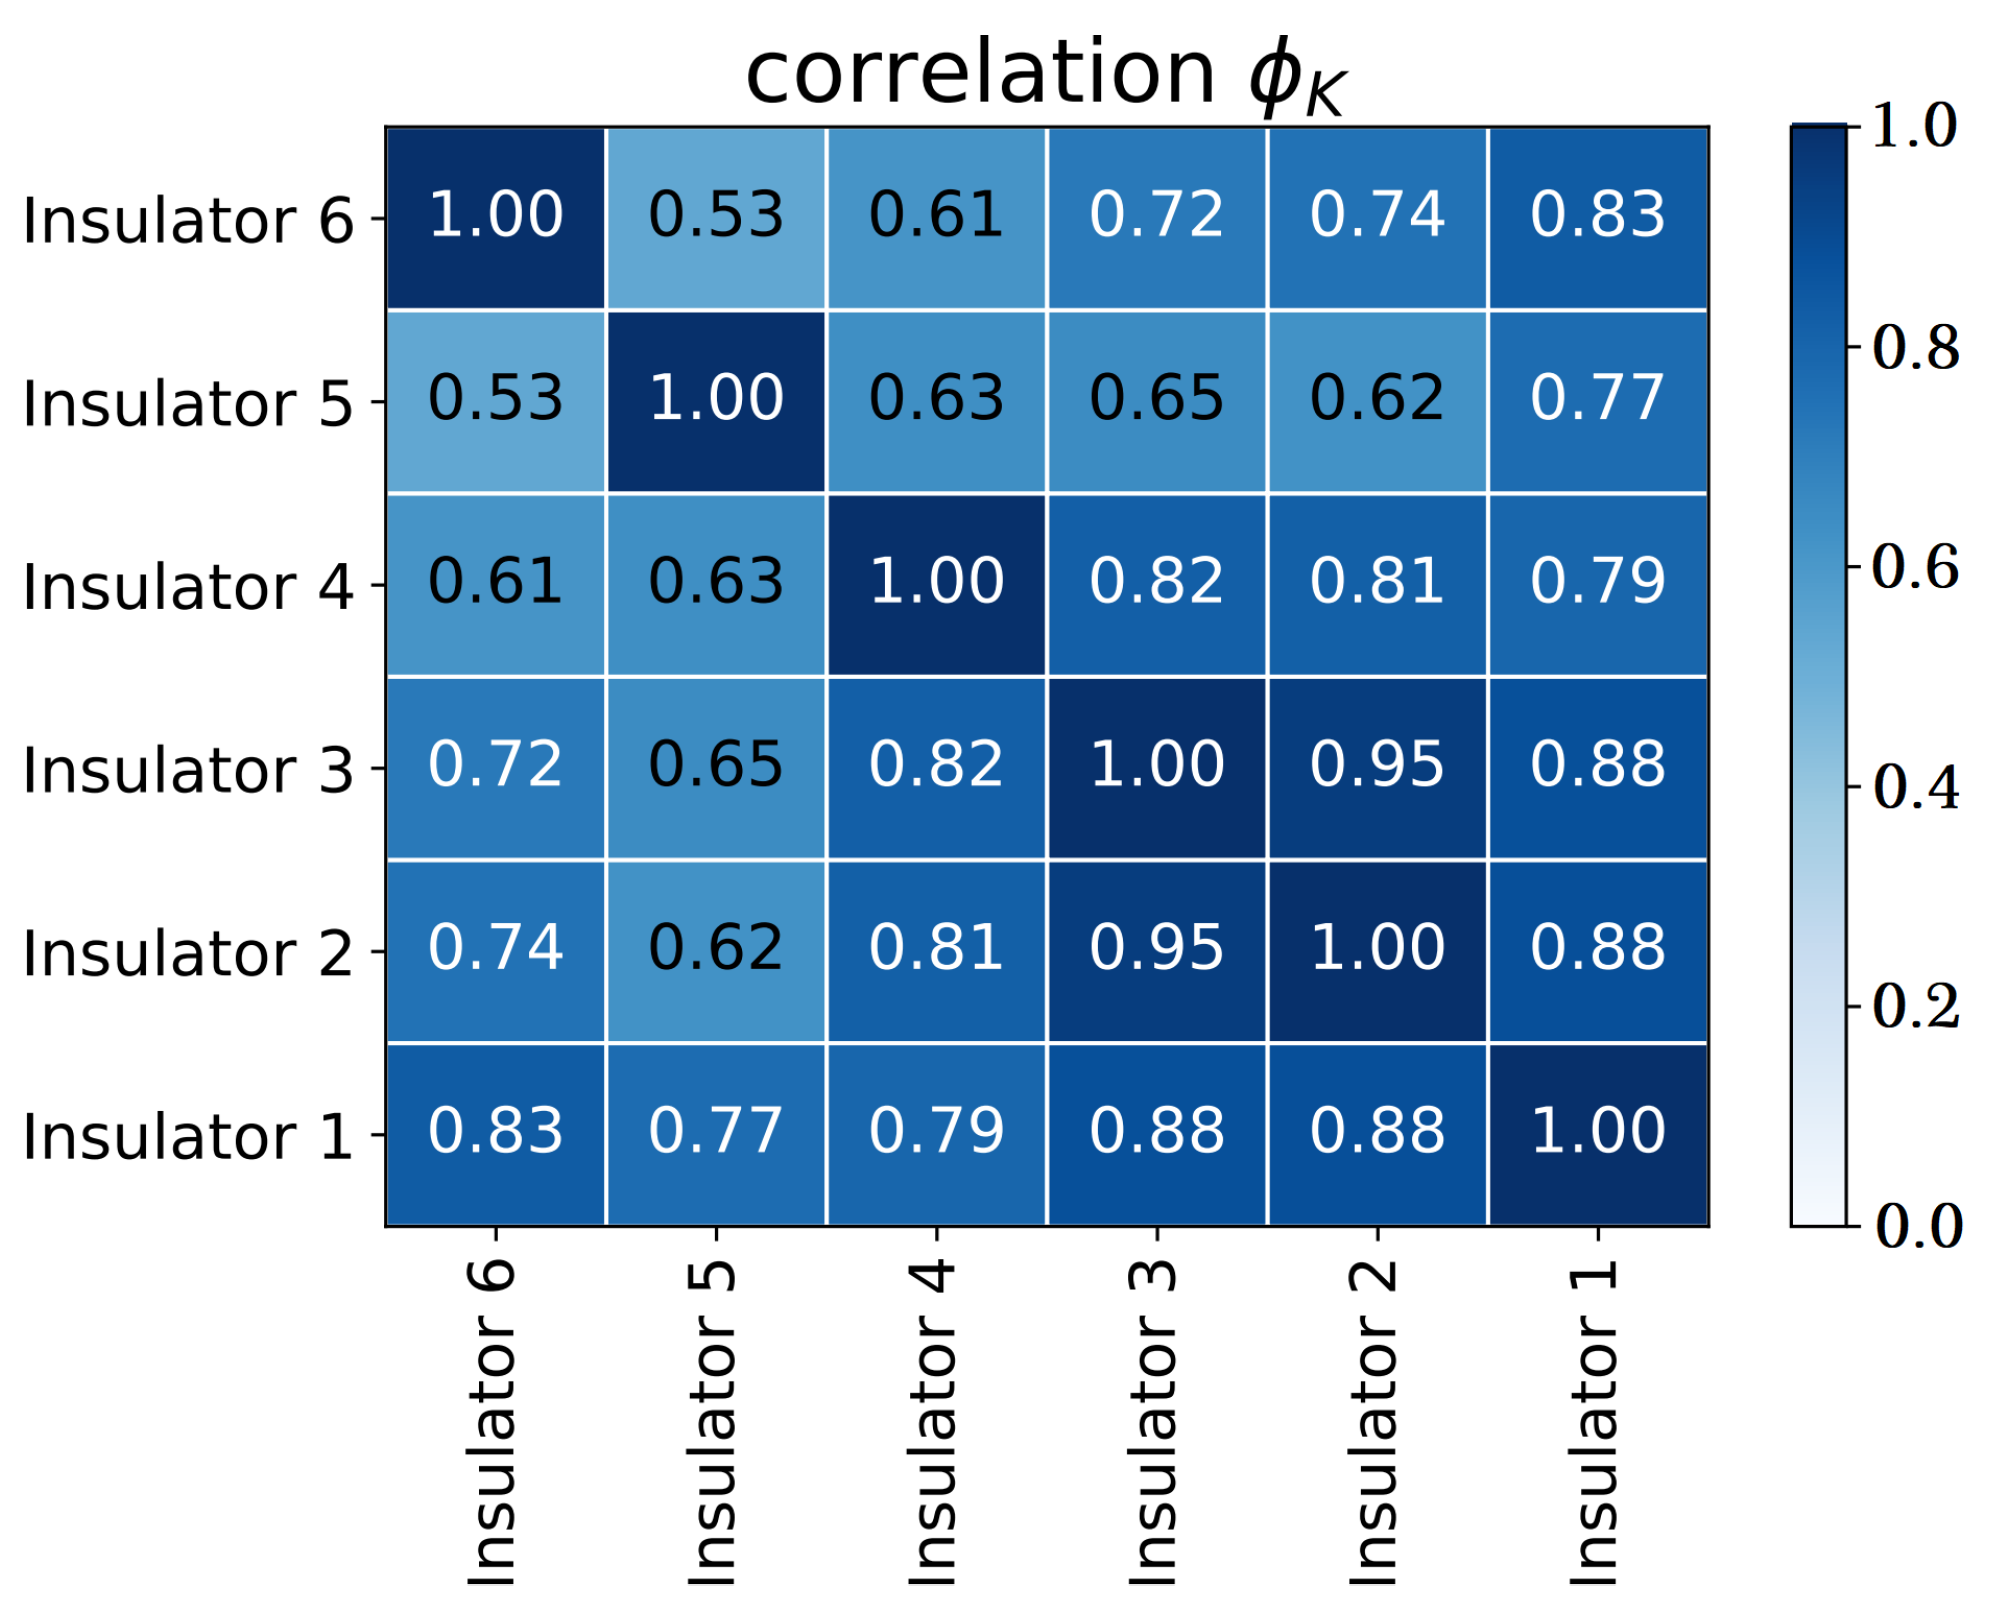
In the salt chamber, six insulators (15 kV class) were evaluated, and two were selected according to the phik correlation [56] between the recorded leakage current values. This relationship is presented in Figure 2.
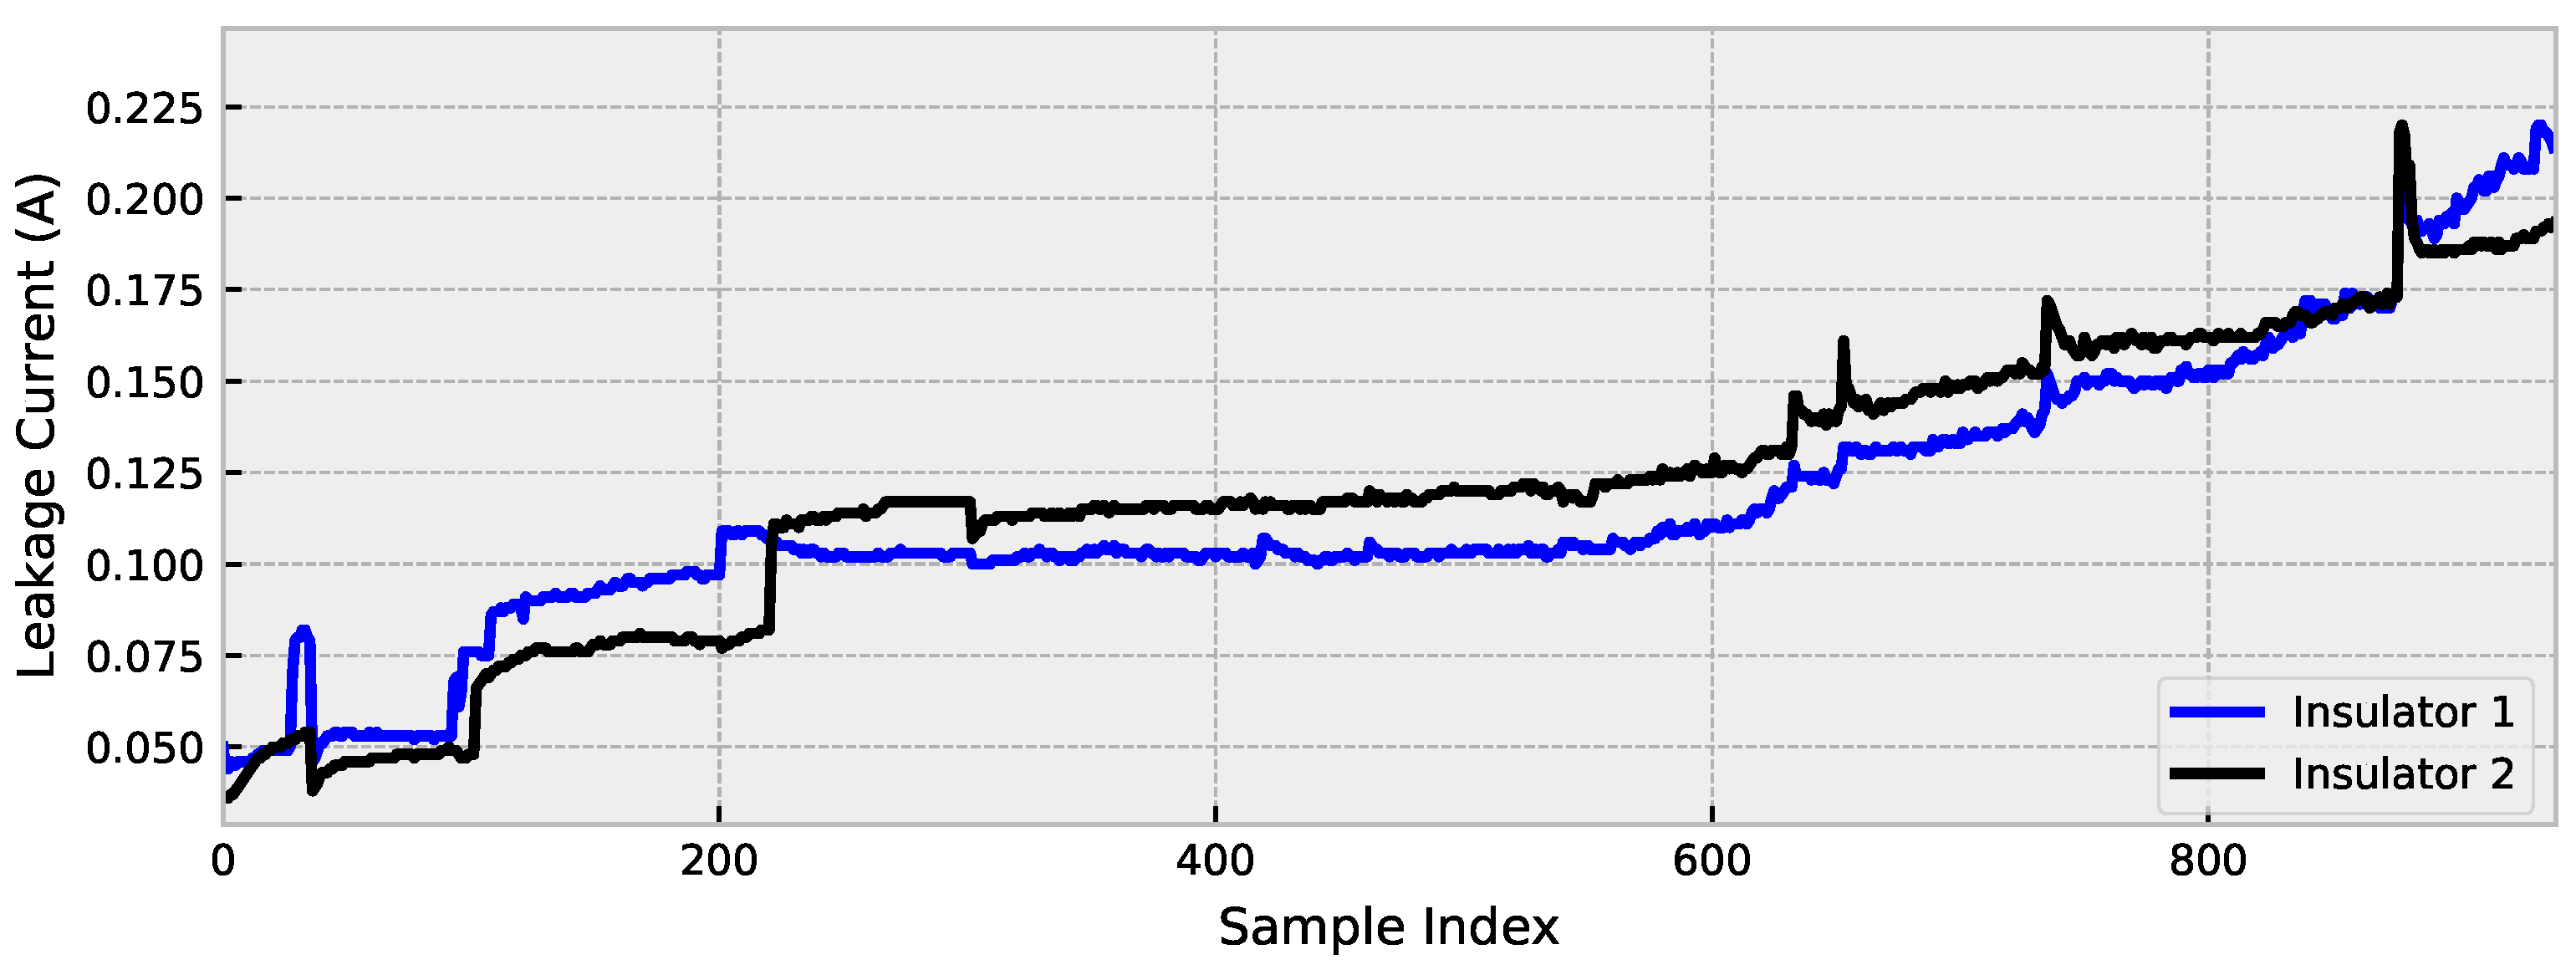
The highest correlation between samples occurs between insulators 2 and 3, with 98% correction, and for this reason, these insulators were considered in this paper. In these insulators, the flashover occurred after 26.11 h of running the experiment. The records were taken every second, and thus there were 9.4 × records. To proceed with the evaluation, a downsample of order 10 was applied to reduce the computational complexity, and therefore values up to 940 records are evaluated (see Figure 3).
4.2. Experiment Setup
The algorithm was written in Python using the keras framework and statsmodels, the experiments were evaluated in Google Colaboratory (Colab), using a graphic processing unit NVIDIA Tesla T4, a central processing unit Intel(R) Xeon(R) @2.30GHz, and 12GB of random access memory.
To ensure that overfitting does not occur, the early stop criterion was used, which stops training when there is no improvement in the model during training. This procedure was based on the mean square error (MSE). For a comparative analysis of the models’ performances, the MSE, mean absolute error (MAE), and mean absolute percentage error (MAPE) were evaluated, given by:
where n is the length of the signal, is the observed value, and is the predicted output.
For the final comparative analysis, the stacking ensemble learning method is evaluated. The linear, radial basis function (RBF), and polynomial kernel functions were considered using a support vector regression (SVR). Additionally, the quadratic programming (L1QP), iterative single data algorithm optimization (ISDA), and sequential minimal optimization (SMO) solver are compared.
4.3. Data Initialization
The way that the data are initialized might have consequences on the model’s performance, and thus, with a bigger batch size, the model tends to be faster, since it loads more data in a single step, and the percentage of data used for training can also have significant results on the model’s performance, considering that a larger number of data for training can make it have better performance. Table 3 shows a comparison between the percentage ratio used for training and testing the model, as well as the batch size variation.
All results using a larger batch size were faster to converge, however, in this research, the objective was to have a model with lower error and not one that simply faster; hence, this criterion was not considered in defining the best way to load the data. The lowest MSE and MAE were found using 90% of the data for training, showing that a larger dataset can improve the model’s trainability.
Since the focus of this research was to evaluate the use of fewer data for training to achieve a greater prediction horizon, 70% of the data were considered for training, with this focus the best result in error reduction occurred using a batch size equal to 16 (regarding a lower MSE, MAE, and MAPE); for this reason, this setup was defined as the default and further analyses were based on this definition.
4.4. Denoising
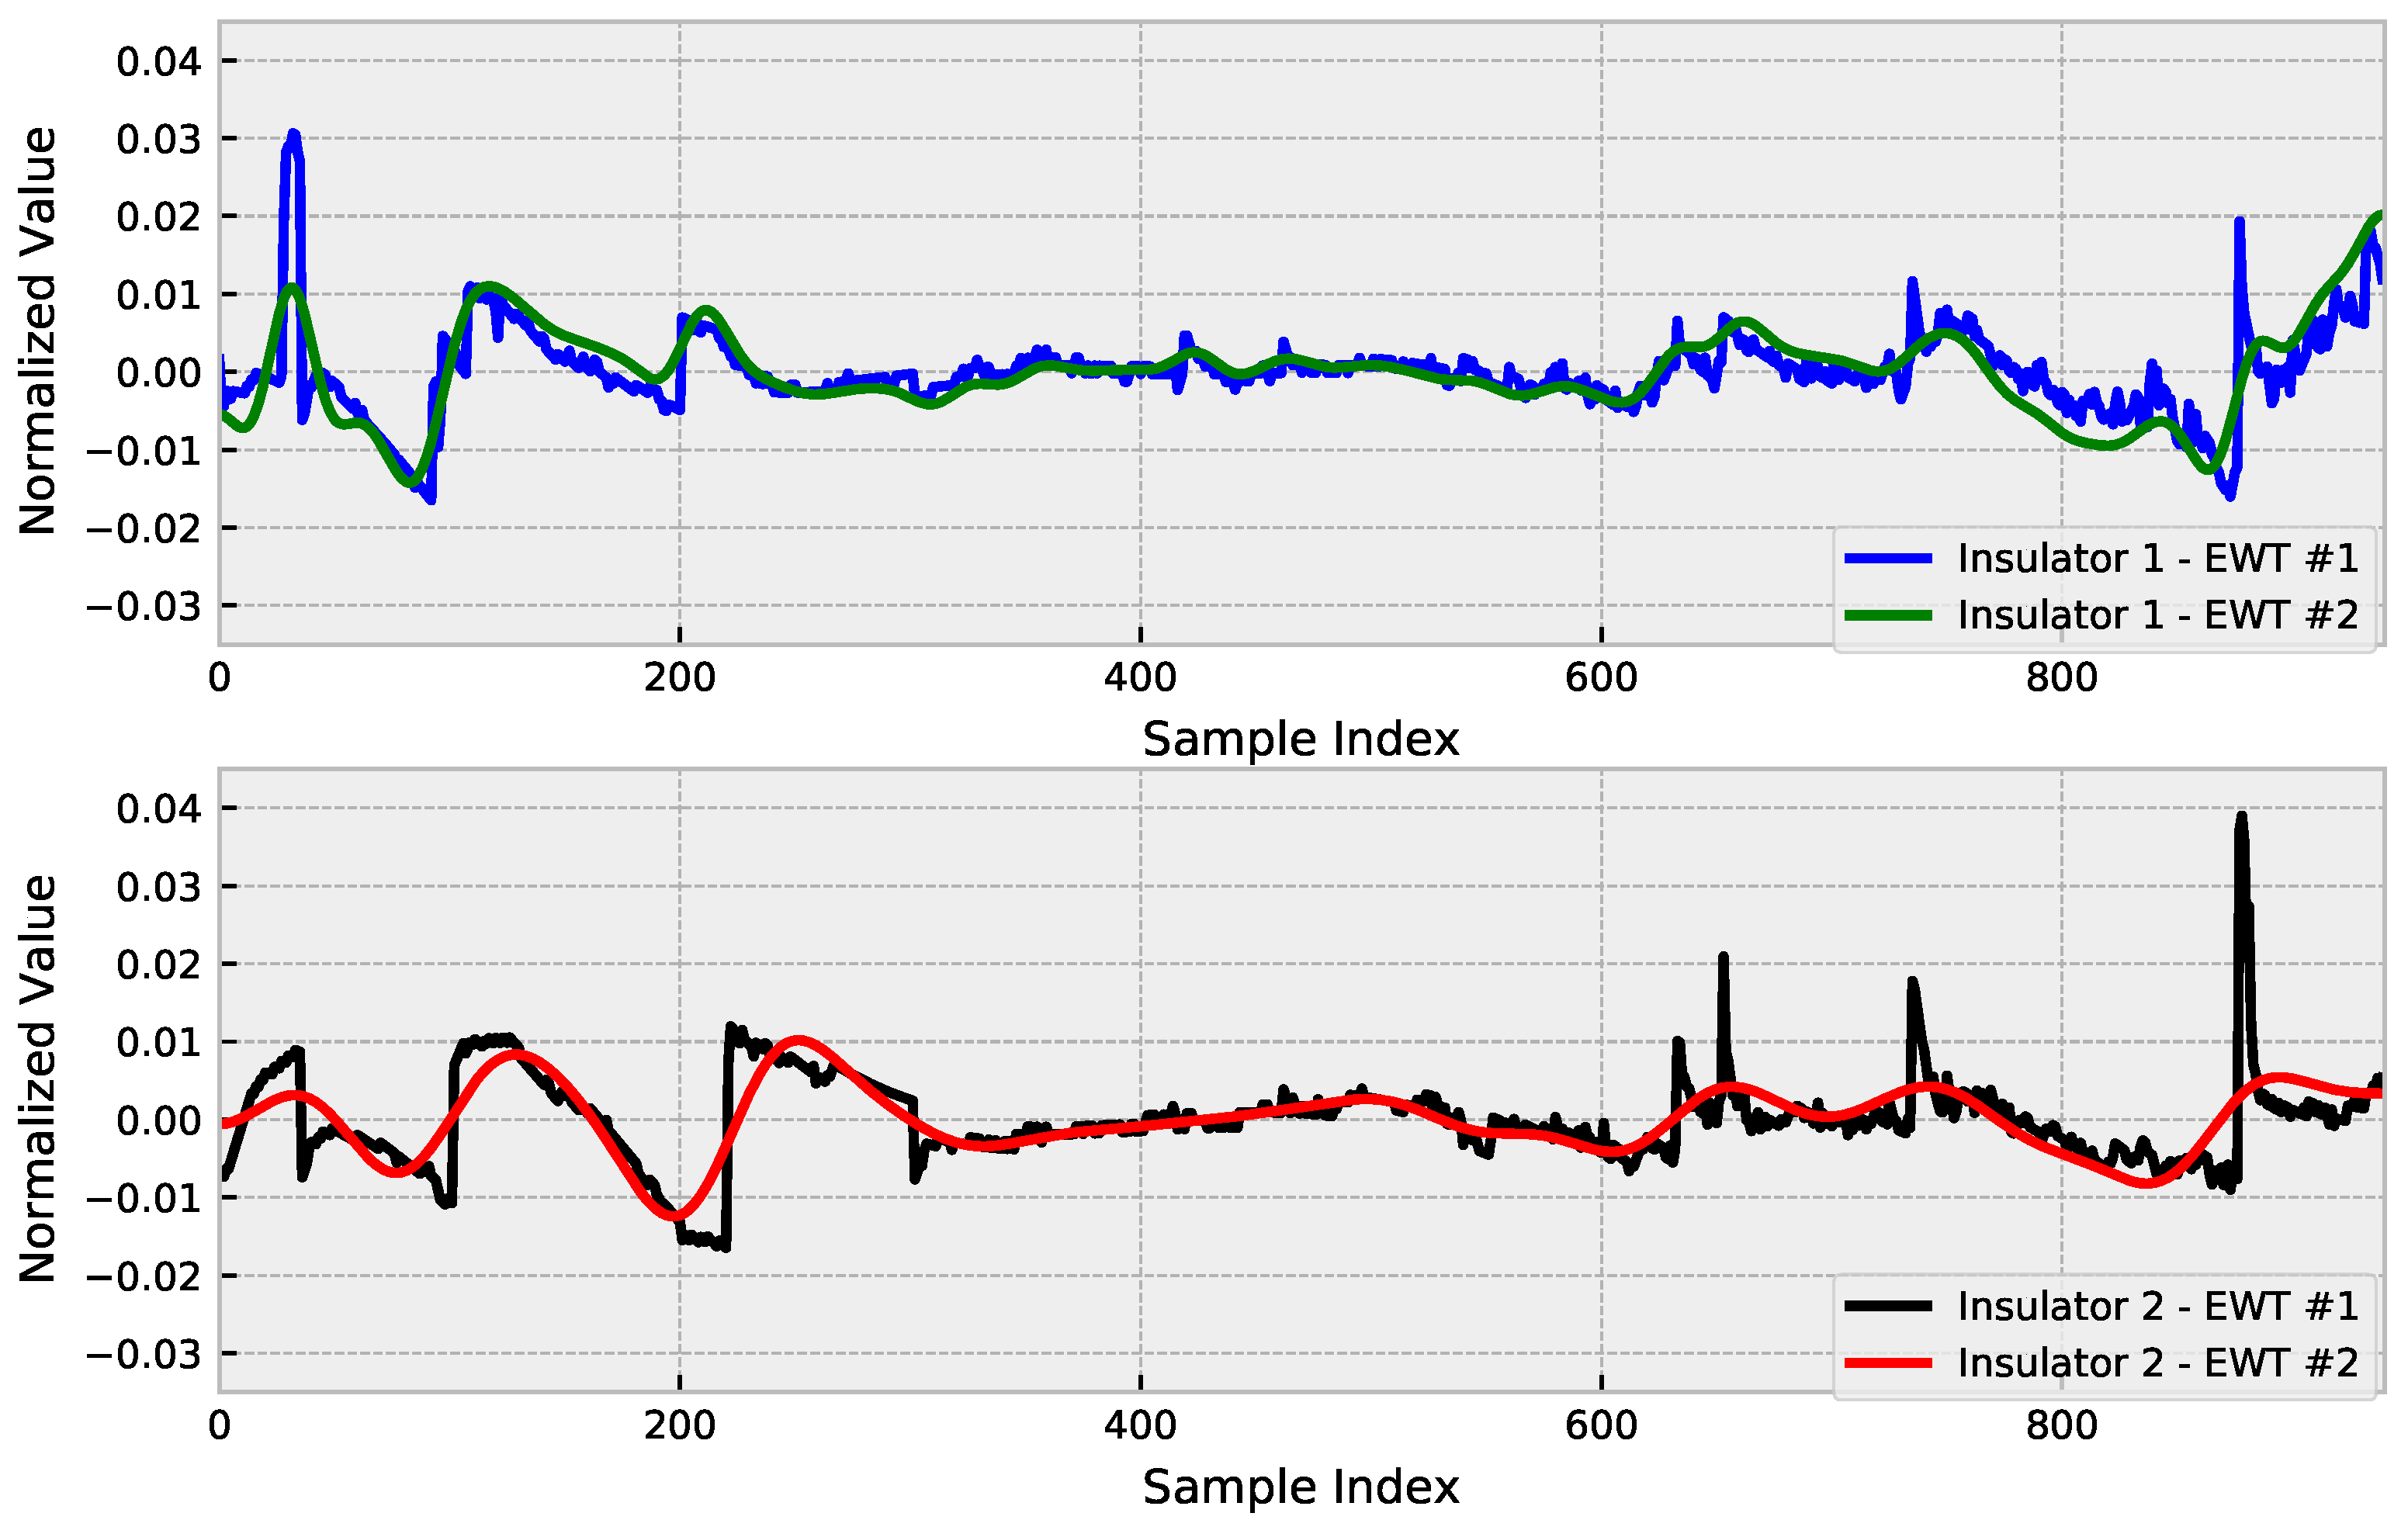
To perform noise reduction, EWT was applied to the preprocessed leakage current signals, considering that the detrend is used as a co-feature of the network, this being an already filtered input signal to support training. The results of using EWT over the original detrend are presented in Figure 4.
The noise that occurs in the measurements is due to the nonlinearity of the leakage current. One of the reasons for the nonlinearity of the leakage current in contaminated insulators is that pollution does not deposit linearly on the surface, and there are variations in pressure and humidity caused by the discharge. Therefore, these variations can be disregarded when the analysis is performed over a time series.
In the context of predicting leakage current, which is an indication that a further failure is likely to occur possibly due to an increase in the surface conductivity of the insulator, reducing the variations that are not a component of the increasing trend is promising, since this does not affect the focus of the assessment and reduces the complexity of the analysis.
4.5. Hyperparameter Optimization
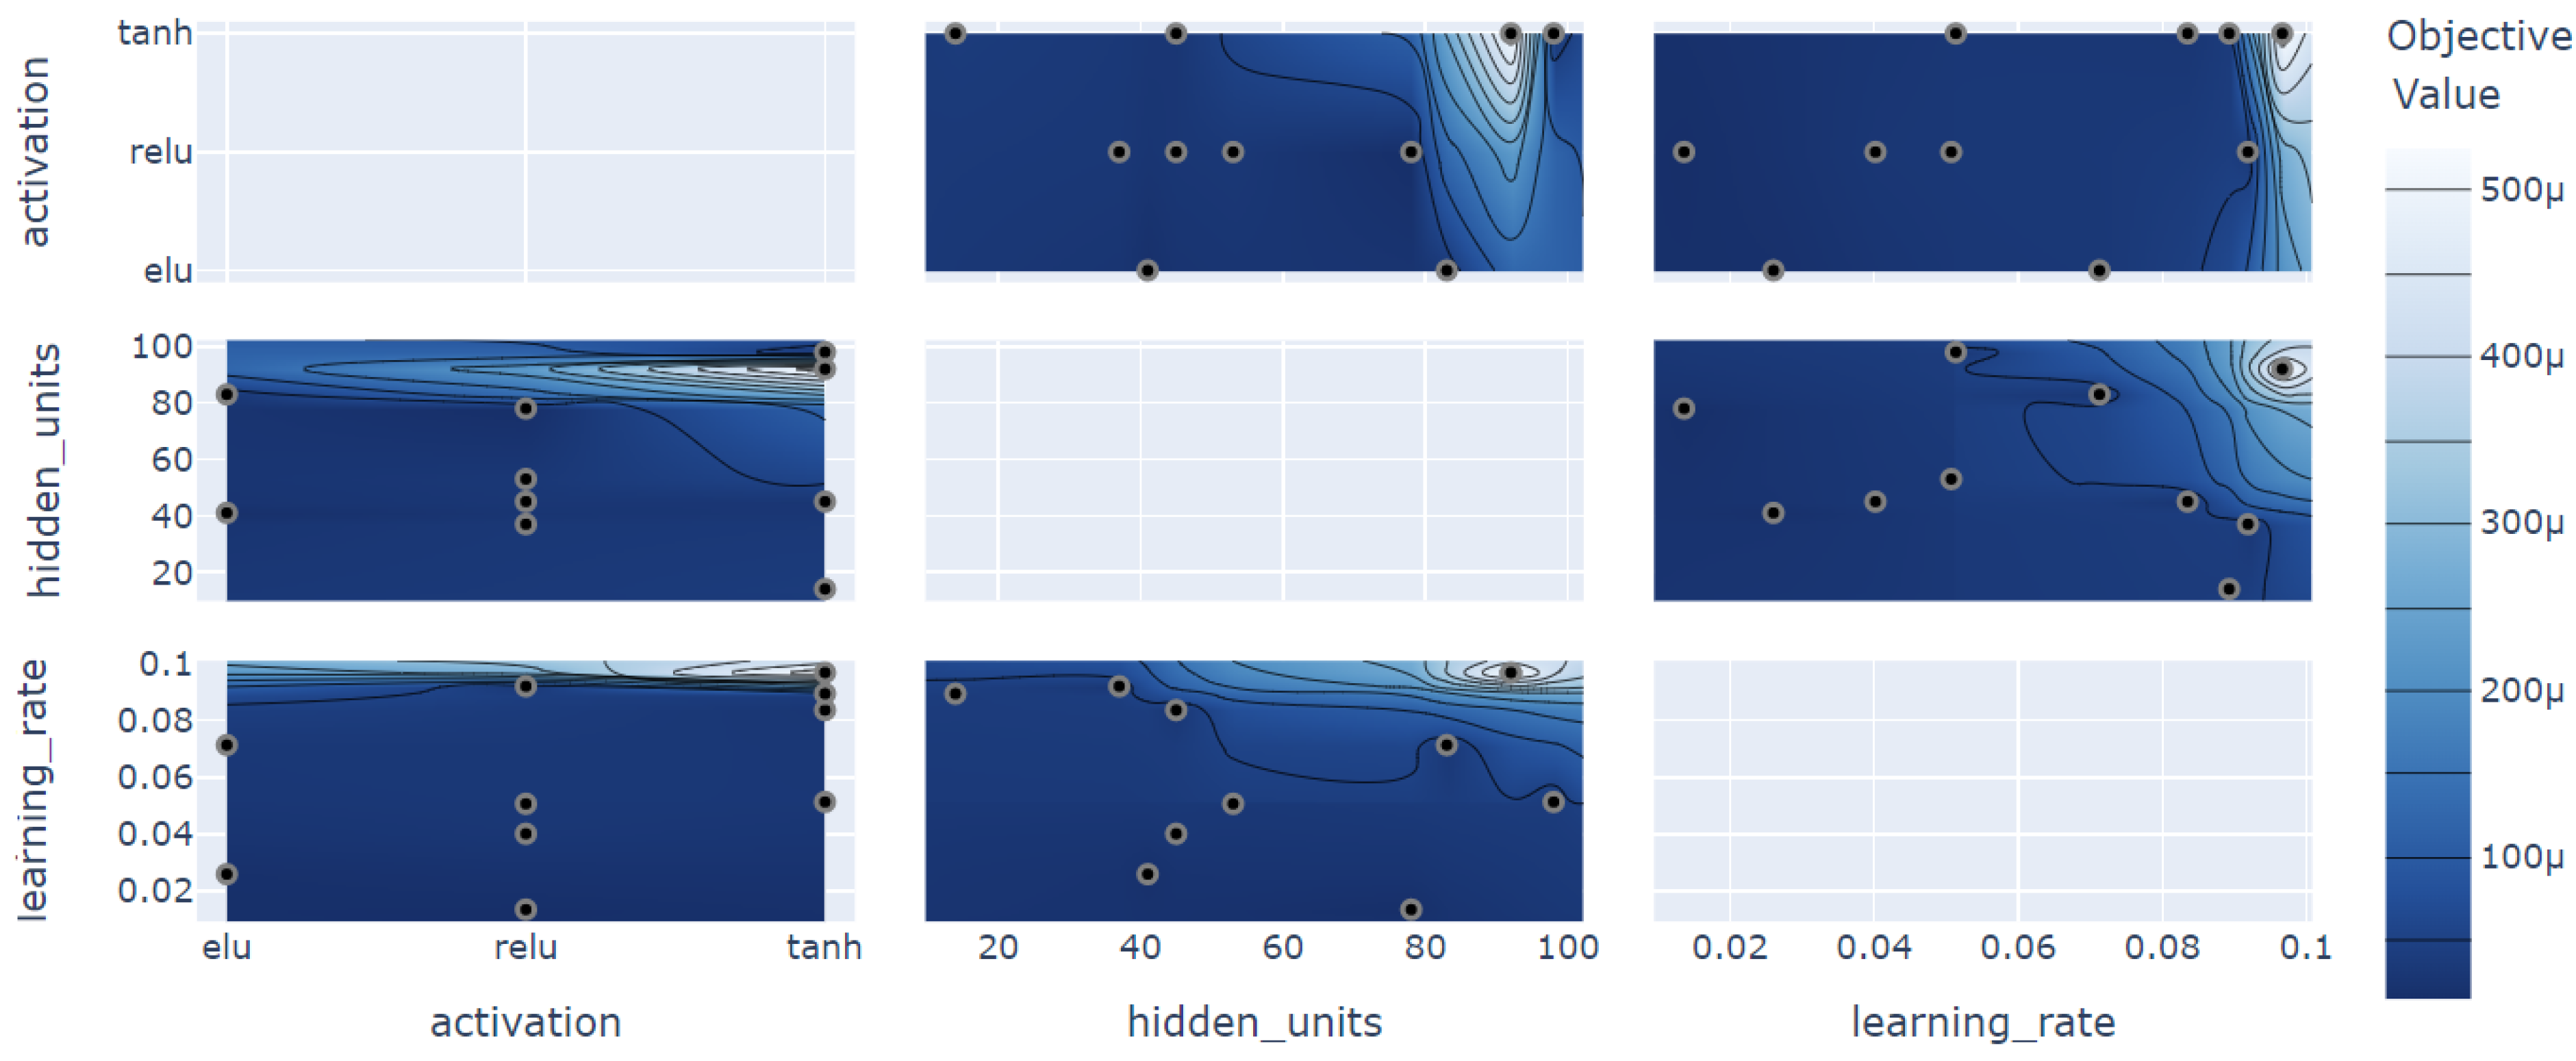
To obtain an optimized model that has a better performance for solving the problem addressed in this paper, there is hypertuning, which defines the optimal hyperparameters to be used in the model. For hyperparameter optimization, Optuna was used, which is a specific framework for it. The use of 10–100 hidden units, the activation functions ReLU, ELU, Tanh, and the learning rate from 0.001–0.1 were evaluated, the results are presented in Figure 5.
The optimization of the hyperparameters returned the value of 78 hidden units, the ReLU activation function, and the learning rate of 1.36 ×. These values were used for all experiments for a fair evaluation. In this comparative analysis, the most important hyperparameter for model optimization was the learning rate, which has an importance of 89.22% to achieve the objective result of performance optimization, whilst the hidden units had an importance of 10.71% and the activation function had only 0.07%, this being the least important variation in the model optimization.
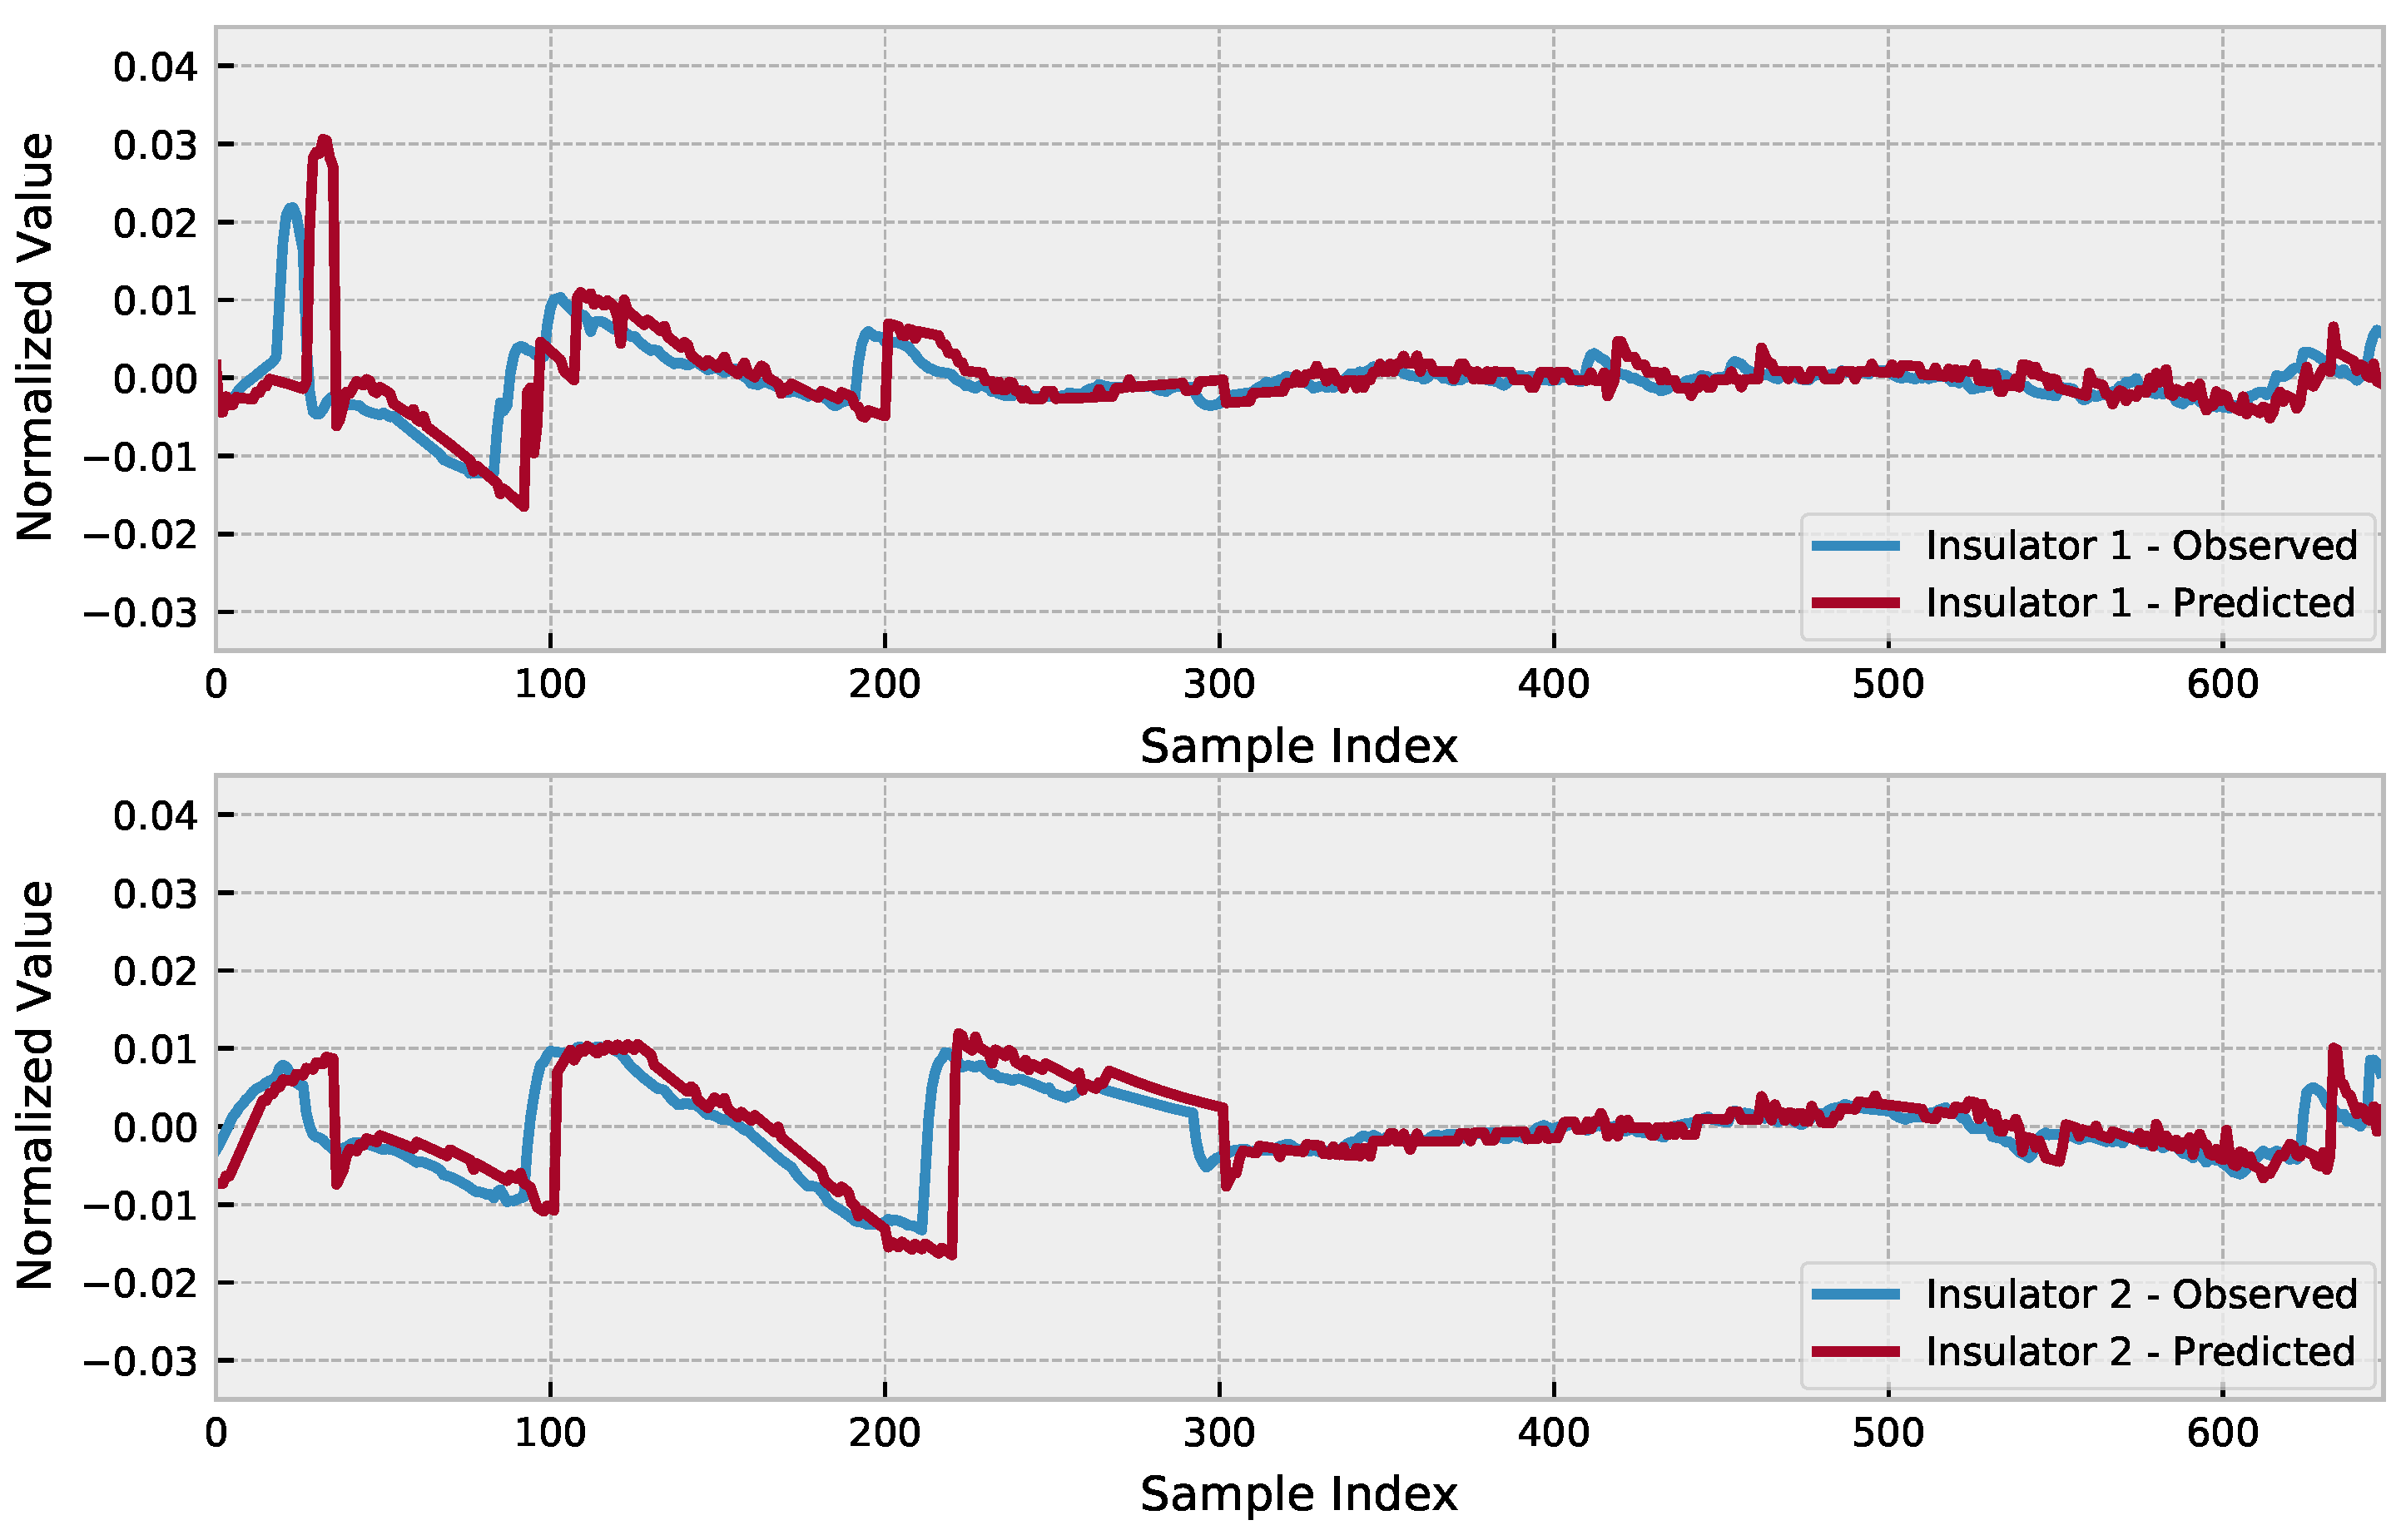
Including co-features can aid in capturing additional information that may not be included in the time series itself, or even guide the prediction in a trend as in the proposed model. Relying only on the denoised signal could lead to missing important behaviors in the original signal; thus, we opted to input both signals for both insulators as a way to provide the model with enough information to keep the peculiarities of each insulator, while trying to follow the trend based on the correlation existing between the signals. Assuming the optimized hyperparameters, the use of the attention mechanism in the LSTM, and using the EWT co-features, the prediction results are presented in Figure 6.
4.6. Benchmarking
In this subsection, the proposed optimized EWT-Seq2Seq-LSTM with the attention method is compared to other models considering the characteristic of a Seq2Seq signal. The results are presented in Table 4. The difference between the compared models is that the standard model does not use the attention mechanism, EWT-Seq2Seq-LSTM with attention is not optimized, and the proposed model uses hyperparameter optimization besides the attention mechanism. For a fair comparison, all models use the same EWT-based input signal, which means all signals are preprocessed.
An important observation is that hyperparameter optimization can make the model converge considerably faster; therefore, special attention needs to be given to the early stop. If the early stop has a weakly constrained criterion (with a reduced number of unimproved epochs to stop the training), there might be an early stop precipitated.
The proposed optimized EWT-Seq2Seq-LSTM with attention was shown to have an improvement in all error metrics evaluated, this being faster than the model without optimization, and although the standard model is quicker to converge, its inferior results regarding error do not justify its use. Based on these results, a statistical analysis was performed to evaluate the reliability of the model over several experiments.
For comparative purposes, Table 5 presents the analysis using the stacking ensemble learning method considering the variation of solvers and the kernel functions. It can be observed that the MSE error values are higher using the ensemble method, but only the MAPE was lower in the comparative analyses.
Other analyses using equivalent signals can be found in the work of Sopelsa Neto et al. [4]. One difference that should be noted, compared with our work, is that Sopelsa Neto et al. [4] did not use the MAPE in percent to present the results. Comparatively, all the MSE results were lower than the proposed optimized EWT-Seq2Seq-LSTM with the attention model. This shows that the proposed model is superior to other methods even when the wavelet transform is used.
4.7. Statistical Assessment of the Proposed Method
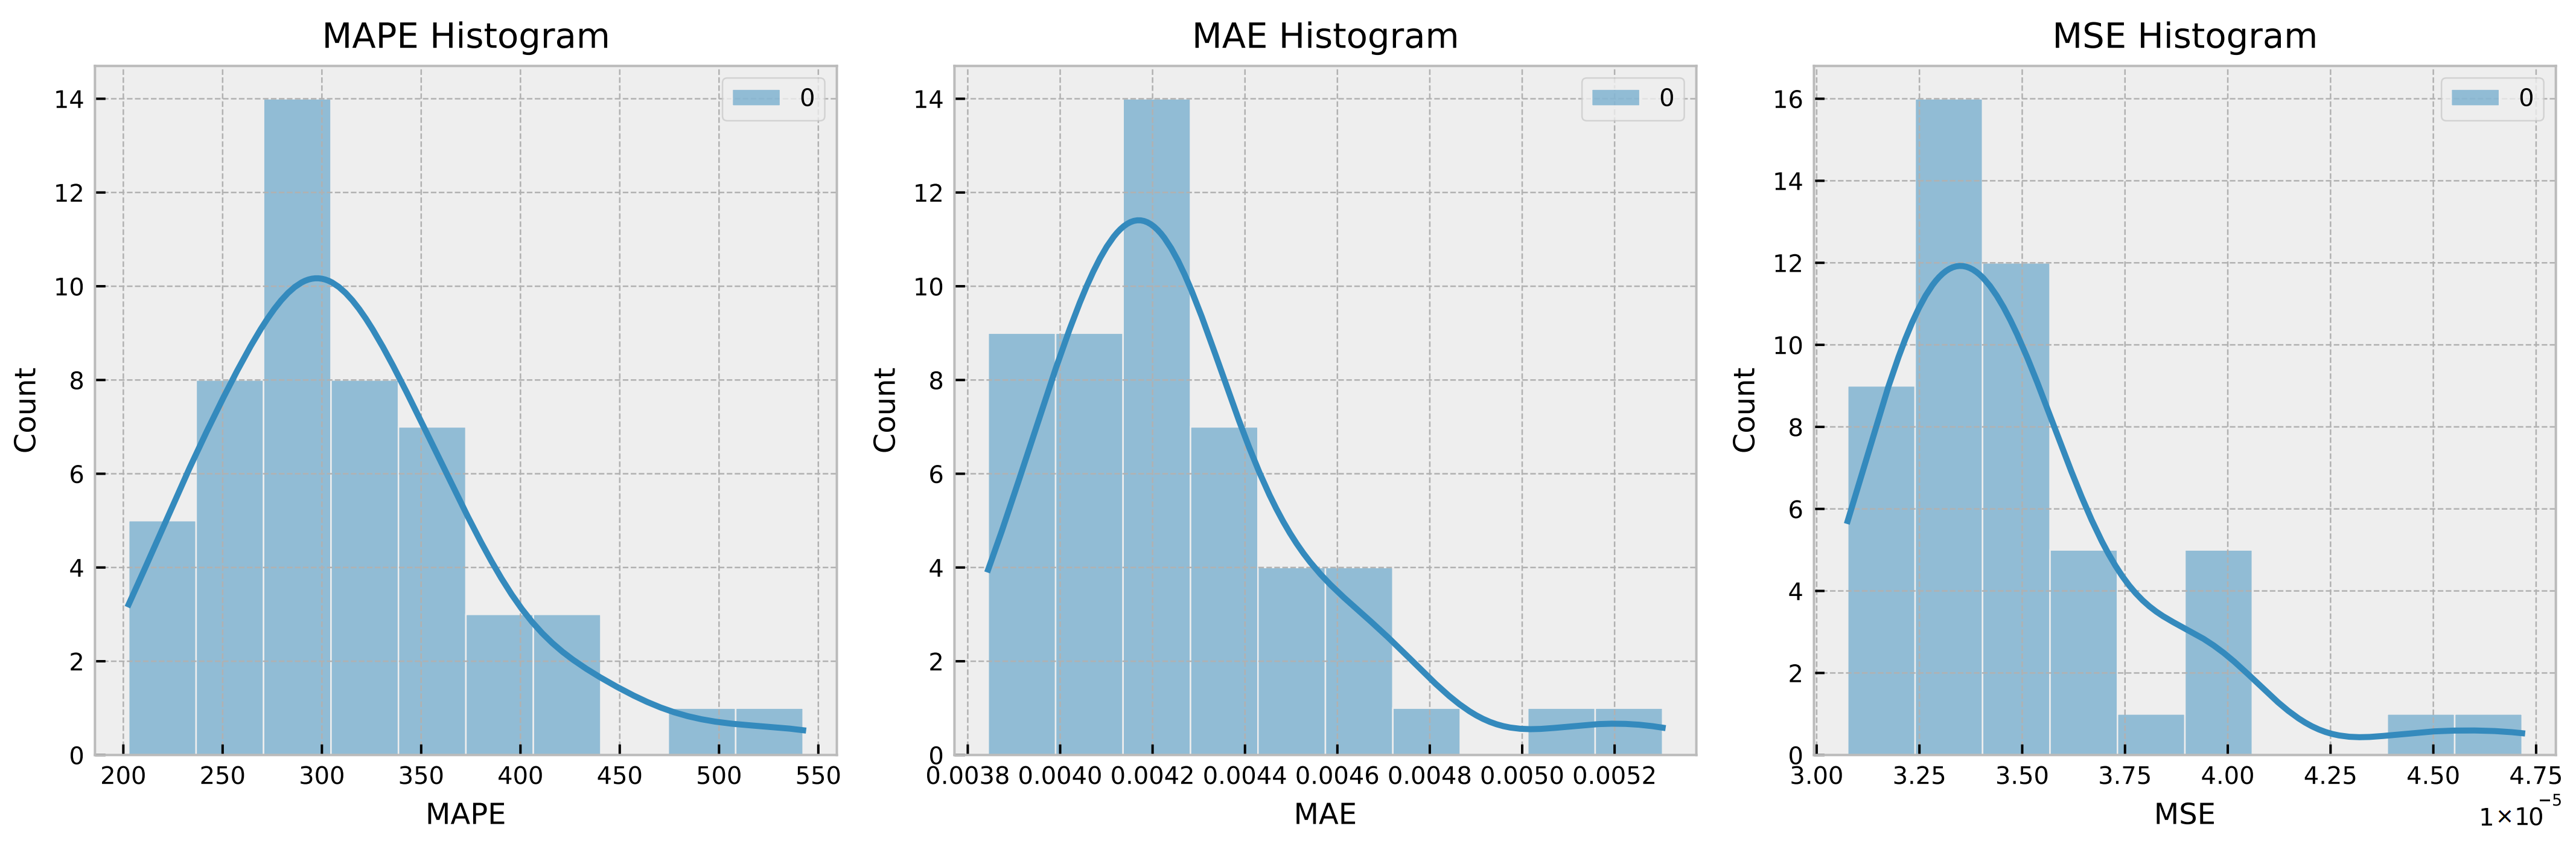
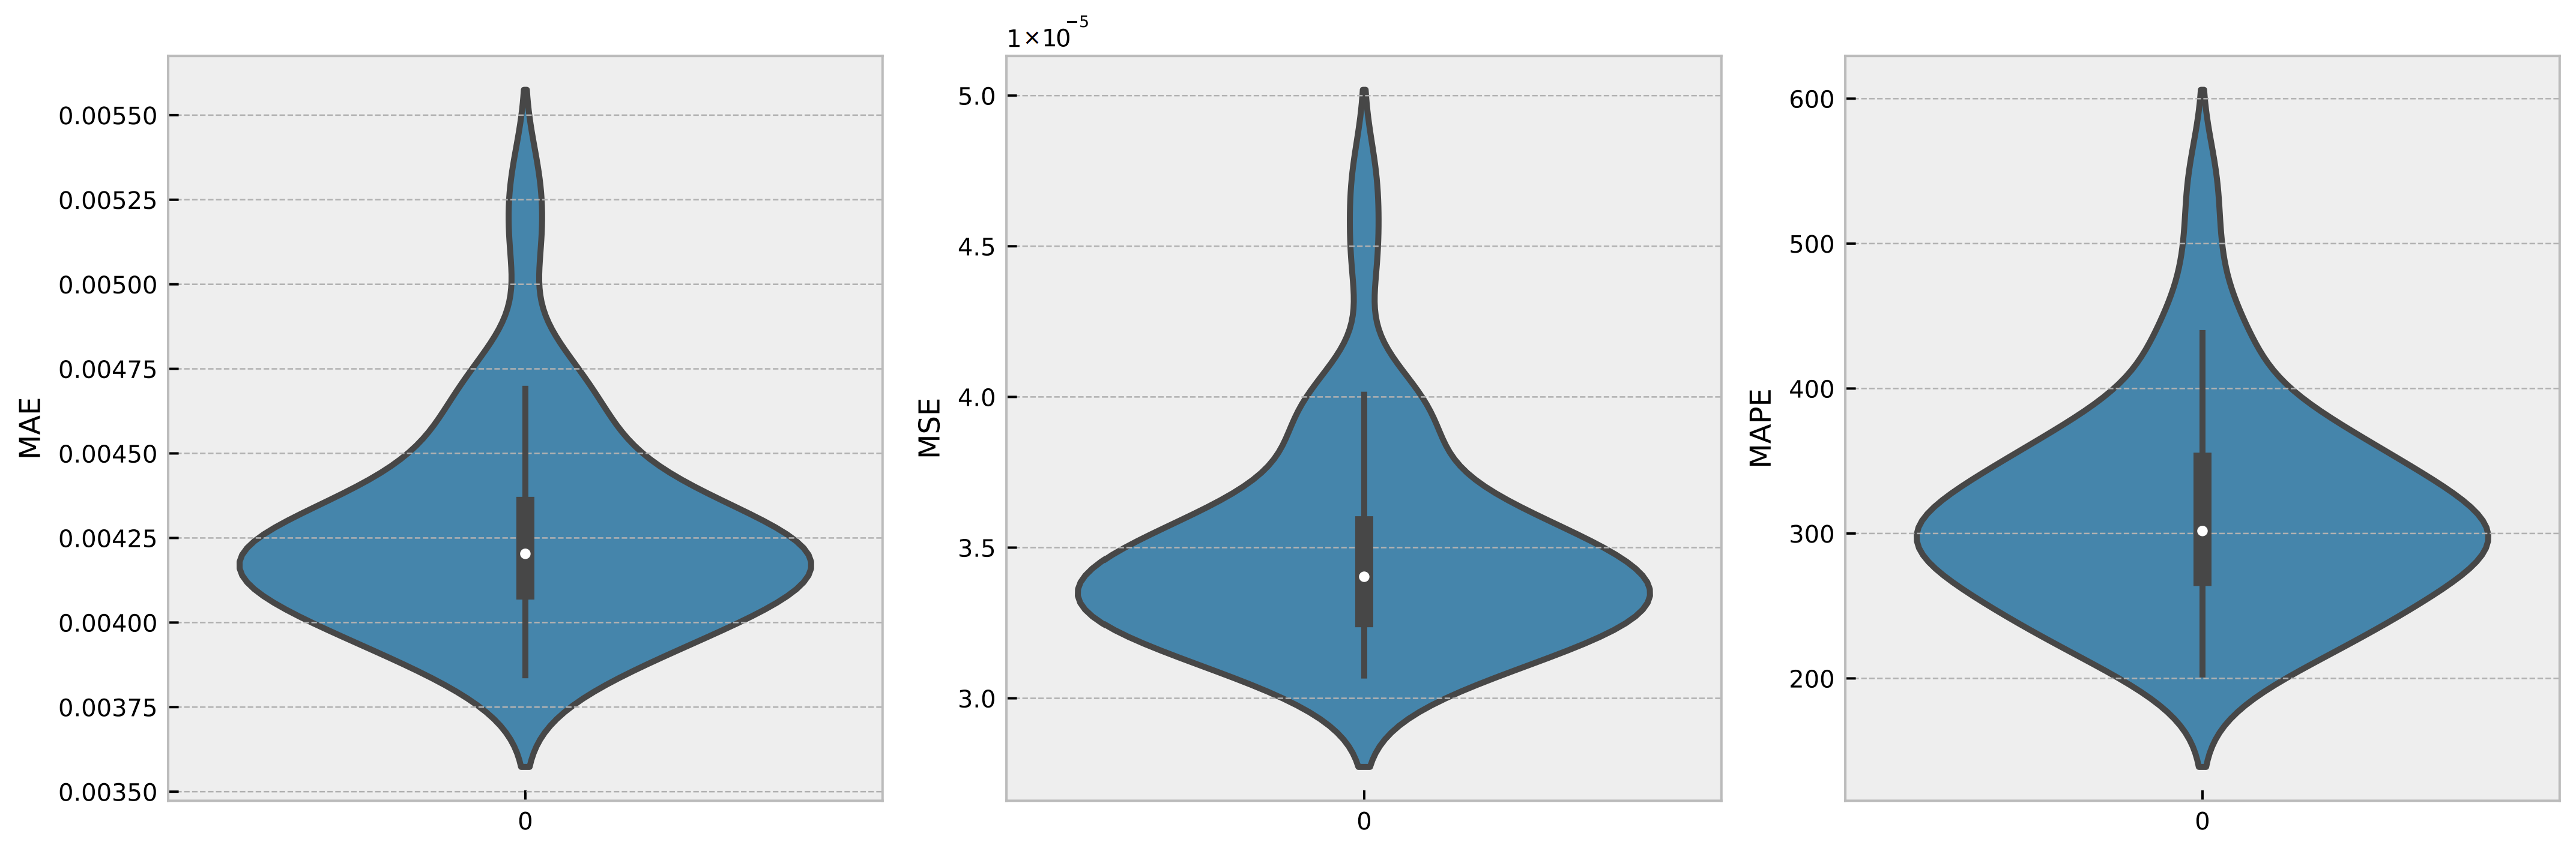
To evaluate the robustness of a time series model, it is typical to train the model numerous times and compare its performance measures between runs. This can help discover any potential sources of variability in the model’s performance, such as random parameter initialization or changes in the training data utilized for each run. In this instance, the proposed model was trained 50 times, with Gaussian noise being introduced in each run, and the MSE, MAE, and MAPE for each run were recorded. Figure 7 and Figure 8 show, respectively, the histogram of the boxplot of the trained models.
From the histogram and boxplot, it is clear that the model’s variance remains within acceptable limits. This indicates that the model is resilient and capable of performing well across a broad range of training data and parameter settings. In addition, the boxplot reveals that the median performance measure values are consistent across all 50 training runs with random Gaussian noise, further supporting the robustness of the model.
5. Final Remarks and Conclusions
The increase in leakage current is related to the increase in surface conductivity, which occurs in distribution power grid insulators due to the accumulation of contaminants on their surface. When the leakage current becomes considerably high, flashovers occur, resulting in power supply shutdowns. The prediction that the leakage current increases is an indication that a discharge will occur and can therefore be used to evaluate the influence of the environment on the performance of insulators over time.
There are several techniques that can be used to enhance a prediction model, such as the empirical wavelet transform for noise reduction, the attention mechanism to improve the predictive ability of the model, and the optimization of its hyperparameters. All these techniques are combined in this paper to obtain the proposed optimized EWT-Seq2Seq-LSTM with attention which proves to be superior in comparative analysis.
The proposed model optimized EWT-Seq2Seq-LSTM with attention had an MSE of 1.06 ×, which was superior to the standard LSTM and the model without using Optuna hypertuning, showing that it is promising to use the attention mechanism and the optimization of the network hyperparameters.
Future work can be conducted to evaluate uncorrelated leakage current and determine how well the model performs when uncorrelated data are used for training. The leakage current can also be evaluated in other components of the electrical distribution system, and it is promising to evaluate the insulators manufactured from polymeric materials, which are increasingly being used.
Author Contributions
Writing—original draft, A.C.R.K.; software, S.F.S.; methodology and formal analysis, L.O.S.; writing—review and editing, V.C.M.; supervision, L.d.S.C. All authors have read and agreed to the published version of the manuscript.
Funding
The authors Mariani and Coelho thank the National Council of Scientific and Technologic Development of Brazil-CNPq (Grants number: 307958/2019-1-PQ, 307966/2019-4-PQ, 308361/2022-9-PQ, and 408164/2021-2-Universal) and Fundação Araucária PRONEX Grant 042/2018 for its financial support of this work. The author Seman thanks the National Council of Scientific and Technologic Development of Brazil-CNPq (Grants number: 308361/2022-9).
Institutional Review Board Statement
Not applicable.
Informed Consent Statement
Not applicable.
Data Availability Statement
For future comparisons, the proposed method and the considered dataset are available at: https://github.com/SFStefenon/EWT-Seq2Seq-LSTM-Attention (accessed on 10 March 2023).
Conflicts of Interest
The authors declare no conflict of interest.
References
- Branco, N.W.; Cavalca, M.S.M.; Stefenon, S.F.; Leithardt, V.R.Q. Wavelet LSTM for fault forecasting in electrical power grids. Sensors 2022, 22, 8323. [Google Scholar] [CrossRef] [PubMed]
- Souza, B.J.; Stefenon, S.F.; Singh, G.; Freire, R.Z. Hybrid-YOLO for classification of insulators defects in transmission lines based on UAV. Int. J. Electr. Power Energy Syst. 2023, 148, 108982. [Google Scholar] [CrossRef]
- Stefenon, S.F.; Yow, K.C.; Nied, A.; Meyer, L.H. Classification of distribution power grid structures using inception v3 deep neural network. Electr. Eng. 2022, 104, 4557–4569. [Google Scholar] [CrossRef]
- Sopelsa Neto, N.F.; Stefenon, S.F.; Meyer, L.H.; Ovejero, R.G.; Leithardt, V.R.Q. Fault prediction based on leakage current in contaminated insulators using enhanced time series forecasting models. Sensors 2022, 22, 6121. [Google Scholar] [CrossRef] [PubMed]
- Medeiros, A.; Sartori, A.; Stefenon, S.F.; Meyer, L.H.; Nied, A. Comparison of artificial intelligence techniques to failure prediction in contaminated insulators based on leakage current. J. Intell. Fuzzy Syst. 2022, 42, 3285–3298. [Google Scholar] [CrossRef]
- Masood, Z.; Gantassi, R.; Choi, Y. A multi-step time-series clustering-based Seq2Seq LSTM learning for a single household electricity load forecasting. Energies 2022, 15, 2623. [Google Scholar] [CrossRef]
- Zhou, K.; Wang, W.; Hu, T.; Deng, K. Time series forecasting and classification models based on recurrent with attention mechanism and generative adversarial networks. Sensors 2020, 20, 7211. [Google Scholar] [CrossRef] [PubMed]
- He, Y.L.; Chen, L.; Gao, Y.; Ma, J.H.; Xu, Y.; Zhu, Q.X. Novel double-layer bidirectional LSTM network with improved attention mechanism for predicting energy consumption. ISA Trans. 2022, 127, 350–360. [Google Scholar] [CrossRef] [PubMed]
- Peng, L.; Wang, L.; Xia, D.; Gao, Q. Effective energy consumption forecasting using empirical wavelet transform and long short-term memory. Energy 2022, 238, 121756. [Google Scholar] [CrossRef]
- Peng, T.; Zhou, J.; Zhang, C.; Fu, W. Streamflow forecasting using empirical wavelet transform and artificial neural networks. Water 2017, 9, 406. [Google Scholar] [CrossRef] [Green Version]
- Stefenon, S.F.; Freire, R.Z.; Meyer, L.H.; Corso, M.P.; Sartori, A.; Nied, A.; Klaar, A.C.R.; Yow, K.C. Fault detection in insulators based on ultrasonic signal processing using a hybrid deep learning technique. IET Sci. Meas. Technol. 2020, 14, 953–961. [Google Scholar] [CrossRef]
- Xu, Y.; Cheng, J.; Liu, W.; Gao, W. Evaluation of the UHF method based on the investigation of a partial discharge case in post insulators. IEEE Trans. Dielectr. Electr. Insul. 2017, 24, 3669–3676. [Google Scholar] [CrossRef]
- Zheng, H.; Liu, Y.; Sun, Y.; Li, J.; Shi, Z.; Zhang, C.; Lai, C.S.; Lai, L.L. Arbitrary-oriented detection of insulators in thermal imagery via rotation region network. IEEE Trans. Ind. Inform. 2022, 18, 5242–5252. [Google Scholar] [CrossRef]
- Polisetty, S.; El-Hag, A.; Jayram, S. Classification of common discharges in outdoor insulation using acoustic signals and artificial neural network. High Volt. 2019, 4, 333–338. [Google Scholar] [CrossRef]
- Yeh, C.T.; Thanh, P.N.; Cho, M.Y. Real-time leakage current classification of 15kV and 25kV distribution insulators based on bidirectional long short-term memory networks with deep learning machine. IEEE Access 2022, 10, 7128–7140. [Google Scholar] [CrossRef]
- Stefenon, S.F.; Singh, G.; Yow, K.C.; Cimatti, A. Semi-ProtoPNet deep neural network for the classification of defective power grid distribution structures. Sensors 2022, 22, 4859. [Google Scholar] [CrossRef]
- Villalobos, R.J.; Moran, L.A.; Huenupán, F.; Vallejos, F.; Moncada, R.; Pesce, G.C. A new current transducer for on-line monitoring of leakage current on HV insulator strings. IEEE Access 2022, 10, 78818–78826. [Google Scholar] [CrossRef]
- Araya, J.; Montaña, J.; Schurch, R. Electric field distribution and leakage currents in glass insulator under different altitudes and pollutions conditions using FEM simulations. IEEE Lat. Am. Trans. 2021, 19, 1278–1285. [Google Scholar] [CrossRef]
- Salem, A.A.; Abd-Rahman, R.; Al-Gailani, S.A.; Salam, Z.; Kamarudin, M.S.; Zainuddin, H.; Yousof, M.F.M. Risk assessment of polluted glass insulator using leakage current index under different operating conditions. IEEE Access 2020, 8, 175827–175839. [Google Scholar] [CrossRef]
- Park, J.; Hwang, E. A two-stage multistep-ahead electricity load forecasting scheme based on LightGBM and attention-BiLSTM. Sensors 2021, 21, 7697. [Google Scholar] [CrossRef]
- Park, S.H.; Lee, B.Y.; Kim, M.J.; Sang, W.; Seo, M.C.; Baek, J.K.; Yang, J.E.; Mo, C. Development of a soil moisture prediction model based on recurrent neural network long short-term memory (RNN-LSTM) in soybean cultivation. Sensors 2023, 23, 1976. [Google Scholar] [CrossRef]
- Hasan, F.; Huang, H. MALS-Net: A multi-head attention-based LSTM sequence-to-sequence network for socio-temporal interaction modelling and trajectory prediction. Sensors 2023, 23, 530. [Google Scholar] [CrossRef] [PubMed]
- Fernandes, F.; Stefenon, S.F.; Seman, L.O.; Nied, A.; Ferreira, F.C.S.; Subtil, M.C.M.; Klaar, A.C.R.; Leithardt, V.R.Q. Long short-term memory stacking model to predict the number of cases and deaths caused by COVID-19. J. Intell. Fuzzy Syst. 2022, 6, 6221–6234. [Google Scholar] [CrossRef]
- Jiang, J.R.; Lee, J.E.; Zeng, Y.M. Time series multiple channel convolutional neural network with attention-based long short-term memory for predicting bearing remaining useful life. Sensors 2020, 20, 166. [Google Scholar] [CrossRef] [Green Version]
- Zang, H.; Xu, R.; Cheng, L.; Ding, T.; Liu, L.; Wei, Z.; Sun, G. Residential load forecasting based on LSTM fusing self-attention mechanism with pooling. Energy 2021, 229, 120682. [Google Scholar] [CrossRef]
- Qu, J.; Qian, Z.; Pei, Y. Day-ahead hourly photovoltaic power forecasting using attention-based CNN-LSTM neural network embedded with multiple relevant and target variables prediction pattern. Energy 2021, 232, 120996. [Google Scholar] [CrossRef]
- Fazlipour, Z.; Mashhour, E.; Joorabian, M. A deep model for short-term load forecasting applying a stacked autoencoder based on LSTM supported by a multi-stage attention mechanism. Appl. Energy 2022, 327, 120063. [Google Scholar] [CrossRef]
- Lin, J.; Ma, J.; Zhu, J.; Cui, Y. Short-term load forecasting based on LSTM networks considering attention mechanism. Int. J. Electr. Power Energy Syst. 2022, 137, 107818. [Google Scholar] [CrossRef]
- Zhu, K.; Li, Y.; Mao, W.; Li, F.; Yan, J. LSTM enhanced by dual-attention-based encoder-decoder for daily peak load forecasting. Electr. Power Syst. Res. 2022, 208, 107860. [Google Scholar] [CrossRef]
- Li, Y.; Tong, Z.; Tong, S.; Westerdahl, D. A data-driven interval forecasting model for building energy prediction using attention-based LSTM and fuzzy information granulation. Sustain. Cities Soc. 2022, 76, 103481. [Google Scholar] [CrossRef]
- Meng, A.; Wang, P.; Zhai, G.; Zeng, C.; Chen, S.; Yang, X.; Yin, H. Electricity price forecasting with high penetration of renewable energy using attention-based LSTM network trained by crisscross optimization. Energy 2022, 254, 124212. [Google Scholar] [CrossRef]
- Qin, J.; Zhang, Y.; Fan, S.; Hu, X.; Huang, Y.; Lu, Z.; Liu, Y. Multi-task short-term reactive and active load forecasting method based on attention-LSTM model. Int. J. Electr. Power Energy Syst. 2022, 135, 107517. [Google Scholar] [CrossRef]
- Dai, Y.; Zhou, Q.; Leng, M.; Yang, X.; Wang, Y. Improving the Bi-LSTM model with XGBoost and attention mechanism: A combined approach for short-term power load prediction. Appl. Soft Comput. 2022, 130, 109632. [Google Scholar] [CrossRef]
- Xia, M.; Shao, H.; Ma, X.; de Silva, C.W. A stacked GRU-RNN-based approach for predicting renewable energy and electricity load for smart grid operation. IEEE Trans. Ind. Inform. 2021, 17, 7050–7059. [Google Scholar] [CrossRef]
- Stefenon, S.F.; Dal Molin Ribeiro, M.H.; Nied, A.; Mariani, V.C.; dos Santos Coelho, L.; Menegat da Rocha, D.F.; Grebogi, R.B.; de Barros Ruano, A.E. Wavelet group method of data handling for fault prediction in electrical power insulators. Int. J. Electr. Power Energy Syst. 2020, 123, 106269. [Google Scholar] [CrossRef]
- Belagoune, S.; Bali, N.; Bakdi, A.; Baadji, B.; Atif, K. Deep learning through LSTM classification and regression for transmission line fault detection, diagnosis and location in large-scale multi-machine power systems. Measurement 2021, 177, 109330. [Google Scholar] [CrossRef]
- Thomas, J.B.; Shihabudheen, K.V. Neural architecture search algorithm to optimize deep transformer model for fault detection in electrical power distribution systems. Eng. Appl. Artif. Intell. 2023, 120, 105890. [Google Scholar] [CrossRef]
- Dashti, R.; Daisy, M.; Mirshekali, H.; Shaker, H.R.; Hosseini Aliabadi, M. A survey of fault prediction and location methods in electrical energy distribution networks. Measurement 2021, 184, 109947. [Google Scholar] [CrossRef]
- Vaish, R.; Dwivedi, U.; Tewari, S.; Tripathi, S. Machine learning applications in power system fault diagnosis: Research advancements and perspectives. Eng. Appl. Artif. Intell. 2021, 106, 104504. [Google Scholar] [CrossRef]
- Li, F.; Gui, Z.; Zhang, Z.; Peng, D.; Tian, S.; Yuan, K.; Sun, Y.; Wu, H.; Gong, J.; Lei, Y. A hierarchical temporal attention-based LSTM encoder-decoder model for individual mobility prediction. Neurocomputing 2020, 403, 153–166. [Google Scholar] [CrossRef]
- Cao, M.; Yao, R.; Xia, J.; Jia, K.; Wang, H. LSTM attention neural-network-based signal detection for hybrid modulated Faster-Than-Nyquist optical wireless communications. Sensors 2022, 22, 8992. [Google Scholar] [CrossRef]
- Shi, B.; Jiang, Y.; Bao, Y.; Chen, B.; Yang, K.; Chen, X. Weigh-in-motion system based on an improved kalman and LSTM-attention algorithm. Sensors 2023, 23, 250. [Google Scholar] [CrossRef]
- Sehovac, L.; Grolinger, K. Deep learning for load forecasting: Sequence to sequence recurrent neural networks with attention. IEEE Access 2020, 8, 36411–36426. [Google Scholar] [CrossRef]
- Nadeem, A.; Naveed, M.; Islam Satti, M.; Afzal, H.; Ahmad, T.; Kim, K.I. Depression detection based on hybrid deep learning SSCL framework using self-attention mechanism: An application to social networking data. Sensors 2022, 22, 9775. [Google Scholar] [CrossRef] [PubMed]
- Stefenon, S.F.; Seman, L.O.; Mariani, V.C.; Coelho, L.d.S. Aggregating prophet and seasonal trend decomposition for time series forecasting of Italian electricity spot prices. Energies 2023, 16, 1371. [Google Scholar] [CrossRef]
- Yang, Z.; Liu, L.; Li, N.; Tian, J. Time series forecasting of motor bearing vibration based on informer. Sensors 2022, 22, 5858. [Google Scholar] [CrossRef]
- Wei, Y.; Liu, H. Convolutional long-short term memory network with multi-head attention mechanism for traffic flow prediction. Sensors 2022, 22, 7994. [Google Scholar] [CrossRef]
- Du, S.; Li, T.; Yang, Y.; Horng, S.J. Multivariate time series forecasting via attention-based encoder–decoder framework. Neurocomputing 2020, 388, 269–279. [Google Scholar] [CrossRef]
- Akiba, T.; Sano, S.; Yanase, T.; Ohta, T.; Koyama, M. Optuna: A next-generation hyperparameter optimization framework. In Proceedings of the 25th ACM SIGKDD International Conference on Knowledge Discovery & Data Mining, Anchorage, AK, USA, 4–8 August 2019; pp. 2623–2631. [Google Scholar] [CrossRef]
- Du, L.; Gao, R.; Suganthan, P.N.; Wang, D.Z. Bayesian optimization based dynamic ensemble for time series forecasting. Inf. Sci. 2022, 591, 155–175. [Google Scholar] [CrossRef]
- Nguyen, H.P.; Liu, J.; Zio, E. A long-term prediction approach based on long short-term memory neural networks with automatic parameter optimization by Tree-structured Parzen Estimator and applied to time-series data of NPP steam generators. Appl. Soft Comput. 2020, 89, 106116. [Google Scholar] [CrossRef] [Green Version]
- Li, J.; Chen, Z.; Li, X.; Yi, X.; Zhao, Y.; He, X.; Huang, Z.; Hassaan, M.A.; El Nemr, A.; Huang, M. Water quality soft-sensor prediction in anaerobic process using deep neural network optimized by Tree-structured Parzen Estimator. Front. Environ. Sci. Eng. 2023, 17, 67. [Google Scholar] [CrossRef]
- Rong, G.; Li, K.; Su, Y.; Tong, Z.; Liu, X.; Zhang, J.; Zhang, Y.; Li, T. Comparison of tree-structured parzen estimator optimization in three typical neural network models for landslide susceptibility assessment. Remote Sens. 2021, 13, 4694. [Google Scholar] [CrossRef]
- Gilles, J. Empirical wavelet transform. IEEE Trans. Signal Process. 2013, 61, 3999–4010. [Google Scholar] [CrossRef]
- Carvalho, V.R.; Moraes, M.F.; Braga, A.P.; Mendes, E.M. Evaluating five different adaptive decomposition methods for EEG signal seizure detection and classification. Biomed. Signal Process. Control 2020, 62, 102073. [Google Scholar] [CrossRef]
- Baak, M.; Koopman, R.; Snoek, H.; Klous, S. A new correlation coefficient between categorical, ordinal and interval variables with Pearson characteristics. arXiv 2018. [Google Scholar] [CrossRef]
Figure 1.
General overview of the network architecture, including a Seq2Seq encoder–decoder and attention mechanism.
Figure 1.
General overview of the network architecture, including a Seq2Seq encoder–decoder and attention mechanism.

Figure 2.
Correlation of the samples based on their leakage current values.

Figure 3.
Leakage current of the evaluated insulators.

Figure 4.
EWT detrend results.

Figure 5.
Hyperparameter optimization with Optuna.

Figure 6.
Prediction results compared to the observed signal.

Figure 7.
Histogram of MSE, MAE, and MAPE for 50 runs with Gaussian noise.

Figure 8.
Violin of MSE, MAE, and MAPE for 50 runs with Gaussian noise.


Table 1.
Summary of LSTM for time series forecasting.
| Author(s) | Methodology |
|---|---|
| Zang et al. [25] | LSTM with a self-attention mechanism for day-ahead residential load forecasting. |
| Qu et al. [26] | Attention-based LSTM model for short-term prediction. |
| Fazlipour et al. [27] | LSTM-based stackable autoencoder with attention mechanism for short-term load forecasting. |
| Lin et al. [28] | Dual-attention LSTM model for short-term load forecasting with probabilistic predictions. |
| Zhu et al. [29] | Dual-attention LSTM model for analyzing characteristics of daily peak load simultaneously. |
| Li et al. [30] | Deep learning-based interval prediction model combining attention mechanism and LSTM. |
| Meng et al. [31] | Attention mechanism for LSTM forecasting model with empirical wavelet transform % for electricity price prediction. |
| Qin et al. [32] | Multi-task LSTM model with attention mechanism for predicting loads of a substation. |
| Dai et al. [33] | Combined LSTM with attention mechanism and XGBoost for short-term load forecasting. |
Table 2.
Statistical characteristics of the dataset.
| Insul. 1 | Insul. 2 | Insul. 3 | Insul. 4 | Insul. 5 | Insul. 6 | |
|---|---|---|---|---|---|---|
| Mean | 0.08947 | 0.11890 | 0.12323 | 0.06242 | 0.02737 | 0.04913 |
| Median | 0.13200 | 0.10400 | 0.11800 | 0.09500 | 0.03800 | 0.05000 |
| Mode | 0.00000 | 0.10300 | 0.11700 | 0.00000 | 0.00000 | 0.00000 |
| Range | 0.26400 | 0.22700 | 0.26600 | 0.19300 | 0.17100 | 0.75500 |
| Variance | 0.00594 | 0.00173 | 0.00186 | 0.00216 | 0.00058 | 0.00261 |
| Std. Dev. | 0.07710 | 0.04156 | 0.04309 | 0.04643 | 0.02403 | 0.05113 |
| 25th %ile | 0.00000 | 0.10200 | 0.11200 | 0.00000 | 0.00000 | 0.00000 |
| 50th %ile | 0.13200 | 0.10400 | 0.11800 | 0.09500 | 0.03800 | 0.05000 |
| 75th %ile | 0.13800 | 0.13800 | 0.15300 | 0.10100 | 0.04200 | 0.09000 |
| IQR | 0.13800 | 0.03600 | 0.04100 | 0.10100 | 0.04200 | 0.09000 |
| Skewness | 0.20900 | 0.88310 | 0.17629 | −0.31889 | 0.25156 | 2.92524 |
| Kurtosis | −1.05212 | 0.84858 | 0.36154 | −1.45492 | 0.20065 | 36.47633 |
Table 3.
Assessment of the influence of how the dataset is loaded.
| Train/Test (%) | Batch Size | MSE | MAE | MAPE | Time (s) |
|---|---|---|---|---|---|
| 70/30 | 8 | 1117.92 | |||
| 16 | 1.50 × | 330.82 | |||
| 32 | 148.29 | ||||
| 64 | 90.23 | ||||
| 80/20 | 8 | 628.88 | |||
| 16 | 281.13 | ||||
| 32 | 208.49 | ||||
| 64 | 60.34 | ||||
| 90/10 | 8 | 679.75 | |||
| 16 | 352.54 | ||||
| 32 | 1.17 × | 2.16 × | 2.44 × | 208.50 | |
| 64 | 148.19 |
Table 4.
Model comparison analysis.
| Model | MSE | MAE | MAPE | Time (s) |
|---|---|---|---|---|
| EWT-Seq2Seq-LSTM Standard | 1.18 × | 239.89 | ||
| EWT-Seq2Seq-LSTM with Attention | 328.68 | |||
| Proposed Method | 1.06× | 2.08 × | 2.11× | 277.59 |
Table 5.
Evaluation of stacking ensemble learning method.
| Solver | Function | MSE | MAE | MAPE | Time (s) |
|---|---|---|---|---|---|
| L1QP | Linear | 1.50 | 2.99 | 1.67 | 3.59 |
| RBF | 1.69 | ||||
| Polynomial | 1.67 | ||||
| ISDA | Linear | 1.48 | 2.98 | 1.66 | 1.38 |
| RBF | 0.53 | ||||
| Polynomial | 18.45 | ||||
| SMO | Linear | 1.45 | 2.94 | 1.65 | 0.92 |
| RBF | 0.47 | ||||
| Polynomial | 32.03 |
Disclaimer/Publisher’s Note: The statements, opinions and data contained in all publications are solely those of the individual author(s) and contributor(s) and not of MDPI and/or the editor(s). MDPI and/or the editor(s) disclaim responsibility for any injury to people or property resulting from any ideas, methods, instructions or products referred to in the content. |
© 2023 by the authors. Licensee MDPI, Basel, Switzerland. This article is an open access article distributed under the terms and conditions of the Creative Commons Attribution (CC BY) license (https://creativecommons.org/licenses/by/4.0/).
Share and Cite
MDPI and ACS Style
Klaar, A.C.R.; Stefenon, S.F.; Seman, L.O.; Mariani, V.C.; Coelho, L.d.S. Optimized EWT-Seq2Seq-LSTM with Attention Mechanism to Insulators Fault Prediction. Sensors 2023, 23, 3202. https://doi.org/10.3390/s23063202
AMA Style
Klaar ACR, Stefenon SF, Seman LO, Mariani VC, Coelho LdS. Optimized EWT-Seq2Seq-LSTM with Attention Mechanism to Insulators Fault Prediction. Sensors. 2023; 23(6):3202. https://doi.org/10.3390/s23063202
Chicago/Turabian StyleKlaar, Anne Carolina Rodrigues, Stefano Frizzo Stefenon, Laio Oriel Seman, Viviana Cocco Mariani, and Leandro dos Santos Coelho. 2023. "Optimized EWT-Seq2Seq-LSTM with Attention Mechanism to Insulators Fault Prediction" Sensors 23, no. 6: 3202. https://doi.org/10.3390/s23063202
Note that from the first issue of 2016, this journal uses article numbers instead of page numbers. See further details here.