
Synthesis and Sensing Response of Magnesium Antimoniate Oxide (MgSb2O6) in the Presence of Propane Atmospheres at Different Operating Voltages
 , , ,
, , ,
Abstract
:1. Introduction
2. Materials and Methods
2.1. Synthesis
2.2. Physical Characterization
2.3. Dynamic Tests in C3H8 Atmospheres
3. Results
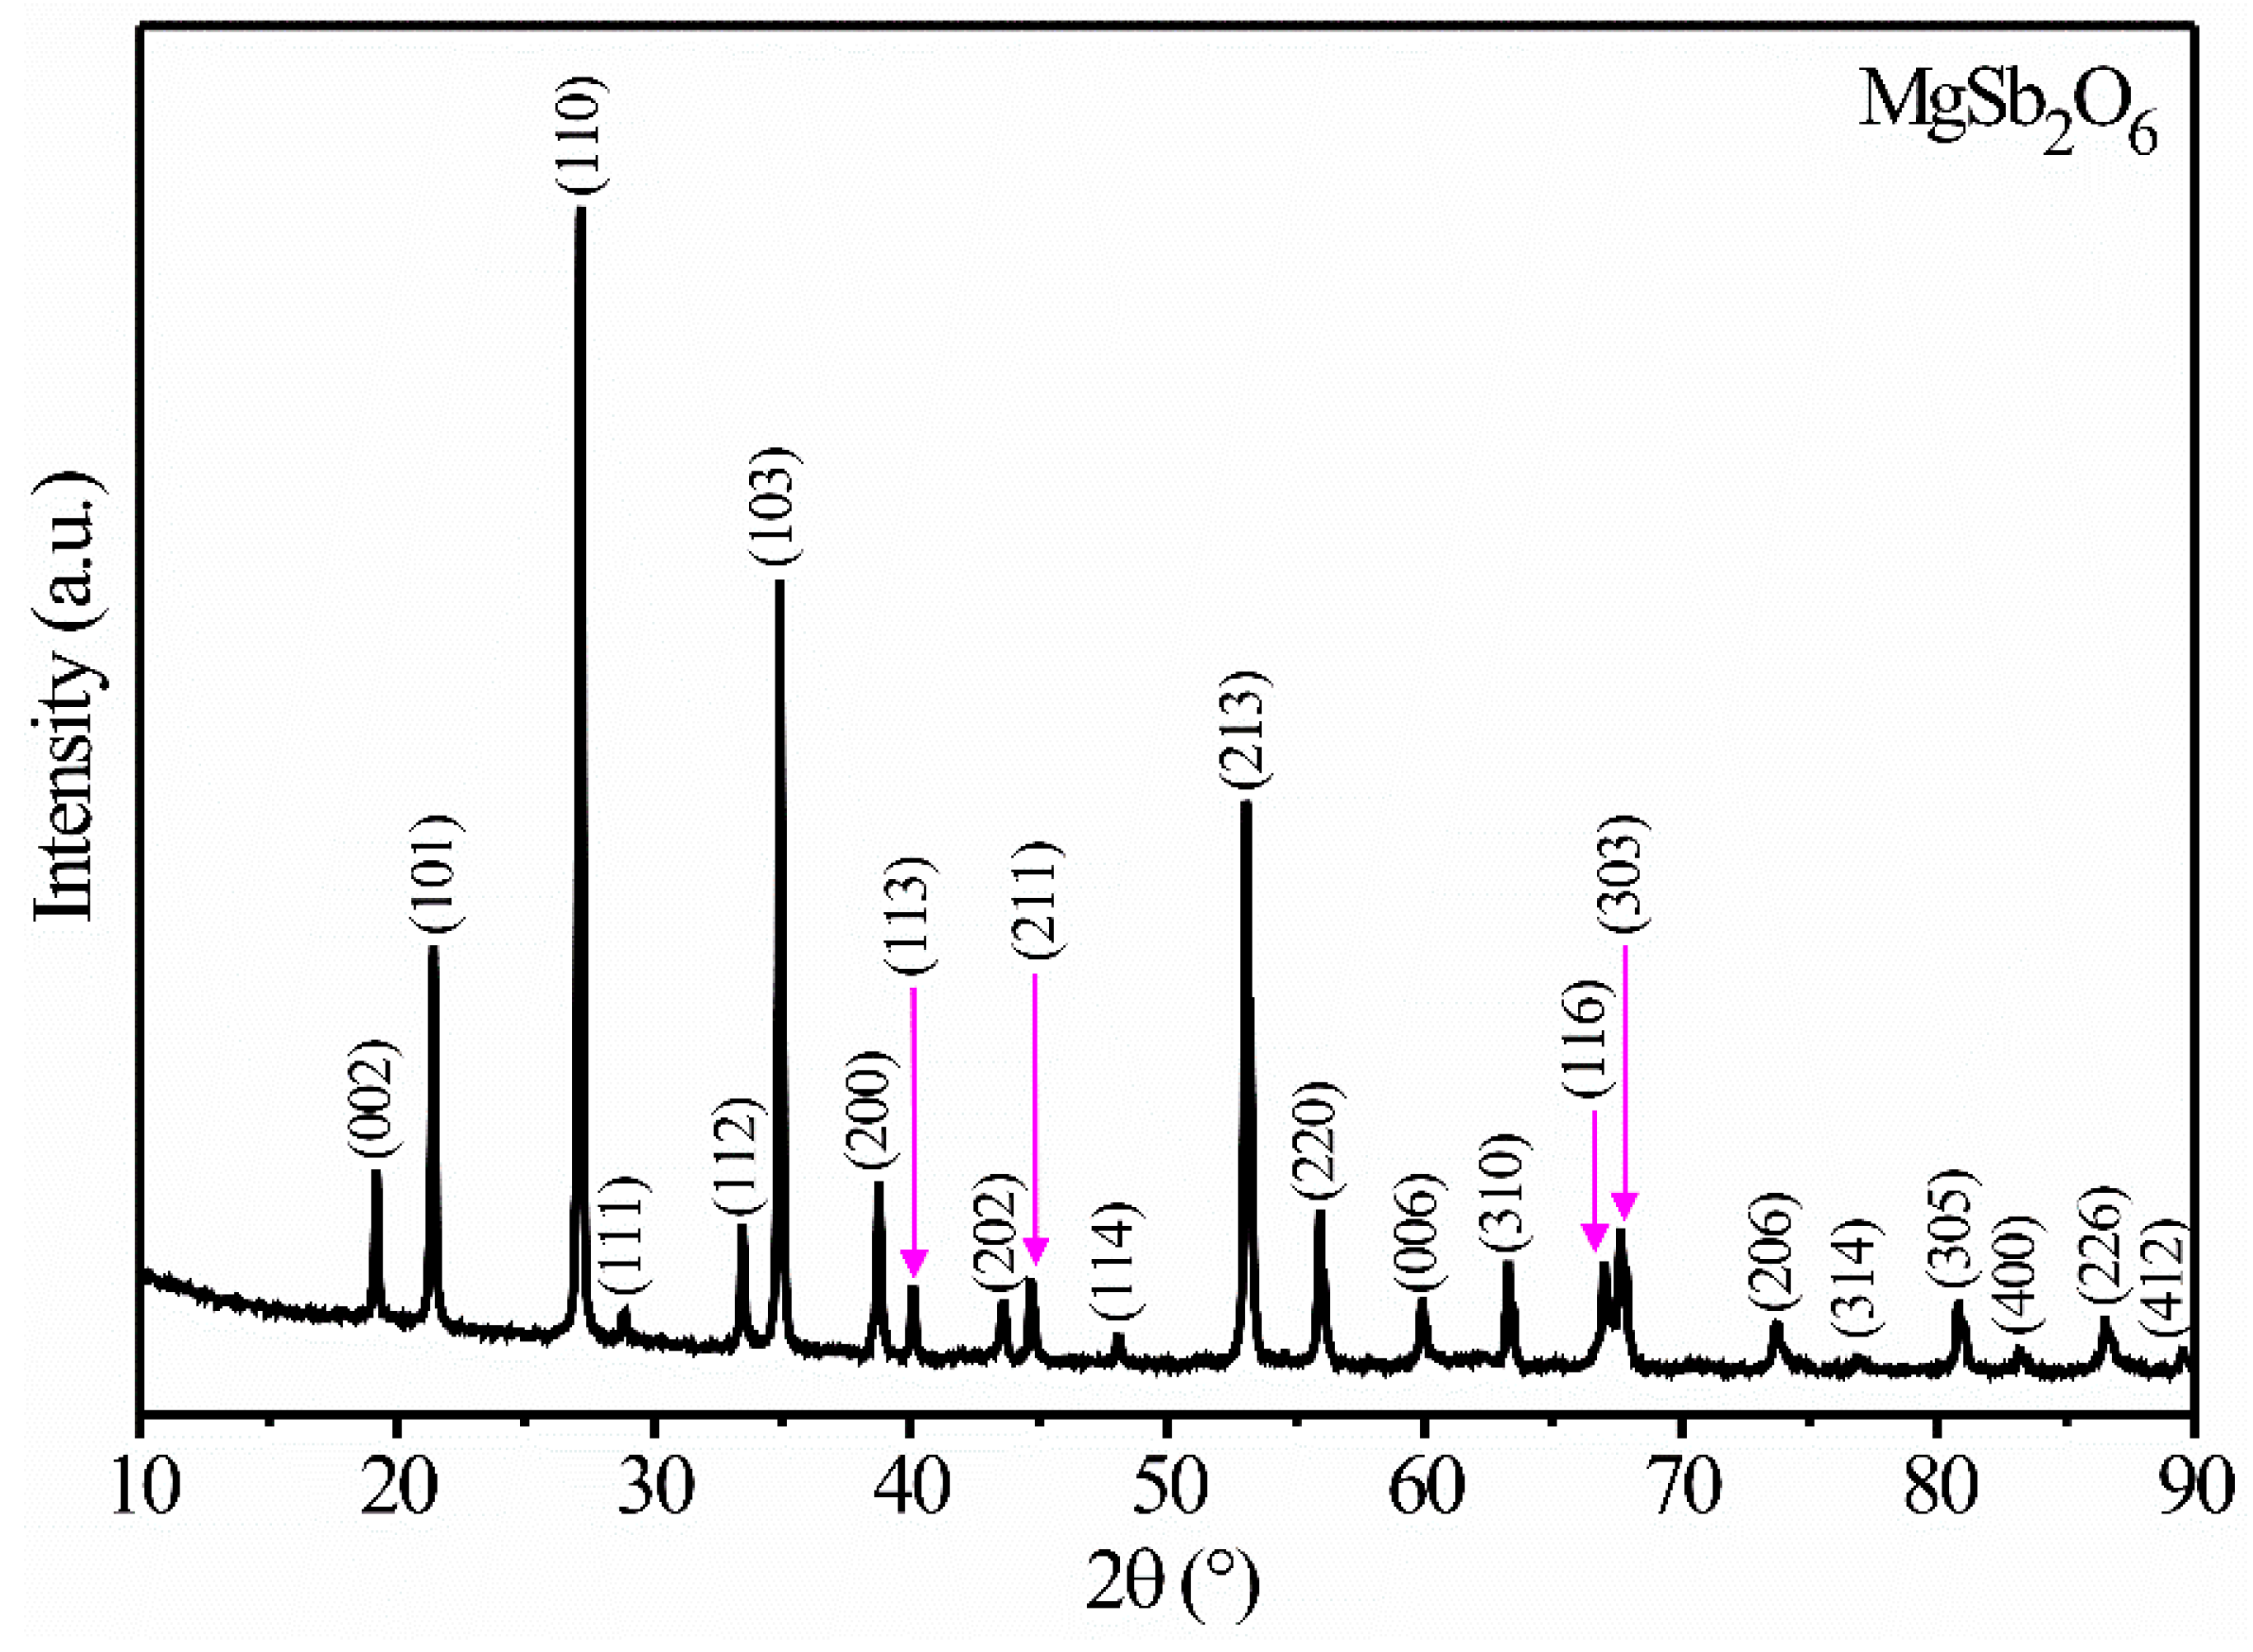
3.1. XRD Analysis
3.2. UV-Vis Analysis
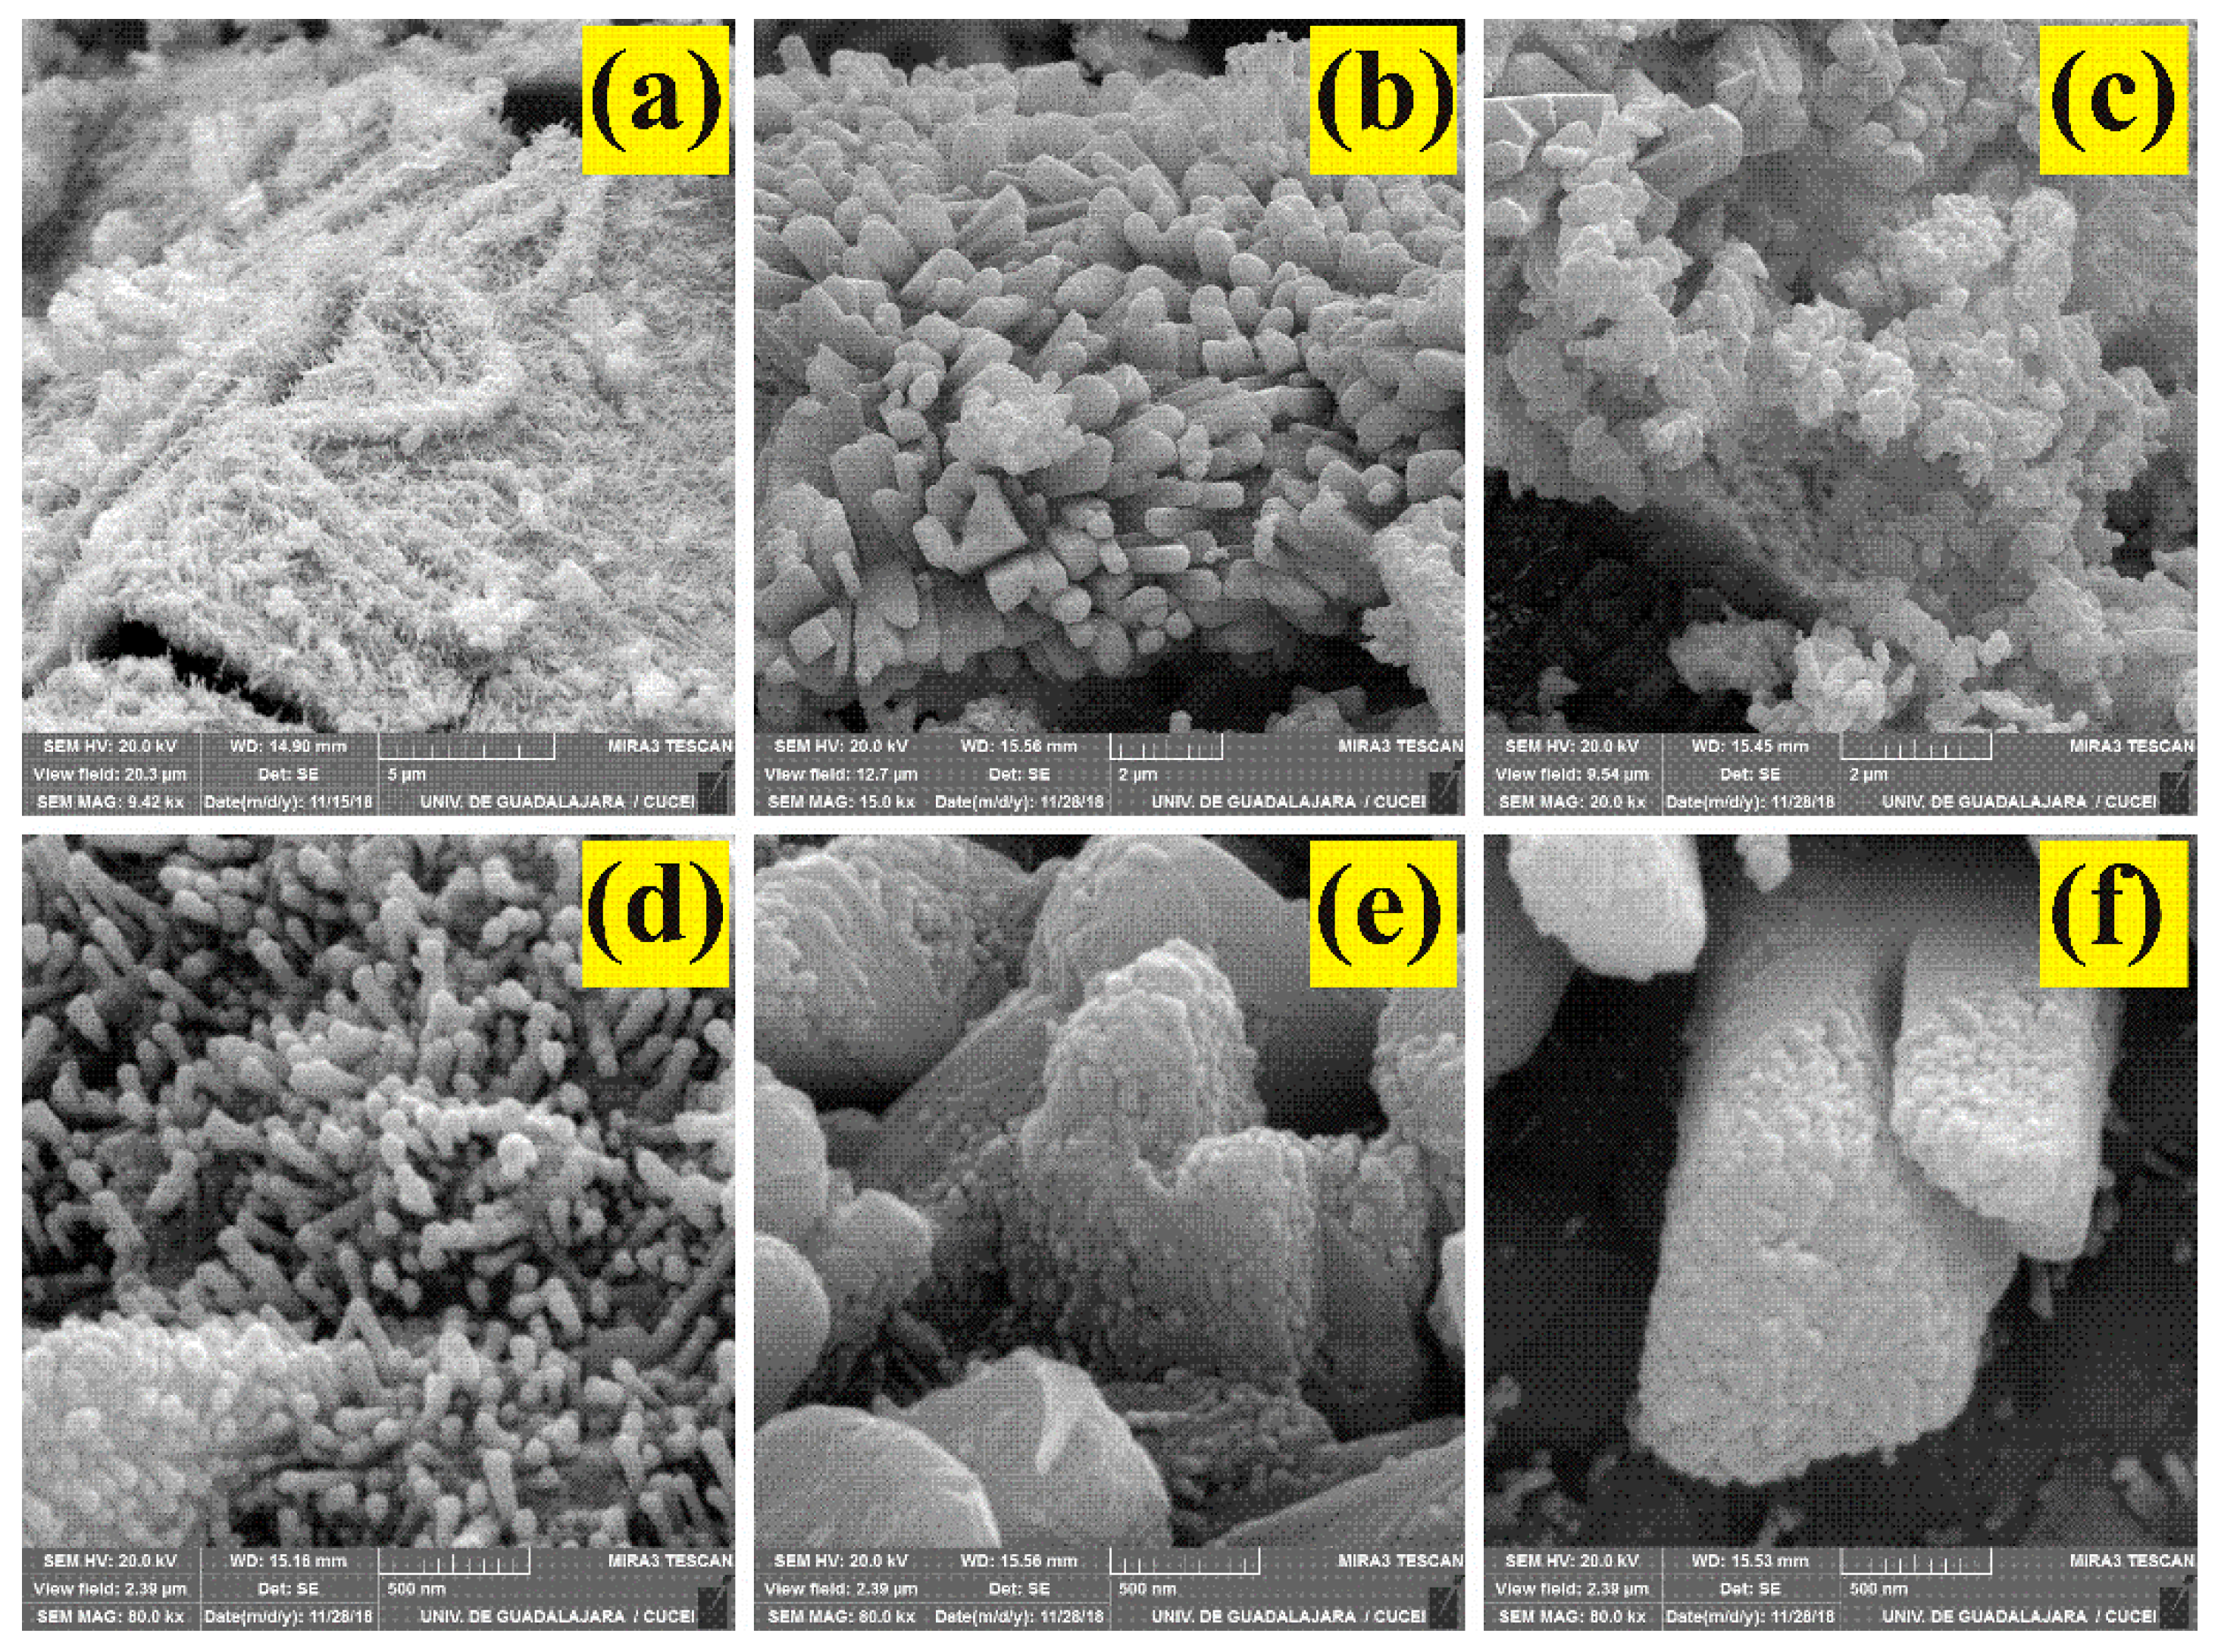
3.3. SEM Analysis
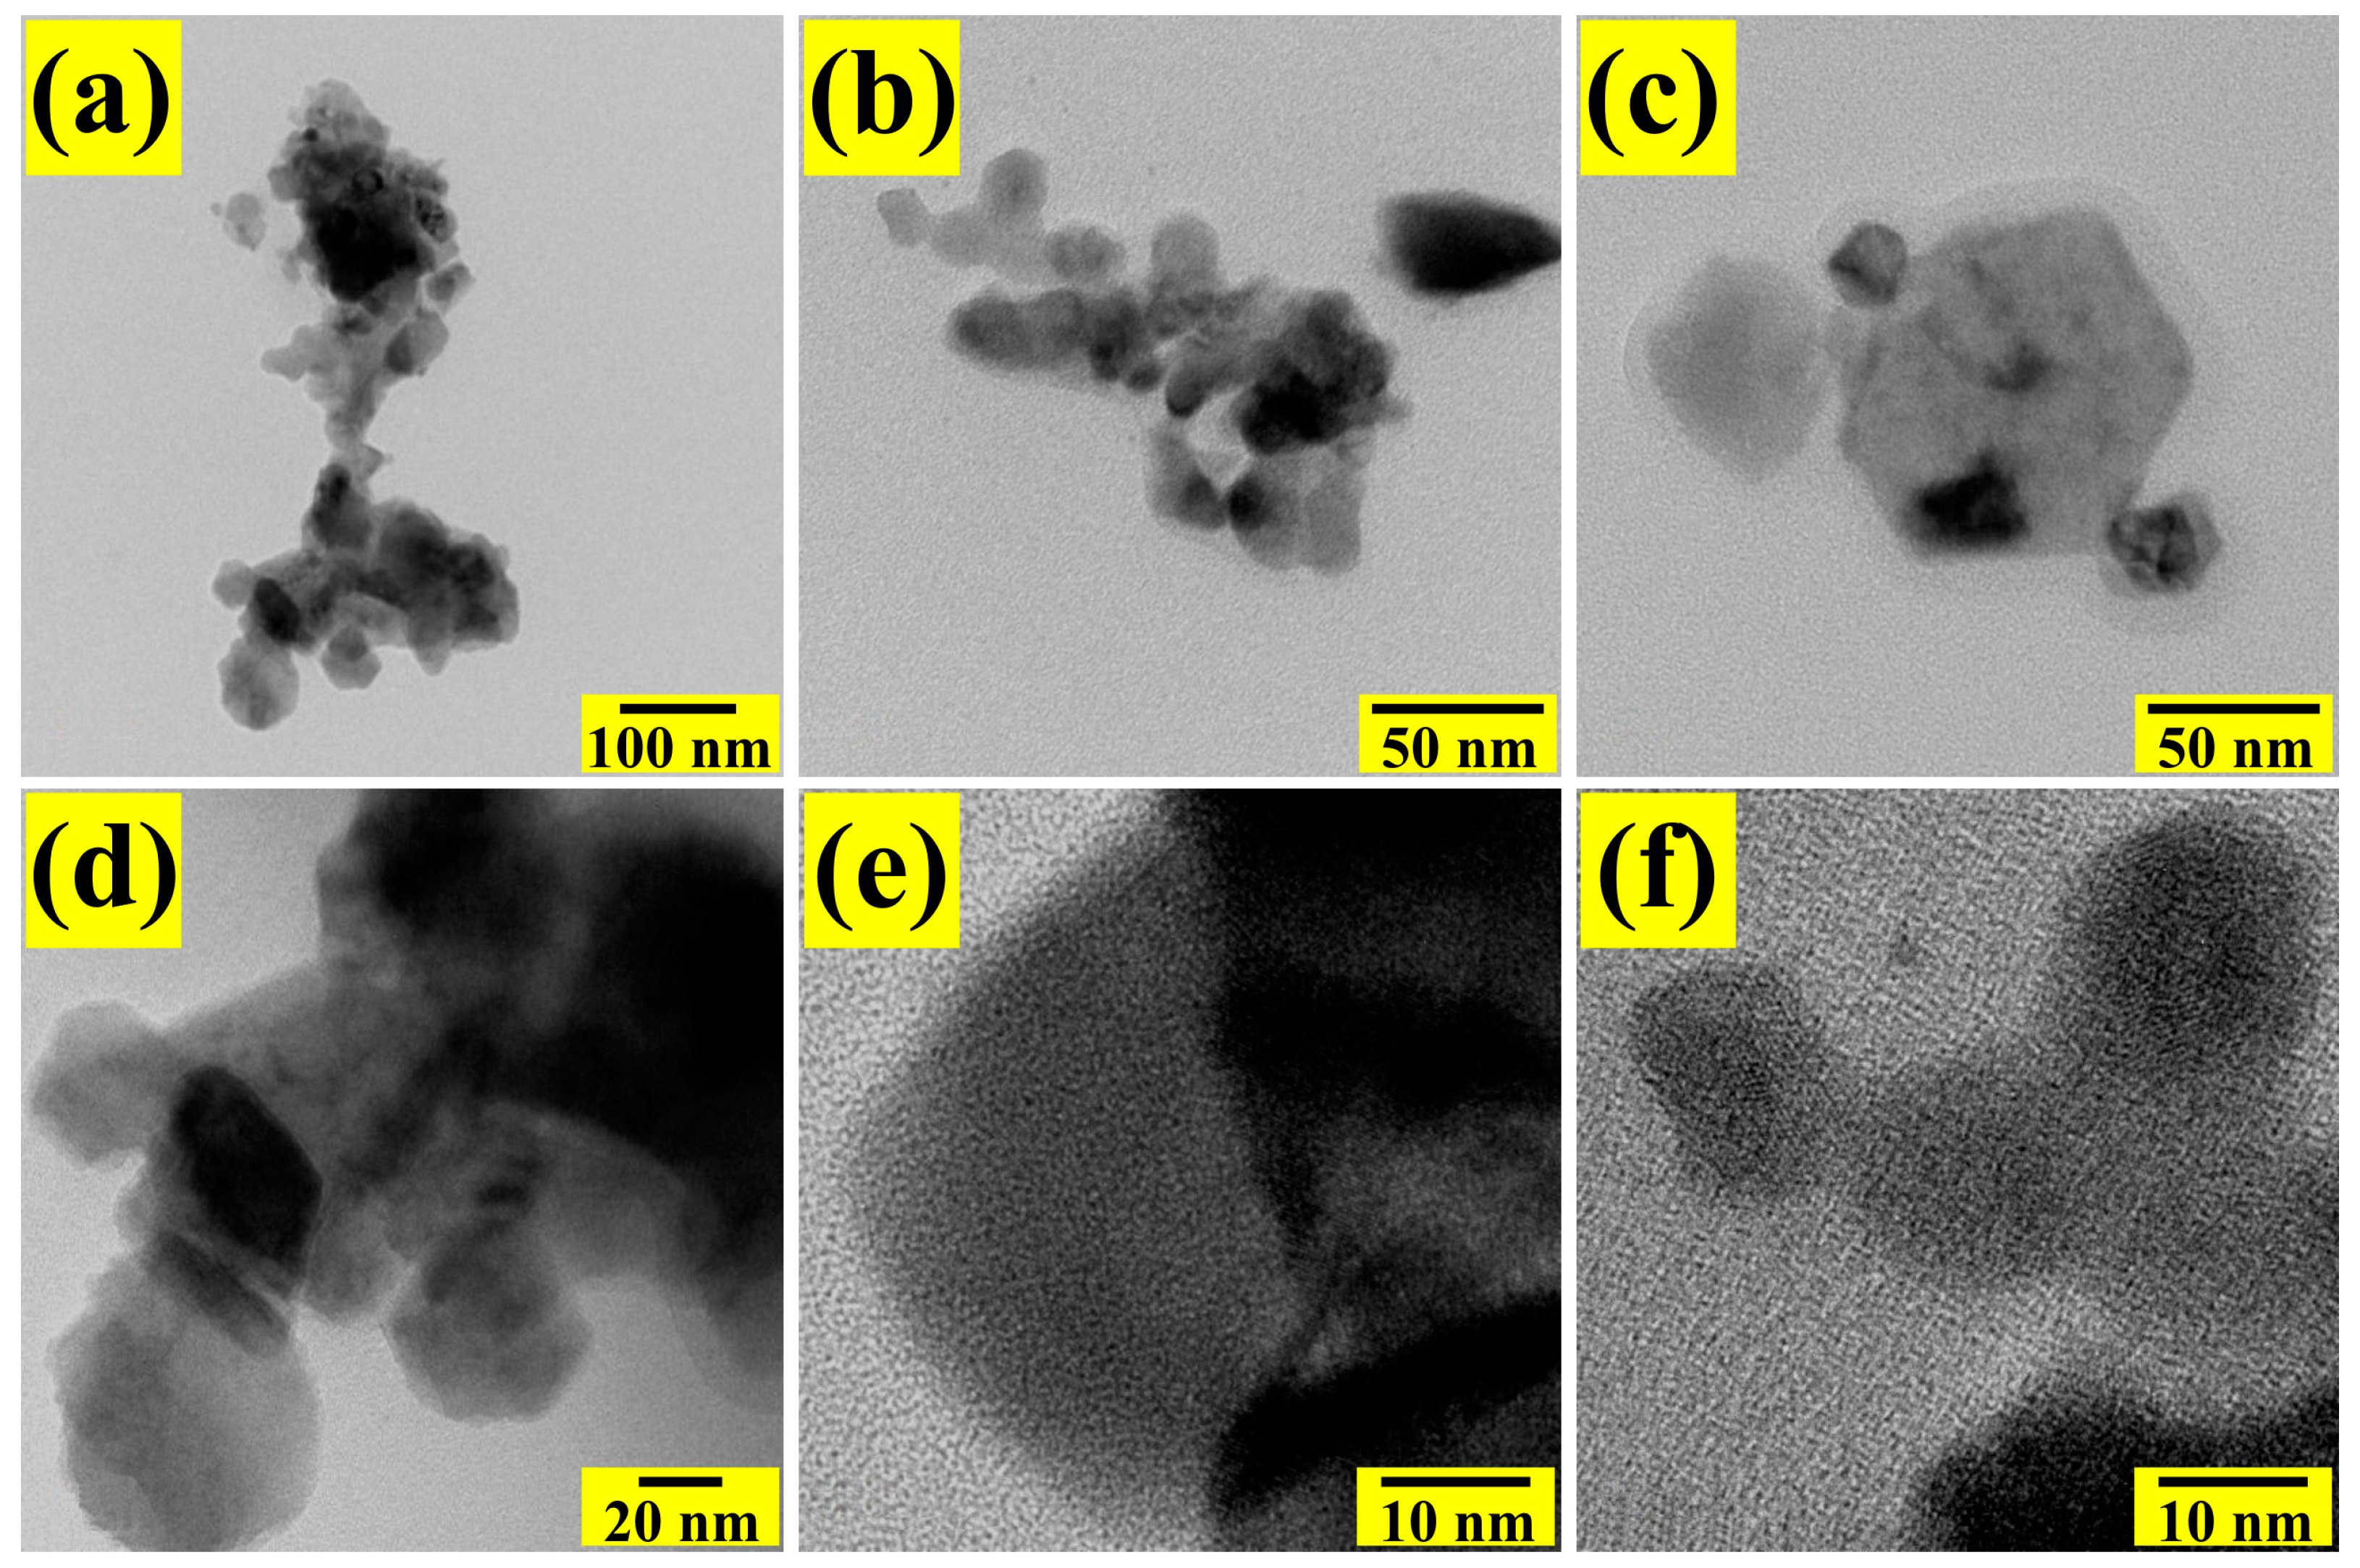
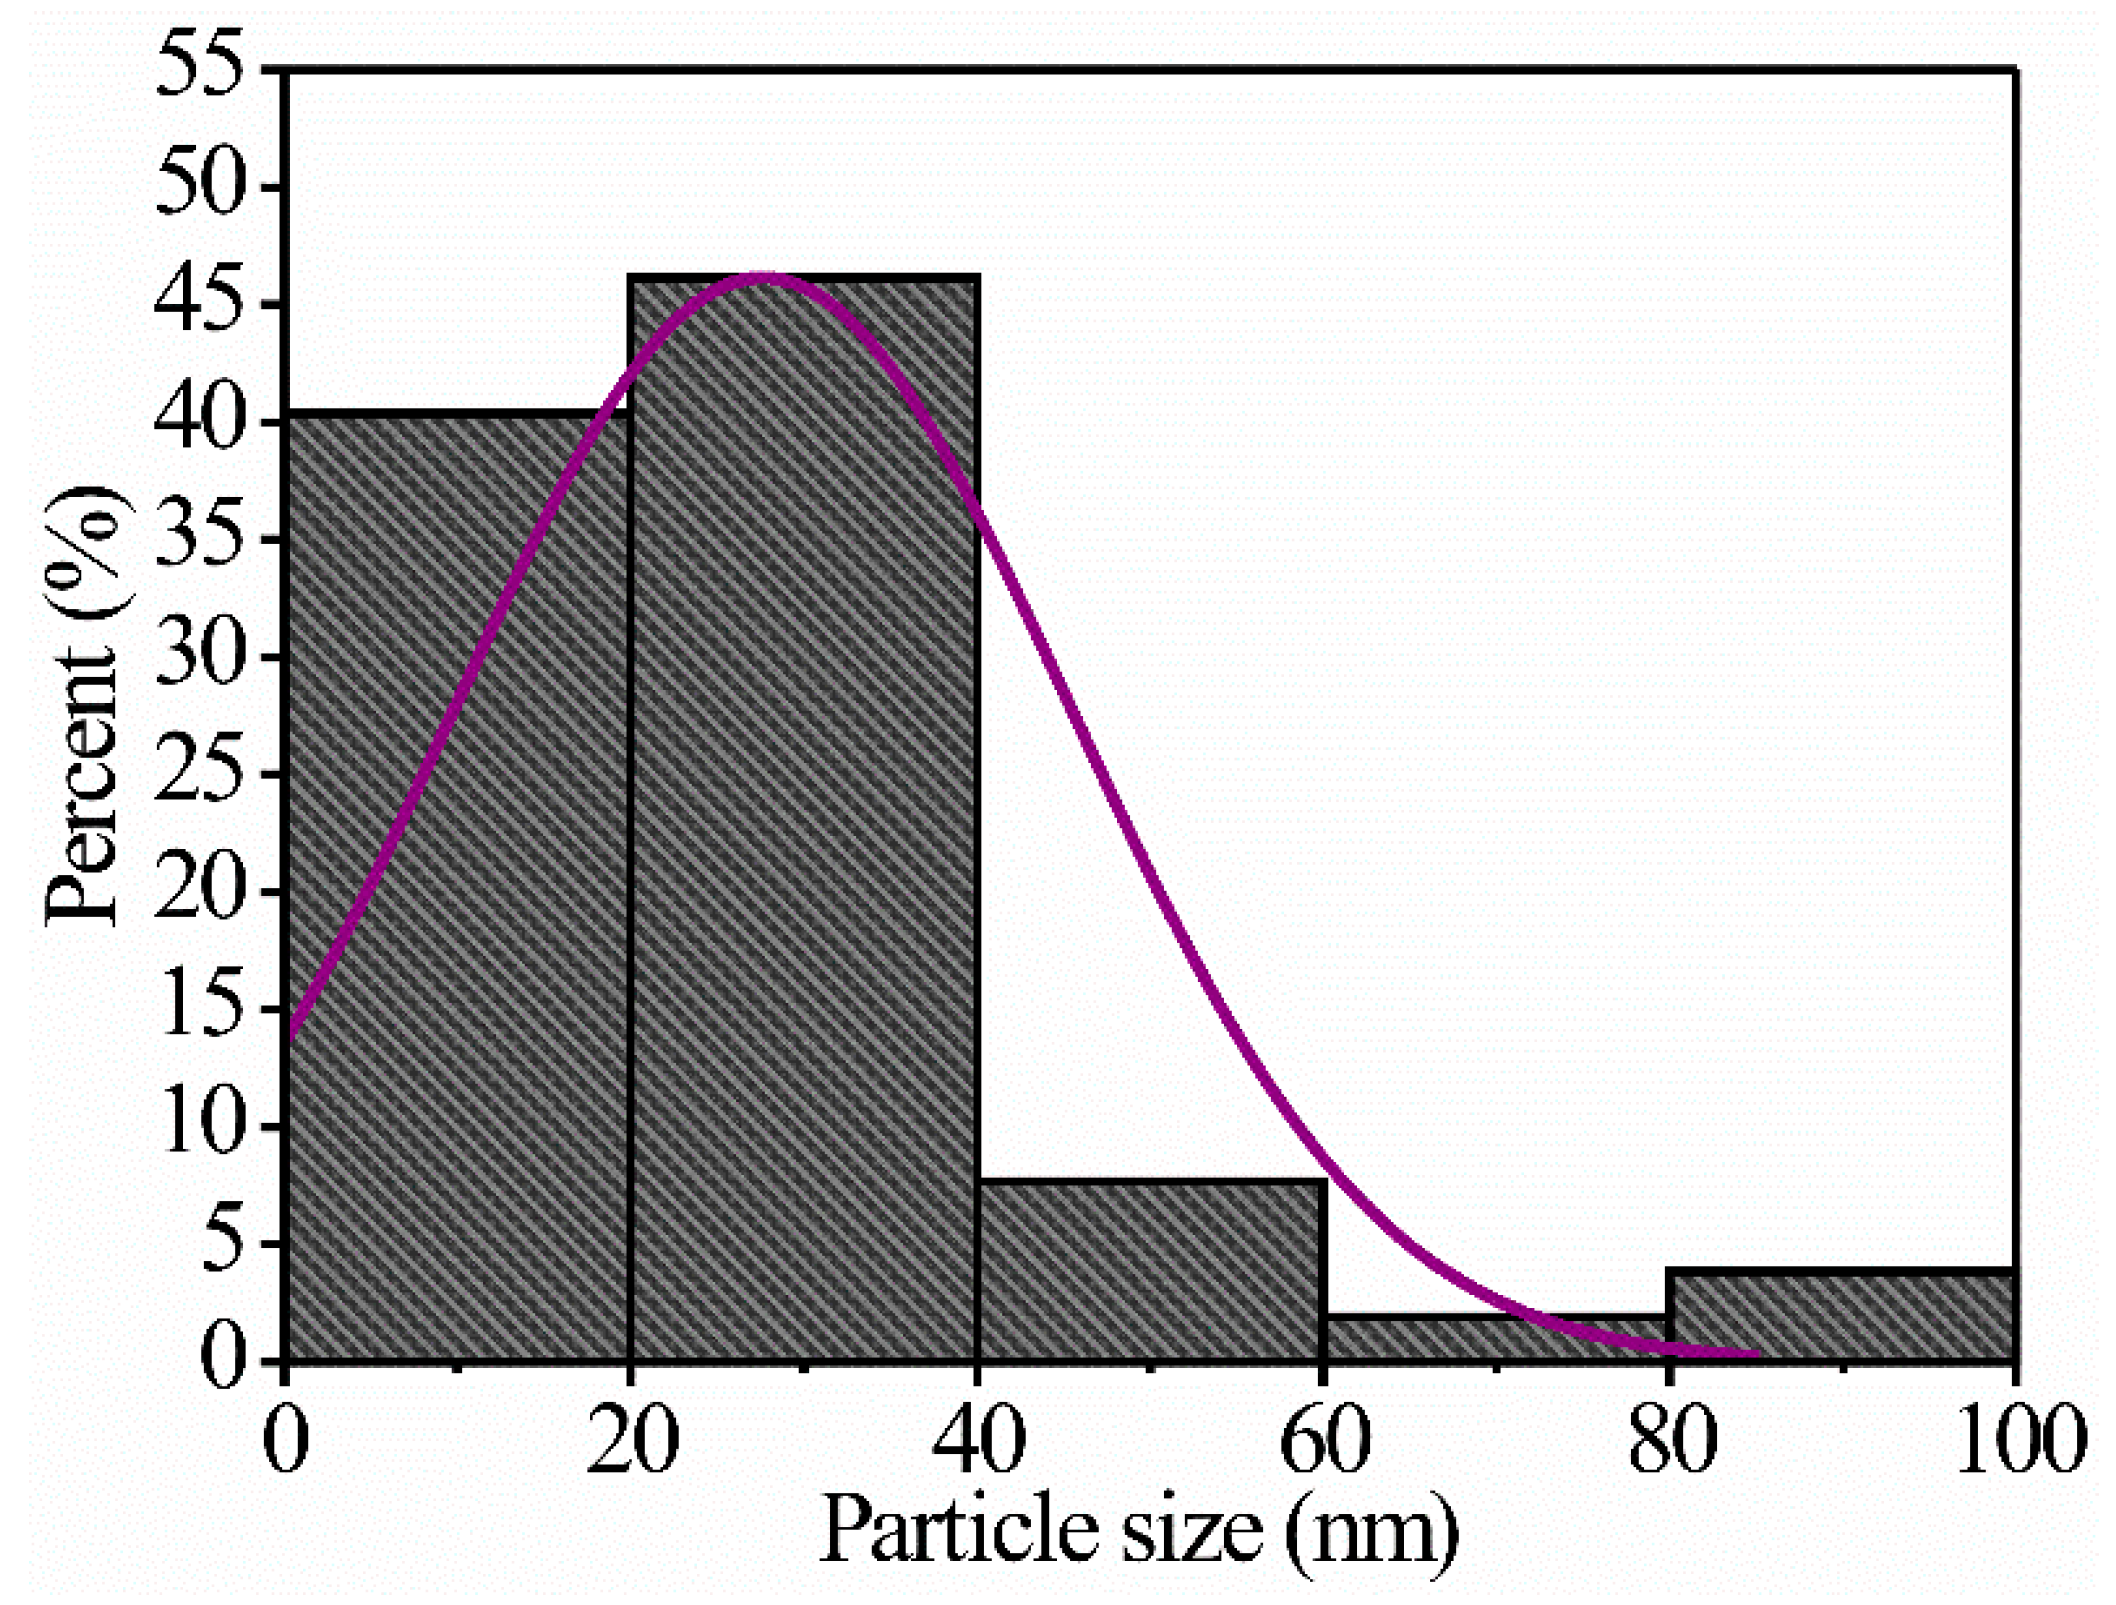
3.4. TEM Analysis
3.5. Gas-Sensing Properties
4. Conclusions
Author Contributions
Funding
Institutional Review Board Statement
Informed Consent Statement
Data Availability Statement
Acknowledgments
Conflicts of Interest
References
- Ayesh, A.I. Metal/metal-Oxide nanoclusters for gas sensor applications. J. Nanomater. 2016, 2016, 2359019. [Google Scholar] [CrossRef]
- Fazio, E.; Spadaro, S.; Corsaro, C.; Neri, G.; Gianluca Leonardi, S.; Neri, F.; Lavanya, N.; Sekar, C.; Donato, N.; Neri, G. Metal-Oxide based nanomaterials: Synthesis, characterization and their applications in electrical and electrochemical sensors. Sensors 2021, 21, 2494. [Google Scholar] [CrossRef]
- Comini, E.; Baratto, C.; Concina, I.; Faglia, G.; Falasconi, M.; Ferroni, M.; Galstyan, V.; Gobbi, E.; Ponzoni, A.; Vomiero, A. Metal oxide nanoscience and nanotechnology for chemical sensors. Sens. Actuators B Chem. 2013, 179, 3–20. [Google Scholar] [CrossRef]
- Korotcenkov, G. Metal oxides for solid-state gas sensors: What determines our choice? Mater. Sci. Eng. B 2007, 139, 1–23. [Google Scholar] [CrossRef]
- Zappa, D.; Galstyan, V.; Kaur, N.; Munasinghe Arachchige, H.M.M.; Sisman, O.; Comini, E. “Metal oxide -based heterostructures for gas sensors”—A review. Anal. Chim. Acta 2018, 1039, 1–23. [Google Scholar] [CrossRef]
- Shingange, K.; Swart, H.C.; Mhlongo, G.H. Design of porous p-type LaCoO3 nanofibers with remarkable response and selectivity to ethanol at low operating temperature. Sens. Actuators B Chem. 2020, 308, 127670. [Google Scholar] [CrossRef]
- Guillen Bonilla, J.T.; Guillen Bonilla, H.; Rodríguez-Betancourtt, V.M.; Guillen Bonilla, A.; Casillas Zamora, A.; Blanco Alonso, O.; Ramírez Ortega, J.A. A gas sensor for application as a propane leak detector. J. Sens. 2021, 2021, 8871166. [Google Scholar] [CrossRef]
- Vesna Nikolic, M.; Milovanovic, V.; Vasiljevic, Z.Z.; Stamenkovic, Z. Semiconductor gas sensors: Materials, technology, design, and application. Sensors 2020, 20, 6694. [Google Scholar] [CrossRef]
- Hua, Z.; Tian, C.; Huang, D.; Yuan, W.; Zhang, C.; Tian, X.; Wang, M.; Li, E. Power-law response of metal oxide semiconductor gas sensors to oxygen in presence of reducing gases. Sens. Actuators B Chem. 2018, 267, 510–518. [Google Scholar] [CrossRef]
- Kim, H.J.; Lee, J.H. Highly sensitive and selective gas sensors using p-type oxide semiconductors: Overview. Sens. Actuators B Chem. 2014, 192, 607–627. [Google Scholar] [CrossRef]
- Dey, A. Semiconductor metal oxide gas sensors: A review. Mater. Sci. Eng. B 2018, 229, 206–217. [Google Scholar] [CrossRef]
- Wetchakun, K.; Samerjai, T.; Tamaekong, N.; Liewhiran, C.; Siriwong, C.; Kruefu, V.; Wisitsoraat, A.; Tuantranont, A.; Phanichphant, S. Semiconducting metal oxides as sensors for environmentally hazardous gases. Sens. Actuator 2011, 160, 580–591. [Google Scholar] [CrossRef]
- Jerome McAleer, F.; Patrick Moseley, T.; Norris John, O.W.; Williams, D.E. Tin dioxide gas sensors. J. Chem. Soc. Faraday Trans. I 1987, 83, 1323–1346. [Google Scholar]
- Huízar-Padilla, E.; Guillén-Bonilla, H.; Guillén-Bonilla, A.; Rodríguez-Betancourtt, V.M.; Sánchez-Martínez, A.; Guillen-Bonilla, J.T.; Gildo-Ortiz, L.; Reyes-Gómez, J. Synthesis of ZnAl2O4 and Evaluation of the Response in Propane Atmospheres of Pellets and Thick Films Manufactured with Powders of the Oxide. Sensors 2021, 21, 2362. [Google Scholar] [CrossRef] [PubMed]
- Gao, X.; Zhang, T. An overview: Facet-dependent metal oxide semiconductor gas sensors. Sens. Actuators B Chem. 2018, 277, 604–633. [Google Scholar] [CrossRef]
- Yang, X.; Zhang, S.; Yu, Q.; Zhao, L.; Sun, P.; Wang, T.; Liu, F.; Yan, X.; Gao, Y.; Liang, X.; et al. One step synthesis of branched SnO2/ZnO heterostructures and their enhanced gas-sensing properties. Sens. Actuators B Chem. 2018, 2019, 415–423. [Google Scholar] [CrossRef]
- Saruhan, B.; Lontio Fomekong, R.; Nahirniak, S. Review: Influences of semiconductor metal oxide properties on gas sensing characteristics. Front. Sens. 2021, 2, 1–24. [Google Scholar]
- Qin, W.; Yuan, Z.; Gao, H.; Zhang, R.; Meng, F. Perovskite-structured LaCoO3 modified ZnO gas sensor and investigation on its gas sensing mechanism by first principle. Sens. Actuators B Chem. 2021, 341, 130015. [Google Scholar] [CrossRef]
- Ateia, E.E.; Arman, M.M.; Morsy, M. Synthesis, characterization of NdCoO3 perovskite and its uses as humidity sensor. Appl. Phys. 2019, 125, 883. [Google Scholar] [CrossRef]
- Guillén-Lopez, E.S.; Lopez-Urías, F.; Munoz-Sandoval, E.; Courel-Piedrahita, M.; Sanchez-Tizapa, M.; Guillén-Bonilla, H.; Rodríguez-Betancourtt, V.M.; Blanco-Alonso, O.; Guillén-Bonilla, A.; Moran-Lázaro, J.P. High performance isopropanol sensor based on spinel ZnMn2O4 nanoparticles. Mater. Today Commun. 2021, 26, 102138. [Google Scholar] [CrossRef]
- Liu, F.; Wang, B.; Yang, X.; Guan, Y.; Wang, Q.; Lianga, X.; Sun, P.; Wang, Y.; Lu, G. High-temperature NO2 gas sensor based on stabilized zirconia and CoTa2O6 sensing electrode. Sens. Actuators B Chem. 2017, 240, 148–157. [Google Scholar] [CrossRef]
- Singh, S.; Singh, A.; Singh, A.; Rathore, S.; Yadav, B.C.; Tandon, P. Nanostructured cobalt antimonate: A fast responsive and highly stable sensing material for liquefied petroleum gas detection at room temperature. RSC Adv. 2020, 10, 33770–33781. [Google Scholar] [CrossRef] [PubMed]
- Michel, C.R.; Martínez, A.H.; Jiménez, S. Gas sensing response of nanostructured trirutile-type CoSb2O6 synthesized by solution-polymerization method. Sens. Actuators B Chem. 2008, 132, 45–51. [Google Scholar] [CrossRef]
- Jamal, A.; Rahman, M.M.; Khan, S.B.; Faisal, M.; Akhtar, K.; Rub, M.A.; Asiri, A.M.; Al-Youbi, A.O. Cobalt doped antimony oxide nano-particles based chemical sensor and photo-catalyst for environmental pollutants. Appl. Surf. Sci. 2012, 261, 52–58. [Google Scholar] [CrossRef]
- Casillas-Zamora, A.; Guillen-Bonilla, J.T.; Guillén-Bonilla, A.; Rodríguez-Betancourtt, M.V.; Casallas-Moreno, Y.L.; Gildo-Ortiz, L.; Olvera-Amador, M.L.; Tomás, S.A.; Guillen-Bonilla, H. Synthesis of MnSb2O6 powders through a simple low-temperature method and their test as a gas sensor. J. Mater. Sci. Mater. Electron. 2020, 31, 7359–7372. [Google Scholar] [CrossRef]
- Singh, S.; Singh, A.; Singh, A.; Tandon, P. A stable and highly sensitive room-temperature liquefied petroleum gas sensor based on nanocubes/cuboids of zinc antimonate. RSC Adv. 2020, 10, 20349–20357. [Google Scholar] [CrossRef]
- Korotcenkov, G.; Cho, B.K. Metal oxide composites in conductometric gas sensors: Achievements and challenges. Sens. Actuators B Chem. 2017, 244, 182–210. [Google Scholar] [CrossRef]
- Guillén-Bonilla, H.; Flores-Martínez, M.; Rodríguez-Betancourtt, V.M.; Guillen-Bonilla, A.; Reyes-Gómez, J.; Gildo-Ortiz, L.; Olvera Amador, M.L.; Santoyo-Salazar, J. A Novel Gas Sensor Based on MgSb2O6 Nanorods to Indicate Variations in Carbon Monoxide and Propane Concentrations. Sensors 2016, 16, 177. [Google Scholar] [CrossRef]
- Roper, A.; Leverett, P.; Murphy, T.; Williams, P. Stabilities of byströmite, MgSb2O6, ordoñezite, ZnSb2O6 and rosiaite, PbSb2O6, and their possible roles in limiting antimony mobility in the supergene zone. Mineral. Mag. 2015, 79, 537–544. [Google Scholar] [CrossRef]
- Nagarajan, A.; Naraginti, S. Facile synthesis of N-MgSb2O6 trirutile antimonate and its enhanced photocatalytic performance. Int. J. Environ. Anal. Chem. 2020, 102, 7938–7952. [Google Scholar] [CrossRef]
- Arunkumar, N.; Naraginti, S. Facile synthesis of nanostructured trirutile antimonates M(II)Sb2O6 (M = Co, Cu, Ni, Fe) and its visible photocatalytic studies. Inorg. Nano-Met. Chem. 2022, 52, 151–160. [Google Scholar] [CrossRef]
- Singh, J.; Bhardwaj, N.; Uma, S. Single step hydrothermal based synthesis of M(II)Sb2O6 (M = Cd and Zn) type antimonates and their photocatalytic properties. Bull. Mater. Sci. 2013, 36, 287–291. [Google Scholar] [CrossRef]
- Litong, H.; Qiang, Z.; Fangfei, L.; Liang, L. Optical properties of trirutile structure MgTa2O6 single crystals grown by optical floating zone method. Mod. Phys. Lett. B 2020, 34, 2050281. [Google Scholar]
- LaMer, V.K.; Dinegar, R.H. Theory, Production and Mechanism of Formation of Monodispersed Hydrosols. J. Am. Chem. Soc. 1950, 72, 4847–4854. [Google Scholar] [CrossRef]
- Voorhees, P.W. The theory of Ostwald ripening. J. Stat. Phys. 1985, 38, 231–252. [Google Scholar] [CrossRef]
- Yu, H.; Regulacio, D.; Ye, M.D.; Han, M.Y. Chemical routes to top-down nanofabrication. Chem. Soc. Rev. 2013, 42, 6006–6018. [Google Scholar] [CrossRef]
- Esposito, S. “Traditional” sol-gel chemistry as a powerful tool for the preparation of supported metal and metal oxide catalysts. Materials 2019, 12, 668. [Google Scholar] [CrossRef] [PubMed]
- Kida, T.; Kuroiwa, T.; Yuasa, M.; Shimanoe, K.; Yamazoe, N. Study on the response and recovery properties of semiconductor gas sensors using a high-speed gas-switching system. Sens. Actuators B Chem. 2008, 134, 928–933. [Google Scholar] [CrossRef]
- Wang, C.; Yin, L.; Zhang, L.; Xiang, D.; Gao, R. Metal oxide gas sensors: Sensitivity and influencing factors. Sensors 2010, 10, 2088–2106. [Google Scholar] [CrossRef]
- Ramírez-Ortega, J.; Guillén-Bonilla, H.; Guillén-Bonilla, A.; Rodríguez-Betancourtt, V.M.; Sánchez-Martínez, A.; Guillén-Bonilla, J.T.; Gildo-Ortiz, L.; Huizar, E.; Reyes-Gómez, J. Synthesis of the oxide NiSb2O6 and its electrical characterization in toxic atmospheres for its application as a gas sensor. J. Mater. Sci. Mater. Electron. 2022, 33, 18268–18283. [Google Scholar] [CrossRef]
- Kim, J.H.; Mirzaei, A.; Kim, H.W.; Kim, S.S. Pd-functionalized core-shell composite nanowires for self-heating, sensitive, and benzene-selective gas sensors. Sens. Actuator A Phys. 2020, 308, 112011. [Google Scholar] [CrossRef]
- Avila-García, A.; Chaudhary, A.; Rojas-Chávez, H. Iridium oxide films as propane sensors. Thin Solid Films 2021, 724, 138617. [Google Scholar] [CrossRef]


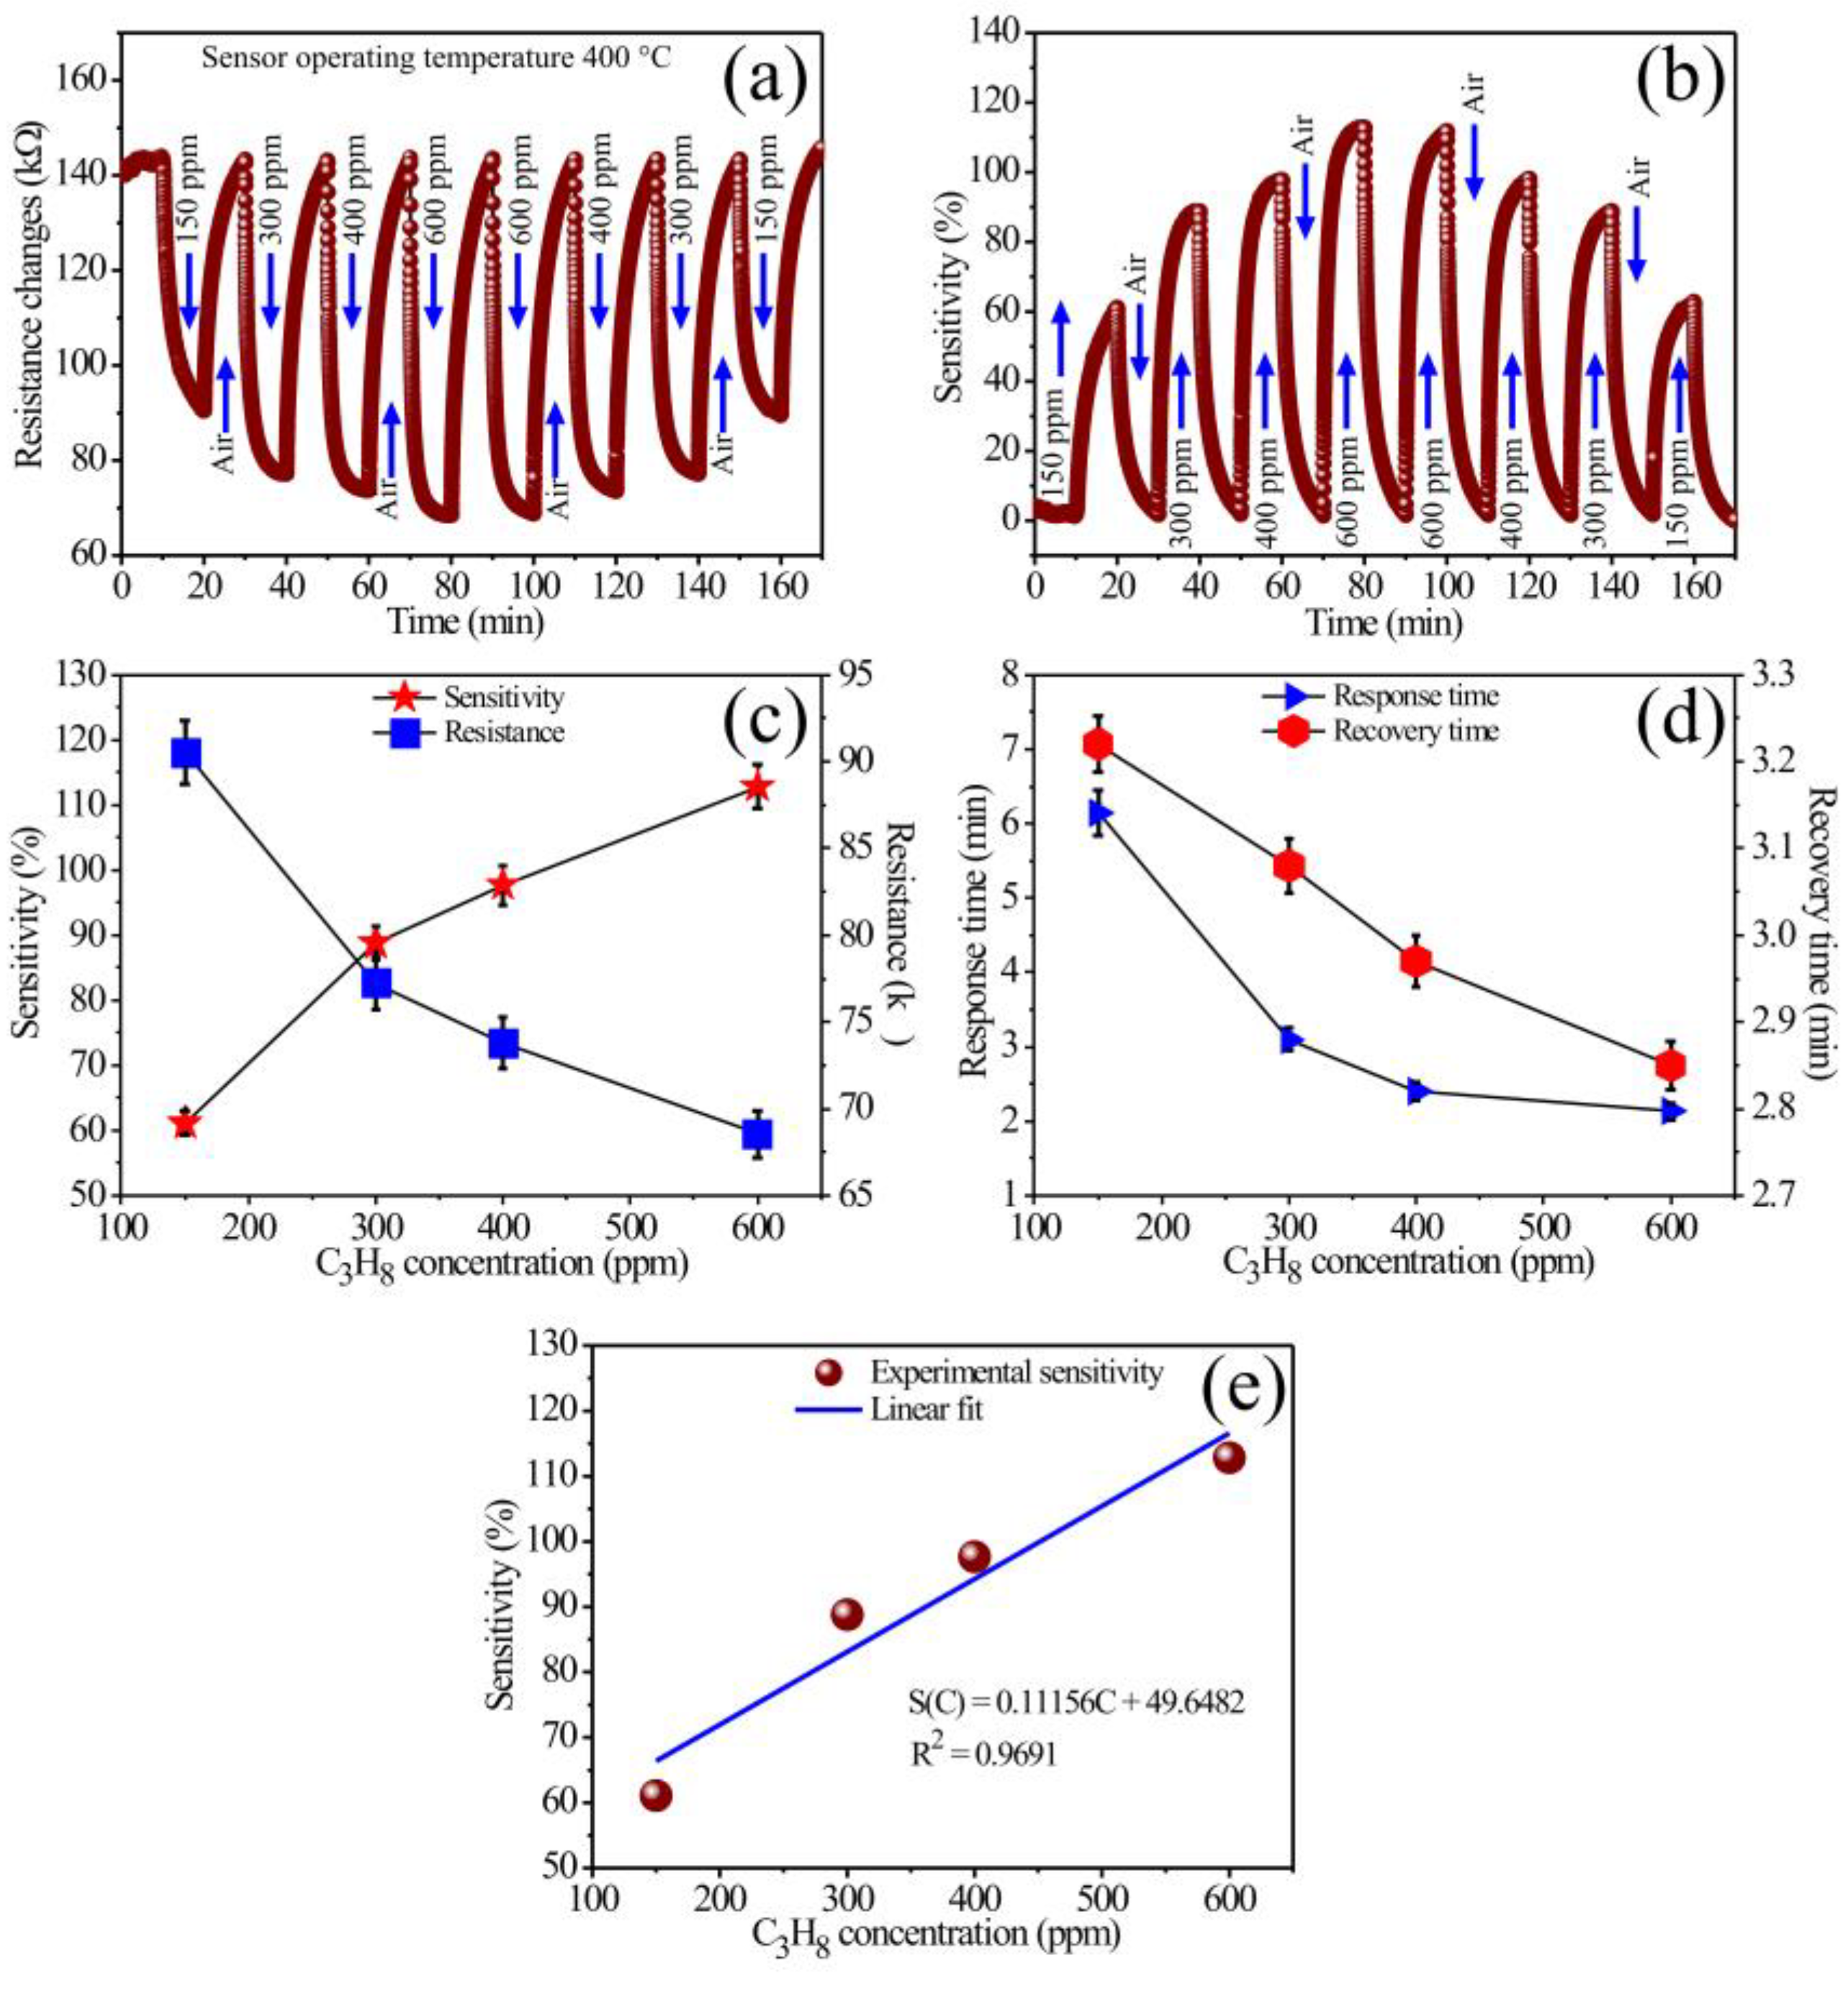
| Concentration (ppm) | ΔR (kΩ) | Sensitivity (%) | Response Time (min) | Recovery Time (min) |
|---|---|---|---|---|
| 150 | 52.50 | 61.09 | 6.15 | 3.22 |
| 300 | 65.95 | 88.80 | 3.10 | 3.08 |
| 400 | 68.90 | 97.65 | 2.40 | 2.97 |
| 600 | 70.59 | 112.81 | 2.13 | 2.85 |
| Voltage (V) | ΔR (MΩ) | Sensitivity (%) | Response Time (s) | Recovery Time (s) |
|---|---|---|---|---|
| 5 | 23.73 | 20.35 | 80.40 | 38.77 |
| 10 | 9.34 | 19.09 | 78.53 | 36.10 |
| 15 | 9.03 | 30.74 | 76.67 | 34.15 |
| 20 | 6.67 | 33.72 | 74.83 | 31.38 |
| 25 | 5.13 | 35.93 | 71.09 | 29.54 |
| 30 | 4.18 | 39.50 | 69.24 | 27.69 |
| 35 | 3.34 | 40.97 | 65.63 | 25.85 |
| 40 | 2.65 | 42.71 | 63.70 | 22.16 |
| 45 | 2.21 | 45.35 | 60.93 | 20.31 |
| 50 | 1.78 | 49.01 | 57.25 | 18.45 |
| Material | Gas | Concentration (ppm) | Sensitivity (%) | Response Time (s) | Recovery Time (s) | Reference |
|---|---|---|---|---|---|---|
| ZnAl2O4 | Propane | 1000 ppm | - | 176.0 | 205.0 | [14] |
| CoSb2O6 | LPG | 5000 ppm | 1.96 | 21.0 | 234.0 | [22] |
| ZnSb2O6 | LPG | 5000 ppm | 1.73 | 41.0 | 95.0 | [26] |
| MgSb2O6 | Propane | 500 ppm | 61.66 | - | - | [28] |
| IrO2 | - | 1000 ppm | - | - | - | [42] |
| MgSb2O6 MgSb2O6 | Propane Propane | 600 ppm 560 ppm | 112.81 49.01 | 127.8 57.2 | 171 18.5 | This work This work |
Disclaimer/Publisher’s Note: The statements, opinions and data contained in all publications are solely those of the individual author(s) and contributor(s) and not of MDPI and/or the editor(s). MDPI and/or the editor(s) disclaim responsibility for any injury to people or property resulting from any ideas, methods, instructions or products referred to in the content. |
© 2024 by the authors. Licensee MDPI, Basel, Switzerland. This article is an open access article distributed under the terms and conditions of the Creative Commons Attribution (CC BY) license (https://creativecommons.org/licenses/by/4.0/).
Share and Cite
Guillén-Bonilla, H.; Guillén-Bonilla, J.T.; Rodríguez-Betancourtt, V.-M.; Ramírez-Ortega, J.A.; Morán Lázaro, J.P.; Guillén-Bonilla, A. Synthesis and Sensing Response of Magnesium Antimoniate Oxide (MgSb2O6) in the Presence of Propane Atmospheres at Different Operating Voltages. Sensors 2024, 24, 2147. https://doi.org/10.3390/s24072147
Guillén-Bonilla H, Guillén-Bonilla JT, Rodríguez-Betancourtt V-M, Ramírez-Ortega JA, Morán Lázaro JP, Guillén-Bonilla A. Synthesis and Sensing Response of Magnesium Antimoniate Oxide (MgSb2O6) in the Presence of Propane Atmospheres at Different Operating Voltages. Sensors. 2024; 24(7):2147. https://doi.org/10.3390/s24072147
Chicago/Turabian StyleGuillén-Bonilla, Héctor, José Trinidad Guillén-Bonilla, Verónica-María Rodríguez-Betancourtt, Jorge Alberto Ramírez-Ortega, Juan Pablo Morán Lázaro, and Alex Guillén-Bonilla. 2024. "Synthesis and Sensing Response of Magnesium Antimoniate Oxide (MgSb2O6) in the Presence of Propane Atmospheres at Different Operating Voltages" Sensors 24, no. 7: 2147. https://doi.org/10.3390/s24072147