Article

Convolutional Neural Network-Based Pattern Recognition of Partial Discharge in High-Speed Electric-Multiple-Unit Cable Termination

1
CRRC Qingdao Sifang Co., Ltd., Qingdao 266000, China
2
School of Electrical Engineering, Southwest Jiaotong University, Chengdu 611756, China
3
Energy Department, UTBM, Université Bourgogne Franche-Comté, 90010 Belfort, France
*
Authors to whom correspondence should be addressed.
Sensors 2024, 24(8), 2660; https://doi.org/10.3390/s24082660
Submission received: 19 March 2024 / Revised: 15 April 2024 / Accepted: 17 April 2024 / Published: 22 April 2024
(This article belongs to the Section Fault Diagnosis & Sensors)

Abstract

:
Partial discharge detection is considered a crucial technique for evaluating insulation performance and identifying defect types in cable terminals of high-speed electric multiple units (EMUs). In this study, terminal samples exhibiting four typical defects were prepared from high-speed EMUs. A cable discharge testing system, utilizing high-frequency current sensing, was developed to collect discharge signals, and datasets corresponding to these defects were established. This study proposes the use of the convolutional neural network (CNN) for the classification of discharge signals associated with specific defects, comparing this method with two existing neural network (NN)-based classification models that employ the back-propagation NN and the radial basis function NN, respectively. The comparative results demonstrate that the CNN-based model excels in accurately identifying signals from various defect types in the cable terminals of high-speed EMUs, surpassing the two existing NN-based classification models.

1. Introduction

The cable of the high-speed electric multiple unit (EMU) plays a critical role in the power supply system of high-speed trains, directly impacting the safety of train operations. The terminal, as a vulnerable component of the high-speed EMU cable, is particularly susceptible to partial discharge (PD), which poses a threat to the efficient functioning of high-speed trains [1,2,3,4]. Detecting PD is crucial for assessing the insulation condition of cable terminals. By identifying local discharges, the extent of insulation deterioration can be determined, allowing for timely maintenance or replacement measures [5,6,7]. Currently, technologies for the PD detection encompass a variety of methods, including the pulse current method, the high-frequency pulse current method, the ultra-high frequency detection method, the ultrasonic detection method, the optical measurement method, and the infrared imaging technology [8,9,10,11,12,13,14]. The advantages and disadvantages of these PD detection methods, along with their applicable scopes, are presented in Table 1.
Currently, the pulse current method, while being the earliest and most widely used PD detection method under the International Electrotechnical Commission standard, has some limitations [15]. Firstly, it primarily captures the lower frequency band of the PD signal, failing to acquire complete frequency information, particularly the high-frequency components. This omission may result in the neglect or misinterpretation of crucial discharge patterns. Secondly, the pulse current method has limited resistance to interference in practical applications, making it susceptible to electromagnetic interference. This vulnerability leads to a high bit error rate and diminished detection efficacy [16,17,18]. In contrast, the high-frequency pulse current detection system boasts advantages such as the ease of installation, a straightforward design, no impact on the operational state of the high-speed EMU cable terminal, broader frequency range coverage of PD signals, heightened test sensitivity, and robust anti-interference capabilities. It enables a quantitative analysis of the discharge magnitude of PD signals [19,20]. Consequently, this paper employs the high-frequency pulse current method as the PD testing approach for the cable terminals of high-speed EMUs.
The PD, as a crucial indicator for assessing the condition of power equipment, has been incorporated into the testing standards by the International Electrotechnical Commission [21]. However, the pattern recognition and fault diagnosis of the PD of the cable require further exploration. Numerous factors contribute to the PD, and the locations and mechanisms of cable defects vary.
As a key component connecting the electric equipment in the vehicle to the external power supply, the cable terminal of high-speed EMUs exhibits unique characteristics in terms of operating environment, structural design, and performance requirements. It differs significantly from other types of cable terminals, such as those in the power grid. High-speed EMU cable terminals operate in complex environments characterized by high-speed movement, vibration, and severe temperature and humidity fluctuations. Consequently, they are subjected to more severe mechanical and environmental stresses than those experienced by power grid cable terminals. The demanding operating conditions also necessitate significant differences in the structure and insulation materials of vehicle cable terminals. Generally, these terminals utilize a heat-shrink structure that offers improved sealing, weather resistance, and durability. They are made from EPDM rubber (EPR) materials, which provide resistance to oxidation, heat, and aging [22,23].
Based on the anatomy of high-speed EMU cable terminals with on-site faults and the maintenance experience of on-site staff, faults in these terminals are generally categorized as long-term, short-term, and unpredictable. Among these, short-term faults are the most prominent, with typical defects including insulation scratches, interlayer air gaps, metal particles, and uneven semi-conductive layers [24]. Clarifying the cause and action mechanism of each type of discharge holds significant importance for the routine maintenance of high-speed EMU cables and the early warning of potential accidents.
With rapid advancements in artificial intelligence (AI), its techniques are increasingly being adopted for robust control, accurate diagnosis, reliable prognosis, and effective signal analysis in electrical apparatus and systems [25,26,27,28,29,30,31,32]. Researchers globally have delved into the development of AI-powered pattern recognition methods for the PD of high-voltage cables. Common pattern recognition methods include the artificial neural network (NN), the support vector machine (SVM), the Bayes criterion, and the cluster analysis [33,34,35,36,37,38]. In the realm of PD pattern recognition, the back-propagation NN (BPNN) and the radial basis function NN (RBFNN) are widely used. In [39], the creation of cable models with five types of defects and the establishment of a dataset based on the phase-resolved PD (PRPD) spectrum were detailed, and the convolutional NN (CNN) was employed to achieve successful recognition of defect signals. In [40], PD signals from power cables with five types of insulation defects were collected, and a set of parameters characterizing discharge characteristics was established. The study found that the CNN-based model outperformed the BPNN-based and SVM-based models in signal identification. In [41], a time-domain waveform image database of four kinds of PD defects was constructed, and image processing technologies such as image enhancement and normalization were used to process these waveform images, and a DenseNet model was built to realize the recognition of the four kinds of defects, and the model has good robustness. In [42], the PD and corona signals were collected from cable terminals, and a CNN-based model was used for the signal recognition. However, this study bypassed the construction of a feature dataset, opting to directly feed discharge signals into the model.
In this paper, a CNN-based PD signal classification model is proposed for high-speed EMUs, which enables the identification of discharge signals from cable terminals exhibiting four typical defects. The main contributions of this paper are summarized as follows:
  • Characteristic parameters of terminal discharge signals in high-speed EMU cables are not extracted; instead, the four types of discharge signals are directly used as input to the model, achieving high accuracy.
  • The impact of different training datasets on the classification performance of the terminal discharge signal recognition model for high-speed EMUs is compared and analyzed. The proposed CNN-based model is demonstrated to flexibly meet the varying requirements for processing time and accuracy across different scenarios.
  • The proposed recognition model for terminal discharge signals in high-speed EMU cables is compared with two existing NN-based models, and it is verified that the CNN-based model exhibits superior recognition effectiveness.

2. Experimental Data Acquisition

2.1. PD Test Platform

The PD test platform used in this study comprises the voltage regulator, the test transformer, the protection resistance, the discharge sample, the high-frequency current transformer (HFCT), and the high-frequency oscilloscope, among other components, as depicted in Figure 1. The HFCT, known for its exceptional sensitivity, straightforward setup, and strong anti-interference capabilities [43], is a widely used instrument for the online detection of PD signals, particularly when the ground conductor of the device under test is accessible. The circuit of the PD test platform is illustrated in Figure 2. By increasing the test voltage with the voltage regulator, insulation defect sample discharges are induced, thereby simulating PD defects [44].

2.2. Four Typical Defect PD Models

During testing and operation, the cable terminal may exhibit discharge phenomena due to internal defects. The primary defect types include wire core burrs, surface sliding, internal air gaps, and suspended metal particles. To simulate these four discharge defects at the cable terminal, electrode structures for four typical discharge models are designed, as depicted in Figure 3. The tip discharge model simulates conductor burrs, which are difficult to eliminate completely during the fabrication of cable terminals and may cause discharge phenomena during operation. The surface discharge model simulates discharges caused by looseness or delamination between the insulation layers inside the cable terminal. The air gap discharge model simulates discharges caused by tiny bubbles or knife marks in the insulation layer during terminal operation. Lastly, the suspended discharge model simulates PD issues caused by conductive and semi-conductive impurities attached to the main insulation surface [45,46,47,48,49,50].
  • Tip discharge model: This model employs a steel needle with a curvature radius of 5 μm and uses ethylene–propylene–diene monomer (EPDM) rubber film as the insulating medium, with a diameter of 120 mm and a thickness of 3 mm. A ground electrode with a diameter of 80 mm is connected below the rubber film, and the steel needle is linked to a high-voltage electrode. The tip is inserted into the film to a depth of approximately 1 mm.
  • Surface discharge model: In this model, the insulating medium consists of an EPDM rubber film with a diameter of 60 mm, structured as a double layer, and has a total thickness of 6 mm. Below this, a ground electrode with a diameter of 80 mm is connected, and a copper disk with a diameter of 30 mm is positioned between the insulating medium and the high-voltage electrode.
  • Air gap discharge model: In this model, the insulating medium is again EPDM rubber film, with a diameter of 60 mm and a thickness of 3 mm. To simulate an air gap discharge, a circular hole with a diameter of 1 mm is created within the insulating medium. A copper disk is placed between the high-voltage electrode and the insulating medium. To avoid surface discharge interference, the high-voltage electrode in the air gap discharge model is sealed with epoxy resin.
  • Suspension discharge model: In this model, the insulating medium is EPDM rubber with a diameter of 120 mm and a thickness of 3 mm, and the high electric electrode is a copper disk with a diameter of 30 mm. There is a certain gap between the high electrode and the insulating medium, and a copper sheet with a thickness of 1 mm is placed in the gap as a suspended metal particle to simulate the suspended electrode.
Figure 3. Electrode model of typical PD defect: (a) tip discharge, (b) surface discharge, (c) air gap discharge, and (d) suspension discharge.
Sensors 24 02660 g003

2.3. High-Frequency Pulse Signals of PD with Four Typical Defects

The PD test platform shown in Figure 1 was used to carry out systematic pressure tests on four defect models mentioned above. The test protocol involved gradually increasing the voltage in 1 kV increments, maintaining each level for 1 min after pressurization to ensure test stability. High-frequency pulse current signals from the four defect models were collected within two power frequency cycles under a 12 kV test voltage. The time-domain waveforms of these signals are presented in Figure 4.

3. Design of Cable Discharge Classification Model
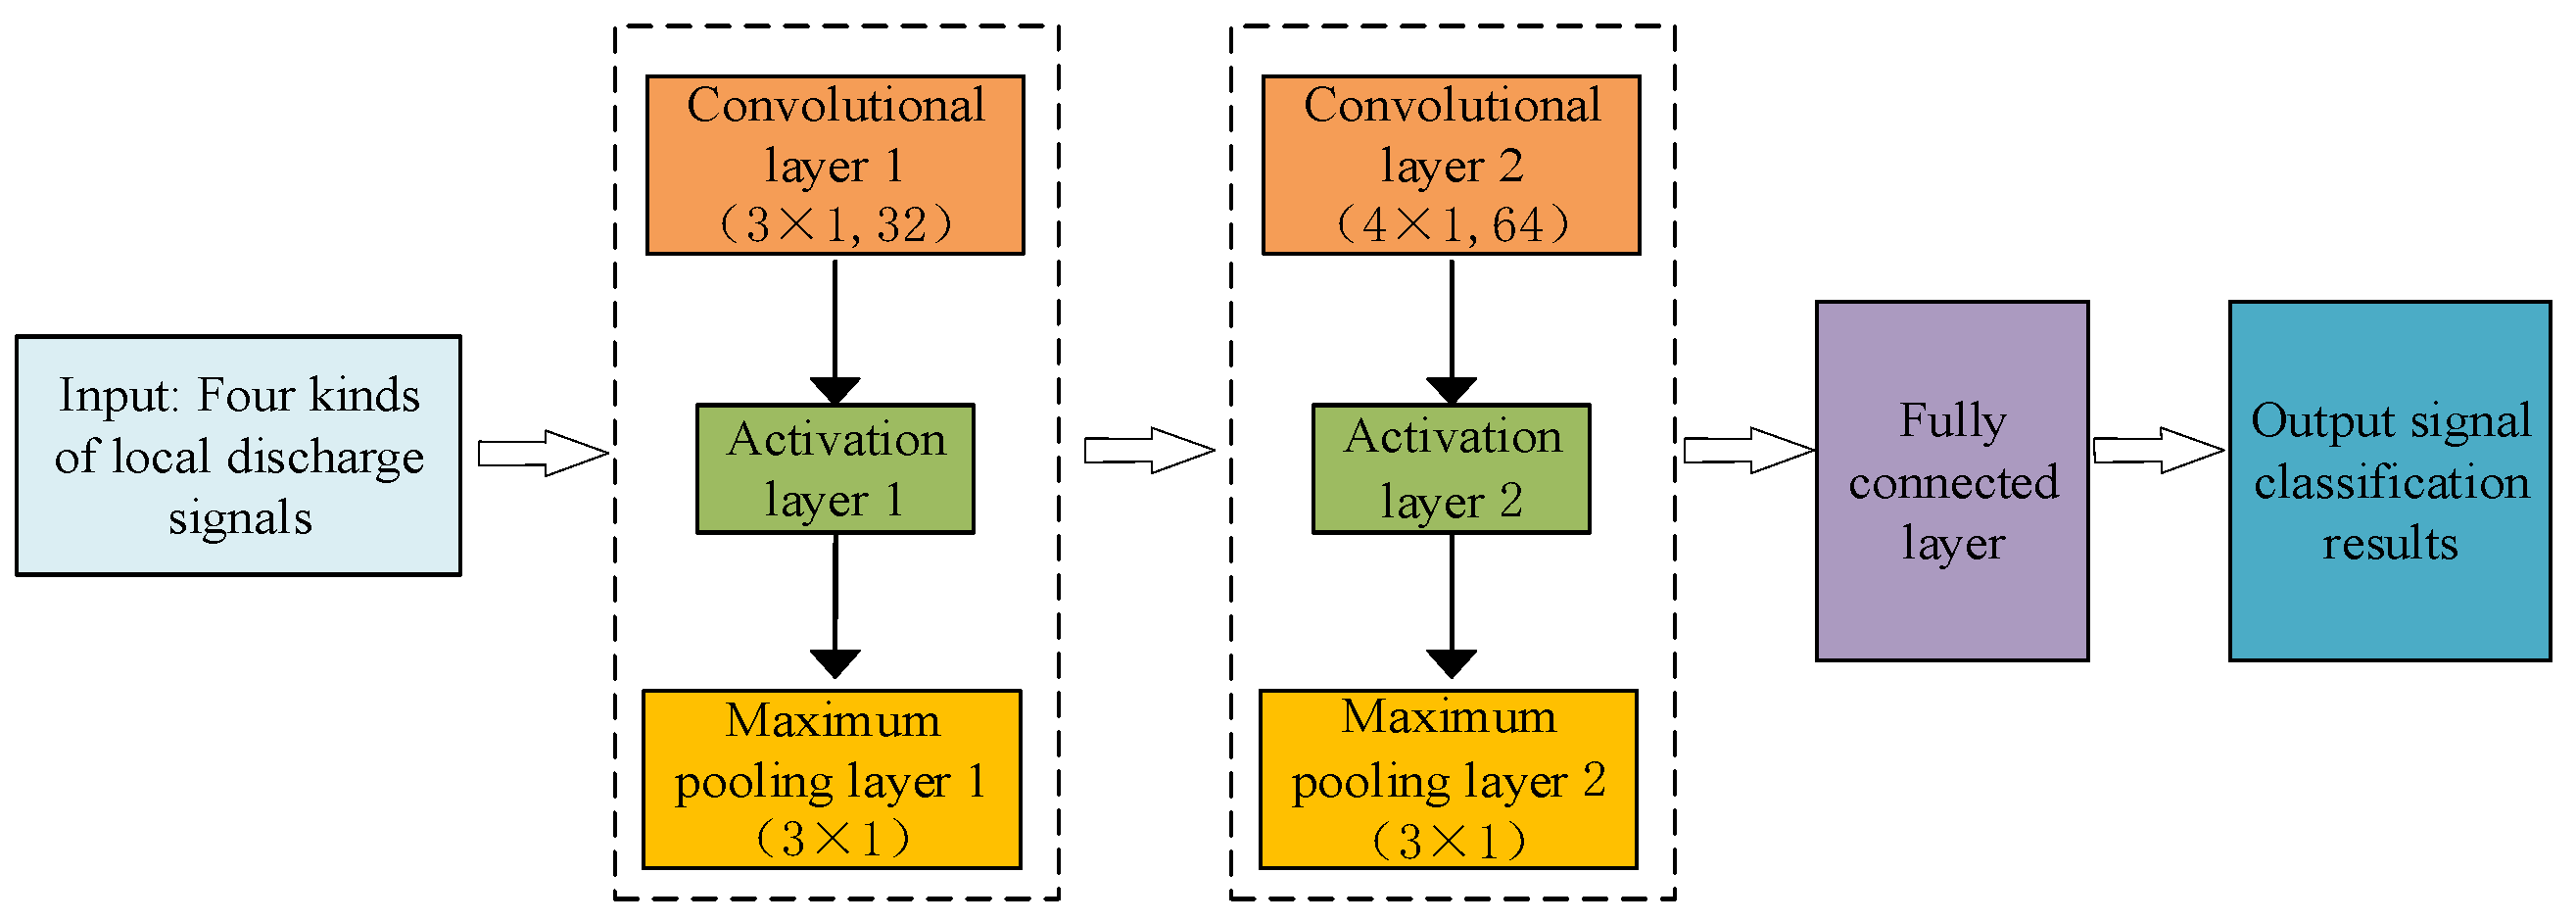
3.1. CNN

The CNN primarily consists of three fundamental components: convolutional layers, pooling layers, and fully connected layers [51]. In this study, a CNN-based classification model is employed to categorize the discharge signals from four typical defects in high-speed EMU cables. This model is constructed using two convolutional layers, two activation layers, two maximum pooling layers, and one fully connected layer; its block diagram is illustrated in Figure 5.
In this study, the discharge signal from the terminal of the high-speed EMU cable serves as the input to the model. The convolutional and pooling layers extract features and compress this information into a feature map form. For the first convolutional layer, the kernel size is set to 3 × 1 with 32 kernels, and the step size is 1. For the second convolutional layer, the kernel size is adjusted to 4 × 1 with 64 kernels, maintaining the step size at 1. The first maximum pooling layer has a kernel size of 3 × 1 and a step size of 1, mirroring the settings of the second maximum pooling layer, which also adopts a kernel size of 3 × 1 and a step size of 1.
Convolution Layer: This layer applies the convolution operation across local regions of the input using the convolution kernel of the filter, aiming to extract local features effectively. The convolution layer employs weight sharing, significantly reducing the number of learning parameters and thereby mitigating the risk of overfitting [52]. Each convolutional layer in the network comprises multiple convolutional kernels, with the parameters of each kernel being optimized through the backpropagation algorithm [53]. Each convolution can be performed on the input sequence by convolving the equation as follows:
y m k ( t ) = w ( k ) x m = i = 1 L w ( k ) ( i ) x m ( t i + 1 )
where xm is the input sequence, w(k) is the weight of the k th convolution kernel, and the size is L.
Activation Layer: The output from the convolutional layer serves as the input to the activation function. The role of the activation function is to transform the output of the convolutional layer in a nonlinear manner. This transformation enhances the linear separability of data that was originally scattered. Commonly used activation functions in CNNs include the sigmoid function, the tanh function, and the rectified linear unit (ReLU) function [54]. The expressions for these three functions are given as (2)–(4), respectively. Compared with the other two activation functions, the ReLU function can effectively reduce the amount of computation and improve the expression ability of the network by debugging the activity of neurons in the network [54]. Therefore, the ReLU function is used as the activation function of the activation layer in this study.
y = 1 1 + e x
y = e x e x e x + e x
y = max { 0 , x }
where x is the output data of the convolution layer.
Pooling Layer: Following the convolution operation, the quantity of extracted feature sequences increases, leading to an expansion in data dimensions and a rise in computational complexity. The pooling layer serves to reduce the data width and the number of network parameters, thus lowering computational costs and helping to prevent overfitting [55]. There are two common pooling functions: average pooling and max pooling. The average pooling computes the mean of the input data to serve as the output of the layer, while the max pooling selects the maximum value from the input data as the output [56]. The expressions of average pooling and max pooling are given as (5) and (6), respectively. The max pooling is particularly effective in capturing important local features of the data, thereby improving the recognition accuracy of the model. Consequently, the max pooling function is adopted in this study.
y c h + 1 ( i ) = 1 w ( i 1 ) w i w x c h ( t )
y c h + 1 ( i ) = max ( i 1 ) p t i p x c h ( t )
where w is the width of pooling layer, x c h ( t ) is the value of the tth neuron in the c eigenvalue of the hth layer, and y c h + 1 is the value of neurons in layer h + 1.
Fully Connected Layer: The role of this layer is to integrate and refine the features extracted by the alternating convolution and pooling layers. This is achieved by flattening the output feature map from the final convolution or pooling layer into a one-dimensional feature vector, which allows for further feature extraction [57]. Then, the fully connected layer maps these extracted feature vectors to the sample label space and classifies them by constructing a classifier. For the classification, the softmax function is usually selected as the activation function of the fully connected layer, which converts the output vector into a set of probability distributions, according to which the model makes category prediction and selects the category with the highest probability as the output [58].
P j = softmax ( r i ) = e r j i = 1 k e r i
where Pj is the probability of belonging to the correct class, rj is the node value of the jth neuron, and k is the total number of classes.

3.2. PD Data for Training and Verification

Through the PD test platform shown in Figure 1, the PD signals from high-speed EMUs with various defect models are collected; from these collected PD signals, single-wave time-domain signals for four types of PD signals associated with the defect models are extracted, as illustrated in Figure 6.
To ensure the richness and representativeness of the data, 400 sets of four kinds of PD signals are extracted from the collected signals. Out of the 1600 total sets of data, 1200 sets are randomly selected to train the model. The remaining 400 sets are used to verify the model’s accuracy in identifying different types of defects.

3.3. Classification Steps

The classification process of the proposed CNN-based model is illustrated in Figure 7 and can be summarized in the following steps:
  • Signal acquisition: A test platform is built, and cable terminal models with four types of defects are created. The HFCT is used to measure the PD signals of the cable terminals.
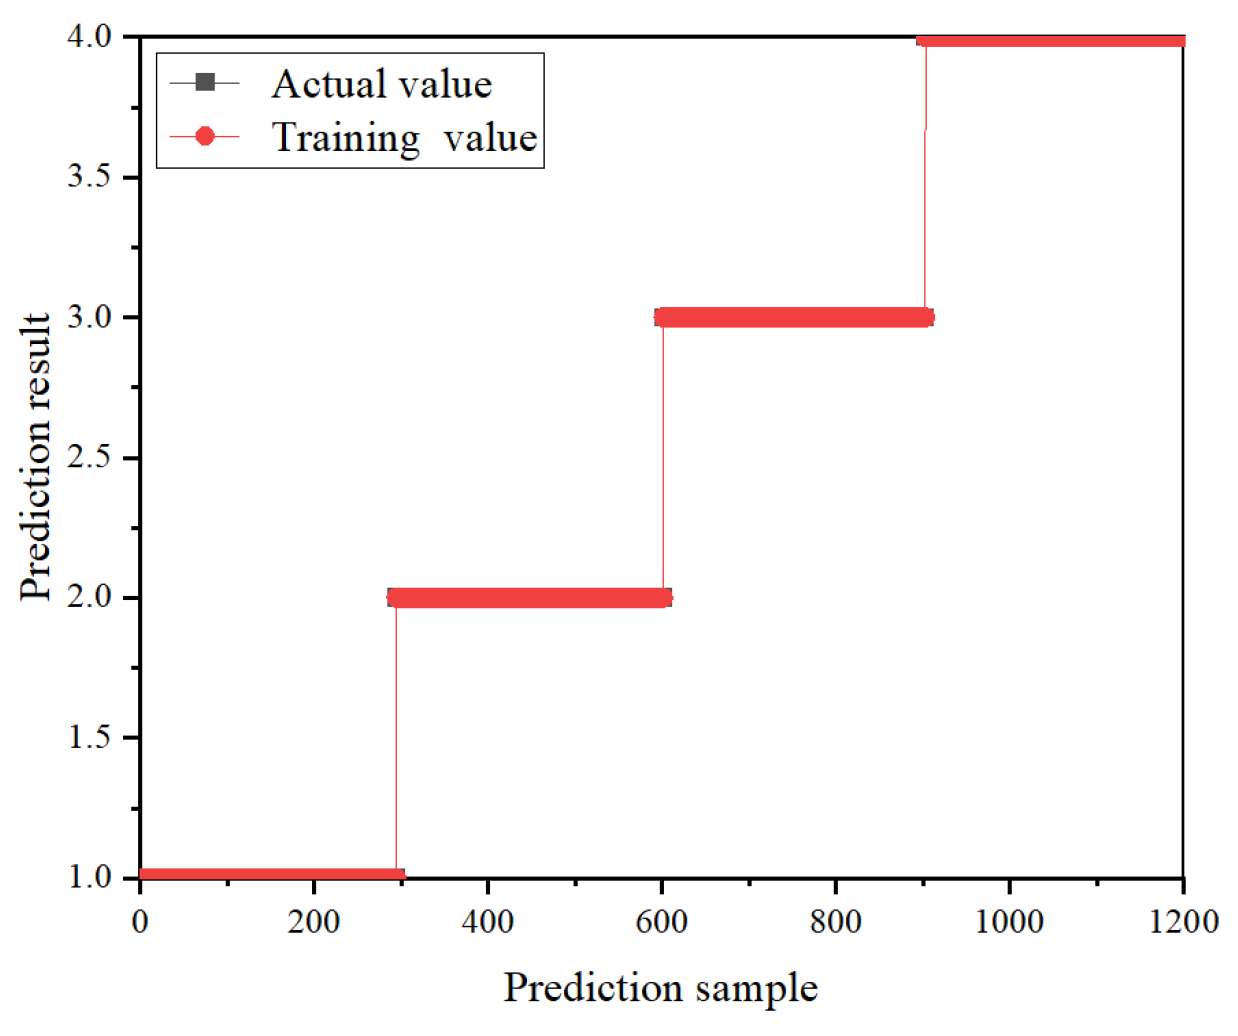
  • Dataset construction: Four different types of discharge signals are collected, and a single signal is extracted. For each of the four signals, 251 sampling points are selected, resulting in 400 sets of data for each type. Out of these 1600 datasets, 1200 are randomly chosen to construct the training dataset, while the remaining 400 sets are designated as the test dataset.
  • Data normalization: To simplify the data complexity, disparate data in the set are processed. This step facilitates faster gradient descent, aiding in finding the optimal solution and enhancing the model’s accuracy and convergence speed. The dataset from step 2 is normalized using the following expression.
    Y i = y i y min y max y min
    where yi is the sample value before normalization, Yi is the normalized sample value. ymin is the minimum value of the sample, and ymax is the maximum value of the sample.
  • CNN training and classification: The normalized dataset from step 3 serves as the input to the constructed CNN-based model. After processing through two convolutional layers, two pooling layers, and one fully connected layer, the classification results are produced.
Figure 7. Classification steps based on the CNN.
Sensors 24 02660 g007

4. Results Analysis

The models discussed in this paper are implemented using the MATLAB 2021a software, installed on a personal computer equipped with an Intel i5-10210U CPU (1.6 GHz clock frequency) and 8 GB of RAM.
In this study, training loss and accuracy are used to evaluate the recognition effectiveness of CNN. Loss quantifies the discrepancy between the predicted value and the true value. Cross entropy is used as the loss function to describe the gap between the probability distribution of the predicted values and the actual values. This measure reflects the model’s degree of fit [59]. The expression for cross entropy is written as
L o s s = 1 N n = 1 N i = 1 k y i ( n ) log ( p i ( n ) )
where yi is the label value of sample i, pi is the probability of correctly predicting the sample, and N is the total number of samples.
Four performance indices, namely accuracy, precision, recall, and F1-score, are utilized to evaluate the effectiveness of classification. Taking binary classification as an example, accuracy measures the proportion of correctly predicted classes, precision assesses the percentage of actual positives among all samples predicted as positive, recall calculates the proportion of actual positive samples correctly identified relative to all actual positives, and F1-score reflects the balance between precision and recall. The formulas for these indices are provided in (10)–(13), and Table 2 illustrates the meanings of each term used in the formulas. Regarding the learning rate reduction strategy, the adaptive moment estimation (Adam) optimizer [59] is employed to decrease the learning rate to one-tenth of its value every 10 training iterations.
Accuracy = T N + T P T N + F N + T P + F P
Precision = T P T P + F P
Recall = T P F N + T P
F 1 -score = 2 × Precision × Recall Precision + Recall

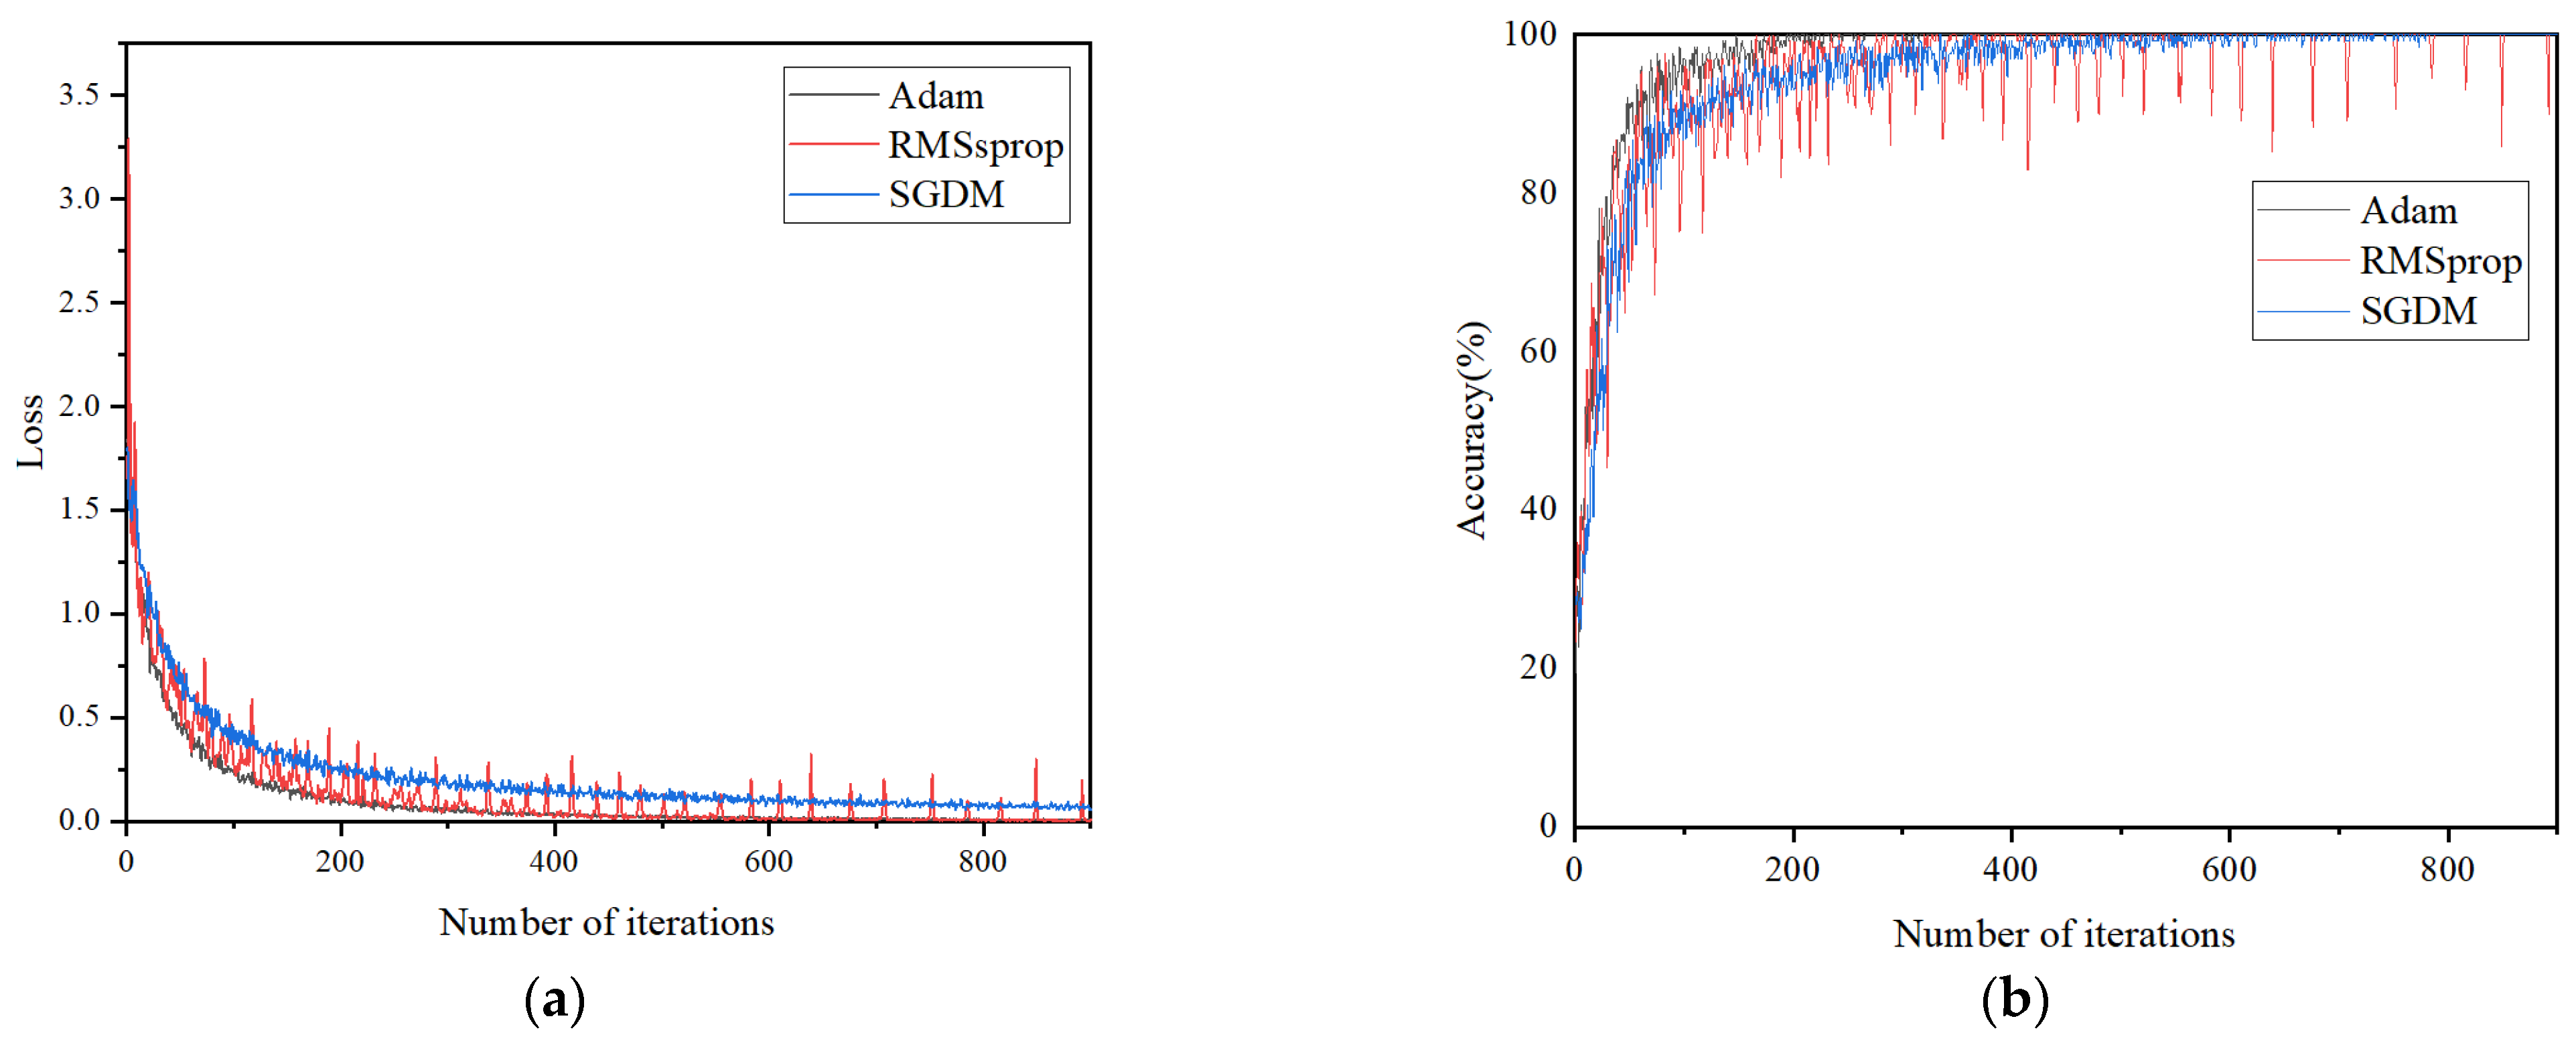
4.1. Influence of Different Optimizers

By calculating network parameters that influence model training and output, optimizers aim to minimize the loss function, guiding it toward an optimal value [42]. This study discusses the effects of the Adam optimizer, the stochastic gradient descent with momentum (SGDM), and the root mean square propagation (RMSprop) optimizers on the CNN-based classification model to identify the most suitable optimizer. In total, 75% of the data is randomly selected from the PD dataset to construct the training dataset, with the remaining data serving as the test dataset.
The evaluation focuses on the impacts of three optimizers on the model performance and accuracy. The training accuracy and loss curves of the CNN-based classification model, utilizing these three optimizers through the iterative process, are depicted in Figure 8. In the training process, the recognition accuracy and classification accuracy of the model based on three different optimizers for the four discharge signals are shown in Figure 9 and Figure 10, showing the classification results of the three optimizers for the four signals in the test set. Table 3 shows the classification accuracy of the CNN-based classification model, using the three different optimizers, for the four discharge signals.
As shown in Figure 8, the CNN-based classification model employing the Adam optimizer converges fastest and exhibits a smooth curve, indicating efficient learning. In contrast, the model using the SGDM optimizer shows the slowest convergence, whereas the RMSprop optimizer achieves better convergence than SGDM but with more considerable curve fluctuation, indicating less stability in the trained model. According to Figure 9, all three optimizer-based models achieve 100% signal classification accuracy during training. Combining the results from Figure 10 and Table 3, the average accuracy of the CNN-based classification model, based on the three optimizers for identifying the four defects, ranks as follows: Adam > SGDM > RMSprop. This suggests that the CNN-based classification model using the Adam optimizer demonstrates superior learning performance and classification effectiveness. Consequently, the Adam optimizer is selected as the optimizer for the cable terminal discharge classification model in high-speed EMUs for this study.

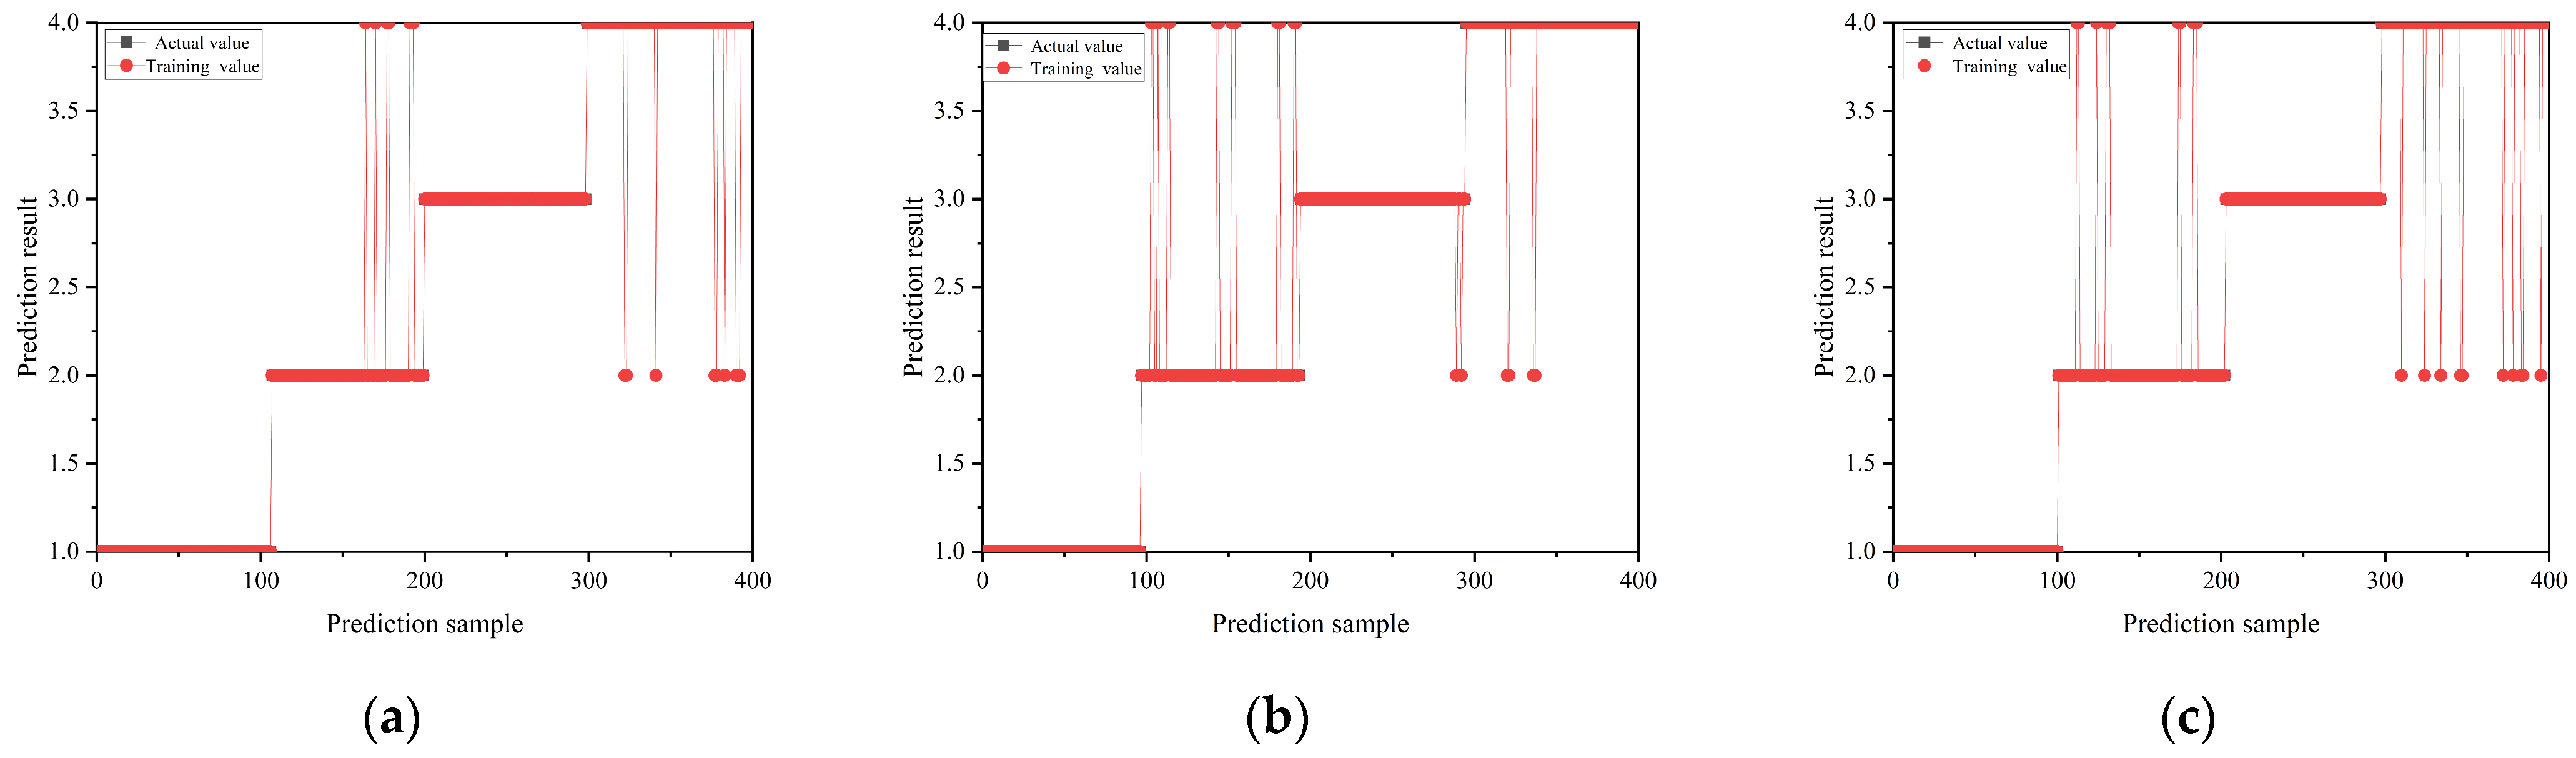
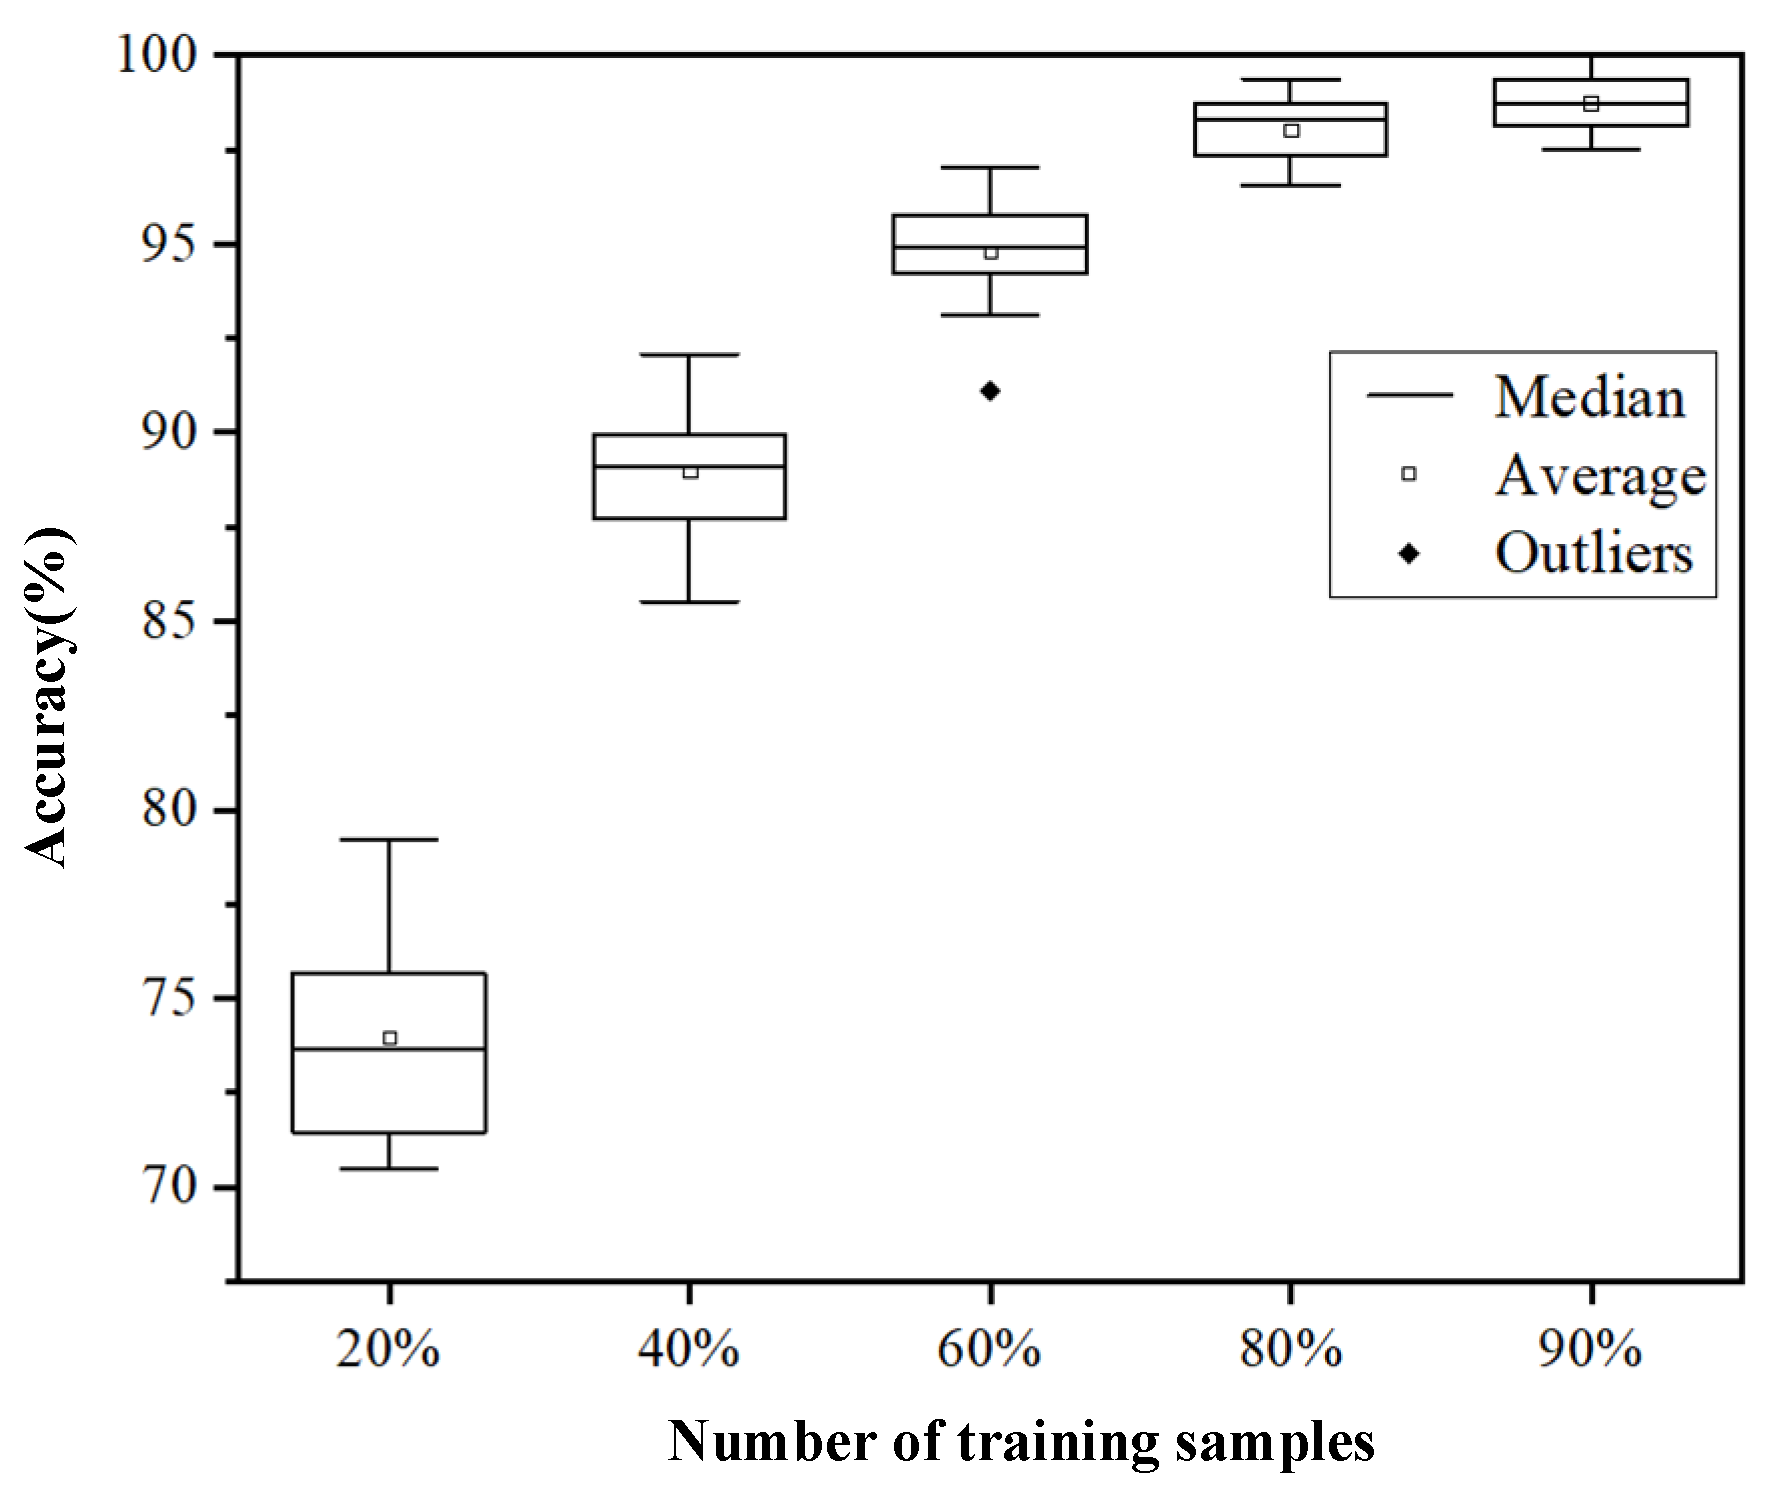
4.2. Influence of Different Training Data Amounts

The first 20%, 40%, 60%, 80%, and 90% of the PD data of high-speed EMU cable terminals are used as training datasets, and the rest are used as validation datasets. The CNN-based classification model proposed in this paper was used to test the five datasets, and the influence of different amounts of training data on the accuracy of the model was studied. Each case was verified 100 times, and the classification accuracy and training time of 100 times were obtained. Figure 11 shows the box diagram drawn according to the classification accuracy of the model under 100 tests, and Figure 12 shows the box diagram drawn according to the training time of the model. Table 4 shows the average precision of the model’s recognition of each discharge signal under 100 tests, and the average accuracy of the model under 100 tests, which corresponds to the mean value of the box chart in Figure 11.
Table 4 reveals that the classification accuracy for the four types of discharge in the cable terminal discharge signal classification model of high-speed EMUs improves with an increase in training data volume. Furthermore, Figure 11 demonstrates that as the training data volume expands, the range of recognition accuracy for the CNN-based classification model narrows, and the average accuracy rate approaches nearly 100%. More training data introduce greater data diversity, enhancing the model’s robustness and minimizing performance variances across different data subsets. This leads to a more concentrated range of high accuracy.
Moreover, as can be seen from Figure 12, the model’s training time also escalates with larger training data volumes. The average training time for 100 sessions across the five data groups was recorded as 18.91 s, 46.78 s, 66.84 s, 92.03 s, and 102.38 s, respectively.
More training data require more forward-propagation and back-propagation calculations so that the model can better understand and fit the distribution of the data, which helps to improve the algorithm, improve the generalization ability and performance of the model, and will also require more running time.

4.3. Comparison of CNN with Other Classification Models

The proposed CNN-based classification model is compared with the BPNN-based and RBFNN-based classification models. In total, 75% of the PD dataset is utilized to train these three models, and the remaining data are employed to assess the models’ recognition capabilities. For the BPNN, the number of nodes in the input layer is set to 251, the number of nodes in the hidden layer is set to 6, and the number of nodes in the output layer is set to 4. In addition, the target error of the model is set to 1 × 10⁻⁶, and the learning rate is 0.01. For the RBFNN, the Gaussian kernel is used. The RBF can be adaptively determined according to the training data, and the expansion speed of the RBF is set to 100.
The comparison results are depicted in Figure 13, while Table 5 and Table 6 show the accuracy, precision, recall rate, and F1-score of the three models under different types of discharge signals. It can be seen from Table 5 and Table 6 that the CNN model has higher recognition precision, recall rate, and F1-score for the four discharge signals. Although the recognition effect of the discharge at the tip and the discharge at the air gap is relatively poor, the accuracy rate of the CNN model is higher than that of the other two models, indicating that the model has a more accurate overall prediction of the four discharge signals, better classification effect, and more stable model.
Although the proposed CNN-based classification model demonstrates higher accuracy than the other two NN-based classification models, it also requires a longer runtime. This is attributed to CNN’s convolution layer, which enhances the model’s local feature extraction capability by using convolution kernels to capture specific signal features, thereby effectively differentiating between different signal types. The increased sensitivity and accuracy of signal recognition comes at the cost of increased computational complexity, resulting in higher time costs.

5. Conclusions

In this paper, a CNN-based classification method for distinguishing different defect discharge signals in high-speed EMU cable terminals is presented. Within a laboratory environment, a PD test platform using the HFCT was established for the collection of PD signals from various defects, and these signals were classified using the proposed CNN-based classification model. Furthermore, the effects of three different optimizers and varying amounts of training data on the classification accuracy of the high-speed EMU cable terminal PD model were investigated, and the proposed CNN-based classification model was compared with two existing NN-based classification models. The main conclusions are drawn as follows:
  • Compared with SGDM and RMSprop optimizers, the Adam optimizer shows lower loss and higher classification accuracy in CNN-based classification model training, and the training effect is more stable.
  • It is found that increasing the amount of training data can enhance the robustness of the model and improve the classification accuracy but at the cost of increasing the training time.
  • Compared with the BPNN-based and RBFNN-based classification models, the CNN-based classification model proposed in this paper shows higher classification accuracy and can identify four different types of defects more accurately.
The method proposed in this paper can avoid the process of learning manual feature extraction in traditional machine learning and can effectively identify the discharge signals of four different defect types and achieve a high classification accuracy. In future research, we will focus more on artificial intelligence technology to optimize and perfect our classification model by learning and exploring new methods so that we can build a model with better classification effect and more stable performance.

Author Contributions

Conceptualization, K.C.; methodology, T.Z.; software, G.P.; validation, D.X., G.W. and G.G.; formal analysis, C.S. and Y.-C.L.; investigation, C.S.; resources, K.L.; data curation, S.J. and J.L.; writing—original draft preparation, T.Z.; writing—review and editing, T.Z., Y.-C.L. and K.C.; visualization, C.S.; supervision, G.W.; project administration, G.P. All authors have read and agreed to the published version of the manuscript.

Funding

This research was funded by National Natural Science Foundation of China (U1966602, 52377161, 52007158), Excellent Young Scientists Fund of China (51922090), Southwest Jiaotong University New Interdisciplinary Cultivation Project (YH1500112432273 and YH15001124322105), and Fundamental Research Funds for the Central Universities (A0920502052301-170).

Institutional Review Board Statement

Not applicable.

Informed Consent Statement

Not applicable.

Data Availability Statement

The data presented in this study are available upon request from the corresponding authors. The data are not publicly available due to further ongoing analysis, but data sharing may be anticipated upon completion.

Conflicts of Interest

Authors Chuanming Sun and Guixiang Pan are employed by CRRC Qingdao Sifang Co., Ltd. The remaining authors declare that the research was conducted in the absence of any commercial or financial relationships that could be construed as a potential conflict of interest.

References

  1. Xin, D.; Wu, G.; Chen, K.; Liu, K.; Xie, Y.; Gao, G.; Xiao, S.; Tang, Y.; Sun, C.; Lin, M. Research on the evolution characteristics of interfacial defect inside the vehicle-mounted high-voltage cable termination for high-speed trains. CSEE J. Power Energy Syst. 2023, 1–13. [Google Scholar] [CrossRef]
  2. Bai, L.; Fan, D.; Li, T.; Li, B.; Su, M.; Fan, S.; Zhang, L. Influence of surface discharge on the deterioration characteristics of ethylene-propylene rubber cable insulation under alternating current high voltage. IET Sci. Meas. Technol. 2022, 16, 293–304. [Google Scholar] [CrossRef]
  3. Bai, L.; Zhou, L.; Li, L.; Chen, Y.; Che, Y.; Yu, Y.; Guo, L. Partial discharge of cable termination on electric multiple unit of China high-speed railway below zero-degree centigrade. IET Sci. Meas. Technol. 2019, 13, 912–921. [Google Scholar] [CrossRef]
  4. Park, J.M.; Jeon, J.C.; Han, G.R. New approach in partial discharge diagnosis and maintenance of 22.9 kV XLPE power cables in service. Electr. Eng. 2019, 101, 1199–1209. [Google Scholar] [CrossRef]
  5. Hassan, W.; Shafiq, M.; Hussain, G.A.; Choudhary, M.; Palu, I. Investigating the progression of insulation degradation in power cable based on partial discharge measurements. Electr. Power Syst. Res. 2023, 221, 109452. [Google Scholar] [CrossRef]
  6. Arikan, O.; Uydur, C.C.; Kumru, C.F. Insulation evaluation of MV underground cable with partial discharge and dielectric dissipation factor measurements. Electr. Power Syst. Res. 2023, 220, 109338. [Google Scholar] [CrossRef]
  7. Sahoo, R.; Karmakar, S. Investigation of electrical tree growth characteristics and partial discharge pattern analysis using deep neural network. Electr. Power Syst. Res. 2023, 220, 109287. [Google Scholar] [CrossRef]
  8. Yaacob, M.M.; Alsaedi, M.A.; Rashed, J.R.; Dakhil, A.M.; Atyah, S.F. Review on partial discharge detection techniques related to high voltage power equipment using different sensors. Photonic Sens. 2014, 4, 325–337. [Google Scholar] [CrossRef]
  9. Chen, Y.; Heredia, L.C.C.; Smit, J.J.; Niasar, M.G.; Ross, R. Partial discharge detection on power equipment using a magneto-resistive sensor. Int. J. Electr. Power Energy Syst. 2023, 152, 109270. [Google Scholar] [CrossRef]
  10. Chen, H.C. Fractal features-based pattern recognition of partial discharge in XLPE power cables using extension method. IET Gener. Transm. Distrib. 2012, 6, 1096–1103. [Google Scholar] [CrossRef]
  11. Wang, X.; Li, B.; Xiao, Z.; Lee, S.H.; Roman, H.; Russo, O.L.; Chin, K.K.; Farmer, K.R. An ultra-sensitive optical MEMS sensor for partial discharge detection. J. Micromechanics Microengineering 2004, 15, 521. [Google Scholar] [CrossRef]
  12. Wei, X.; Teng, Y.; Liu, Z.Q.; Deng, J.Q.; Jia, Y.Y. Application research of the partial discharge automatic detection device and diagnostic method based on the ultrasonic in long distance GIL equipment. J. Phys. Conf. Ser. 2019, 1213, 052088. [Google Scholar] [CrossRef]
  13. Shin, J.Y.; Lee, Y.S.; Hong, J.-W. Partial discharge detection of high voltage switchgear using a ultra high frequency sensor. Trans. Electr. Electron. Mater. 2013, 14, 211–215. [Google Scholar] [CrossRef]
  14. Deng, K.; Wen, Q.; Zhang, Y. Detection method of partial discharge defects in cable terminals based on ultrasonic infrared thermography. Infrared Technol. 2022, 44, 972–978. [Google Scholar]
  15. Govindarajan, S.; Morales, A.; Ardila-Rey, J.A.; Purushothaman, N. A review on partial discharge diagnosis in cables: Theory, techniques, and trends. Measurement 2023, 216, 112882. [Google Scholar] [CrossRef]
  16. Álvarez, F.; Garnacho, F.; Ortego, J.; Sánchez-Urán, M.Á. Application of HFCT and UHF sensors in on-line partial discharge measurements for insulation diagnosis of high voltage equipment. Sensors 2015, 15, 7360–7387. [Google Scholar] [CrossRef]
  17. Tian, Y.; Lewin, P.L.; Davies, A.E. Comparison of on-line partial discharge detection methods for HV cable joints. IEEE Trans. Dielectr. Electr. Insul. 2002, 9, 604–615. [Google Scholar] [CrossRef]
  18. Ahmed, N.H.; Srinivas, N.N. On-line partial discharge detection in cables. IEEE Trans. Dielectr. Electr. Insul. 1998, 5, 181–188. [Google Scholar] [CrossRef]
  19. Zhang, H.; Duan, Y.; Wang, B.; Liu, H.; Lin, Y.; Hu, X.; Liu, R.; Wang, M. Case analysis on partial discharge signal of XLPE cable T-joint by using high-frequency pulse current method. Energy Procedia 2017, 141, 545–550. [Google Scholar]
  20. Yang, Y.; Li, J.; Chen, Z.; Liu, Y.; Chen, K.; Liu, K.; Xin, D.; Gao, G.; Wu, G. Classification of partial discharge in vehicle-mounted cable termination of high-speed electric multiple unit: A machine learning-based approach. Electronics 2024, 13, 495. [Google Scholar] [CrossRef]
  21. IEC-60270; High-Voltage Test Techniques: Partial Discharge Measurements. British Standards Institution (BSI): London, UK, 2000; pp. 13–31.
  22. Gu, X.; He, S.; Xu, Y.; Yan, Y.; Hou, S.; Fu, M. Partial discharge detection on 320 kV VSC-HVDC XLPE cable with artificial defects under DC voltage. IEEE Trans. Dielectr. Electr. Insul. 2018, 25, 939–946. [Google Scholar] [CrossRef]
  23. Zhou, Y.; Wang, Y.; Wang, W. A study on the propagation characteristics of partial discharge in cable joints based on the FDTD method. IEEE Access 2020, 8, 130094–130103. [Google Scholar] [CrossRef]
  24. Wang, D.; Zhou, L.; Yang, Z.X.; Quan, S.; Liu, C.; Tang, H.; Wu, J. Defects Detection of On-board Cable Termination in EMUs Using Partial Discharge Measurement and SDP-DL Framework. IEEE Trans. Transp. Electrif. 2022, 9, 3127–3136. [Google Scholar] [CrossRef]
  25. Zhao, Z.; Wu, J.; Li, T.; Sun, C.; Yan, R.; Chen, X. Challenges and opportunities of AI-enabled monitoring, diagnosis & prognosis: A review. Chin. J. Mech. Eng. 2021, 34, 56. [Google Scholar]
  26. Nor, A.K.M.; Pedapati, S.R.; Muhammad, M.; Leiva, V. Overview of explainable artificial intelligence for prognostic and health management of industrial assets based on preferred reporting items for systematic reviews and meta-analyses. Sensors 2021, 21, 8020. [Google Scholar] [CrossRef]
  27. Samanta, A.; Chowdhuri, S.; Williamson, S.S. Machine learning-based data-driven fault detection/diagnosis of lithium-ion battery: A critical review. Electronics 2021, 10, 1309. [Google Scholar] [CrossRef]
  28. Zhao, S.; Blaabjerg, F.; Wang, H. An overview of artificial intelligence applications for power electronics. IEEE Trans. Power Electron. 2020, 36, 4633–4658. [Google Scholar] [CrossRef]
  29. Liu, Y.-C.; Laghrouche, S.; N’Diaye, A.; Narayan, S.; Cirrincione, G.; Cirrincione, M. Sensorless Control of Synchronous Reluctance Motor Drives Based on the TLS EXIN Neuron. In Proceedings of the 2019 IEEE International Electric Machines & Drives Conference, San Diego, CA, USA, 12–15 May 2019. [Google Scholar]
  30. Zhang, S.; Zhang, S.; Wang, B.; Habetler, T.G. Deep learning algorithms for bearing fault diagnostics—A comprehensive review. IEEE Access 2020, 8, 29857–29881. [Google Scholar] [CrossRef]
  31. Skowron, M.; Orlowska-Kowalska, T.; Wolkiewicz, M.; Kowalski, C.T. Convolutional neural network-based stator current data-driven incipient stator fault diagnosis of inverter-fed induction motor. Energies 2020, 13, 1475. [Google Scholar] [CrossRef]
  32. Liu, Y.-C.; Laghrouche, S.; N’Diaye, A.; Cirrincione, M. Hermite neural network-based second-order sliding-mode control of synchronous reluctance motor drive systems. J. Frankl. Inst. 2021, 385, 400–427. [Google Scholar] [CrossRef]
  33. Deng, Y.; Du, S.; Wang, D.; Shao, Y.; Huang, D. A calibration-based hybrid transfer learning framework for RUL Prediction of rolling bearing across different machines. IEEE Trans. Instrum. Meas. 2023, 72, 3511015. [Google Scholar] [CrossRef]
  34. Majidi, M.; Fadali, M.S.; Etezadi-Amoli, M.; Oskuoee, M. Partial discharge pattern recognition via sparse representation and ANN. IEEE Trans. Dielectr. Electr. Insul. 2015, 22, 1061–1070. [Google Scholar] [CrossRef]
  35. Chen, H.C.; Gu, F.C.; Wang, M.H. A novel extension neural network based partial discharge pattern recognition method for high-voltage power apparatus. Expert Syst. Appl. 2012, 39, 3423–3431. [Google Scholar] [CrossRef]
  36. Tang, J.; Zhuo, R.; Wang, D.B.; Wu, J.; Zhang, X. Application of SA-SVM incremental algorithm in GIS PD pattern recognition. J. Electr. Eng. Technol. 2016, 11, 192–199. [Google Scholar] [CrossRef]
  37. Karimi, M.; Majidi, M.; MirSaeedi, H.; Arefi, M.M.; Oskuoee, M. A novel application of deep belief networks in learning partial discharge patterns for classifying corona, surface, and internal discharges. IEEE Trans. Ind. Electron. 2019, 67, 3277–3287. [Google Scholar] [CrossRef]
  38. Alvarez, F.; Ortego, J.; Garnacho, F.; Sanchez-Uran, M.A. A clustering technique for partial discharge and noise sources identification in power cables by means of waveform parameters. IEEE Trans. Dielectr. Electr. Insul. 2016, 23, 469–481. [Google Scholar] [CrossRef]
  39. Uckol, H.I.; Ilhan, S.; Ozdemir, A. Workmanship defect classification in medium voltage cable terminations with convolutional neural network. Electr. Power Syst. Res. 2021, 194, 107105. [Google Scholar] [CrossRef]
  40. Peng, X.; Yang, F.; Wang, G.; Wu, Y.; Li, L.; Li, Z.; Bhatti, A.A.; Zhou, C.; Hepburn, D.M.; Reid, A.J. A convolutional neural network-based deep learning methodology for recognition of partial discharge patterns from high-voltage cables. IEEE Trans. Power Deliv. 2019, 34, 1460–1469. [Google Scholar] [CrossRef]
  41. Fu, Y.; Liang, L.; Huang, W.; Huang, G.; Zhang, Z.; Chen, C.; Wang, C. Partial discharge pattern recognition method based on Transfer Learning and DenseNet model. IEEE Trans. Dielectr. Electr. Insul. 2023, 30, 1240–1246. [Google Scholar]
  42. Gao, G.; Zhou, S.; Yang, S.; Chen, K.; Xin, D.; Tang, Y.; Liu, K.; Wu, G. Accurate identification partial discharge of cable termination for high-speed trains based on wavelet transform and convolutional neural network. Electr. Power Syst. Res. 2023, 225, 109838. [Google Scholar] [CrossRef]
  43. Su, M.S.; Chen, J.F.; Lin, Y.H. Phase determination of partial discharge source in a three-phase transmission line based on high-frequency equivalent circuit model and signal detection using HFCT. Int. Trans. Electr. Energy Syst. 2013, 23, 97–108. [Google Scholar] [CrossRef]
  44. Kim, J.T.; Kim, D.U.; Lee, Y.J.; Koo, J.Y. Analysis of Partial Discharge Inception Voltages for the Wrong Positioning Defects in the Joint of Distribution Power Cables. J. Electr. Eng. Technol. 2012, 7, 977–982. [Google Scholar] [CrossRef]
  45. Qi, F.; Wan, D.; OuYang, X.; Jiang, Q.; Zhao, M.; Zhou, H. Influence of different XLPE cable defects on the initiation of electric trees. J. Electr. Eng. Technol. 2019, 14, 2625–2632. [Google Scholar] [CrossRef]
  46. Jiang, T.; Li, J.; Zheng, Y.; Sun, C. Improved bagging algorithm for pattern recognition in UHF signals of partial discharges. Energies 2011, 4, 1087–1101. [Google Scholar] [CrossRef]
  47. Khan, M.Y.A.; Koo, J.Y. Neural network based diagnosis of partial discharge defects patterns at XLPE cable under DC stress. Electr. Eng. 2017, 99, 119–132. [Google Scholar] [CrossRef]
  48. Peng, X.; Wen, J.; Li, Z.; Yang, G.; Zhou, C.; Reid, A.; Hepburn, D.M.; Judd, M.D.; Siew, W.H. SDMF based interference rejection and PD interpretation for simulated defects in HV cable diagnostics. IEEE Trans. Dielectr. Electr. Insul. 2017, 24, 83–91. [Google Scholar] [CrossRef]
  49. Yang, B.; Wang, H.; Peng, X.; Zhou, H.; Xia, Z.; Sun, C.; Guo, H. Partial discharge characteristics of typical defects of high voltage DC cables. In Proceedings of the 2020 IEEE International Conference on High Voltage Engineering and Application, Beijing, China, 6–10 September 2020. [Google Scholar]
  50. Li, Z.; Xu, Y.; Jiang, X. Pattern recognition of DC partial discharge on XLPE cable based on ADAM-DBN. Energies 2020, 13, 4566. [Google Scholar] [CrossRef]
  51. LeCun, Y.; Bottou, L.; Bengio, Y.; Haffner, P. Gradient-based learning applied to document recognition. Proc. IEEE 1998, 86, 2278–2324. [Google Scholar] [CrossRef]
  52. Han, T.; Tian, Z.; Yin, Z.; Tan, A.C. Bearing fault identification based on convolutional neural network by different input modes. J. Braz. Soc. Mech. Sci. Eng. 2020, 42, 1–10. [Google Scholar] [CrossRef]
  53. Biswas, S.; Nayak, P.K.; Panigrahi, B.K.; Pradhan, G. An intelligent fault detection and classification technique based on variational mode decomposition-CNN for transmission lines installed with UPFC and wind farm. Electr. Power Syst. Res. 2023, 223, 109526. [Google Scholar] [CrossRef]
  54. He, J.; Li, L.; Xu, J.; Zheng, C. ReLU deep neural networks and linear finite elements. arXiv 2018, arXiv:1807.03973. [Google Scholar]
  55. Khan, M.A.; Choo, J.; Kim, Y.H. End-to-end partial discharge detection in power cables via time-domain convolutional neural networks. J. Electr. Eng. Technol. 2019, 14, 1299–1309. [Google Scholar] [CrossRef]
  56. Zheng, J.; Chen, Z.; Wang, Q.; Qiang, H.; Xu, W. GIS partial discharge pattern recognition based on time-frequency features and improved convolutional neural network. Energies 2022, 15, 7372. [Google Scholar] [CrossRef]
  57. Beura, C.P.; Wenger, P.; Tozan, E.; Beltle, M.; Tenbohlen, S. Classification of partial discharge sources in HVDC gas insulated switchgear using neural networks. In Proceedings of the VDE High Voltage Technology; 4. ETG-Symposium, Berlin, Germany, 8–10 November 2022. [Google Scholar]
  58. Wang, L.; Hou, K.; Tan, L. Research of GIS partial discharge type evaluation based on convolutional neural network. AIP Adv. 2020, 10, 085305. [Google Scholar] [CrossRef]
  59. Kingma, D.P.; Ba, J. Adam: A method for stochastic optimization. arXiv 2014, arXiv:1412.6980. [Google Scholar]
Figure 1. PD test platform for high-speed EMU cable terminals.
Sensors 24 02660 g001
Figure 2. Circuit diagram of PD test platform based on the HFCT.
Sensors 24 02660 g002
Figure 4. Time domain waveforms of discharge high-frequency pulse current signal of four defect models: (a) tip discharge, (b) surface discharge, (c) air gap discharge, and (d) suspended discharge.
Sensors 24 02660 g004
Figure 5. CNN-based cable terminal discharge classification model of high-speed EMU.
Sensors 24 02660 g005
Figure 6. Time-domain diagram of discharge high-frequency pulse current signals of four defect models: (a) tip discharge, (b) surface discharge, (c) air gap discharge, and (d) suspension discharge.
Sensors 24 02660 g006
Figure 8. Training accuracy and loss of three optimizers: (a) loss curve and (b) accuracy curve.
Sensors 24 02660 g008
Figure 9. Training results based on three optimizers.
Sensors 24 02660 g009
Figure 10. Classification of terminal PD of high-speed EMU cables based on three optimizers: (a) Adam, (b) RMSprop, and (c) SGDM.
Sensors 24 02660 g010
Figure 11. Box plot of classification accuracy based on different training data amounts.
Sensors 24 02660 g011
Figure 12. Box plot of training time based on different training data amounts.
Sensors 24 02660 g012
Figure 13. Identification results of the three NN-based classification models: (a) CNN, (b) RBFNN, and (c) BPNN.
Sensors 24 02660 g013
Table 1. Advantages and disadvantages of PD detection methods and their application scopes.
Detection MethodMajor AdvantageMajor DefectMain Applicable Scopes
Pulse current methodHigh sensitivityLimited
anti-interference capability
Offline
measurement
Chemical detection methodStrong
anti-interference
Challenges in online gas component extractionOil filling
equipment
Radio frequency detection methodHigh sensitivity without affecting equipment
operation
Limited
anti-interference capability
Online
measurement
Infrared imagingHigh sensitivityIncomplete
detection
Electrical
equipment
Flash spottingStrong resistance to electromagnetic
interference
ExpensiveLaboratory
research
High-frequency pulse current methodHigh sensitivity; easy to installSusceptible to ground
commutation
High voltage
cables and electrical equipment
Ultrasonic methodStrong resistance to electromagnetic
interference
Average sensitivityElectrical primary equipment
Ultra-high
frequency method
High sensitivityLimitations in quantifyingElectrical equipment such as
transformers
Table 2. Confusion matrix.
Predicted01
Actual
0 T N F P
1 F N T P
Table 3. Classification accuracy of cable terminal discharge by different optimizers.
Discharge TypeAdamRMSpropSGDM
Precision (%)Accuracy
(%)
Precision (%)Accuracy
(%)
Precision (%)Accuracy
(%)
Surface Discharge10095.810094.510095
Tip Discharge92.584.490.1
Suspended
Discharge
10098.1100
Air Gap Discharge91.296.390.1
Table 4. Classification results of terminal discharge of high-speed EMU cables based on different training data.
Training Data VolumeSurface
Discharge
Tip
Discharge
Suspended
Discharge
Air Gap
Discharge
Accuracy
20%74.2%63.4%85.6%71.4%73.6%
40%95.4%79.9%96.7%81.8%88.5%
60%99.2%90.2%99.6%89.8%94.7%
80%100%95.8%100%93.8%97.4%
90%100%97.9%100%96.8%98.7%
Table 5. Classification results of terminal discharge of high-speed EMU cables with different models: accuracy and precision.
Discharge TypeCNNRBFNNBPNN
Precision (%)Accuracy
(%)
Precision (%)Accuracy
(%)
Precision (%)Accuracy
(%)
Surface Discharge10095.880.291.291.694.8
Tip Discharge92.589.797
Suspended
Discharge
10096.893
Air Gap Discharge91.298.297.8
Table 6. Classification results of terminal discharge of high-speed EMU cables with different models: recall and F1-score.
Discharge TypeCNNRBFNNBPNN
Recall (%)F1-Score
(%)
Recall (%)F1-Score
(%)
Recall (%)F1-Score
(%)
Surface Discharge1001001008993.392.4
Tip Discharge90.891.68587.39797
Suspended
Discharge
10010095.696.291.192
Air Gap Discharge92.79286.792.197.397.5
Disclaimer/Publisher’s Note: The statements, opinions and data contained in all publications are solely those of the individual author(s) and contributor(s) and not of MDPI and/or the editor(s). MDPI and/or the editor(s) disclaim responsibility for any injury to people or property resulting from any ideas, methods, instructions or products referred to in the content.

