Chemometric Classification of Herb – Orthosiphon stamineus According to Its Geographical Origin Using Virtual Chemical Sensor Based Upon Fast GC

Abstract
:Introduction
Scientific development on Orthosiphon stamineus
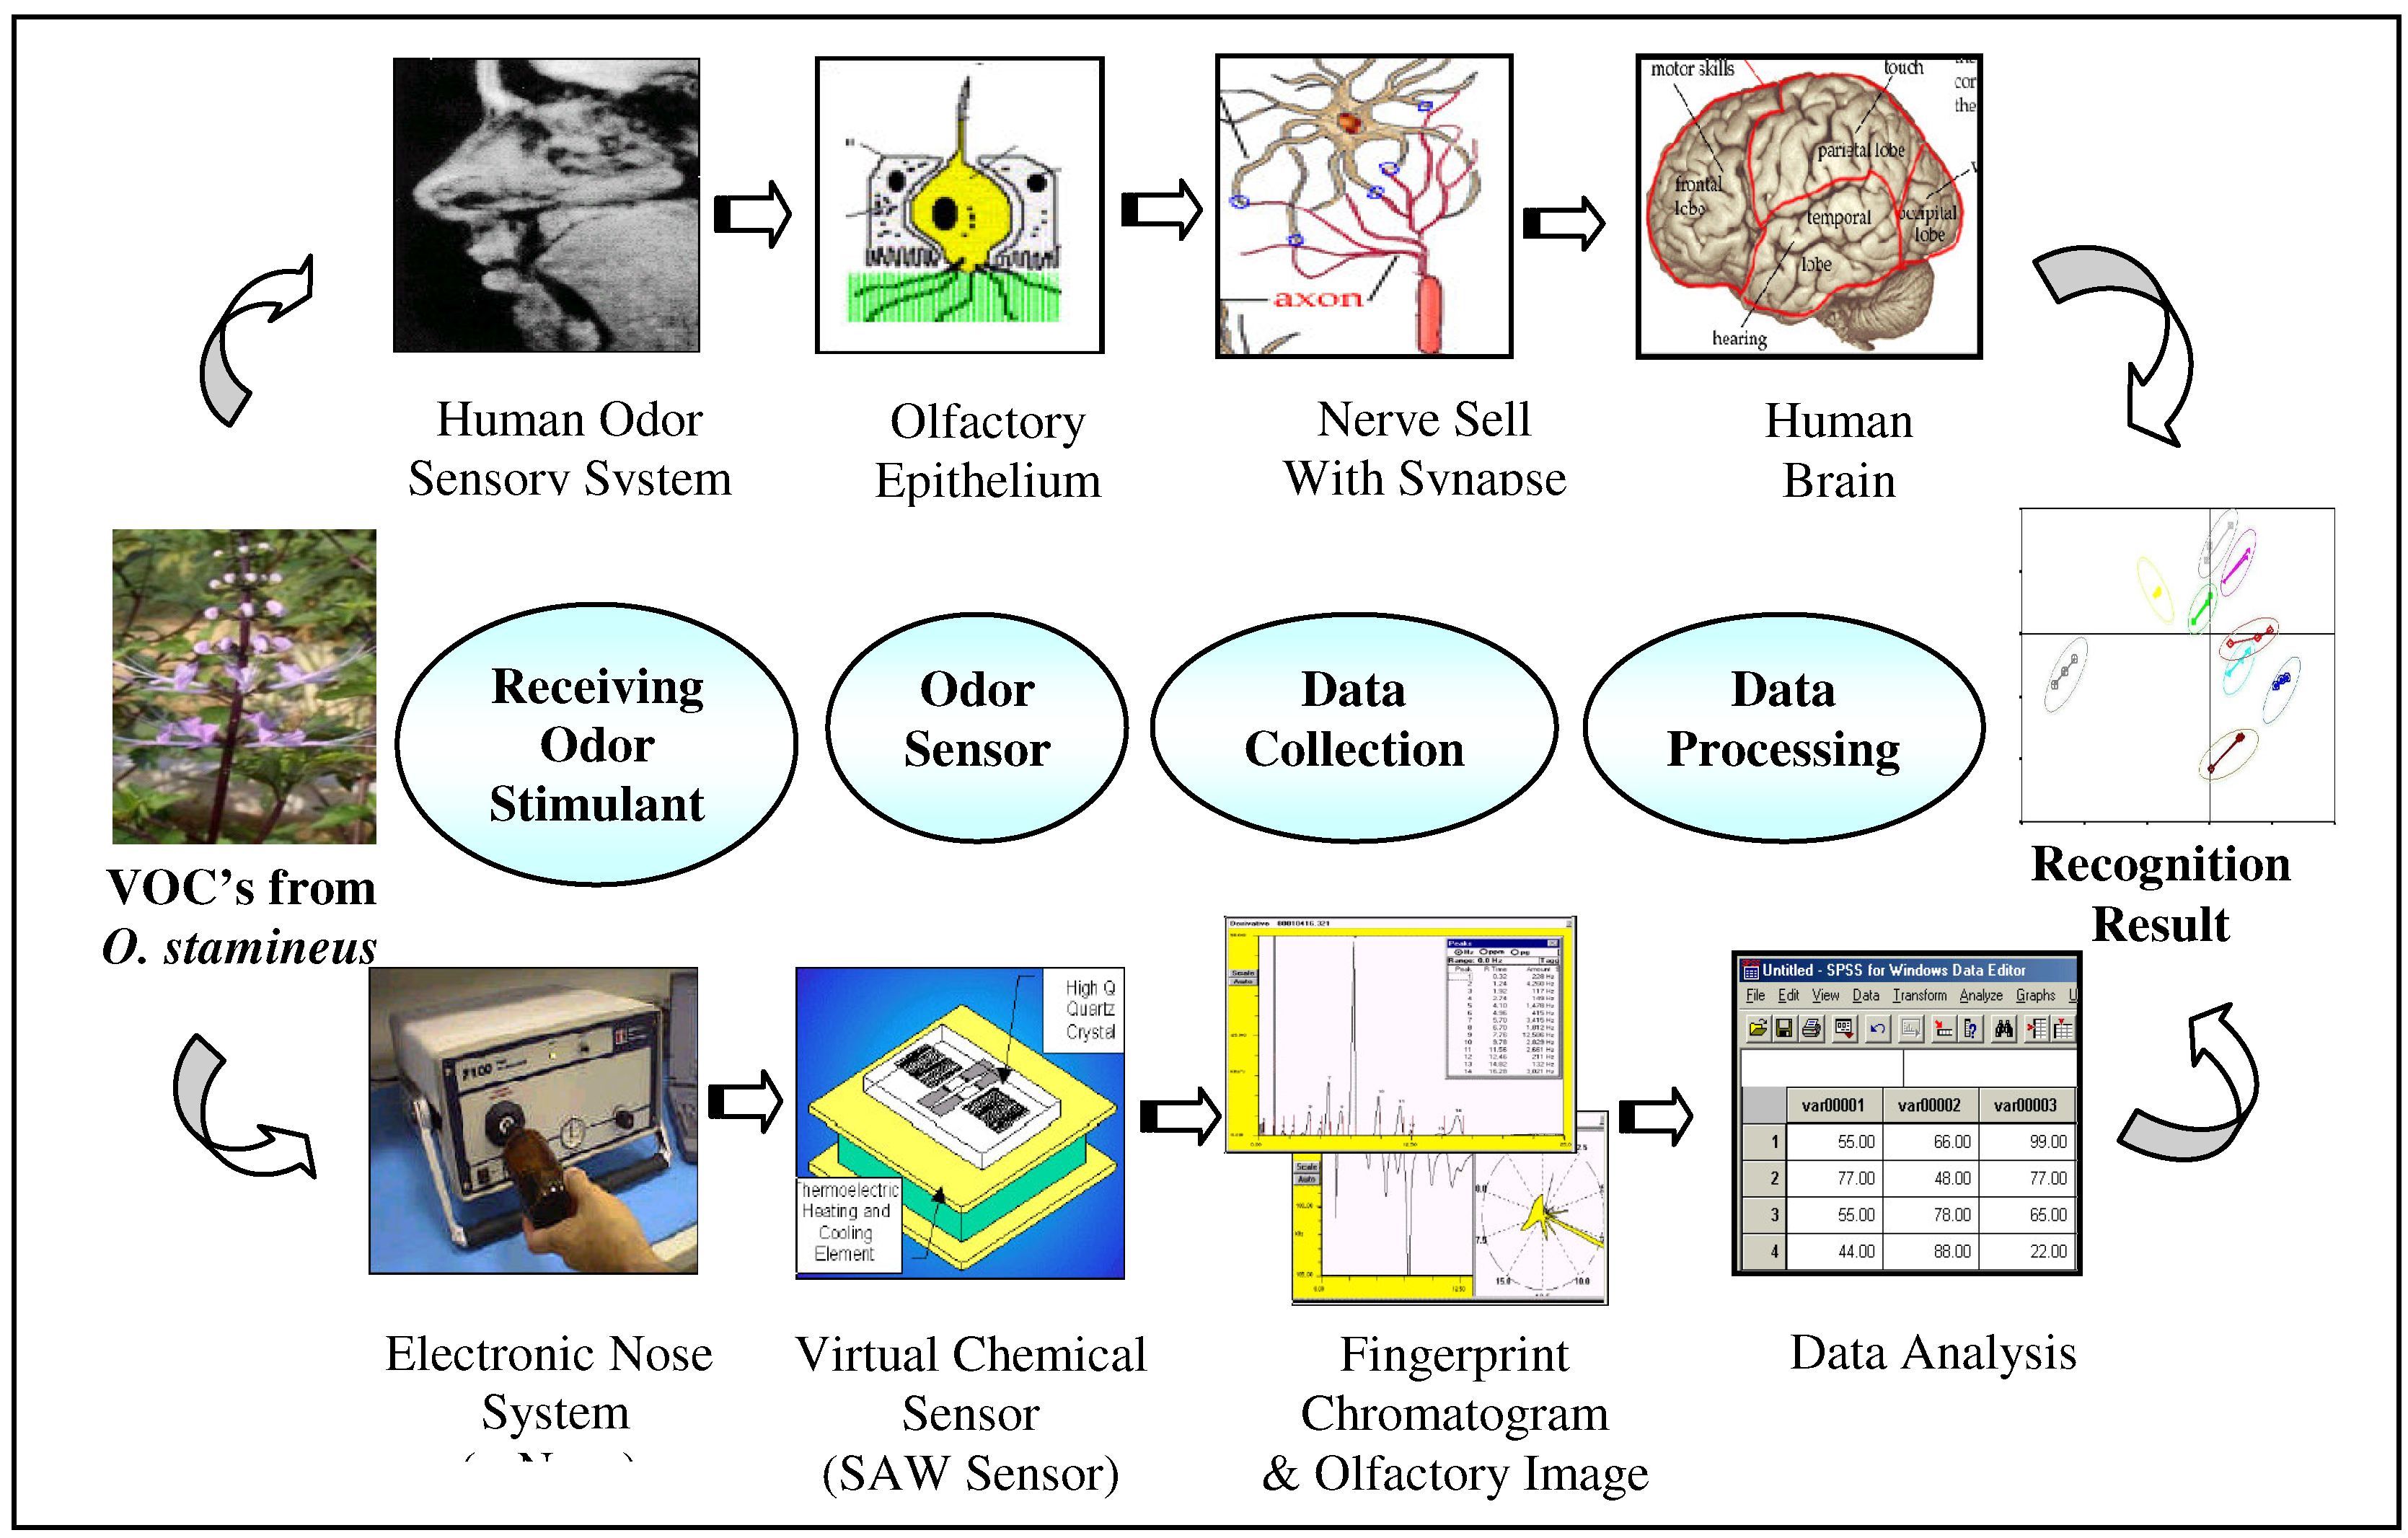
Electronic nose (E-nose)
Operating principle of GC / SAW electronic nose
System component of GC/SAW electronic system

Special feature on GC/SAW electronic system
- i)
- SAW detector response depends on the ability of analyte to absorb onto the cooled surface. Thus it is capable to detect an indefinite number of analyte without regard to analyte polarity or electronegativity. Besides, the SAW detector needs a lower voltage power source because radioactive ionization sources are excluded as compared to the Flame Ionization Detector in the normal GC system.
- ii)
- Preconcentrator vapor trap which functions as the purge and trap system in the normal GC apparatus. Only a small amount of sample is needed since the volatile compound from the headspace sample can be preconcentrated at a certain period before its was carried to the GC column by carrier gas flow.
- iii)
- Direct-heated GC column with built-in heating element and shorter column (~1m) makes data acquisition within 10 seconds a reality.
Multivariate statistical analysis
Chemometrics

Principal Component Analysis (PCA)

Cluster Analysis (CA)
Linear Discriminant Analysis (LDA)


Experimental
Materials

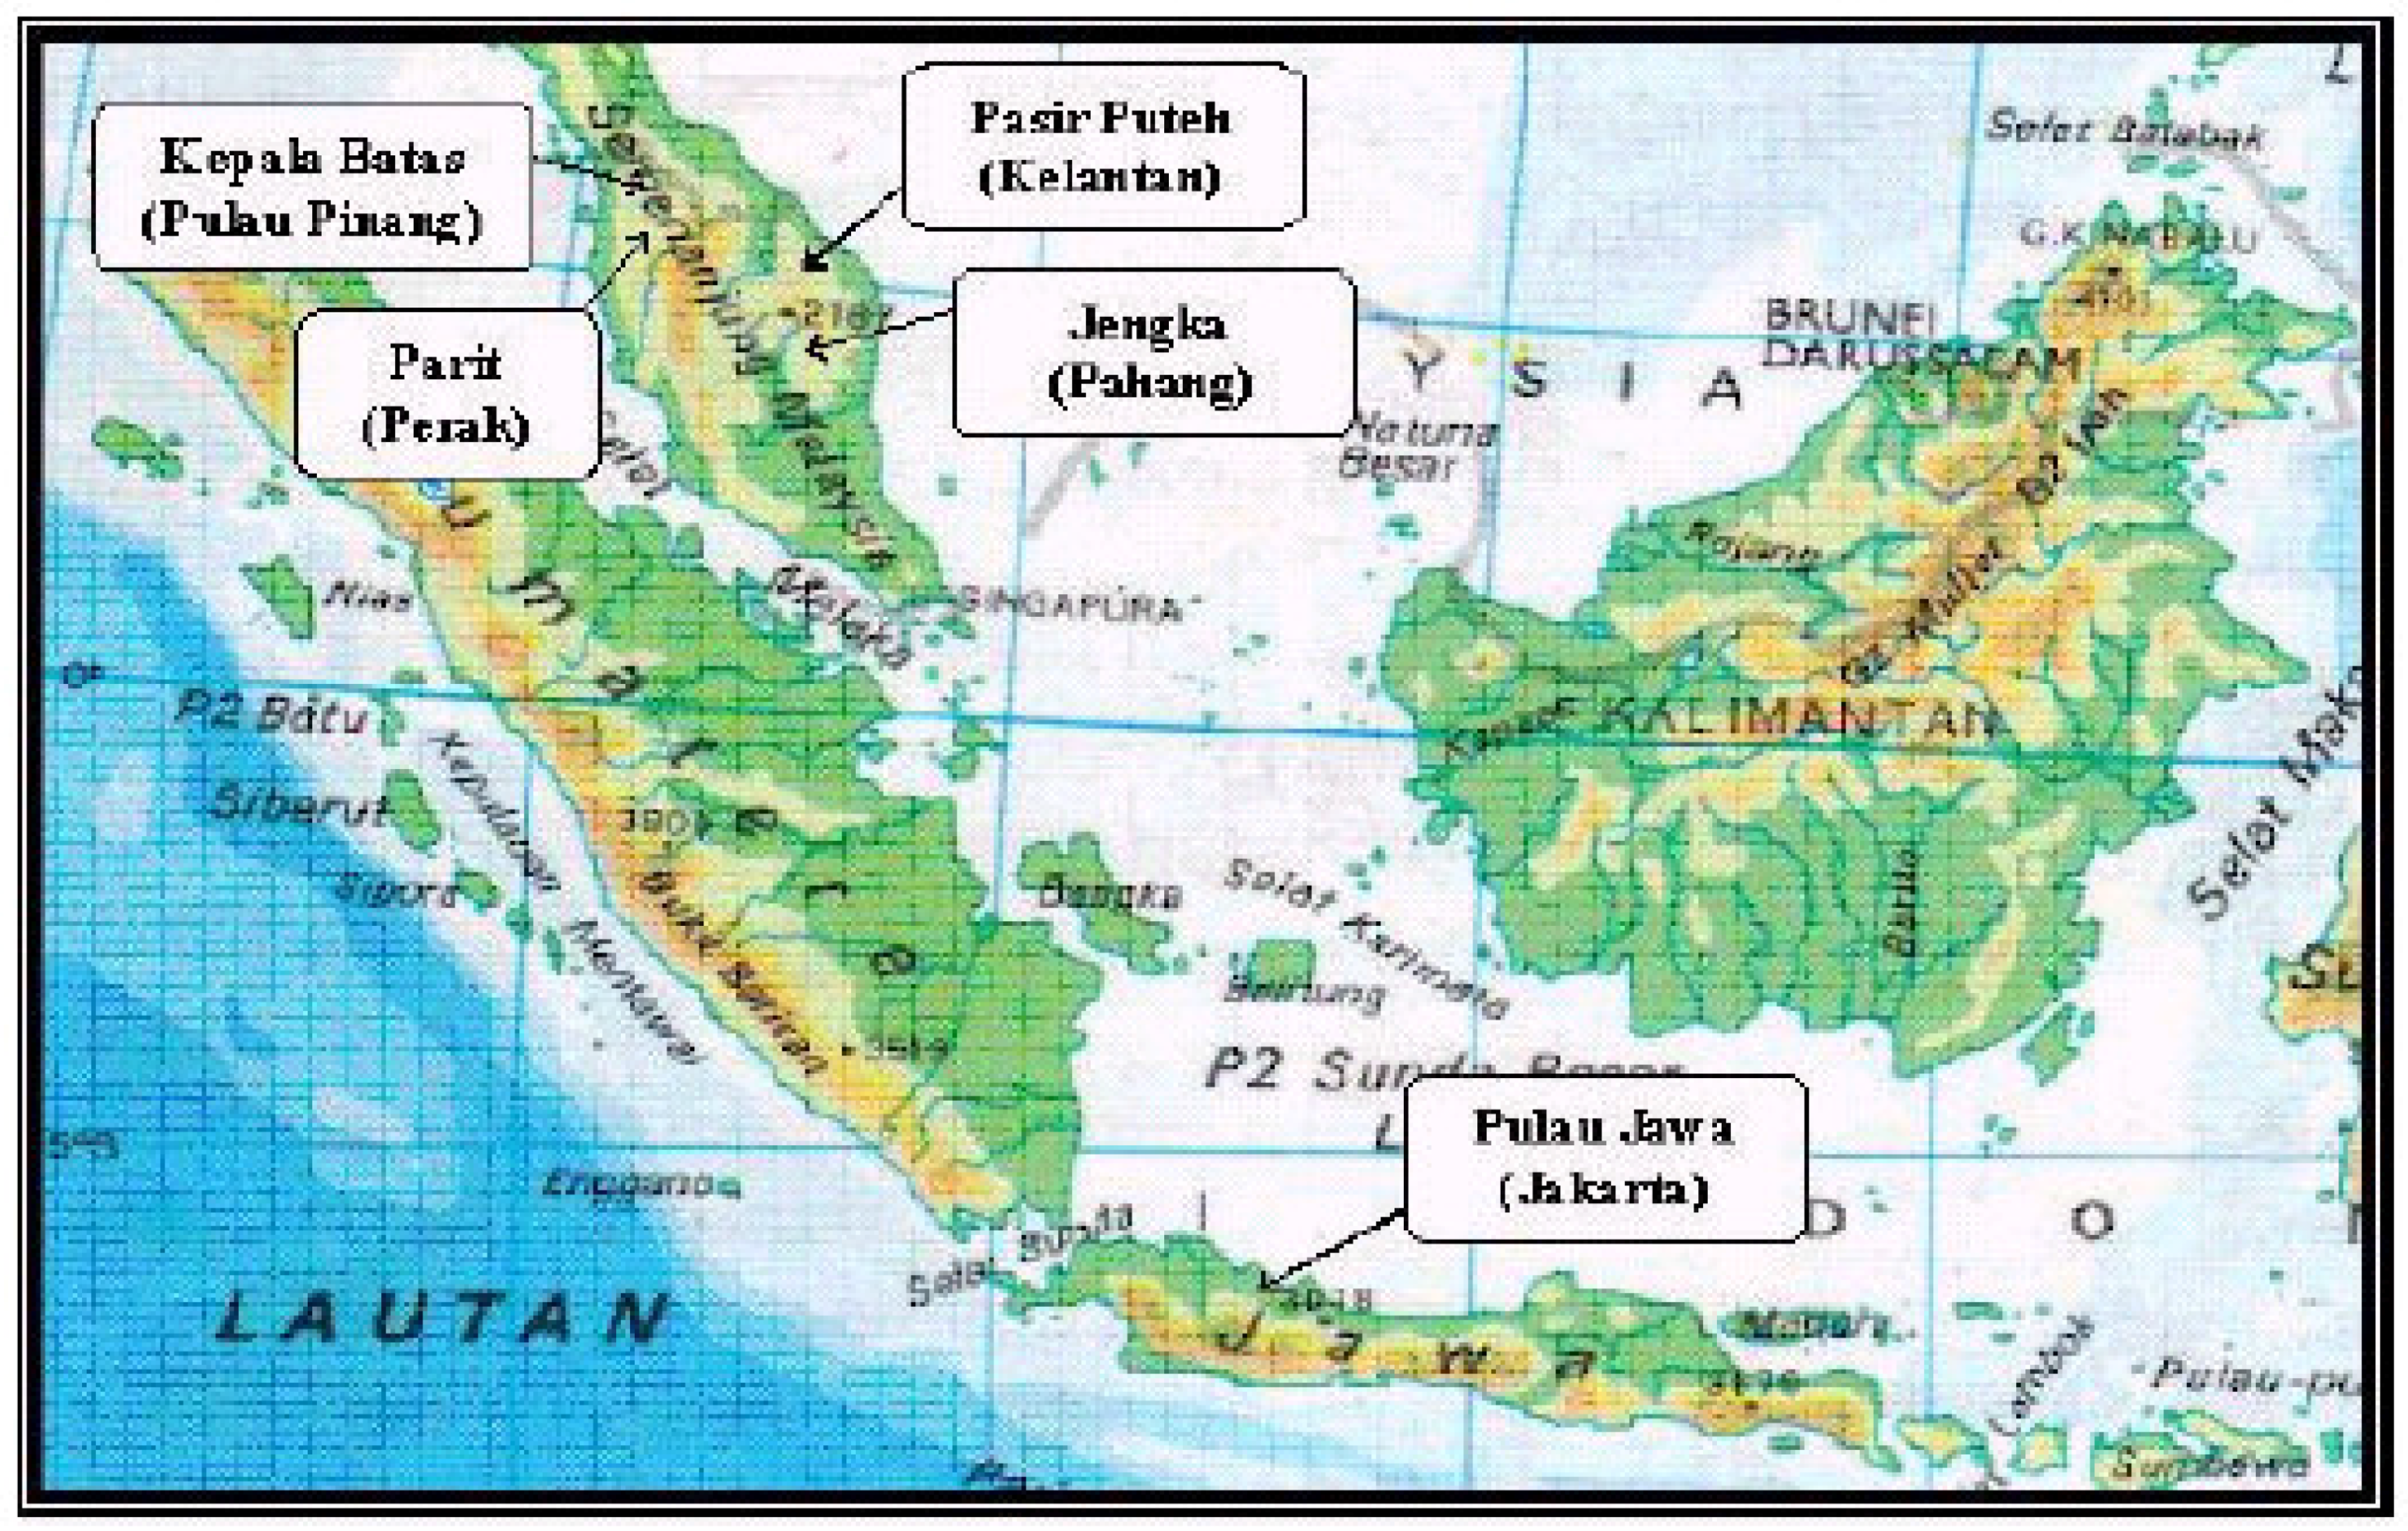
| Code* | Location | State | Country |
|---|---|---|---|
| SRKBPM | Kepala Batas | Pulau Pinang | Malaysia |
| STJGCM | Jengka | Pahang | Malaysia |
| ZBPRAM | Parit | Perak | Malaysia |
| NNPPDM | Pasir Puteh | Kelantan | Malaysia |
| NHPJI | Pulau Jawa | Jakarta | Indonesia |
Sample preparation
Analytical conditions
Data transformation and data analysis
Results and discussion
Optimum virtual chemical sensor array selection

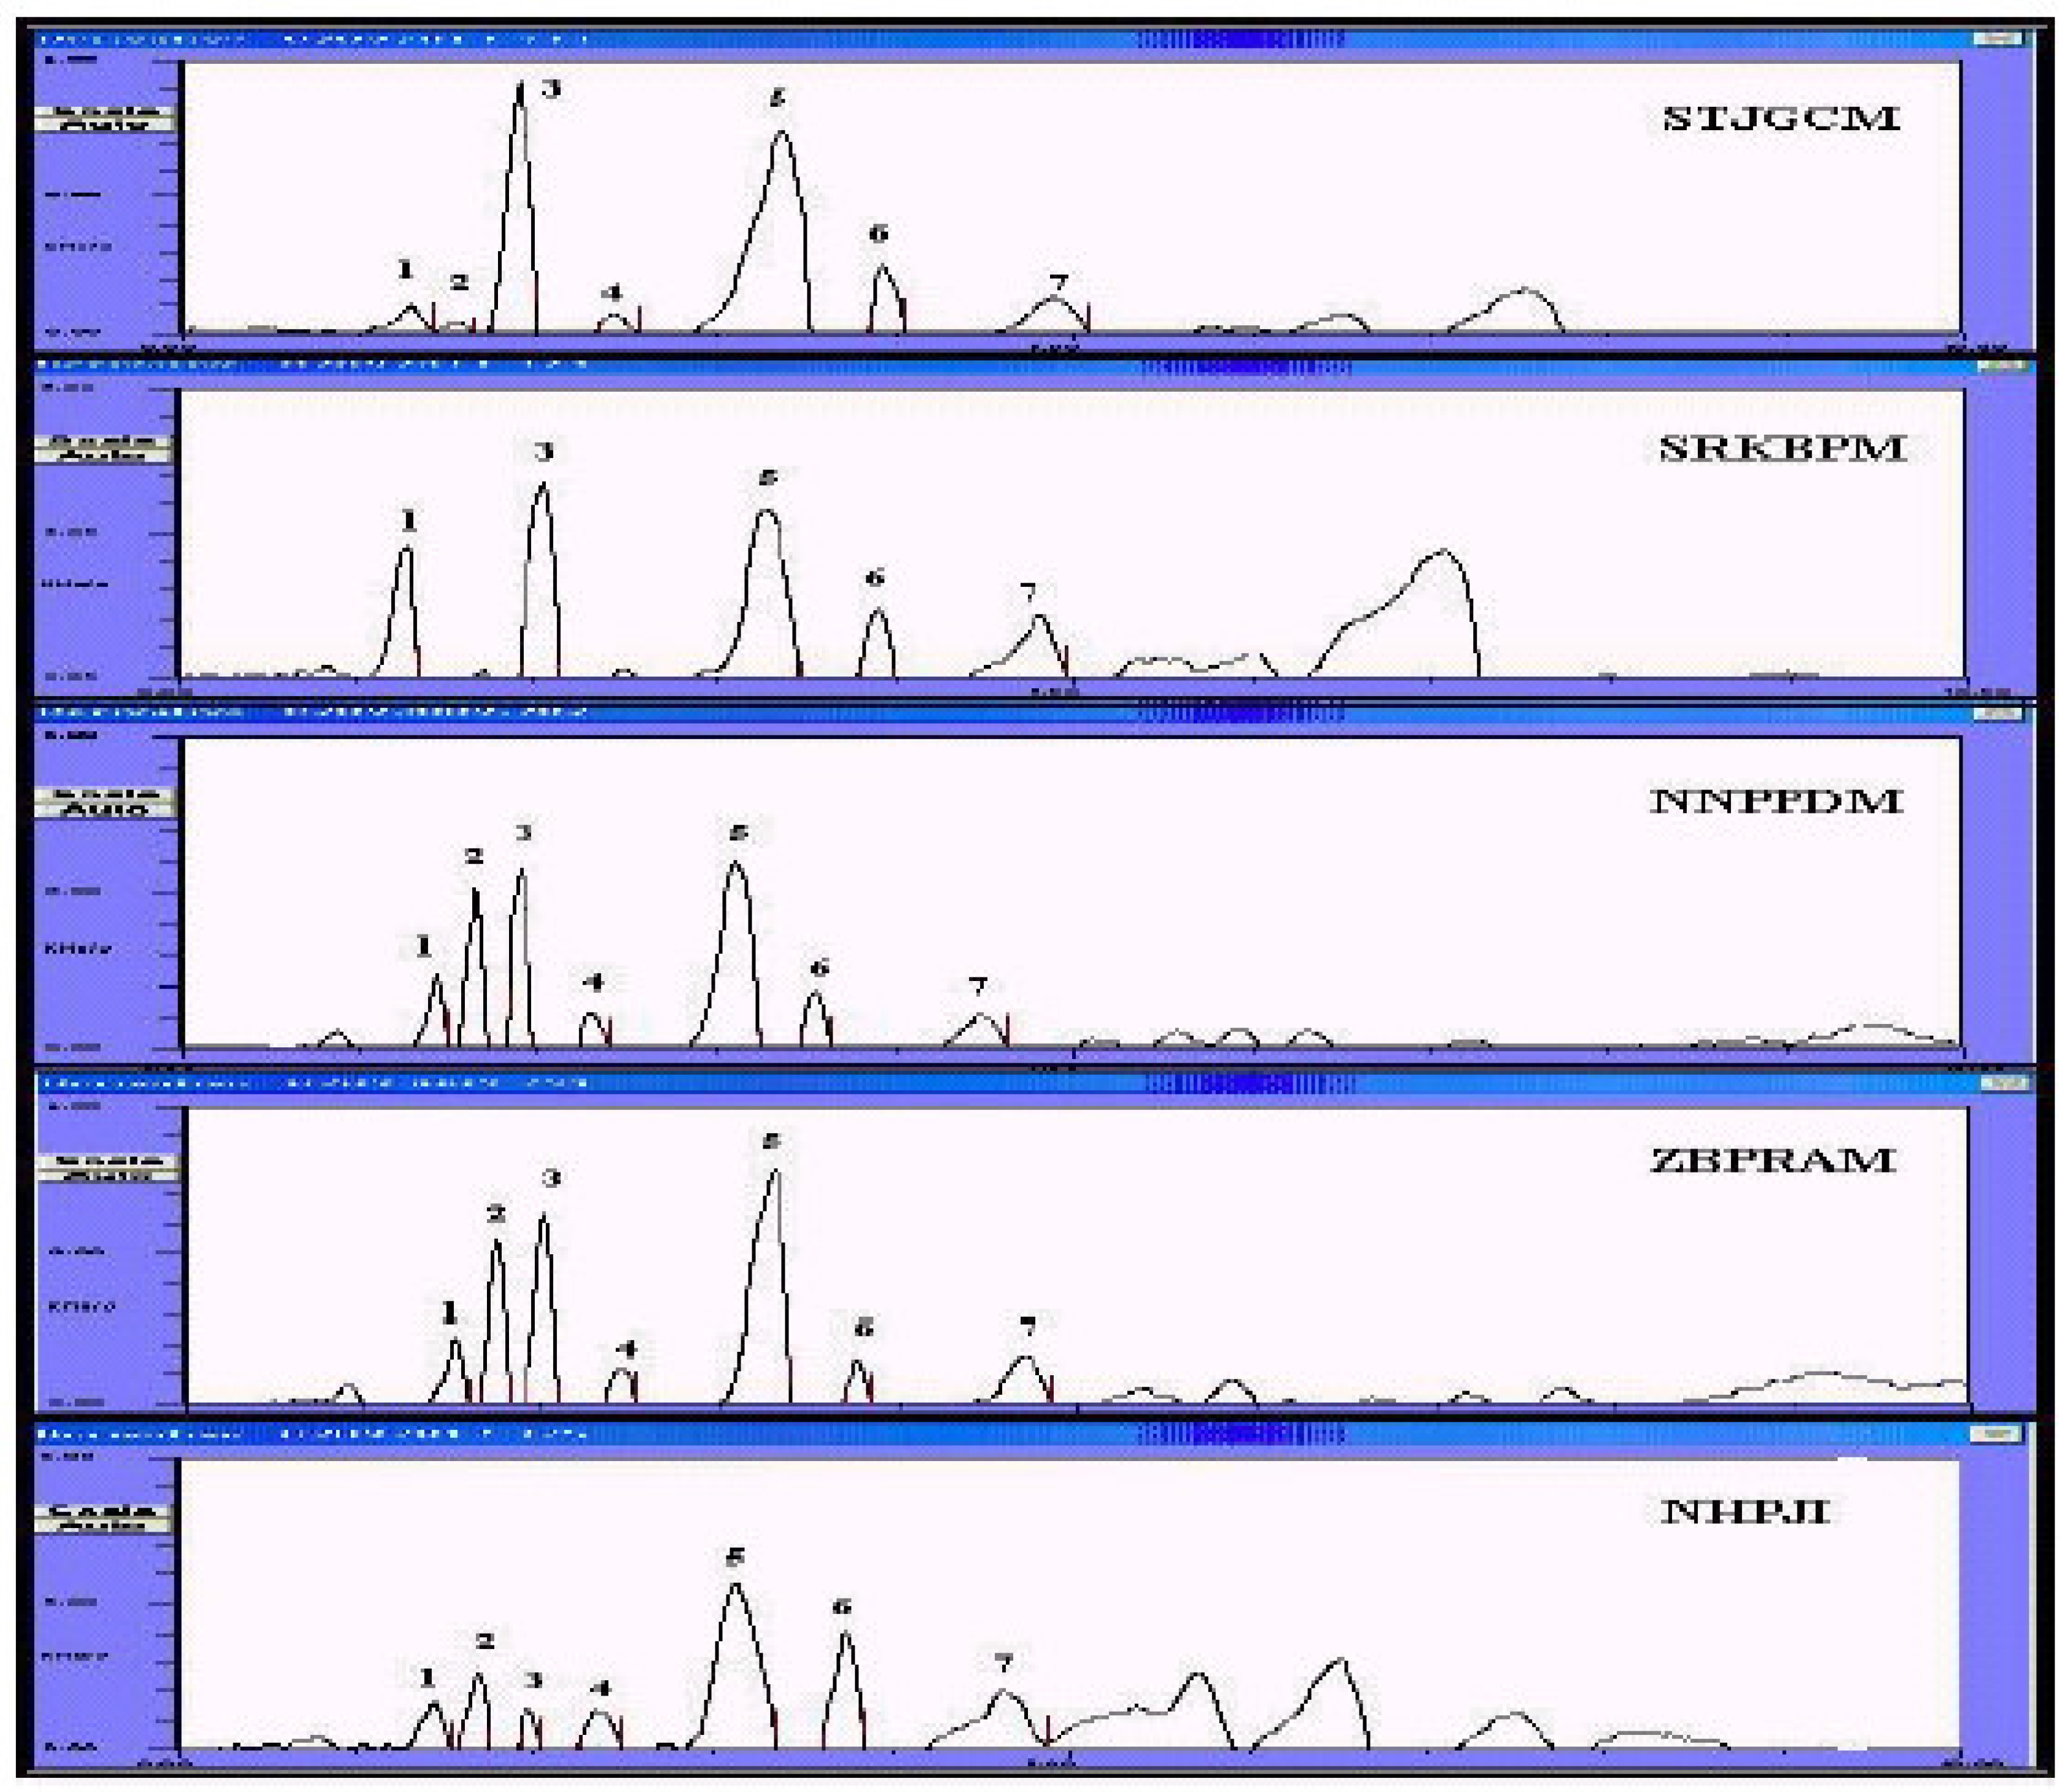
Classification by pattern recognition
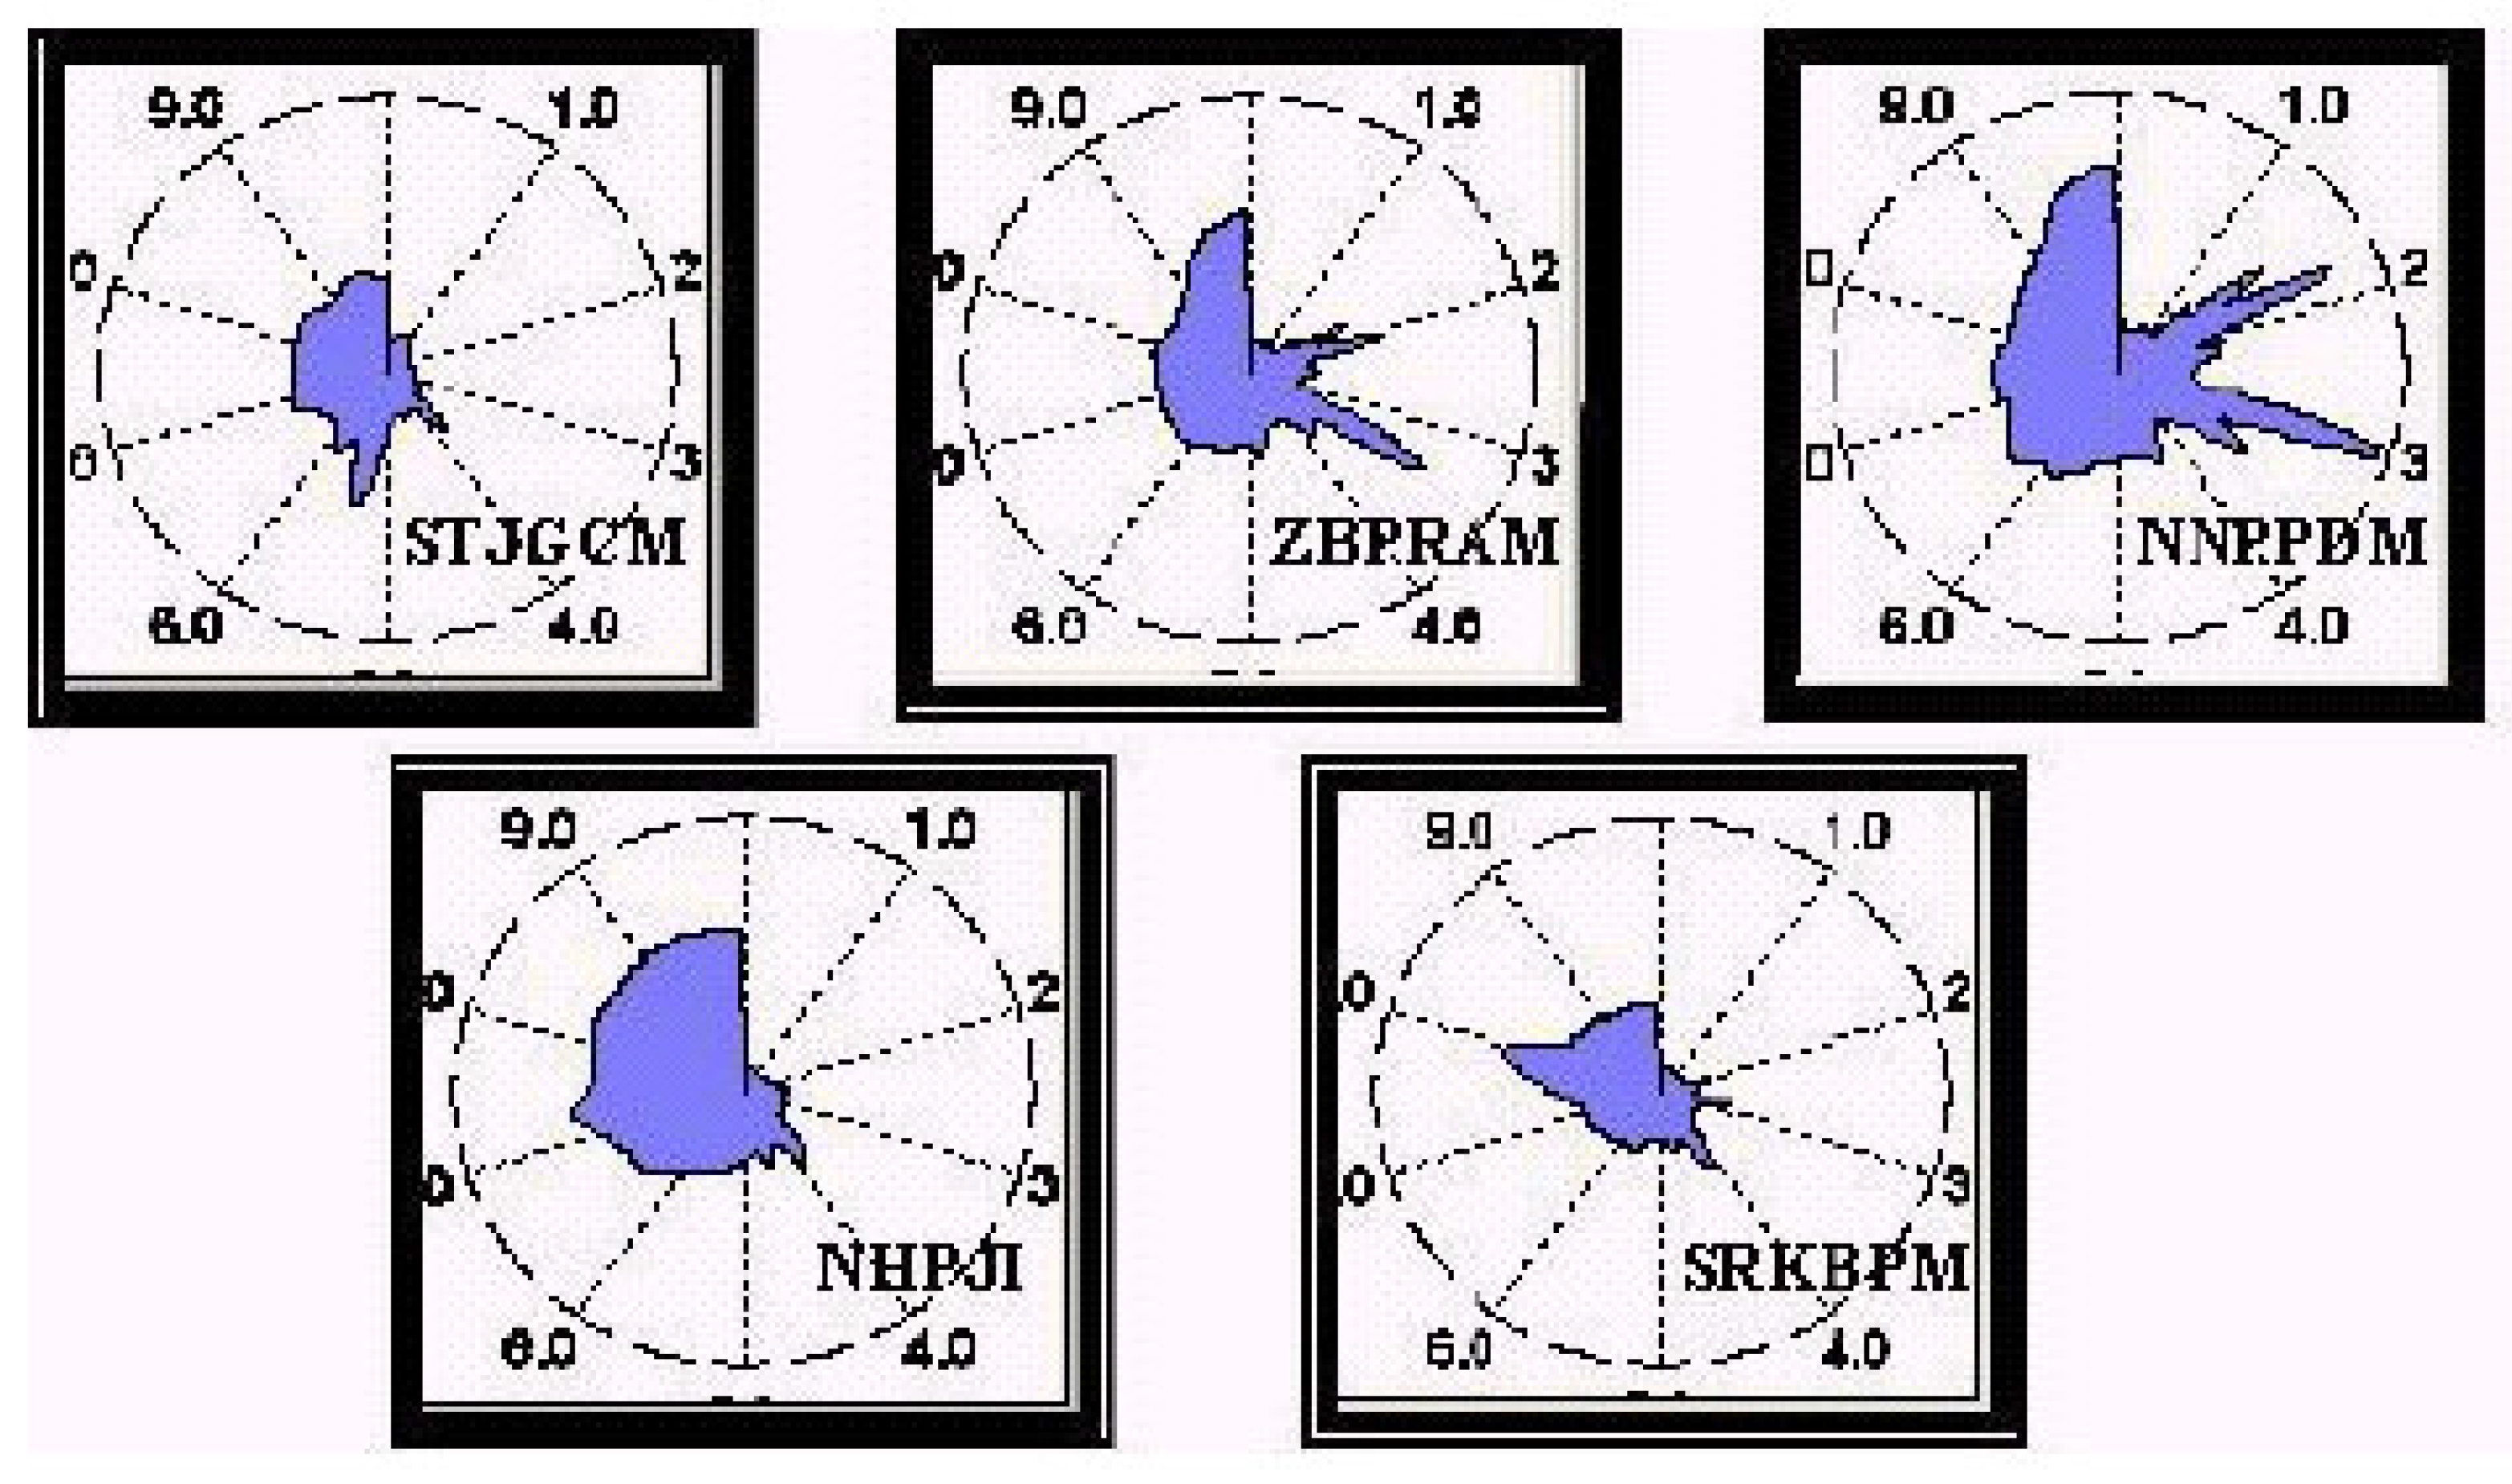
Image olfactory (VaporPrintTM Image)

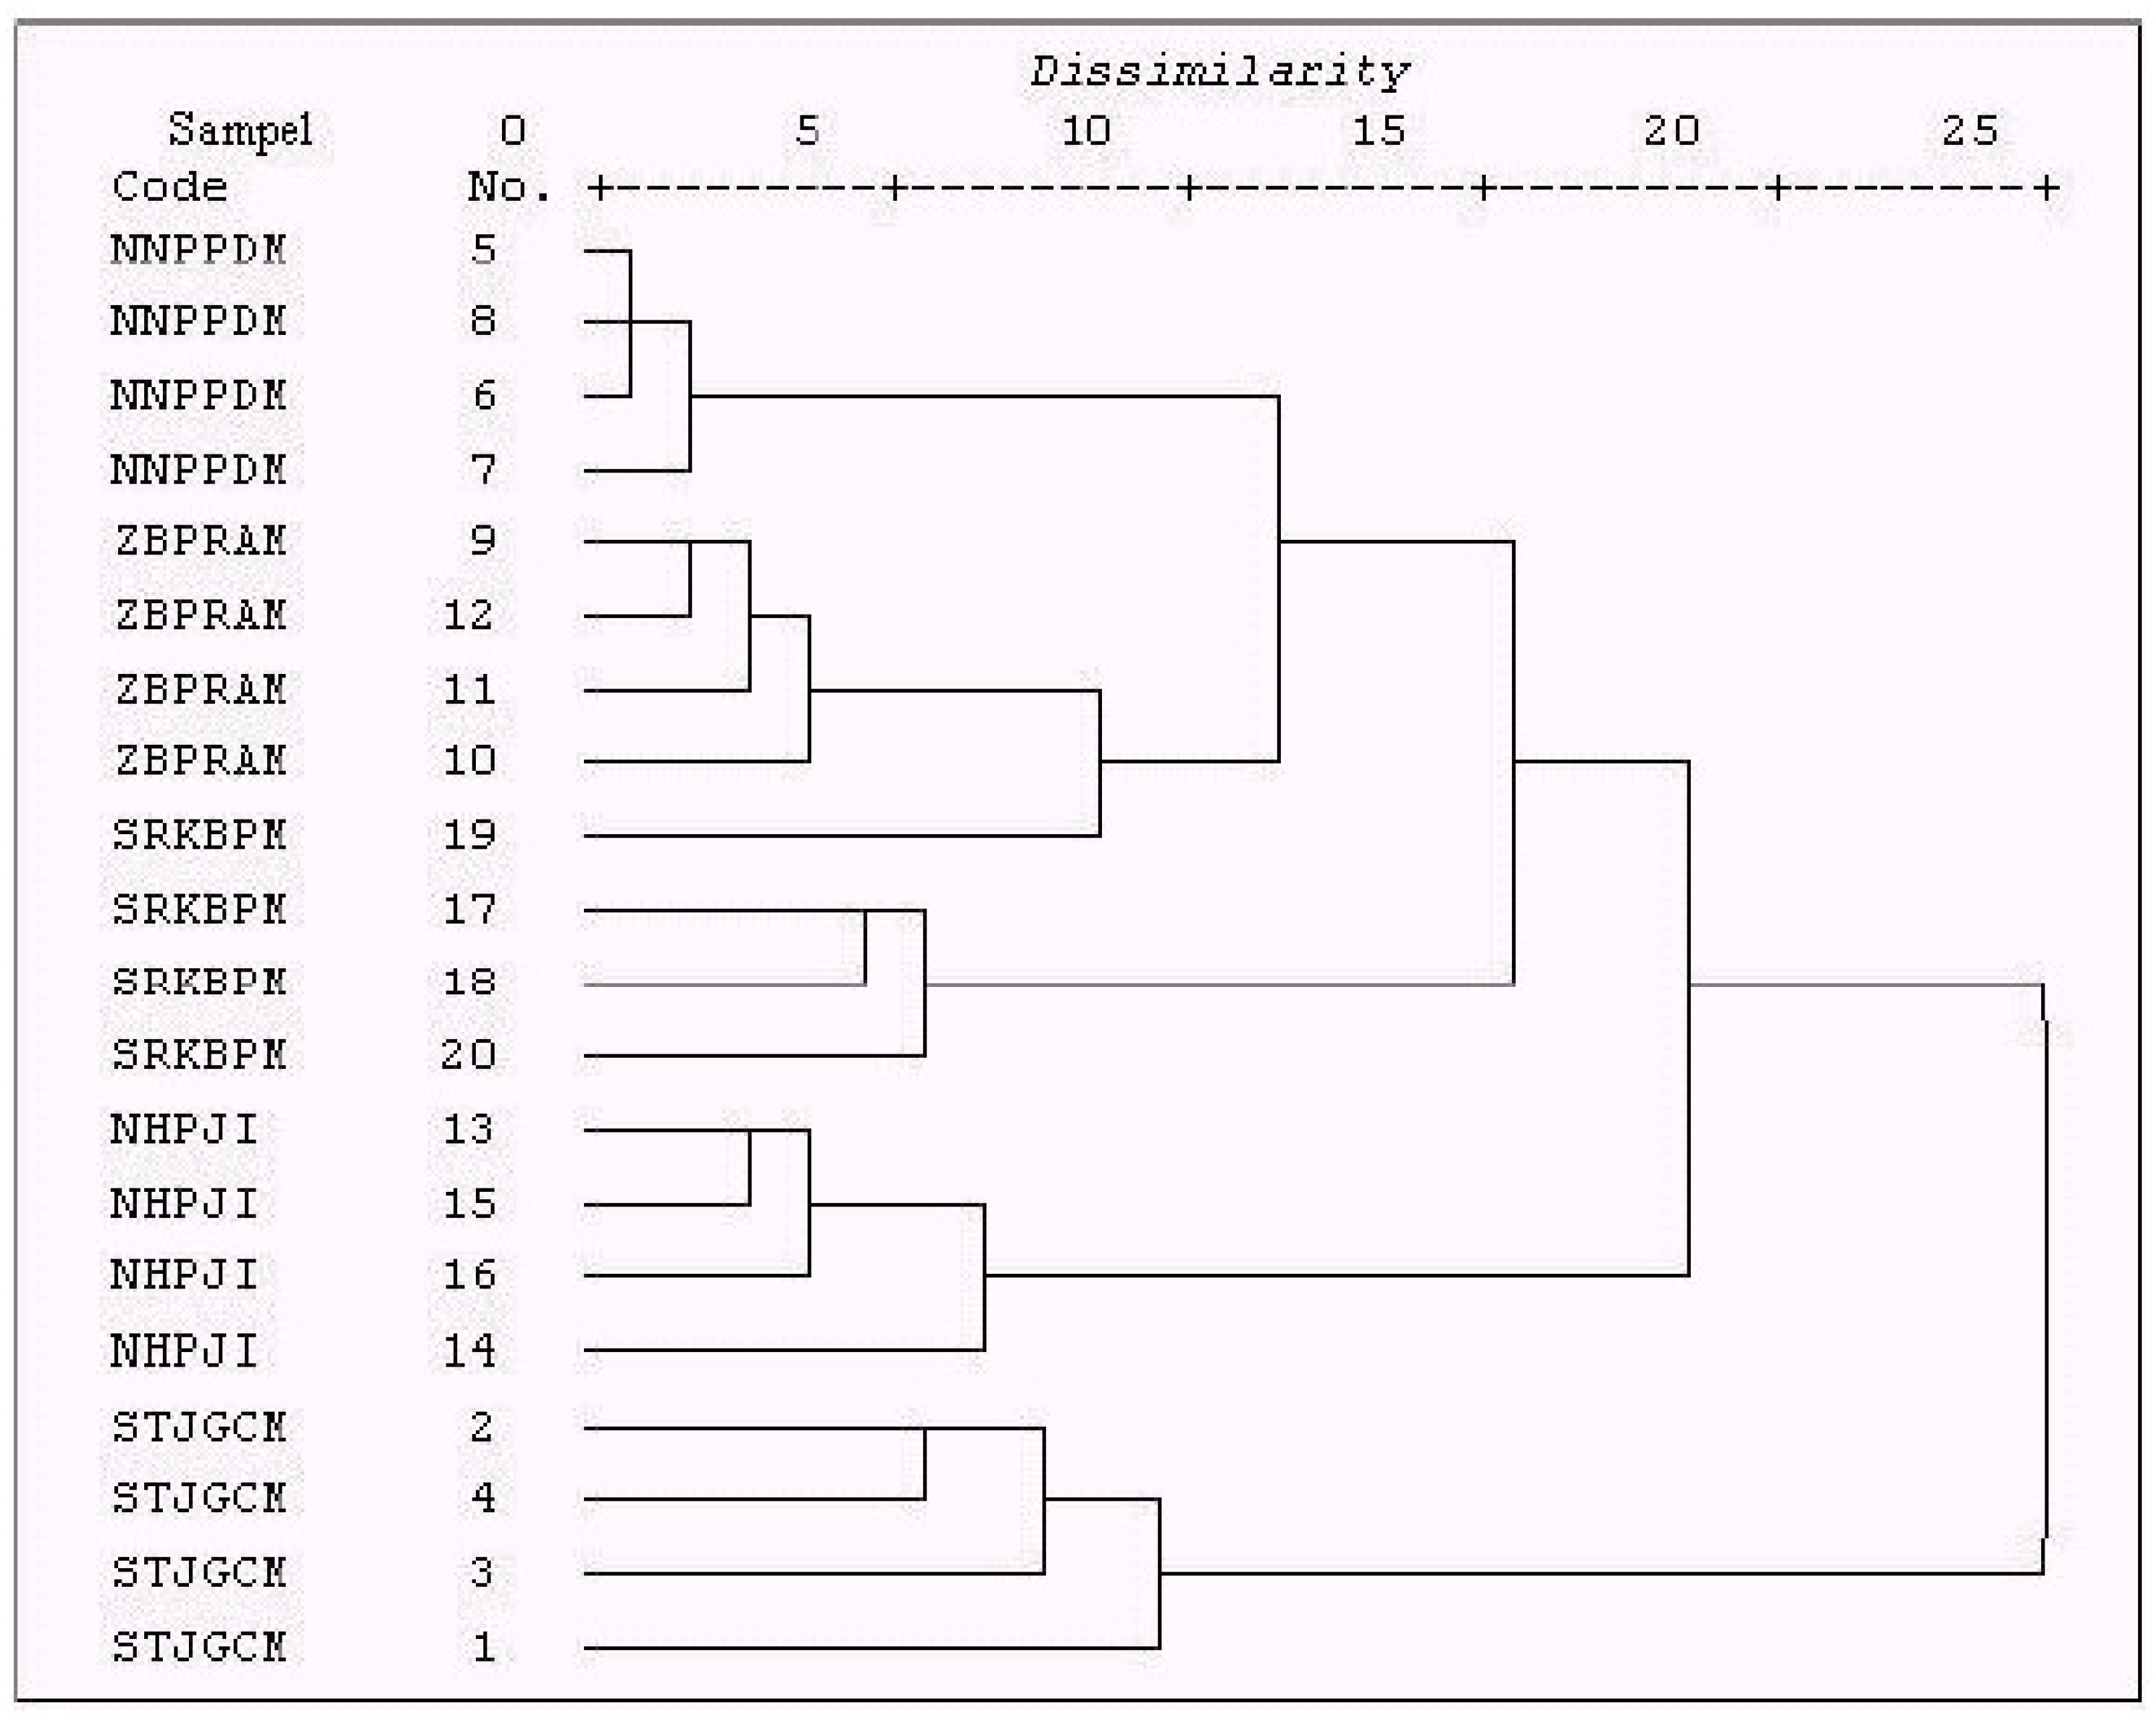
Chemometrics classification
Data pretreatment
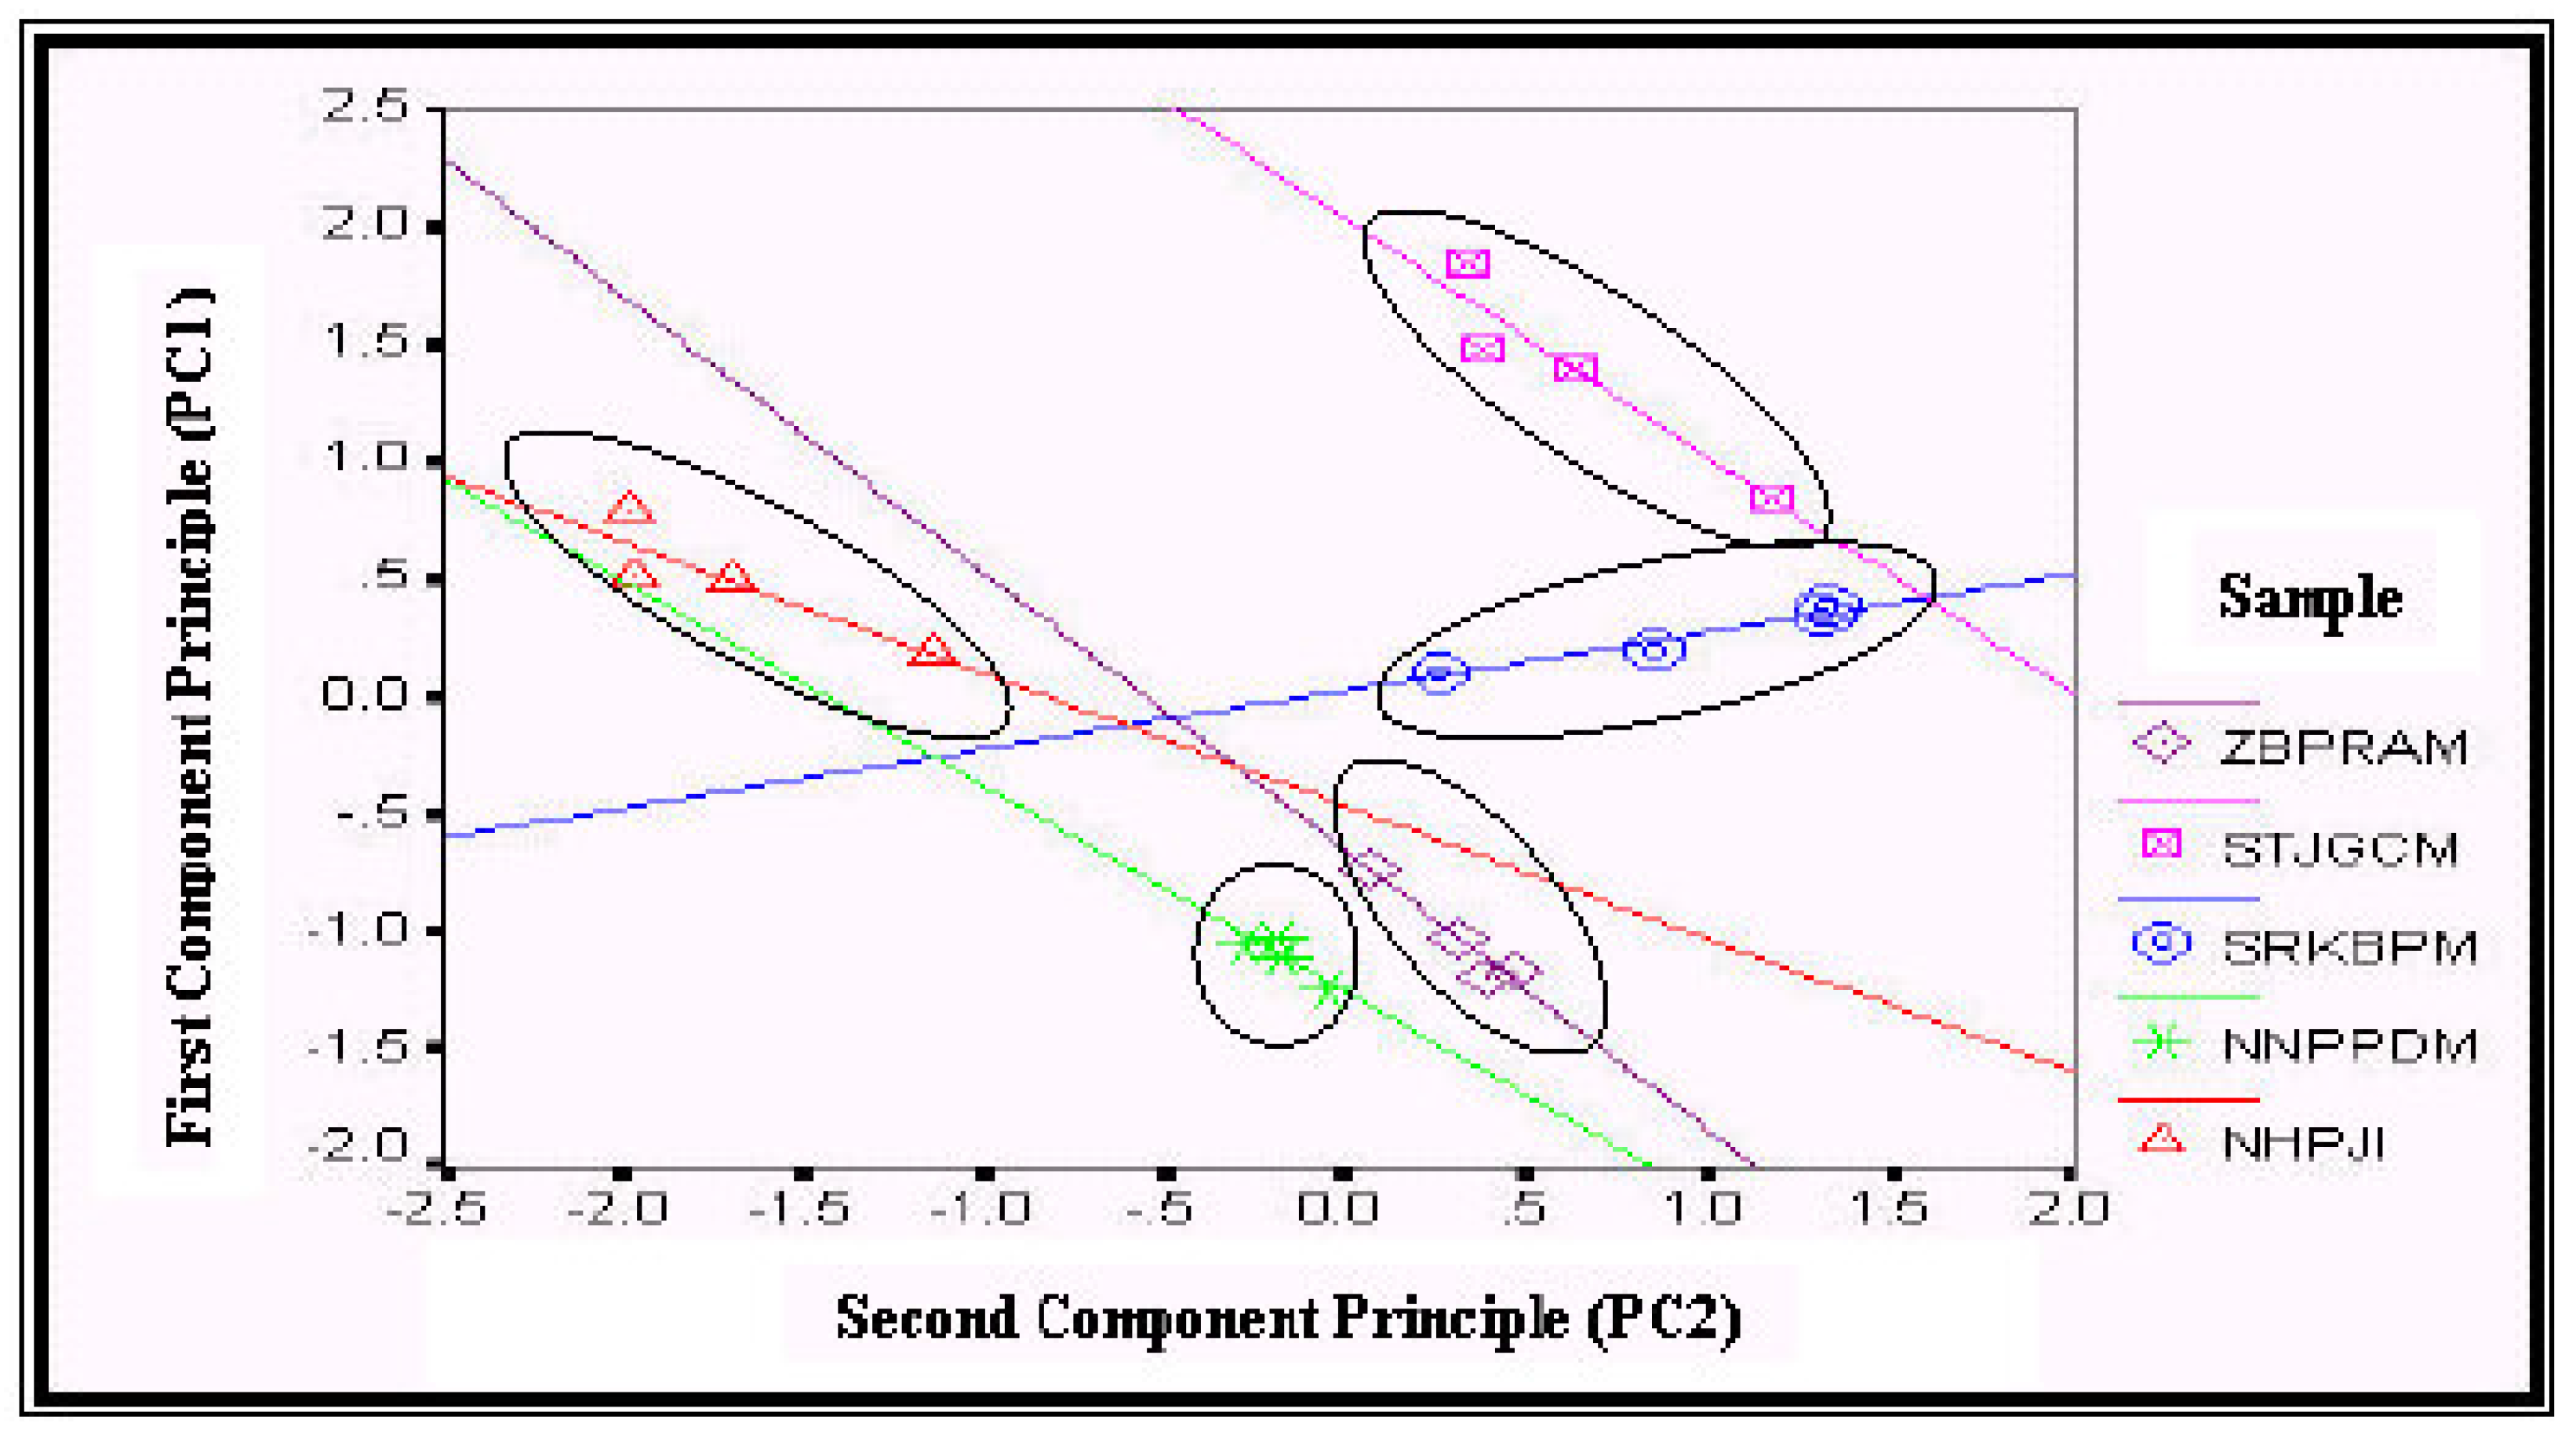
Principal component analysis (PCA)
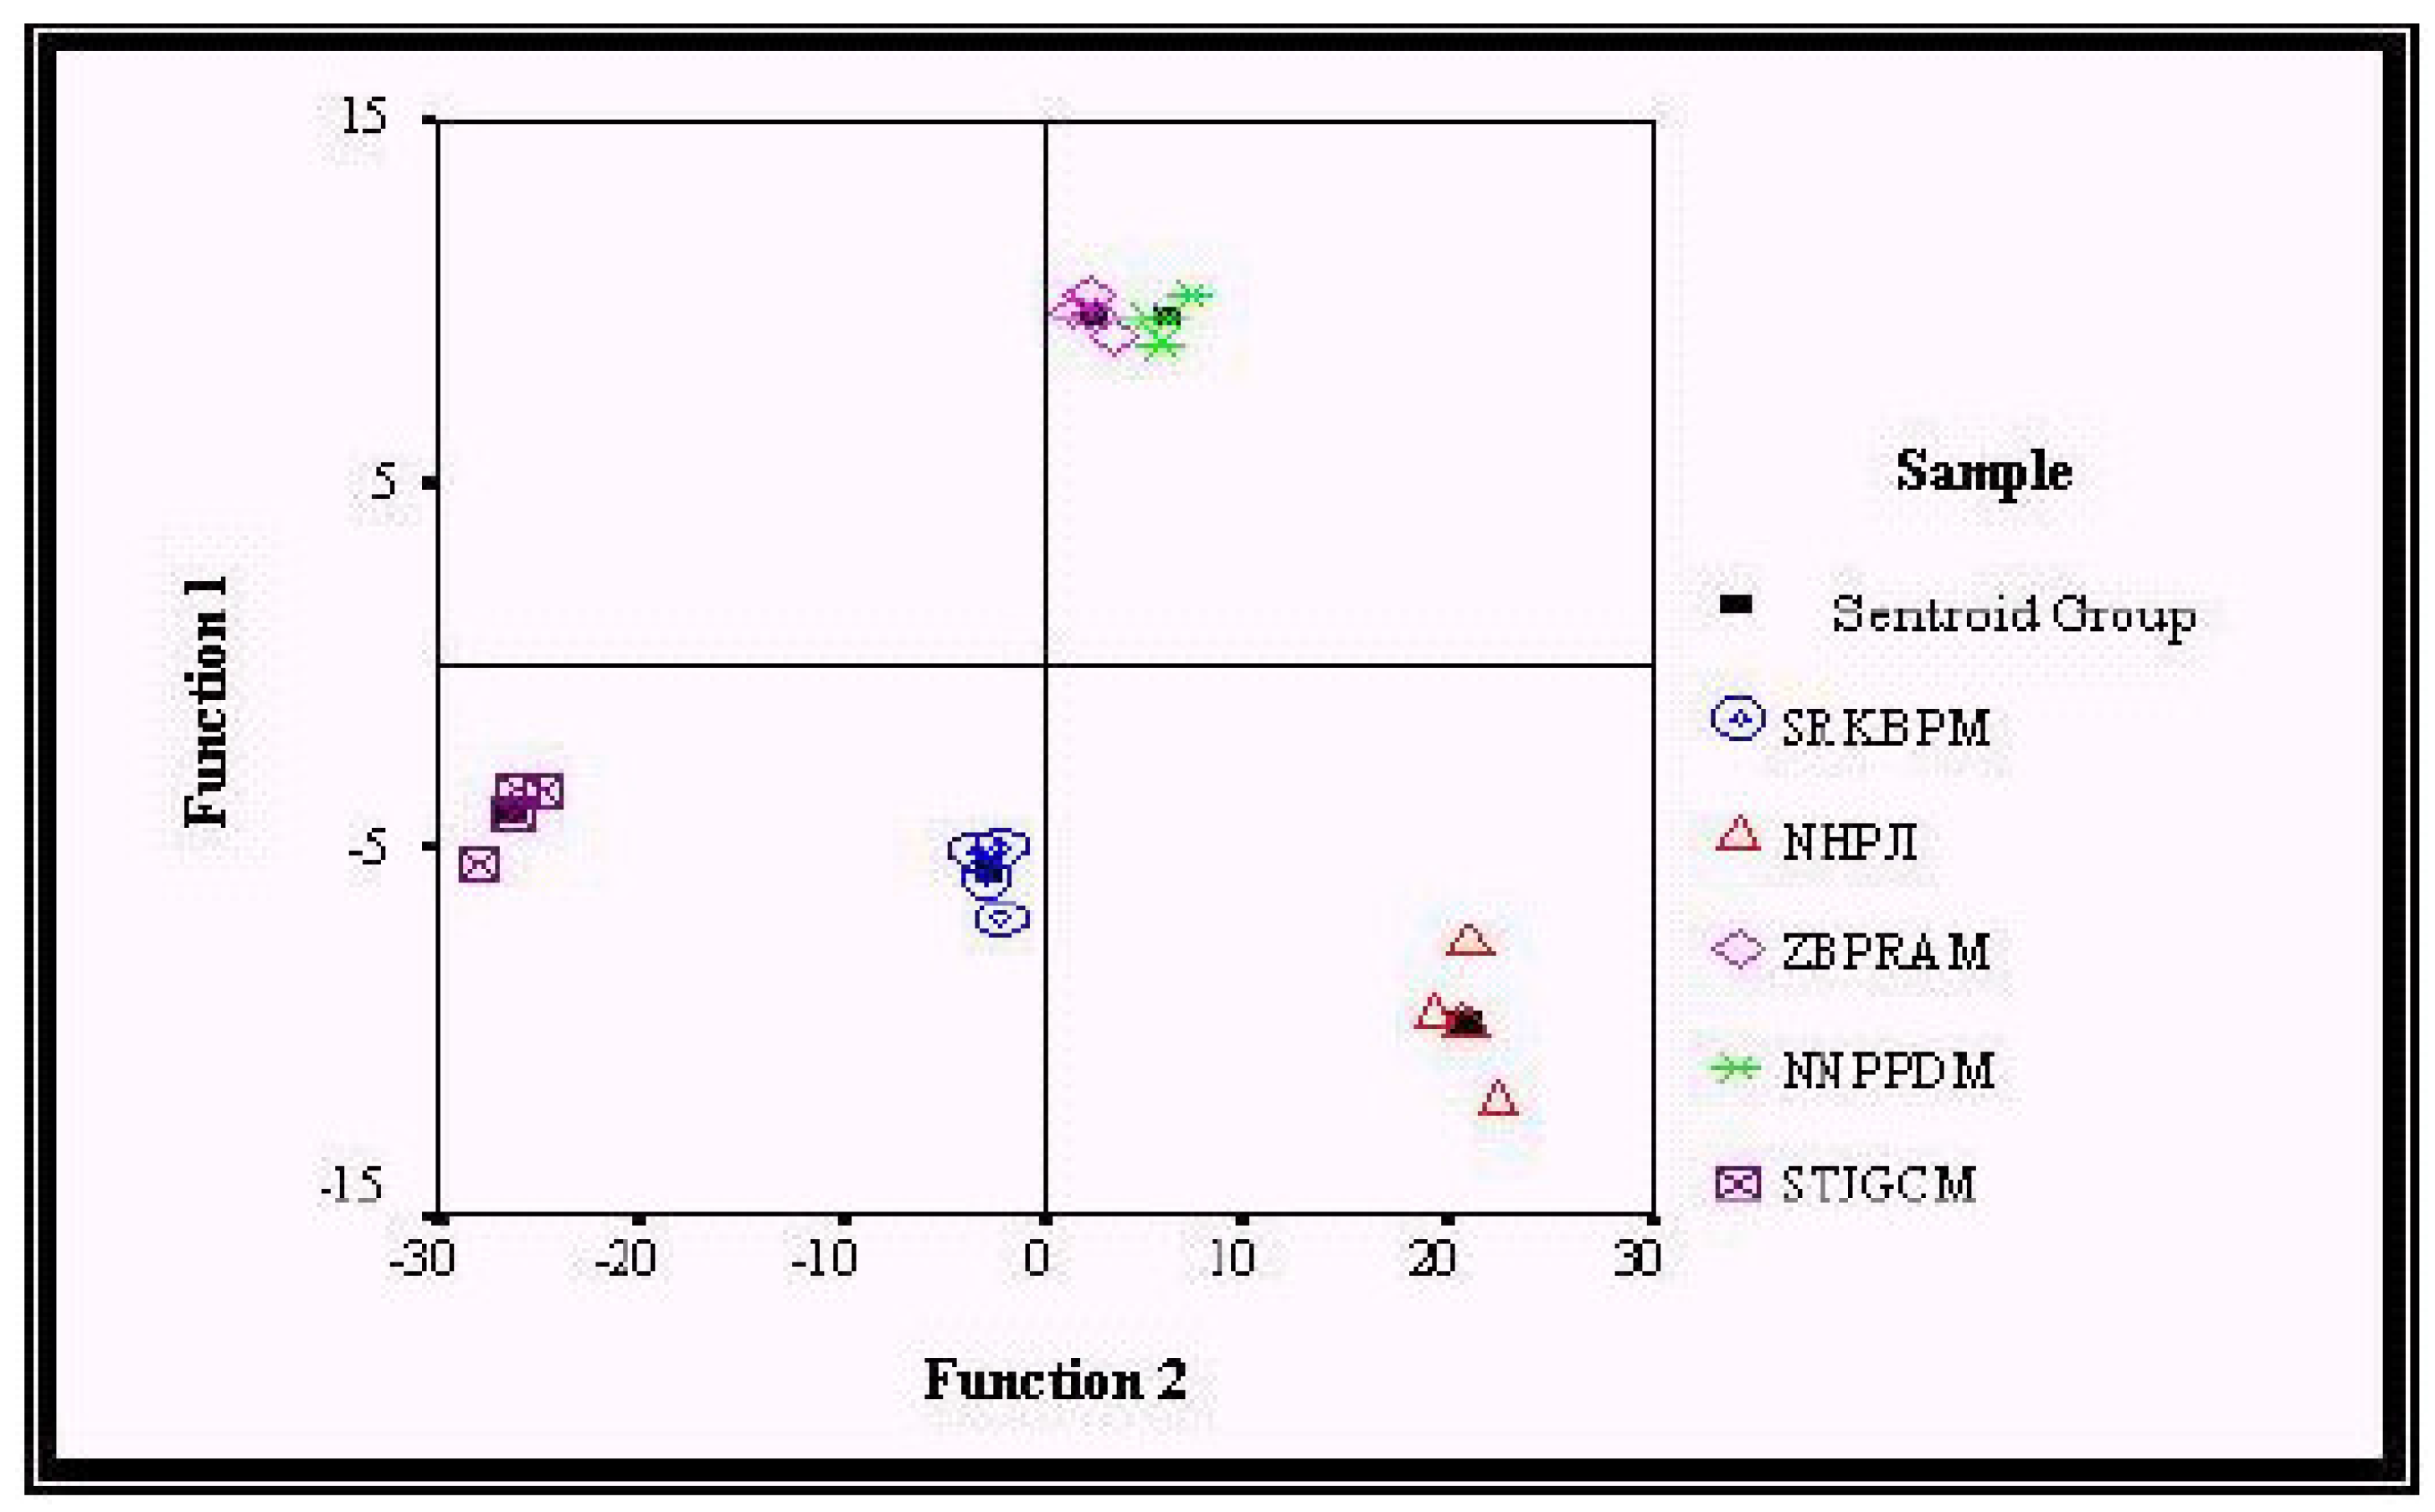
Linear discriminant analysis (LDA)
Cluster analysis (CA)
Conclusion

Acknowledgments
References
- Sumaryono, W.; Proksch, P.; Wray, V.; Witte, L.; Hartmann, T. Planta Med. 1991, 57, 176–180. [CrossRef] [PubMed]
- WHO Regional Office for the Western Pacific Manila and Institute of Material Hanoi. Medicinal Plants in Vietnam; Science and Technology Publishing House: Hanoi, 1990; p. 271. [Google Scholar]
- Ahmad, M.N.; Zaihidee, E.M.; Chew, O.S.; Othman, A.R.; Ismail, Z.; Hitam, M.S.; Md Shakaff, A.Y. Chemometric Classification of Herb – Orthosiphon Stamineus (Cat Whisker’s) According to Geographical Origin Using a New Chemical Sensor Based on a Fast GC. In The 1st International Meeting On Microsensors & Microsystems, National Cheng Kung University, Tainan, Taiwan, 12–14 January 2003.
- Van deer Veen, X.; Makubard, Th.M.; Zwazing, J.H. Pharmaceutisch Weekblad 1979, 114, 965.
- Schmidt, S.; Bos, R. Volatile Of Orthosiphon stamieus Benth, Progress in Essential Oil Research. Walter de Gruyter & Co., Berlin: New York, 1986; pp. 93–97. [Google Scholar]
- Masuda, T.; Masuda, K.; Nobuji, N. Orthosiphol A, A Highly Oxygenated Diterpene From The Orthosiphon stamineus. Tetrahedron Letter 1992, 33(7), 945–946. [Google Scholar]
- Pavious, Stampoulis; Tezuka, Y.; Arjun, H.B.; Kim, Q.T.; Saiki, I.; Kadata, S. Staminol A, A Novel Diterpene From Orthosiphon stamineus. Tetrahedron Letter 1999, 40, 4239–4242. [Google Scholar]
- Suresh, Awale; Tezuka, Y.; Banskota, H.B.; Shimoji, S.; Taira, K.; Kodata, S. Secoorthosiphols AC: Three Highly Oxygenated Secoisopimarane-type Diterpenes From Orthosiphon stamineus. Tetrahedron Letter 2002, 43, 1473–1475. [Google Scholar]
- Suresh, Awale; Tezuka, Y.; Banskota, H.B.; Shimoji, S.; Taira, K.; Kodata, S. Norstamine and Isopimarane-type Diterpene Of Orthosiphon stamineus From Okinawa. Tetrahedron 2002, 58, 5503–5512. [Google Scholar]
- Suresh, Awale; Tezuka, Y.; Banskota, H.B.; Kodata, S. Siphonols A-E: Novel Nitric Oxide Inhibitors From Orthosiphon stamineus Of Indonesia. Bioorganic & Medicinal Chemistry Letters 2003, 13, 31–35. [Google Scholar]
- Gardner, J.W.; Bartlett, P.N. Electronic Noses: Principle and Applications. Oxford University Press: New York, 1999. [Google Scholar]
- Nagle, H.T.; Schiffman, S.; Gutierrez-Osuna, R. The How and Why of Electronic Noses. IEEE Spectrum 1998, 22–34. [Google Scholar]
- Staples, E.J.; Matsura, T.; Viswanathan, S. Real Time Environmental Screening Of Air, Water And Soil Matrices Using A Novel Field Portable GC/SAW System. In Environmental Strategies for the 21st Century, Asia acific Conference, Singapore, 8–10 April 1998.
- Massart, D.L.; Vandeginste, B.G.M.; Deming, S.N.; Michotte, Y.; Kaufman, L. Chemometrics: A Textbook; Vol 2, Elsevier: Amsterdam, 1998. [Google Scholar]
- Aboul-Enein, H.Y.; Stefcin, R.; Baiulesscu, G. Quality & Reliability in Analytical Chemistry; CRC Press UC, 2000; pp. 49–53. [Google Scholar]
- Sample Availability: Available from the authors.
© 2003 by MDPI (http://www.mdpi.org). Reproduction is permitted for noncommercial purposes.
Share and Cite
Sim, C.O.; Ahmad, M.N.; Ismail, Z.; Othman, A.R.; Noor, N.A.M.; Zaihidee, E.M. Chemometric Classification of Herb – Orthosiphon stamineus According to Its Geographical Origin Using Virtual Chemical Sensor Based Upon Fast GC. Sensors 2003, 3, 458-471. https://doi.org/10.3390/s31000458
Sim CO, Ahmad MN, Ismail Z, Othman AR, Noor NAM, Zaihidee EM. Chemometric Classification of Herb – Orthosiphon stamineus According to Its Geographical Origin Using Virtual Chemical Sensor Based Upon Fast GC. Sensors. 2003; 3(10):458-471. https://doi.org/10.3390/s31000458
Chicago/Turabian StyleSim, Chew Oon, Mohd Noor Ahmad, Zhari Ismail, Abdul Rahman Othman, Nor Amin Mohd Noor, and Ezrinda Mohd Zaihidee. 2003. "Chemometric Classification of Herb – Orthosiphon stamineus According to Its Geographical Origin Using Virtual Chemical Sensor Based Upon Fast GC" Sensors 3, no. 10: 458-471. https://doi.org/10.3390/s31000458